practical measurement of affordability: an application to ... · that a household chooses the...
TRANSCRIPT

Bull World Health Organ 2012;90:219–227 | doi:10.2471/BLT.10.084087
Research
219
Practical measurement of affordability: an application to medicinesLM Niëns,a E Van de Poel,a A Cameron,b M Ewen,c R Laingb & WBF Brouwera
IntroductionAffordability is not an unequivocal concept; Bradley1 calls it vague, and Whitehead,2 Milne3 and Komives et al.4 deny that it has a clear basis in economic theory. The theory assumes that a household chooses the bundle of goods and services that maximizes utility – i.e. the benefit derived per money spent – subject to its preferences and budget. Clearly, different preferences lead to different choices on how much to spend on a particular commodity. The definition of what constitutes an “affordable” price is thus a normative one that, according to some, lacks an economic foundation.5 A commodity is obviously unaffordable if it costs more than what is in the full (potential) budget, but such a definition is overly restrictive.
According to Maclennan & Williams, affordability has to do with securing a standard of living (e.g. housing, education or transport) at a price that “does not impose, in the eyes of a third party (usually government), an unreasonable burden on household incomes”.6 To operationalize the concept of affordability, one therefore needs: (i) information on house-hold incomes; (ii) knowledge of the price of the commodity in question, and (iii) a definition of “unreasonable burden”. This highlights two problems related to measuring unafford-ability. First, there is arbitrariness in defining “an unreasonable burden”. Previous work has identified two ways to define this unreasonable burden: (i) the so-called catastrophic payment method, which is based upon the ratio of the payment for a particular commodity to a household’s total resources, and (ii) the impoverishment method, which looks at a household’s residual income after paying for a good.2,5–8 The second prob-lem is that to measure affordability in practice requires a large amount of household level data that is often difficult to access, only available for certain years, not comparable across different time periods or countries, or simply lacking.
To address the second problem while simultaneously acknowledging the first, in this paper we apply the impover-ishment and catastrophic payment methods in a manner that can be applied to a broad range of commodities when micro data are scarce. We do this by applying these methods using widely available aggregate data, which makes for easy imple-mentation and comparison across countries. We explore their use in elucidating the affordability of medicines, a commodity critically related to affordability. Indeed, in the developing world, medicines account for a substantial part of health-care costs.9–12 Since most of the population in many low-income countries lacks health insurance,13 medicines have to be paid for out-of-pocket when people fall ill. If their prices are too high, people are unable to procure them and often forego treatment altogether or get into debt.14 It is therefore important to examine and compare the affordability of medicines across countries in the developing world and to monitor the impact of interventions seeking to improve it.
Measuring affordability
As explained before, two approaches are generally used to estimate affordability. One relies on the ratio of expenditures to total household resources, whereas the second focuses on the residual income after an expenditure. Under the first approach, the payment for a commodity is deemed “catastrophic” (unaf-fordable) when it exceeds a certain proportion of a household’s resources. The idea is that if a household spends a large fraction of its available budget on a specific item, it will have to reduce its consumption of other goods and services. The affordability threshold is subjective.4,5,15 Studies of this approach, which have focused primarily on the affordability of transportation,8 education,16 health care15,17 and utilities such as energy and wa-ter,18,19 define the affordability of a commodity in terms of the share of available resources that it consumes. Since spending
Objective To develop two practical methods for measuring the affordability of medicines in developing countries.Methods The proposed methods – catastrophic and impoverishment methods – rely on easily accessible aggregated expenditure data and take into account a country’s income distribution and absolute level of income. The catastrophic method quantifies the proportion of the population whose resources would be catastrophically reduced by spending on a given medicine; the impoverishment method estimates the proportion of the population that would be pushed below the poverty line by procuring a given medicine. These methods are illustrated by calculating the affordability of glibenclamide, an antidiabetic drug, in India and Indonesia. The results were validated by comparing them with the results obtained by using household micro data for India and Indonesia.Findings When accurate aggregate data are available, the proposed methods offer a practical way to obtain informative and accurate estimates of affordability. Their results are very similar to those obtained with household micro data analysis and are easily compared across countries. Conclusion The catastrophic and impoverishment methods, based on macro data, can provide a suitable estimate of medicine affordability when the household level micro data needed to carry out more sophisticated studies are not available. Their usefulness depends on the availability of accurate aggregated data.
a Institute for Health Policy & Management, Erasmus University, PO Box 1738, 3000 DR Rotterdam, Netherlands.b Essential Medicines and Pharmaceutical Policies, World Health Organization, Geneva, Switzerland.c Health Action International Global, Amsterdam, Netherlands.Correspondence to LM Niëns (e-mail: [email protected]).(Submitted: 3 November 2010 – Revised version received: 9 September 2011 – Accepted: 25 November 2011 – Published online: 27 January 2012 )

Bull World Health Organ 2012;90:219–227 | doi:10.2471/BLT.10.084087220
ResearchMeasuring medicine affordability LM Niëns et al.
even a small share of the budget can have catastrophic consequences for very poor individuals, it makes sense to define af-fordability in terms of the share of the budget that is left after spending on basic necessities (usually food). The latter has been referred to as “nondiscretionary expenditure” or “capacity to pay”.15,17
The second or “impoverishment” method considers the absolute quantity of available resources before and after payment for a commodity. If the house-hold is initially above the poverty line but drops below it after paying for the commodity, it can be said to have been “impoverished” by the payment.7,15,17,20 This approach has been commonly used to study housing affordability5,7 and has also been applied to health care.15,17 Niëns et al. have recently calculated the affordability of medicines in 16 low- and middle-income countries using this im-poverishment method.21 The method is clearly more specifically focused on the poor within society, as the closer you are to the poverty line, the more likely it is that certain expenditures will push you below it.
The methods as operationalized by Xu et al.15 and van Doorslaer et al.,11 while theoretically optimal, may be dif-ficult to apply in practice, especially in low- and middle-income countries, be-cause they are relatively data intensive. This is particularly so if the goal is to monitor outcomes over time and make cross-country comparisons. Compari-sons across countries and over time are further complicated by the fact that in-dividual household surveys suffer from methodological heterogeneity.
Aware of the problems inherent in measuring affordability, the World Health Organization (WHO) and Health Action International (HAI) have used the wage of the lowest paid unskilled government worker (LPGW) to calculate the affordability of medi-cines.12,22 Such affordability has been expressed in terms of the number of days the LPGW has to work to be able to pay for a course of treatment with a particular drug. This LPGW-based metric is easy to apply and to under-stand; people in any country can eas-ily position themselves relative to the LPGW. However, this metric may over-estimate the affordability of medicines because a substantial proportion of the population in some countries earns less than the LPGW.12,21,23 Furthermore, the
number of days of LPGW wages that makes something unaffordable is not clearly determined; this income metric is used only by WHO/HAI and no refer-ence standards are available in the liter-ature. As a result, the quest for a feasible way of applying the catastrophic and impoverishment methods in data-poor countries is amply justified.
In the remainder of this paper, we explain the methodological details of a less data-demanding and easily applica-ble operationalization of the catastrophic and impoverishment methods, and we illustrate them by calculating the afford-ability of glibenclamide, a drug for dia-betes. For this purpose we have used data from a price survey undertaken with the WHO/HAI price measurement tool in India and Indonesia.22 We then compare the results of applying this method with the results of theoretically similar calcu-lations using household data.
MethodsThroughout this paper we refer to household level data as micro data and to aggregated data as macro data. The methods proposed in this paper only re-quire aggregated data and are therefore referred to as macro methods, whereas methods typically calling for micro data are referred to as micro methods. To check the sensitivity of our proposed method to using different data, we pro-duce results for several combinations of data and methods.
Micro and macro methods
O’Donnell et al. elaborately explain how to calculate impoverishment and catastrophic spending at the household level using micro data.24 Other applica-tions can be found in van Doorslaer et al.,11 Xu,15 Wagstaff & van Doorslaer17 and Russell.25
The method for calculating medi-cine affordability that we propose in this paper requires a knowledge of four com-ponents: (i) the price of (treatment with) a given medicine (P) (ii) a country’s total population (Pop); (iii) the aggre-gate income level of a country (Y); and (iv) the proportion of the total income earned across income groups (D) within a country. The last three components are first combined to draw an income distribution that plots the average daily income for each income group. Fig. 1 shows an example of such a distribution. The x-axis ranks the total population (Pop) by increasing income (income groups D1 to D7), whereas the y-axis plots the average daily incomes (groups Y1 to Y7). Because aggregated data are usually available for up to seven income groups, the explanation of our methods is based on this number, but the methods can be applied to more groups.
Since we have no information on how income is distributed within each income group, we assume linearity and plot the average income of each group at the midpoint, i.e. we assume that the mean and median incomes in each income group coincide. For example,
Fig. 1. Distribution of average daily per capita income across income groups in Indonesia (2005)
A B CD
E
F
G
PL
Y7
Y6
Y5
Y3
Y2
Y4
Y1Av
erag
e dai
ly p
er ca
pita
inco
me
D1 D2 D3 D4 D5 D6 D7Proportion of the population ranked by income
PL, poverty line.Note: The x-axis ranks the total population by increasing income (income groups D1 to D7), whereas the y-axis plots the average daily incomes (groups Y1 to Y7).

Bull World Health Organ 2012;90:219–227 | doi:10.2471/BLT.10.084087 221
ResearchMeasuring medicine affordabilityLM Niëns et al.
for the income group between the 40th and 60th percentiles we plot the average income on the 50th percentile. This is clearly a simplification. In reality, the income distribution within each income group is likely to be skewed because most people in the group probably earn less than the average. This means that we are likely to overestimate the average income for each income group and therefore to underestimate the af-fordability of the medicine later on in the analysis.
The impoverishment approach
This method aims to compare the pro-portion of the population below the poverty line (PL) before (Ipre) and after (Ipost) the hypothetical procurement of a medicine. Assume that line PL in Fig. 1 represents the poverty line in a specific country. To calculate the proportion of the population living below this line, we focus on the income distribution between two income points, one just below and the other just above the poverty line, in this case A and B. With the coordinates of these points known, i.e. for A, (D1,Y1); for B, (D2,Y2), we can calculate the linear function of the (thick black) line going through A and B:
YY YD D
D C=−−
+2 1
2 1 (1)
which allows us to estimate the propor-tion of the population living below the poverty line (Ipre).
To estimate the proportion of the population below the poverty line after purchasing a medicine, Ipost, we assume a parallel shift downwards of the linear function equal to the medicine price P. Equation 1 then changes into:
YY YD D
D C P=−−
+ −2 1
2 1
′
(2)
Again, substituting Y ′ by PL in this Equation 2 gives us Ipost, the proportion of the population in poverty after pro-curement of the medicine. The differ-ence in the proportion of the population below the PL before and after paying P, Ipost − Ipre, gives the proportion of the population that would be impoverished
if everyone had to buy a medicine cost-ing P. For the percentage of the popula-tion represented by Ipost, the medicine is deemed unaffordable.
The catastrophic approach
In the existing literature, total health care expenditures are usually consid-ered catastrophic if they exceed 10% of a household’s total spending or 40% of non-food spending.15,17,24,26–28
In developing countries, such as India and Indonesia, medicines make up a relatively large portion (20–70%) of total health expenditure and are paid largely out-of-pocket.9–11 According to data from WHO’s 2003 World Health Survey for India, drug spending in the country accounts for about 44% of all out-of-pocket spend-ing on health. Low health insurance coverage in Indonesia (26.1% in 2007) and India (approx 20%) indicate that most spending on medicines is paid for out-of-pocket.29,30
Hence, to calculate the afford-ability of medicines we propose using a threshold that is roughly half the threshold generally used when calculat-ing total health care expenditure (i.e. 5% instead of 10%). However, the method can obviously accommodate different percentages.
The proportion of the population for which purchasing a medicine costing P is catastrophic is again calculated from Fig. 1. At a 5% catastrophic threshold, the medicine with price P is unaffordable for people earning less than 20 times P. This proportion is again calculated by drawing a line between the points for average income that include 20P. By substituting Y by 20P in Equation 1, we get the proportion of the population ex-posed to catastrophic expenditure, Xcat.
Data sources
We obtained medicine prices from the WHO/HAI database, which lists median treatment prices for a large range of medicines. WHO/HAI collects medi-cine prices from five medicine outlets per sector in at least four geographic or administrative regions in a given survey area. For each medicine, prices are col-lected for both the originator brand and the lowest-priced generic equivalents in the private and public sectors. We use private sector prices because drug avail-ability in the public sector is low and the data are often insufficient to make reliable price estimates.12,21
In our examples we use the price of 5 mg capsules/tablets of the lowest-priced generic (LPG) glibenclamide in India (April 2003–January 2005) and Indonesia (August 2004) and assume the standard treatment regimen of 2 tablets a day. We chose these two countries be-cause of the availability of micro, macro and medicine price data. We selected glibenclamide because in India and Indonesia diabetes affects 6.9 million and 50.7 million people (4.6% and 7.1% prevalence, respectively).31
When the lowest-priced generic equivalent of glibenclamide is procured in the Indonesian private sector, the median price of treatment with the drug is 417 Indonesian rupiah (IDR) a day. For India, seven WHO/HAI surveys are available, and each covers a state or part of a state. As the price of LPG glibenclamide in the private sector var-ies little (between 1.28 and 1.60 Indian rupees (INR) a day) and given the aim of this paper, we work with the average price of LPG glibenclamide over the seven surveys, i.e. INR 1.40.
The aggregate income level (Y) and income distribution of India and Indonesia are retrieved from the World Bank’s World Development Indicators (WDIs). Gross domestic product (GDP) per capita is often used as a proxy for people’s actual incomes. However, a country’s GDP consists of consumption, gross investment, government spending and net trade. For this study the main interest lies in consumption, since it reflects the amount of money people can actually spend. Therefore, house-hold final consumption expenditure as provided in the WDIs, is used. This is in line with micro-level analysis, in which expenditure data are usually preferred to income data because the former are believed to better reflect household resources in developing countries.24 As for income distribution D, the WDIs provide the percentage of total income earned in seven income groups: five quintiles, with the upper and lower quintiles split into two deciles each.
We use the 2005 PL thresholds of 1.25 and 2.00 United States dollars (US$) a day, as suggested by the World Bank.32,33 We convert the PL thresholds to 2005 Indonesian rupiahs (IDR 4917 and IDR 7869) and 2000 Indian rupees (INR 18.20 and INR 29.12) with con-version factors from the World Bank International Comparison Program.34 We perform all calculations of Ipre,

Bull World Health Organ 2012;90:219–227 | doi:10.2471/BLT.10.084087222
ResearchMeasuring medicine affordability LM Niëns et al.
Ipost − Ipre and Xcat in local currency units, but we express all prices and amounts in this paper in 2005 purchasing power parity US$.
To check the robustness of our results, we also calculate the afford-ability of LPG glibenclamide using micro data from the 2005 wave of the Indonesian National Socioeconomic Survey (Susenas) (n = 7302 households) and the Indian National Sample Survey (NSS) data set from 2000 (round 55) (n = 93 854 households). These surveys collect information on total household expenditures through an extensive expenditure module in the household survey.35,36
ResultsMicro data
Table 1 shows the results of the calcula-tions based on micro data. In Indonesia the proportions of the population living below the US$ 1.25 and US$ 2.00 PLs
(Ipre) are 28.8% and 61.7%, respectively. The proportions of the population at risk of being impoverished by procuring LPG glibenclamide (Ipost − Ipre) are 5.8% and 3.7%, respectively. The catastrophic approach shows the proportion at risk of being confronted with catastrophic expenditures (Xcat) to be 65.9%.
In India, the proportion of people living below the US$ 1.25 and US$ 2.00 PLs (Ipre) is 53.0% and 80.4%, respective-ly. The impoverishment rates (Ipost − Ipre) in the country are 5.1% and 1.9%, and the proportion of the population at risk of catastrophic payments (Xcat) is 78.6%.
Macro data
Table 2 shows the results of using the aggregate income, as measured by the household final consumption ex-penditure (Y), the proportion of total income earned across income groups (D) and the total population (Pop) to calculate the daily average income per capita for each income group in India and Indonesia.
Dividing Y by Pop to derive per capita income estimates relies on the assumption that the average household size is constant across income groups. Since poorer households are typically larger,37 the average income per capita is likely to be overestimated in the lower income distribution ranges, which should make our affordability estimates conservative.
In Indonesia, the daily cost of the standard treatment with LPG glibenclamide is US$ 0.11, so indi-viduals earning between US$ 1.25 and US$ 1 .35 and between IDR US$ 2.00 and US$ 2.10 are at risk of being pushed below the US$ 1.25 and US$ 2.00 PLs, respectively, should they have to buy glibenclamide. In India, where the cost of LPG glibenclamide is US$ 0.10, the individuals at risk of being pushed below the US$ 1.25 and US$ 2.00 PLs are those whose income ranges between US$ 1.25 and US$ 1.34 and between US$ 2.00 and US$ 2.09, respectively.
Table 1. Percentage of population impoverished or at risk of incurring catastrophic expenditure by purchasing treatment with lowest-priced generic equivalent of glibenclamide, by micro method using micro data for India and Indonesia
Country (source) Population (%) below PL before medicine purchase (Ipre)
Population (%) impoverished by medicine purchase (Ipost − Ipre)a
Catastrophic expenditure (Xcat)
b
< US$ 1.25c PL < US$ 2.00c PL < US$ 1.25c PL < US$ 2.00c PL
Indonesia (WDI 2005) 28.8 61.7 5.8 3.7 65.9India (WDI 2000) 53.0 80.4 5.1 1.9 78.6
Ipost, percentage of the population below the poverty line (PL) after expenditure; Ipre, percentage of the population below the PL before expenditure; WDI, world development indicators (World Bank); Xcat, percentage of the population at risk of incurring a catastrophic expenditure at a threshold of 5% of per capita household expenditures.a Impoverishment method.b Catastrophic expenditure method.c Purchasing power parity United States dollars (2005).
Table 2. Use of aggregated incomea and population data to calculate average daily income per capita (IPC) in specific income groups in India and Indonesia
Cumulative % of populationb
Income group India (WDI 2000) Indonesia (WDI 2005)
Income distribution (%)
Average daily IPC (INRc)
Income distribution (%)
Average daily IPC (IDRd)
D1 0–10 Poorest 10% 3.64 13.21 3.00 6 649D2 10–20 Second poorest 10% 4.44 16.11 4.15 9 209D3 20–40 Second 20% 11.27 20.45 10.74 11 914D4 40–60 Third 20% 14.94 27.11 14.38 15 949D5 60–80 Fourth 20% 20.37 36.96 20.45 22 683D6 80–90 Second richest 10% 14.21 51.56 14.96 33 172D7 90–100 Richest 10% 31.13 112.96 32.32 71 679
IDR, Indonesian rupiah; INR, Indian rupee; WDI, world development indicators (World Bank).a In 2005 purchasing power parity United States dollars, aggregate income level (Y) for Indonesia is $425 869 484 516; Y for India is $1 046 538 703 424.b Population of India in 2000: 1 015 923 000; population of Indonesia in 2005: 220 558 000.c 1 US$ = 3934 INR.d 1 US$ = 14.56 IDR.
Bull World Health Organ 2012;90:219–227 | doi:10.2471/BLT.10.084087 223
ResearchMeasuring medicine affordabilityLM Niëns et al.
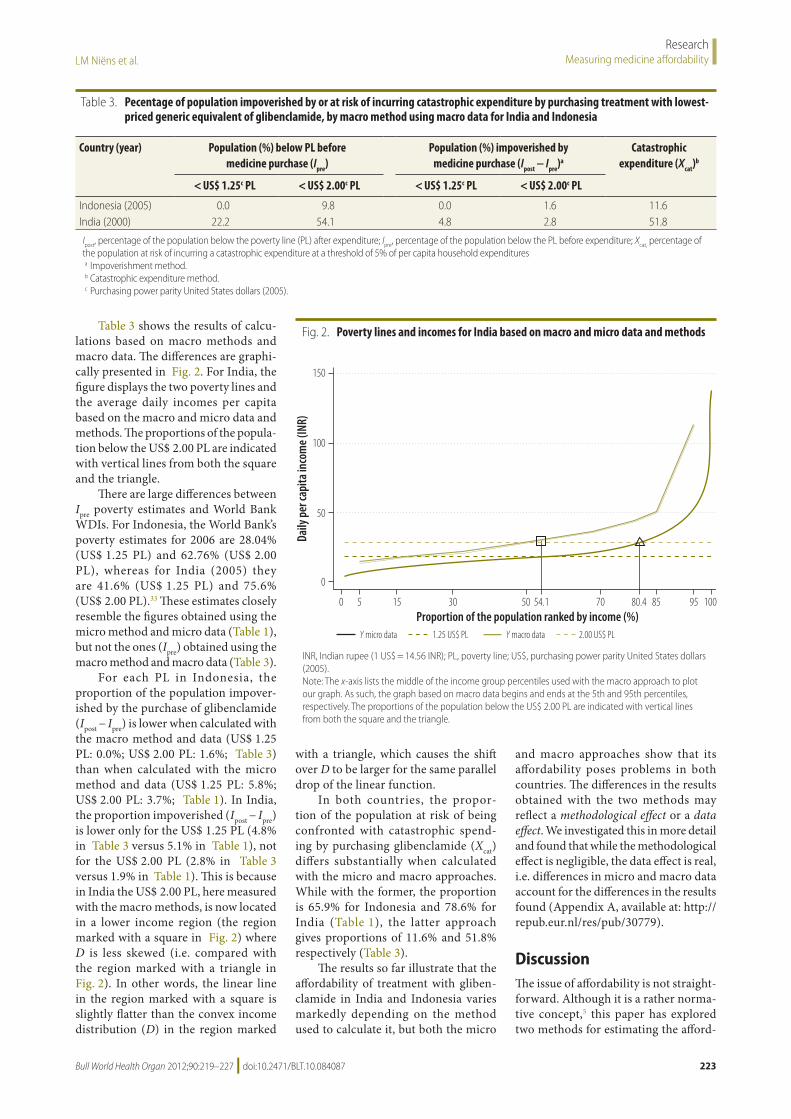
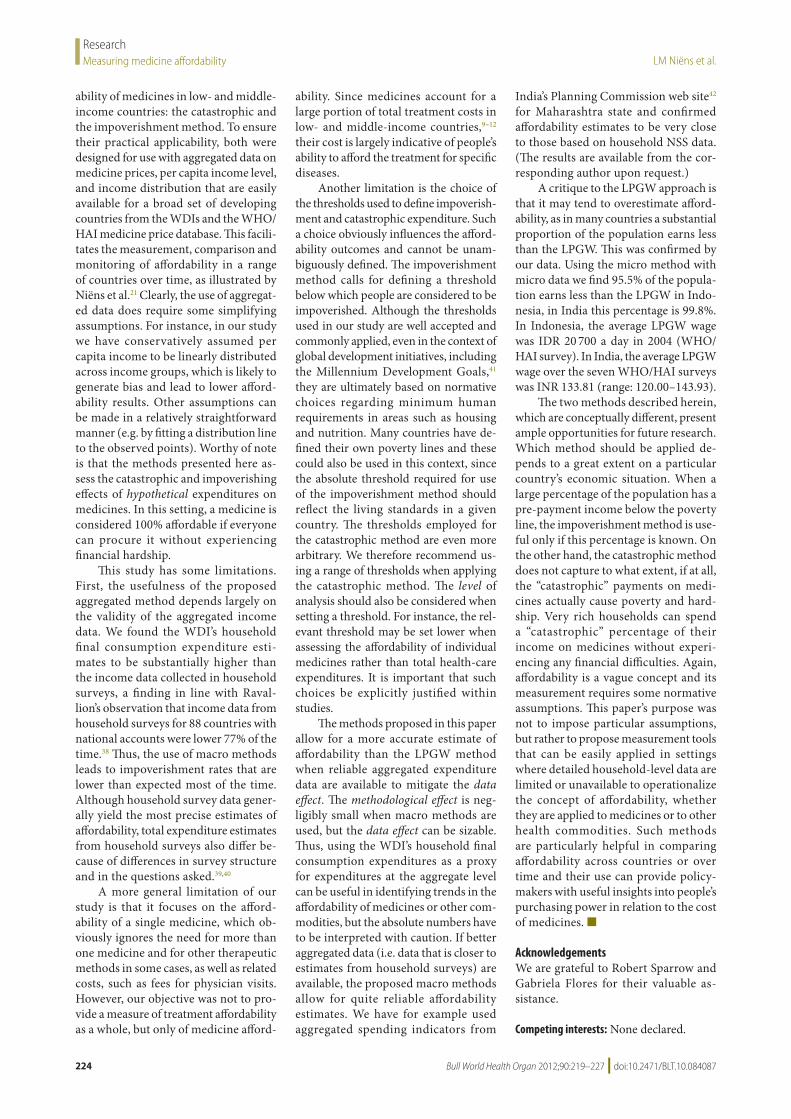
Table 3 shows the results of calcu-lations based on macro methods and macro data. The differences are graphi-cally presented in Fig. 2. For India, the figure displays the two poverty lines and the average daily incomes per capita based on the macro and micro data and methods. The proportions of the popula-tion below the US$ 2.00 PL are indicated with vertical lines from both the square and the triangle.
There are large differences between Ipre poverty estimates and World Bank WDIs. For Indonesia, the World Bank’s poverty estimates for 2006 are 28.04% (US$ 1.25 PL) and 62.76% (US$ 2.00 PL), whereas for India (2005) they are 41.6% (US$ 1.25 PL) and 75.6% (US$ 2.00 PL).33 These estimates closely resemble the figures obtained using the micro method and micro data (Table 1), but not the ones (Ipre) obtained using the macro method and macro data (Table 3).
For each PL in Indonesia, the proportion of the population impover-ished by the purchase of glibenclamide (Ipost − Ipre) is lower when calculated with the macro method and data (US$ 1.25 PL: 0.0%; US$ 2.00 PL: 1.6%; Table 3) than when calculated with the micro method and data (US$ 1.25 PL: 5.8%; US$ 2.00 PL: 3.7%; Table 1). In India, the proportion impoverished (Ipost − Ipre) is lower only for the US$ 1.25 PL (4.8% in Table 3 versus 5.1% in Table 1), not for the US$ 2.00 PL (2.8% in Table 3 versus 1.9% in Table 1). This is because in India the US$ 2.00 PL, here measured with the macro methods, is now located in a lower income region (the region marked with a square in Fig. 2) where D is less skewed (i.e. compared with the region marked with a triangle in Fig. 2). In other words, the linear line in the region marked with a square is slightly flatter than the convex income distribution (D) in the region marked
with a triangle, which causes the shift over D to be larger for the same parallel drop of the linear function.
In both countries, the propor-tion of the population at risk of being confronted with catastrophic spend-ing by purchasing glibenclamide (Xcat) differs substantially when calculated with the micro and macro approaches. While with the former, the proportion is 65.9% for Indonesia and 78.6% for India (Table 1), the latter approach gives proportions of 11.6% and 51.8% respectively (Table 3).
The results so far illustrate that the affordability of treatment with gliben-clamide in India and Indonesia varies markedly depending on the method used to calculate it, but both the micro
and macro approaches show that its affordability poses problems in both countries. The differences in the results obtained with the two methods may reflect a methodological effect or a data effect. We investigated this in more detail and found that while the methodological effect is negligible, the data effect is real, i.e. differences in micro and macro data account for the differences in the results found (Appendix A, available at: http://repub.eur.nl/res/pub/30779).
DiscussionThe issue of affordability is not straight-forward. Although it is a rather norma-tive concept,5 this paper has explored two methods for estimating the afford-
Table 3. Pecentage of population impoverished by or at risk of incurring catastrophic expenditure by purchasing treatment with lowest-priced generic equivalent of glibenclamide, by macro method using macro data for India and Indonesia
Country (year) Population (%) below PL before medicine purchase (Ipre)
Population (%) impoverished by medicine purchase (Ipost − Ipre)a
Catastrophic expenditure (Xcat)
b
< US$ 1.25c PL < US$ 2.00c PL < US$ 1.25c PL < US$ 2.00c PL
Indonesia (2005) 0.0 9.8 0.0 1.6 11.6India (2000) 22.2 54.1 4.8 2.8 51.8
Ipost, percentage of the population below the poverty line (PL) after expenditure; Ipre, percentage of the population below the PL before expenditure; Xcat, percentage of the population at risk of incurring a catastrophic expenditure at a threshold of 5% of per capita household expendituresa Impoverishment method.b Catastrophic expenditure method.c Purchasing power parity United States dollars (2005).
Fig. 2. Poverty lines and incomes for India based on macro and micro data and methods
Y micro data 1.25 US$ PL Y macro data 2.00 US$ PL
Daily
per
capi
ta in
com
e (IN
R)
150
100
50
0
5 15 30 50 54.1 70 80.4 85 95 1000Proportion of the population ranked by income (%)
INR, Indian rupee (1 US$ = 14.56 INR); PL, poverty line; US$, purchasing power parity United States dollars (2005).Note: The x-axis lists the middle of the income group percentiles used with the macro approach to plot our graph. As such, the graph based on macro data begins and ends at the 5th and 95th percentiles, respectively. The proportions of the population below the US$ 2.00 PL are indicated with vertical lines from both the square and the triangle.
Bull World Health Organ 2012;90:219–227 | doi:10.2471/BLT.10.084087224
ResearchMeasuring medicine affordability LM Niëns et al.
ability of medicines in low- and middle-income countries: the catastrophic and the impoverishment method. To ensure their practical applicability, both were designed for use with aggregated data on medicine prices, per capita income level, and income distribution that are easily available for a broad set of developing countries from the WDIs and the WHO/HAI medicine price database. This facili-tates the measurement, comparison and monitoring of affordability in a range of countries over time, as illustrated by Niëns et al.21 Clearly, the use of aggregat-ed data does require some simplifying assumptions. For instance, in our study we have conservatively assumed per capita income to be linearly distributed across income groups, which is likely to generate bias and lead to lower afford-ability results. Other assumptions can be made in a relatively straightforward manner (e.g. by fitting a distribution line to the observed points). Worthy of note is that the methods presented here as-sess the catastrophic and impoverishing effects of hypothetical expenditures on medicines. In this setting, a medicine is considered 100% affordable if everyone can procure it without experiencing financial hardship.
This study has some limitations. First, the usefulness of the proposed aggregated method depends largely on the validity of the aggregated income data. We found the WDI’s household final consumption expenditure esti-mates to be substantially higher than the income data collected in household surveys, a finding in line with Raval-lion’s observation that income data from household surveys for 88 countries with national accounts were lower 77% of the time.38 Thus, the use of macro methods leads to impoverishment rates that are lower than expected most of the time. Although household survey data gener-ally yield the most precise estimates of affordability, total expenditure estimates from household surveys also differ be-cause of differences in survey structure and in the questions asked.39,40
A more general limitation of our study is that it focuses on the afford-ability of a single medicine, which ob-viously ignores the need for more than one medicine and for other therapeutic methods in some cases, as well as related costs, such as fees for physician visits. However, our objective was not to pro-vide a measure of treatment affordability as a whole, but only of medicine afford-
ability. Since medicines account for a large portion of total treatment costs in low- and middle-income countries,9–12 their cost is largely indicative of people’s ability to afford the treatment for specific diseases.
Another limitation is the choice of the thresholds used to define impoverish-ment and catastrophic expenditure. Such a choice obviously influences the afford-ability outcomes and cannot be unam-biguously defined. The impoverishment method calls for defining a threshold below which people are considered to be impoverished. Although the thresholds used in our study are well accepted and commonly applied, even in the context of global development initiatives, including the Millennium Development Goals,41 they are ultimately based on normative choices regarding minimum human requirements in areas such as housing and nutrition. Many countries have de-fined their own poverty lines and these could also be used in this context, since the absolute threshold required for use of the impoverishment method should reflect the living standards in a given country. The thresholds employed for the catastrophic method are even more arbitrary. We therefore recommend us-ing a range of thresholds when applying the catastrophic method. The level of analysis should also be considered when setting a threshold. For instance, the rel-evant threshold may be set lower when assessing the affordability of individual medicines rather than total health-care expenditures. It is important that such choices be explicitly justified within studies.
The methods proposed in this paper allow for a more accurate estimate of affordability than the LPGW method when reliable aggregated expenditure data are available to mitigate the data effect. The methodological effect is neg-ligibly small when macro methods are used, but the data effect can be sizable. Thus, using the WDI’s household final consumption expenditures as a proxy for expenditures at the aggregate level can be useful in identifying trends in the affordability of medicines or other com-modities, but the absolute numbers have to be interpreted with caution. If better aggregated data (i.e. data that is closer to estimates from household surveys) are available, the proposed macro methods allow for quite reliable affordability estimates. We have for example used aggregated spending indicators from
India’s Planning Commission web site42 for Maharashtra state and confirmed affordability estimates to be very close to those based on household NSS data. (The results are available from the cor-responding author upon request.)
A critique to the LPGW approach is that it may tend to overestimate afford-ability, as in many countries a substantial proportion of the population earns less than the LPGW. This was confirmed by our data. Using the micro method with micro data we find 95.5% of the popula-tion earns less than the LPGW in Indo-nesia, in India this percentage is 99.8%. In Indonesia, the average LPGW wage was IDR 20 700 a day in 2004 (WHO/HAI survey). In India, the average LPGW wage over the seven WHO/HAI surveys was INR 133.81 (range: 120.00–143.93).
The two methods described herein, which are conceptually different, present ample opportunities for future research. Which method should be applied de-pends to a great extent on a particular country’s economic situation. When a large percentage of the population has a pre-payment income below the poverty line, the impoverishment method is use-ful only if this percentage is known. On the other hand, the catastrophic method does not capture to what extent, if at all, the “catastrophic” payments on medi-cines actually cause poverty and hard-ship. Very rich households can spend a “catastrophic” percentage of their income on medicines without experi-encing any financial difficulties. Again, affordability is a vague concept and its measurement requires some normative assumptions. This paper’s purpose was not to impose particular assumptions, but rather to propose measurement tools that can be easily applied in settings where detailed household-level data are limited or unavailable to operationalize the concept of affordability, whether they are applied to medicines or to other health commodities. Such methods are particularly helpful in comparing affordability across countries or over time and their use can provide policy-makers with useful insights into people’s purchasing power in relation to the cost of medicines. ■
AcknowledgementsWe are grateful to Robert Sparrow and Gabriela Flores for their valuable as-sistance.
Competing interests: None declared.

Bull World Health Organ 2012;90:219–227 | doi:10.2471/BLT.10.084087 225
ResearchMeasuring medicine affordabilityLM Niëns et al.
ملخصالقياس العميل للقدرة عىل حتمل اإلنفاق: التطبيق عىل األدوية
حتمل عىل القدرة لقياس عمليتني طريقتني صياغة الغرض اإلنفاق عىل األدوية يف البلدان النامية.
الطريقة تعتمد الطريقتان املقرتحتان - الطريقة الكارثية وطريقة عة التي يسهل الوصول إليها اإلفقار - عىل بيانات اإلنفاق املجمَّاملطلق. الدخل ومستوى البلد دخل توزيع احلسبان يف وتضع تقيس الطريقة الكارثية نسبة السكان الذين ستنخفض مواردهم طريقة تقدر بينام معني؛ دواء عىل اإلنفاق نتيجة كارثي بشكل نتيجة الفقر خط حتت دفعها سيتم التي السكان نسبة اإلفقار القدرة الطريقتني بحساب إيضاح هاتني رشاء دواء معني. ويتم عىل حتمل اإلنفاق عىل عقار غليبينكالميد، أحد العقاقري املضادة النتائج من التحقق وتم وإندونيسيا. اهلند يف السكري، لداء البيانات باستخدام عليها احلصول تم التي بالنتائج بمقارنتها
اجلزئية العائلية يف اهلند وإندونيسيا.
الطريقتان توفر الدقيقة، عة املجمَّ البيانات إتاحة عند النتائج وثرية دقيقة تقديرات عىل للحصول عملية وسيلة املقرتحتان نتائجهام وتتشابه اإلنفاق. حتمل عىل القدرة حول باملعلومات باستخدام عليها احلصول تم التي تلك مع للغاية كبري بشكل
حتليل البيانات اجلزئية العائلية كام يسهل مقارنتها عرب البلدان. االستنتاج من املمكن أن توفر الطريقة الكارثية وطريقة اإلفقار – بناًء عىل البيانات الكلية – تقديًرا مناسًبا للقدرة عىل حتمل اإلنفاق العائيل املستوى البيانات اجلزئية عىل توافر الدواء عند عدم عىل الالزمة إلجراء دراسات أكثر تطوًرا. وتعتمد فائدهتام عىل توافر
عة الدقيقة. البيانات املجمَّ
Résumé
Mesure pratique de l’abordabilité: une application aux médicamentsObjectif Développer deux méthodes pratiques permettant de mesurer l’abordabilité des médicaments dans les pays en voie de développement.Méthodes Les méthodes proposées (la méthode catastrophique et la méthode de l’appauvrissement) reposent sur des données de dépenses agrégées facilement accessibles et prennent en compte la répartition des revenus d’un pays ainsi que le niveau de revenu absolu. La méthode catastrophique quantifie la proportion de la population dont les ressources seraient réduites de manière catastrophique par une dépense pour un médicament donné. La méthode de l’appauvrissement estime la proportion de la population qui passerait sous le seuil de pauvreté en achetant un médicament donné. Ces méthodes sont illustrées par le calcul de l’abordabilité
de la glibenclamide, un médicament antidiabétique, en Inde et en Indonésie.Résultats Lorsque des données agrégées précises sont disponibles, les méthodes proposées offrent un moyen pratique d’obtenir des estimations informatives et précises sur l’abordabilité. Leurs résultats sont très similaires à ceux obtenus par l’analyse des micro-données des ménages et sont facilement comparables d’un pays à l’autre.Conclusion La méthode catastrophique et la méthode de l’appauvrissement, basées sur les macro-données, peuvent offrir une estimation convenable de l’abordabilité des médicaments lorsque les micro-données des ménages nécessaires à des études plus poussées ne sont pas disponibles. Leur utilité dépend de la disponibilité de données agrégées précises.
Резюме
Практический метод оценки доступности: применительно к лекарственным средствамЦель Разработать два практических метода определения доступности лекарственных средств в развивающихся странах.Методы Предлагаемые методы – катастрофических расходов и обнищания – основываются на легко доступных обобщенных данных о расходах и учитывают распределение доходов внутри страны и абсолютный уровень доходов. В методе катастрофических расходов рассчитывается доля населения, чьи ресурсы катастрофически сократятся при наличии расходов на данное лекарственное
средство; метод обнищания оценивает долю населения, которая будет вытолкнута за черту бедности в результате покупки данного лекарства. Данные методы иллюстрируются расчетом доступности в Индии и Индонезии глибенкламида, противодиабетического препарата. Результаты исследований были проверены путем сопоставления их с результатами, полученными с использованием микроэкономических показателей домохозяйств в Индии и Индонезии.
摘要实用的购买力测量方法:药物上的应用目的 制定两种测量发展中国家药物购买力的实用方法。方法 所提出的灾化法和贫化法依赖于易于获得的汇总支出数据并将一个国家的收入分配情况和收入绝对水平考虑在内。灾化法量化因购买特定药物而导致其资源灾难性地减少的人口比例;贫化法估算出因努力获得特定药物而陷入贫困线之下的人口比例。通过计算印度和印度尼西亚优降糖及抗糖尿病药物的购买力对这两种方法进行说明。其结果通过与印度和印度尼西亚采用家庭微观数据获得的结果相比较得到验证。
结果 在能够获得准确汇总数据的情况下,所提出的方法为翔实且准确地评估购买力提供了切实可行的途径。其结果与采用家庭微观数据分析所得结果非常相似,也易于进行不同国家比较。结论 在无法获取进行更为精细的研究所需的家庭层面的微观数据时,基于宏观数据的灾化法和贫化法能够恰当预估药物购买力。其有效性取决于准确汇总数据的可用性。

Bull World Health Organ 2012;90:219–227 | doi:10.2471/BLT.10.084087226
ResearchMeasuring medicine affordability LM Niëns et al.
Resumen
Medición práctica de la asequibilidad: aplicación a los medicamentosObjetivo Desarrollar dos métodos prácticos para medir la asequibilidad de los medicamentos en los países en vías de desarrollo.Métodos Los métodos propuestos (métodos para medir los gastos catastróficos y el empobrecimiento) se basan en unos datos agregados fácilmente accesibles sobre el gasto y tienen en cuenta tanto la distribución de los ingresos del país como el nivel absoluto de ingresos. El método de gasto catastrófico cuantifica la proporción de la población cuyos recursos se verían reducidos de manera catastrófica si tuvieran que adquirir un medicamento determinado. El método del empobrecimiento calcula la proporción de la población que pasaría a encontrarse por debajo del umbral de la pobreza si comprara un medicamento determinado. Estos métodos se demuestran calculando la asequibilidad de la glibenclamida, un medicamento antidiabético, en India e Indonesia. Los resultados se refrendaron mediante su
comparación con los resultados obtenidos empleando los microdatos para India e Indonesia.Resultados Cuando se dispone de datos agregados precisos, los métodos propuestos constituyen una forma práctica de obtener evaluaciones informativas y precisas sobre la asequibilidad. Sus resultados son muy similares a los obtenidos mediante los análisis de microdatos nacionales y resultan fáciles de comparar entre los diversos países. Conclusión Los métodos de gasto catastrófico y de empobrecimiento basados en macrodatos pueden ofrecer una evaluación adecuada de la asequibilidad de un medicamento cuando no se dispone de los microdatos necesarios a nivel nacional para desarrollar estudios más complejos. Su utilidad depende de la disponibilidad de unos datos agregados precisos.
References1. Bradley R. Comment - defining health insurance affordability: unobserved
heterogeneity matters. J Health Econ 2008;27:1129–40. doi:10.1016/j.jhealeco.2008.02.004 PMID:18359526
2. Whitehead CME. From need to affordability: an analysis of UK housing objectives. Urban Studies 1991;28:871–87. doi:10.1080/00420989120081101
3. Milne C. Telecoms demand: measures for improving demand in developing countries: a toolkit for action. Main report. Lyngby: World Dialogue on Regulation for Network Economies; 2006. Available from: www.regulateonline.org [accessed 9 January 2012].
4. Komives K, Foster V, Halpern J, Wodon Q. Water, electricity, and the poor: Who benefits from utility subsidies? Washington: World Bank; 2005. Available from: http://www.source.irc.nl/page/26903 [accessed 9 January 2012].
5. Stone ME. What is housing affordability? The case for the residual income approach. Housing Policy Debate 2006;17:151–84. doi:10.1080/10511482.2006.9521564
6. Hancock KE. “Can pay? Won’t pay?” or economic principles of affordability. Urban Studies 1993;30:127–45.
7. Kutty NK. A new measure of housing affordability: Estimates and analytical results. Housing policy debate 2005;16:113–42.
8. Carruthers R, Dick M, Saurkar A. Affordability of public transport in developing countries. Washington: World Bank; 2005 (Transport Papers TP-3).
9. WHO medicines strategy 2004-2007: countries at the core. Geneva: World Health Organization; 2004. Available from: http://whqlibdoc.who.int/hq/2004/WHO_EDM_2004.5.pdf [accessed 9 January 2012].
10. Global comparative pharmaceutical expenditures with related reference information (Health Economics and Drugs EDM Series No. 3). Geneva: World Health Organization; 2000. Available from: http://apps.who.int/medicinedocs/documents/s18569en/s18569en.pdf [accessed 9 January 2012].
11. van Doorslaer E, O’Donnell O, Rannan-Eliya RP, Somanathan A, Adhikari SR, Garg CC et al. Effect of payments for health care on poverty estimates in 11 countries in Asia: an analysis of household survey data. Lancet 2006;368:1357–64. doi:10.1016/S0140-6736(06)69560-3 PMID:17046468
12. Cameron A, Ewen M, Ross-Degnan D, Ball D, Laing R. Medicine prices, availability, and affordability in 36 developing and middle-income countries: a secondary analysis. Lancet 2009;373:240–9. doi:10.1016/S0140-6736(08)61762-6 PMID:19042012
13. Dror DM, Preker AS, Jakab M. The role of communities in combating social exclusion. In: Dror DM, Preker AS, editors. Social reinsurance: a new approach to sustainable community health financing. Washington & Geneva: World Bank & International Labour Office; 2002.
14. Flores G, Krishnakumar J, O’Donnell O, van Doorslaer E. Coping with health-care costs: implications for the measurement of catastrophic expenditures and poverty. Health Econ 2008;17:1393–412. doi:10.1002/hec.1338 PMID:18246595
15. Xu K. Household catastrophic health expenditure: a multicountry analysis. Lancet 2003;362:111–7. [British edition] doi:10.1016/S0140-6736(03)13861-5 PMID:12867110
16. Murakami Y, Blom A. Accessibility and affordability of tertiary education in Brazil, Colombia, Mexico and Peru within a global context (Policy Research Working Paper 4517). Washington: World Bank; 2008. Available from: http://siteresources.worldbank.org/EDUCATION/Resources/278200-1099079877269/547664-1099079956815/wps4517.pdf [accessed 9 January 2012].
17. Wagstaff A, van Doorslaer E. Catastrophe and impoverishment in paying for health care: with applications to Vietnam 1993-1998. Health Econ 2003;12:921–34. doi:10.1002/hec.776 PMID:14601155
18. Frankhauser S, Tepic S. Can poor consumers pay for energy and water? An affordability analysis for transition countries2005 (Working Paper No. 92). London: European Bank for Reconstruction and Development;. Available from: http://www.ebrd.com/downloads/research/economics/workingpapers/wp0092.pdf [accessed 9 January 2012].
19. Social issues in the provision and pricing of water services. Paris: Organisation for Economic Co-operation and Development; 2003. Available from: http://books.google.ch/books?id=QY1Eox_gp0kC&pg=PA13&lpg=PA13&dq=Organisation+for+Economic+Co-operation+and+Development.+Social+issues+in+the+provision+and+pricing+of+water+service+2003 [accessed 9 January 2012].
20. Dolbeare CN. Housing grants for the very poor. Philadelphia: Philadelphia Housing Association; 1966.
Результаты При наличии доступных точных обобщенных данных, предлагаемые методы представляют собой практический способ получения информативных и точных оценок доступности лекарственных средств. Их результаты очень близки к данным, полученным в результате анализа микроэкономических показателей домохозяйств, и легко сравнимы по странам. Вывод Методы катастрофических расходов и обнищания, основанные на макроэкономических показателях, могут
обеспечить приемлемую оценку доступности лекарственных средств в условиях, когда недоступны микроэкономические показатели домохозяйств, необходимые для проведения более сложных исследований. Возможность применения этих методов зависит от наличия точных обобщенных данных.

Bull World Health Organ 2012;90:219–227 | doi:10.2471/BLT.10.084087 227
ResearchMeasuring medicine affordabilityLM Niëns et al.
21. Niëns LM, Cameron A, Van de Poel E, Ewen M, Brouwer WB, Laing R. Quantifying the impoverishing effects of purchasing medicines: a cross-country comparison of the affordability of medicines in the developing world. PLoS Med 2010;7:e1000333. doi:10.1371/journal.pmed.1000333 PMID:20824175
22. Measuring medicine prices, availability, affordability and price components. 2nd ed. Geneva: World Health Organization & Health Action International; 2008 (WHO/PSM/PAR/2008.3). Available from: http://www.who.int/medicines/areas/access/OMS_Medicine_prices.pdf [accessed 9 January 2012].
23. Niëns LM, Brouwer WBF. Better measures of affordability required. Lancet 2009;373:1081–2. doi:10.1016/S0140-6736(09)60649-8 PMID:19329001
24. O’Donnell O, van Doorslaer E, Wagstaff A, Lindelow M. Analyzing health equity using household survey data: a guide to techniques and their implementation. Washington: World Bank; 2008. Available from: http://books.google.ch/books?id=8krsjfKv2vgC&printsec=frontcover&hl=de&source=gbs_ge_summary_r&cad=0#v=onepage&q&f=false [accessed 9 January 2012].
25. Russell S. The economic burden of illness for households in developing countries: a review of studies focusing on malaria, tuberculosis, and human immunodeficiency virus/acquired immunodeficiency syndrome. Am J Trop Med Hyg 2004;71(suppl):147. PMID:15331831
26. McIntyre D, Thiede M, Dahlgren G, Whitehead M. What are the economic consequences for households of illness and of paying for health care in low- and middle-income country contexts? Soc Sci Med 2006;62:858–65. doi:10.1016/j.socscimed.2005.07.001 PMID:16099574
27. Prescott N. Coping with catastrophic health shocks. In: Proceedings of the Conference on Social Protection and Poverty; 1999 24–25 March; Washington, United States of America.
28. Ranson K. Reduction of catastrophic health care expenditures by a community-based health insurance scheme in Gujurat, India: current experiences and challenges. Bull World Health Organ 2002;80:613–21.
29. Rokx C, Schieber G, Harimurti P, Tandon A, Somanathan A. Health financing in Indonesia: a reform road map. Washington: The World Bank Group; 2009 (Publication 50174).
30. World Health Organization [Internet]. World Health Survey 2003. Geneva: WHO; 2012. Available from: http://www.who.int/healthinfo/survey/en/ [accessed 9 January 2012].
31. IDF Diabetes Atlas, fifth edition [Internet]. Detailed data and interactive map. Brussels: International Diabetes Federation; 2012. Available from: http://www.idf.org/diabetesatlas/5e/detailed-data-and-interactive-map [accessed 20 January 2012].
32. The World Bank [Internet]. Measuring poverty at the country level. Washington: WB; 2010. Available from: http://go.worldbank.org/77LE4ON4V0 [accessed 20 January 2012].
33. World databank [Internet]. World development indicators. Washington: World Bank; 2012. Available from: http://databank.worldbank.org/ddp/home.do [accessed 9 January 2012].
34. International Comparison Program [Internet]. Washington: World Bank; 2012. Available from: http://go.worldbank.org/X3R0INNH80 [accessed 9 January 2012].
35. Rand Family Life Surveys [Internet]. National Socio-Economic Household Survey; Santa Monica: RAND Corporation; 2011. Available from: http://www.rand.org/labor/bps/susenas.html [accessed 9 January 2012].
36. Ministry of Statistics and Program Implementation [Internet]. Micro Data Archive. New Delhi: Government of India; 2011. Available from: http://mospi.nic.in/Mospi_New/site/home.aspx [accessed 9 January 2012].
37. Lipton M, Ravaillon M. Poverty and policy. In: Behrman J, Srinivasan TN, editors. Handbook of development economics. Amsterdam: Elsevier Science; 1994.
38. Ravallion MM. Measuring aggregate welfare in developing countries: how well do national accounts and surveys agree? Rev Econ Stat 2003;85:645–52. doi:10.1162/003465303322369786
39. Lu C, Chin B, Lic G, Murray CJL. Limitations of methods for measuring out-of-pocket and catastrophic private health expenditures. Bull World Health Organ 2009;87:238. doi:10.2471/BLT.08.054379 PMID:19377721
40. Xu K, Ravndal F, Evans DB, Carrin G. Assessing the reliability of household expenditure data: results of the World Health Survey. Health Policy 2009;91:297. doi:10.1016/j.healthpol.2009.01.002 PMID:19217184
41. The Millennium Development Goals report 2010. New York: United Nations; 2010. Available from: http://www.un.org/millenniumgoals/reports.shtml [accessed 9 January 2012].
42. Planning Commission, Government of India. Per-capita consumption expenditure at current prices (73–74 to 04–05). Delhi: Government of India; 2010. Available from: http://planningcommission.nic.in/data/datatable/0211/data%2044.pdf [accessed 9 January 2012].