practical implications of some recent studies in electrospray
TRANSCRIPT

PRACTICAL IMPLICATIONS OF SOME RECENT STUDIES INELECTROSPRAY IONIZATION FUNDAMENTALS
Nadja B. Cech1 and Christie G. Enke2*1Department of Chemistry and Biochemistry, University of North Carolina, Greensboro, NC2Department of Chemistry, 103 Clark Hall, Albuquerque, NM
Received 09 July 2001; revised 15 November 2001; accepted 16 November 2001
I. Introduction . . . . . . . . . . . . . . . . . . . . . . . . . . . . . . . . . . . . . . . . . . . . . . . . . . . . . . . . . . . . . . . . . . . . . . . . 363
II. The Mechanics of ESI-MS . . . . . . . . . . . . . . . . . . . . . . . . . . . . . . . . . . . . . . . . . . . . . . . . . . . . . . . . . . . . . . 363
III. Analyte Characteristics and Selectivity . . . . . . . . . . . . . . . . . . . . . . . . . . . . . . . . . . . . . . . . . . . . . . . . . . . . . . 365A. Charging the Analyte . . . . . . . . . . . . . . . . . . . . . . . . . . . . . . . . . . . . . . . . . . . . . . . . . . . . . . . . . . . . . . . 366
1. Ionization Through Charge Separation . . . . . . . . . . . . . . . . . . . . . . . . . . . . . . . . . . . . . . . . . . . . . . . . . . . 3662. Adduct Formation. . . . . . . . . . . . . . . . . . . . . . . . . . . . . . . . . . . . . . . . . . . . . . . . . . . . . . . . . . . . . . . . . . 3663. Ionization Through Gas-Phase Reactions. . . . . . . . . . . . . . . . . . . . . . . . . . . . . . . . . . . . . . . . . . . . . . . . . . 3664. Ionization Through Electrochemical Oxidation or Reduction . . . . . . . . . . . . . . . . . . . . . . . . . . . . . . . . . . . . 368
B. Analyte Surface Activity and Its Effect on ESI Response . . . . . . . . . . . . . . . . . . . . . . . . . . . . . . . . . . . . . . 3681. Surface Activity and the Fissioning Process. . . . . . . . . . . . . . . . . . . . . . . . . . . . . . . . . . . . . . . . . . . . . . . . 3692. Predicting ESI Response from Other Parameters . . . . . . . . . . . . . . . . . . . . . . . . . . . . . . . . . . . . . . . . . . . . 369
C. The Role of Analyte pKa and Solvent pH . . . . . . . . . . . . . . . . . . . . . . . . . . . . . . . . . . . . . . . . . . . . . . . . . 370D. Improving ESI Response Through Derivatization . . . . . . . . . . . . . . . . . . . . . . . . . . . . . . . . . . . . . . . . . . . . 371
IV. The Working Curve and Dynamic Range . . . . . . . . . . . . . . . . . . . . . . . . . . . . . . . . . . . . . . . . . . . . . . . . . . . . 373A. Detection Limits With ESI . . . . . . . . . . . . . . . . . . . . . . . . . . . . . . . . . . . . . . . . . . . . . . . . . . . . . . . . . . . 373
1. Background Interferences . . . . . . . . . . . . . . . . . . . . . . . . . . . . . . . . . . . . . . . . . . . . . . . . . . . . . . . . . . . . 3732. Random Noise . . . . . . . . . . . . . . . . . . . . . . . . . . . . . . . . . . . . . . . . . . . . . . . . . . . . . . . . . . . . . . . . . . . . 3743. Ion Transmission and Sensitivity . . . . . . . . . . . . . . . . . . . . . . . . . . . . . . . . . . . . . . . . . . . . . . . . . . . . . . . 374
B. Sources of Signal Saturation at High Concentrations . . . . . . . . . . . . . . . . . . . . . . . . . . . . . . . . . . . . . . . . . 3751. Limited Amount of Excess Charge . . . . . . . . . . . . . . . . . . . . . . . . . . . . . . . . . . . . . . . . . . . . . . . . . . . . . . 3752. Limited Space on Droplet Surfaces. . . . . . . . . . . . . . . . . . . . . . . . . . . . . . . . . . . . . . . . . . . . . . . . . . . . . . 3753. Suppression and Competition at High Concentrations . . . . . . . . . . . . . . . . . . . . . . . . . . . . . . . . . . . . . . . . . 376
C. Improving the Detection Limit and Linear Dynamic Range . . . . . . . . . . . . . . . . . . . . . . . . . . . . . . . . . . . . . 3761. Extending to Higher Concentrations . . . . . . . . . . . . . . . . . . . . . . . . . . . . . . . . . . . . . . . . . . . . . . . . . . . . . 3762. Extending to Lower Concentrations . . . . . . . . . . . . . . . . . . . . . . . . . . . . . . . . . . . . . . . . . . . . . . . . . . . . . 376
V. Instrumental Parameters and Stability . . . . . . . . . . . . . . . . . . . . . . . . . . . . . . . . . . . . . . . . . . . . . . . . . . . . . . . 377A. Current–Voltage Curves. . . . . . . . . . . . . . . . . . . . . . . . . . . . . . . . . . . . . . . . . . . . . . . . . . . . . . . . . . . . . . 377B. Effect of Instrumental Parameters on the Current–Voltage Curve . . . . . . . . . . . . . . . . . . . . . . . . . . . . . . . . . 378C. Self-Stabilizing Operation . . . . . . . . . . . . . . . . . . . . . . . . . . . . . . . . . . . . . . . . . . . . . . . . . . . . . . . . . . . . 379D. Non-Conductive vs. Conductive Spray Capillaries . . . . . . . . . . . . . . . . . . . . . . . . . . . . . . . . . . . . . . . . . . . 379
VI. Solution Characteristics . . . . . . . . . . . . . . . . . . . . . . . . . . . . . . . . . . . . . . . . . . . . . . . . . . . . . . . . . . . . . . . . . 380A. The Ideal ESI Solvent . . . . . . . . . . . . . . . . . . . . . . . . . . . . . . . . . . . . . . . . . . . . . . . . . . . . . . . . . . . . . . 380B. Solvent Choice for Analysis in the Positive Ion Mode . . . . . . . . . . . . . . . . . . . . . . . . . . . . . . . . . . . . . . . . 381C. Solvent Choice for Analysis in the Negative Ion Mode . . . . . . . . . . . . . . . . . . . . . . . . . . . . . . . . . . . . . . . . 381D. Compatibility Between ESI and Liquid Separation Techniques . . . . . . . . . . . . . . . . . . . . . . . . . . . . . . . . . . 382
VII. Summary . . . . . . . . . . . . . . . . . . . . . . . . . . . . . . . . . . . . . . . . . . . . . . . . . . . . . . . . . . . . . . . . . . . . . . . . . . . 382
VIII. Acknowledgment . . . . . . . . . . . . . . . . . . . . . . . . . . . . . . . . . . . . . . . . . . . . . . . . . . . . . . . . . . . . . . . . . . . . . 383
References . . . . . . . . . . . . . . . . . . . . . . . . . . . . . . . . . . . . . . . . . . . . . . . . . . . . . . . . . . . . . . . . . . . . . . . . . . . . . . 383
Mass Spectrometry Reviews, 2001, 20, 362– 387# 2002 Wiley Periodicals, Inc.
*Correspondence to: Prof. Christie G. Enke, Department of Chemistry,103 Clark Hall, Albuquerque, NM 87131. E-mail: [email protected]
————Nadja B. Cech is Assistant Professor in the University of NorthCarolina, Greensboro (E-mail: [email protected]).Contract grant sponsor: NIHGM 44077; Contract grant sponsor: Pfizer,Inc.
In accomplishing successful electrospray ionization analyses, itis imperative to have an understanding of the effects ofvariables such as analyte structure, instrumental parameters,and solution composition. Here, we review some fundamentalstudies of the ESI process that are relevant to these issues. Wediscuss how analyte chargeability and surface activity arerelated to ESI response, and how accessible parameters such asnonpolar surface area and reversed phase HPLC retention timecan be used to predict relative ESI response. Also presented is adescription of how derivitizing agents can be used to maximizeor enable ESI response by improving the chargeability orhydrophobicity of ESI analytes. Limiting factors in the ESIcalibration curve are discussed. At high concentrations, thesefactors include droplet surface area and excess chargeconcentration, whereas at low concentrations ion transmissionbecomes an issue, and chemical interference can also belimiting. Stable and reproducible non-pneumatic ESI operationdepends on the ability to balance a number of parameters,including applied voltage and solution surface tension, flowrate, and conductivity. We discuss how changing theseparameters can shift the mode of ESI operation from stable tounstable, and how current–voltage curves can be used tocharacterize the mode of ESI operation. Finally, the character-istics of the ideal ESI solvent, including surface tension andconductivity requirements, are discussed. Analysis in thepositive ion mode can be accomplished with acidifiedmethanol/water solutions, but negative ion mode analysisnecessitates special constituents that suppress corona dischargeand facilitate the production of stable negative ions. # 2002Wiley Periodicals, Inc., Mass Spec Rev 20:362–387, 2001;Published online in Wiley InterScience(www.interscience.wiley.com). DOI 10.1002/mas.10008Keywords: ESI-MS; proton affinity; surface activity; solvent;stability; negative ion; detection limit
I. INTRODUCTION
Electrospray ionization mass spectrometry (ESI-MS) isa choice method to accomplish mass determination ofbiomolecules. It is ideally suited to biochemical analysisbecause it allows for large, non-volatile molecules to beanalyzed directly from the liquid phase, and thus can becoupled to separation techniques such as high perfor-mance liquid chromatography (HPLC) and capillaryelectrophoresis (CE) (Gelpi, 1995; Niessen & Tinke,1995; Slobodnik, van Barr, & Brinkman, 1995). ESI-MSis significantly more rapid, sensitive, and accurate thantraditional techniques of mass determination for biologicalmolecules such as gel electrophoresis and equilibriumsedimentation. As a result, the technique has becomeindispensable in the analysis and sequencing of proteins(Fenn et al., 1989; Mehlis & Kertscher, 1997; Cao & Moini,1998; Owens et al., 1998; Troxler et al., 1999; Alomirah,Alli, & Konishi, 2000; Le Bihan, Pinto, & Figeys, 2001;Whitelegge, Gunderson, & Faull, 2001) and oligonucleo-tides (Miketova & Schram, 1997; Muddiman & Smith,
1998; Owens et al., 1998), and is also used extensively inanalyzing drugs, natural products (Herderich et al., 1997;Strege, 1999), pesticides (Jeannot & Sauvard, 1999; Steenet al., 1999), carbohydrates (Shen & Perreault, 1998;Yeung, Porter, & Vath, 1997; Apffel et al., 1998), and othersmall molecules.
Despite the widespread adoption of ESI-MS as atechnique for biochemical analysis, many users stilltend to view the technique as a ‘‘black box.’’ Sources ofinstability, background, interference, competition, andsuppression are not always understood. As a result, theapplication of ESI can be fraught with frustration. Weare confident that some recent work in ESI fundamen-tals can help guide applications development, and haveundertaken this review with the goal of presenting infor-mation that is relevant and interesting to ESI users at large.
II. THE MECHANICS OF ESI-MS
In ESI-MS, a dilute solution of analyte is pumped througha capillary at a very low flow rate (0.1–10 mL/min). A highvoltage (2–5 kV) is applied to the capillary. This voltagecan be either negative or positive, depending on theanalytes chosen. The applied voltage provides the electric-field gradient required to produce charge separation at thesurface of the liquid. As a result, the liquid protrudes fromthe capillary tip in what is known as a ‘‘Taylor cone’’(Fig. 1). When the solution that comprises the Taylor conereaches the Rayleigh limit (Taflin, Ward, & Davis, 1989)(the point at which Coulombic repulsion of the surfacecharge is equal to the surface tension of the solution),droplets that contain an excess of positive or negativecharge detach from its tip. These droplets move through theatmosphere towards the entrance to the mass spectrometer,and generate charged analyte molecules (ions) by one ofseveral proposed mechanisms (Kebarle & Peschke, 1999).The coulomb fission mechanism assumes that the increasedcharge density due to solvent evaporation causes largedroplets to divide into smaller and smaller droplets, whicheventually consist only of single ions (Dole et al., 1968).A second mechanism, known as ion evaporation, assumesthat the increased charge density that results from solventevaporation eventually causes coulombic repulsion toovercome the liquid’s surface tension, resulting in a releaseof ions from droplet surfaces (Iribarne & Thomson, 1976).Regardless of the mechanism by which they are produced,the ESI process generates vapor phase ions that can beanalyzed for mass-to-charge ratio within the mass spectro-meter. The various ways in which these ions may beproduced are discussed in detail later on.
The charging of new surface as the droplets form andleave the tip requires a flow of charge from the powersupply. The electrical circuit that sustains this current can
ELECTROSPRAY IONIZATION MASS SPECTROMETRY &
363

be traced from the positive terminal of the power supply,to the solution via a metallic contact, through the gap thatseparates the capillary tip and the counter electrode, to ionneutralization at the counter electrode, and back to thenegative power supply terminal (For negative ion ESI,the power supply is reversed). The current through eachelement of the series circuit must be the same. Thus, thecurrent measured by the current meter shown in Figure 1is a measure of the rate of the charge separation producedin the solution and leaving the capillary tip. The amount ofcharge on the droplets is, therefore, equal to the amount ofcharge separation. This charge is sometimes called theexcess charge (Enke, 1997) to differentiate it from thecations and anions in the droplet that are neutralized bycounter-ions. It is important to distinguish between theseexcess and neutralized charges because the neutralizedcharges are not likely to result in gas-phase ions.The formation of gas-phase ions from neutralized chargewould require desolvation energies in excess of the
Coulombic forces between the ions and their counterions.Consequently, the maximum rate of production of vaporphase ions is equal to the rate of charge separation,and the amount of vapor phase ions produced cannotexceed the amount of excess charge introduced into thedroplets.
The continuous flow of charge from the metalliccontact to the sample solution must occur via an electro-chemical reaction at that contact (Van Berkel, 1997). Thedominant reaction in positive ion ESI is oxidation,whereas in negative ion ESI it is reduction. The equi-valents of electrochemical reactant consumed and elec-trochemical product produced by the electrochemicalreaction are exactly equal to the amount of charge sepa-ration that occurs at the capillary tip. The amount ofanalyte charged in ESI cannot exceed the amount bywhich the solution’s chemical composition has beenchanged, because the amount of charge going to the ESIand the electrochemical process is the same.
FIGURE 1. Schematic of the electrospray ionization process. The analyte solution is pumped through aneedle to which a high voltage is applied. A Taylor cone with an excess of positive charge on its surfaceforms as a result of the electric field gradient between the ESI needle and the counter electrode. Chargeddroplets are formed from the tip of the Taylor cone, and these droplets evaporate as they move towards theentrance to the mass spectrometer to produce free, charged analyte molecules that can be analyzed fortheir mass-to-charge ratio.
& CECH AND ENKE
364

The ESI process takes place at atmospheric pressure.Because mass analysis can only be accomplished at lowpressure, it is necessary to transfer ions from the atmos-pheric pressure region to a low-pressure region beforethey can be analyzed by the mass analyzer. To accomplishthis transfer of ions from high pressure to low pressure,differential pumping is generally employed, such thatthe mass spectrometer consists of separate chambers atdecreasing pressures. These chambers are separated byorifices through which the ions must pass before reachingthe mass analyzer.
Because the ESI process produces neutral species,ions, and clusters of ions with neutrals, the first challengethat must be overcome in introducing ions into the vacuumregion is to separate the ions from the neutrals and toaccomplish complete desolvation. Before ions even enterinto the mass spectrometer, droplet formation can be aidedby using a co-axial flow of neutral gas (known as sheathgas) around the needle tip. This sheath gas also aids indroplet desolvation. Electrospray mass spectrometry usinga sheath gas is known as pneumatically assisted ESI(Bruins, Henion, & Covey, 1987). The separation of ionsfrom neutrals can be aided by positioning the spraycapillary slightly off-axis from the entrance to the massspectrometer (Bruins, 1997). Off-axis positioning is help-ful because the outer region of the spray generally consistsof smaller, lighter, more desolvated droplets (Taflin, Ward,& Davis, 1989), and thus off-axis positioning maximizesthe amount of desolvated analyte that enters the massspectrometer while selecting against the unevaporateddroplets.
There are several ways to accomplish introductionof ions from atmospheric pressure into the first stage ofthe mass spectrometer (Bruins, 1997). SCIEX (Ontario,Canada) uses a dry nitrogen ‘‘curtain’’ gas, which effec-tively drives neutral species away from the mass spec-trometer orifice. Charged species penetrate the curtainbecause they are electrostatically attracted toward theorifice by virtue of an electric field gradient. A similardesign, manufactured by Analytica of Branford, uses aglass tube coated on each end with a conductor in place ofthe orifice. Finally, Thermo Finnigan (San Jose, CA) usesa heated metal capillary interface for droplet desolvationand introduction into the vacuum. High temperatures andcollisions within this capillary aid in the desolvationprocess and help to accomplish the declustering of ionsfrom neutrals.
III. ANALYTE CHARACTERISTICS ANDSELECTIVITY
One significant area of research in the fundamentals ofESI has been the issue of how analyte characteristics
are important in determining ESI response. This issue isrelevant because ESI response can vary significantlyamong different analytes that have identical solutionconcentrations (Cheng et al., 1992; Tang & Kebarle,1993; Cech & Enke, 2000; Zhou & Cook, 2001; Cech,Krone, & Enke, 2001a) (Fig. 2). For example, Figure 2shows the mass spectrum of an equimolar mixture ofcesium bromide and decyltrimethylammonium (DTMA)bromide (Zhou & Cook, 2001). Although the solutionconcentrations of these two analytes are identical, the ESIresponses of the two differ by approximately an order ofmagnitude. This difference arises because DTMA is moresurface-active than Csþ, as discussed later on (see AnalyteSurface Activity and its Effect on ESI response).
An understanding of how analyte characteristicsdetermine ESI response is of key importance in thesuccessful application of ESI. This understanding isnecessary in accessing the suitability of ESI for analysisof a particular analyte. It is also important in trouble-shooting. If the ESI analysis is not working, or if detectionlimits are poor, then the analyst must determine whetherthe problem lies in sample preparation or separation, orwhether the analyte is inherently unsuitable for analysisby ESI-MS. In this latter case, it may be possible toderivitize the analyte in such a way as to improve itsresponsiveness. In this section, we discuss what analytecharacteristics determine ESI response. We also reviewsome of the methods of derivatization that can be emp-loyed to improve the ESI response of poorly responsiveanalytes.
FIGURE 2. ESI mass spectrum of an equimolar (10�6 M each)mixture of cesium bromide (CsBr) and Decyltrimethylammoniumbromide (DTMA Br) in 50% methanol, 50% water solution with 1.0 kVcapillary voltage. The mass spectral response of the DTMAþ issignificantly higher than that of the Csþ due to its higher dropletsurface affinity [Reprinted from Zhou & Cook, J Am Soc MassSpectrom, 2001, 12:206–214 with the permission of Elsevier].
ELECTROSPRAY IONIZATION MASS SPECTROMETRY &
365

A. Charging the Analyte
1. Ionization Through Charge Separation
As discussed in the introduction, analytes that already existas ions in solution may become part of the excess chargewhen charge separation occurs within the Taylor cone.Gas-phase ions will be created when the droplets formedfrom the Taylor cone evaporate and the ions that carry theexcess charge are released into the gas phase. Chargeseparation is the primary method by which ions are formedfor inorganic species such as sodium, cesium, chloride, andnitrate, for organic and biological molecules with acidic orbasic functional groups, and for species that containammonium, phosphonium, or oxonium moieties. Proteins,with their multiple basic amino acid residues, readily formpositively charged ions through protonation, whereasoligonucleotides and fatty acids can be negatively chargedthrough deprotonation of acidic groups. Positively chargedions such as inorganic cations and protonated organic basesare analyzed in the positive ion mode, whereas negativelycharged ions such as inorganic anions and deprotonatedorganic acids are analyzed in the negative ion mode.
2. Adduct Formation
Polar analytes that do not have acidic or basic groups can becharged with ESI through the formation of adducts withvarious ions. Adduct formation is actually a special caseof ionization by charge separation; the adduct formationoccurs in solution before the charge separation processtakes place.
Adduct formation is used to create ions in negativeand positive ion ESI. In negative ion ESI, Cole, and Zhuhave shown that adducts are formed with chloride ionswhen chlorinated solvents such as chloroform are used(Cole & Zhu, 1999) (Fig. 3). The formation of adductswith chloride anions allows for the successful ESI analysisof species such as polar, neutral molecules, or very weaklyacidic molecules that do not generate stable negativeions through deprotonation. In positive ion ESI, analyteadducts with sodium, lithium, ammonium, or other catio-nic species are often observed. The addition of salts toyield these cations to samples of weakly basic or polar,neutral analytes can facilitate the formation of positiveions (Saf, Mirtl, & Hummel, 1994; Ackloo et al., 2000).
Although small concentrations of salt can facilitateionization through adduct formation, high salt concentra-tions cause background that interferes with detection ofthe analyte. Background in the form of sodium clusterswith analytes and solvents can be so severe that it com-pletely masks the analyte signal. Some background con-centration of salt, usually sodium, is almost alwayspresent in ESI samples. Low concentrations of sodium
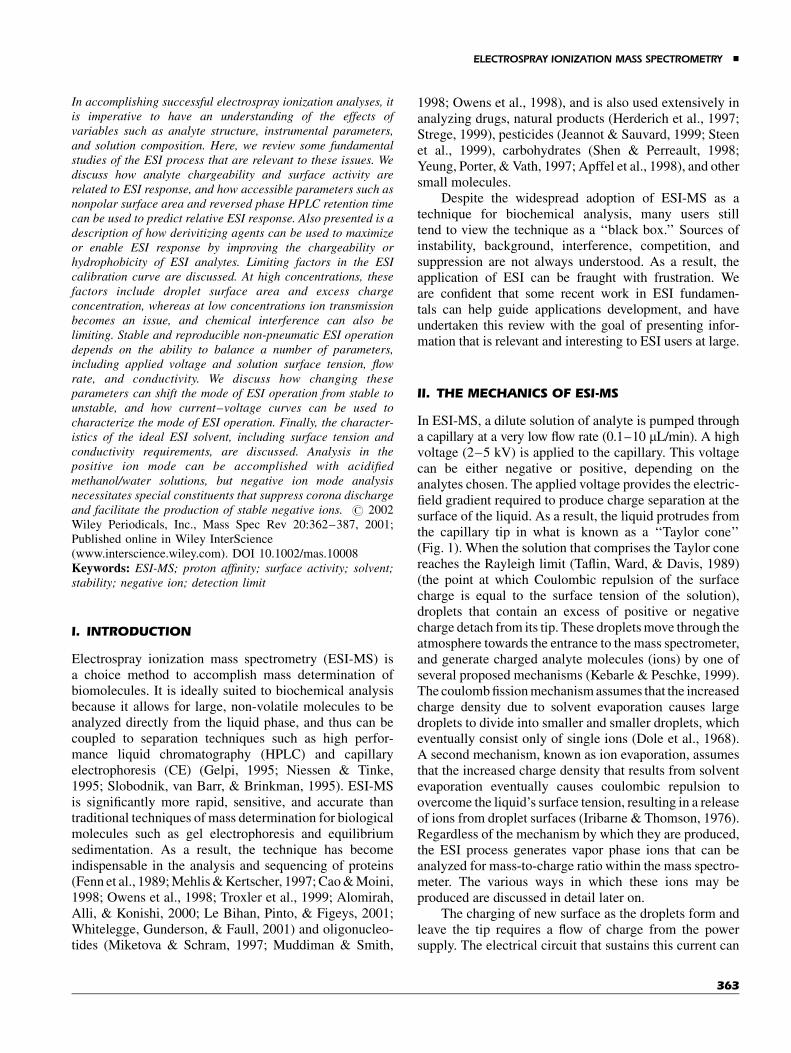
(on the order of 10�6 M) can derive from glassware andstorage bottles, or can be present as impurities—evenin analytical grade solvents. Higher concentrations ofvarious salts can derive from biological sources, or beadded as LC buffers to facilitate separations. The dele-terious effects of cation adduct formation can be quitepronounced with oligonucleotides of high mass andcharge state (Liu et al., 1996) due to the clustering ofnucleotides with cations (Fig. 4a). Liu et al. demonstratedthat interference due to salt clusters can be preventedthrough the application of on-line microdialysis techni-ques, the results of which are shown in Figure 4, parts (b)and (c) (Liu et al., 1996). Microdialysis can also be per-formed off-line, thus permitting the analysis to be accom-plished at lower flow rates and consuming less analyte(Liu et al., 1997). Salt removal can also be accomplishedon-line by packing the spray capillary with HPLC beads(Emmett & Caprioli, 1994).
3. Ionization Through Gas-Phase Reactions
Because the ESI process occurs at atmospheric pressure,and because large quantities of charged solvent moleculesare generated in addition to the charged analyte molecules,the ESI-MS response can be affected by gas-phase inter-actions (Ogorzalek Loo & Smith, 1994; Stephenson &
FIGURE 3. Negative ion ESI mass spectrum of analine in a 10:1carbon tetrachloride:chloroform solution. Analine, which does notreadily form negative ions through deprotonation, is clearly observedas an adduct with chloride ion from the solvent [Reprinted from Cole& Zhu, Rapid Commun Mass Spectrom, 1999, 13:607–611 with per-mission of John Wiley & Sons, Ltd.].
& CECH AND ENKE
366
McLuckey, 1996; Kebarle & Peschke, 1999; Amad et al.,2000). These gas-phase interactions occur after theanalytes have been released from solution; thus, gas-phaseeffects are essentially the ‘‘last word’’ in the electrosprayprocess.
In ESI, analyte charging in the gas phase generallyoccurs through gas-phase proton-transfer reactions (Zhou& Hamburger, 1995; Yen, Charles, & Voyksner, 1996;Kebarle & Peschke, 1999; Amad et al., 2000). Uponentering the gas phase, molecules that were protonatedin solution yield their protons to solvents or analyteswith higher gas-phase basicity. In this way, analytes thatevaporate from the droplets as neutrals can becomecharged through gas-phase interactions. Gas-phase protontransfer reactions occur when there is an inversion in theorder of basicity among a series of molecules proceedingfrom the solution phase to the gas phase (Kebarle &
Peschke, 1999). It is important to note that the inversion oforder of basicity occurs because solution-phase basicityand gas-phase proton affinity are not necessarily related.Species with high gas-phase proton affinities may not behighly basic in solution.
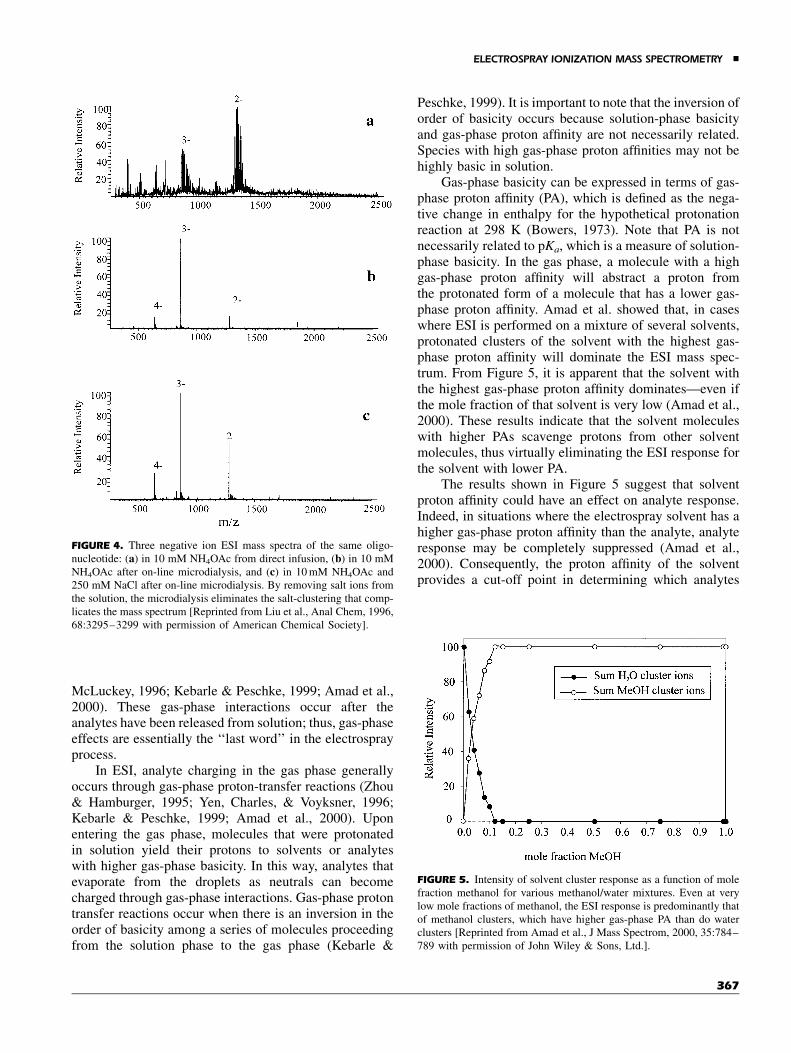
Gas-phase basicity can be expressed in terms of gas-phase proton affinity (PA), which is defined as the nega-tive change in enthalpy for the hypothetical protonationreaction at 298 K (Bowers, 1973). Note that PA is notnecessarily related to pKa, which is a measure of solution-phase basicity. In the gas phase, a molecule with a highgas-phase proton affinity will abstract a proton fromthe protonated form of a molecule that has a lower gas-phase proton affinity. Amad et al. showed that, in caseswhere ESI is performed on a mixture of several solvents,protonated clusters of the solvent with the highest gas-phase proton affinity will dominate the ESI mass spec-trum. From Figure 5, it is apparent that the solvent withthe highest gas-phase proton affinity dominates—even ifthe mole fraction of that solvent is very low (Amad et al.,2000). These results indicate that the solvent moleculeswith higher PAs scavenge protons from other solventmolecules, thus virtually eliminating the ESI response forthe solvent with lower PA.
The results shown in Figure 5 suggest that solventproton affinity could have an effect on analyte response.Indeed, in situations where the electrospray solvent has ahigher gas-phase proton affinity than the analyte, analyteresponse may be completely suppressed (Amad et al.,2000). Consequently, the proton affinity of the solventprovides a cut-off point in determining which analytes
FIGURE 4. Three negative ion ESI mass spectra of the same oligo-nucleotide: (a) in 10 mM NH4OAc from direct infusion, (b) in 10 mMNH4OAc after on-line microdialysis, and (c) in 10 mM NH4OAc and250 mM NaCl after on-line microdialysis. By removing salt ions fromthe solution, the microdialysis eliminates the salt-clustering that comp-licates the mass spectrum [Reprinted from Liu et al., Anal Chem, 1996,68:3295–3299 with permission of American Chemical Society].
FIGURE 5. Intensity of solvent cluster response as a function of molefraction methanol for various methanol/water mixtures. Even at verylow mole fractions of methanol, the ESI response is predominantly thatof methanol clusters, which have higher gas-phase PA than do waterclusters [Reprinted from Amad et al., J Mass Spectrom, 2000, 35:784–789 with permission of John Wiley & Sons, Ltd.].
ELECTROSPRAY IONIZATION MASS SPECTROMETRY &
367

will be analyzable with ESI. Therefore, it is important tochoose a solvent with a lower gas-phase proton affinitythan the analyte of interest when performing analyses withESI-MS. Low proton affinity is not so much a problem inthe ESI analysis of proteins and peptides, because theytend to have very high gas-phase basicities. However, itcould be a consideration in the analysis of organiccompounds that are more weakly basic in the gas phase.
4. Ionization Through ElectrochemicalOxidation or Reduction
As explained in the introduction, electrochemical oxida-tion or reduction must occur in ESI (Van Berkel,McLuckey, & Glish, 1992) to create a concentration ofoxidized or reduced species equivalent to the concentrationof excess charge created by charge separation. Electro-chemical reactions can convert an uncharged analyte to anionic form that is amenable to ESI, and are thus utilized as aform of ionization in some cases (Van Berkel et al., 1998).However, electrochemical reactions can be deleterious ifthey consume analyte in a destructive way, produceions that add to the mass spectral background, or out-compete the analyte for the excess charge. In most cases,because only a fraction of the excess charge is converted toionized analyte, the chemical change in the sample dueto this process can be much greater than the analyteconcentration.
Electrochemical reactions can change the oxidationstate of the analyte, oxidize the metal contact, and/oroxidize or reduce the solvent. Electrochemical productsare often not observed in positive ion analysis when theirproducts are metallic cations such as Fe2þ (from oxidationof the stainless steel contact) (Van Berkel, 1998). Thesemetal cations prefer to be solvated and are thus noteffective competitors for the excess charge (see AnalyteCharacteristics section). In cases where deleteriouselectrochemical reactions are a problem in ESI, replacingthe stainless steel capillary or contact with one made of adifferent metal can significantly alter the electrochemistrythat occurs, thus changing the nature of the electroche-mical products (Kertesz & Van Berkel, 2001). Changes inelectrode geometry can also effect the nature of theelectrochemical products by altering mass transport andcurrent density characteristics (Van Berkel, 2000).
B. Analyte Surface Activity and ItsEffect on ESI Response
In the previous section, we discussed how selectivity occursin ESI-MS because only analytes that can be charged canbe analyzed mass spectrometrically. However, there issignificant diversity in ESI response even among chargedspecies. Referring back to Figure 2, the Csþ and the
DTMAþ are both positively charged species, yet their ESIresponses are considerably different. This variation in ESIresponse among charged species arises due to differencesin analyte structure.
It is generally true that analytes with high affinity forthe surface of ESI droplets (surface-active analytes) havehigher ESI response (Iribarne, Dziedzic, & Thomson,1983; Fenn, 1993; Tang & Kebarle, 1993a,b; Karplus,1996; Cech & Enke, 2000; Tang & Smith, 2001; Zhou &Cook, 2001; Cech, Krone, & Enke, 2001a). This effect wasinitially observed by Iribarne, Dziedzic, and Thomson,the pioneers of the ‘‘ion evaporation theory’’ (Iribarne,Dziedzic, & Thomson, 1983), who observed an increasedresponse with atmospheric-pressure ion-evaporation massspectrometry (API-MS) for nonpolar analytes. Iribarneet al. suggested that this enhanced response was a result ofthe fact that the nonpolar ions would prefer the droplet airinterface, and thus would reside at the droplet surface.Consequently, these ions would enter the gas phase morereadily than those in the droplet interior and have higherresponse.
Kebarle and Tang expanded on the ion-evaporationtheory, and developed a comprehensive theory that des-cribes ESI response in terms of the evaporation rate fromESI droplets (Tang & Kebarle, 1991, 1993a,b; Apffelet al., 1995). They studied a variety of metal cations (suchas sodium, lithium, cesium, and potassium) and alkylammonium cations (such as tetraethyl ammonium, tetra-pentylammonium, etc.) and observed a higher ESIresponse for those cations that were less solvated (Tang& Kebarle, 1993). This higher response was rationalizedbased on the fact that less highly solvated ions wereexpected to have higher evaporation rates and thus tobe more responsive in ESI analysis. When studying morecomplex molecules like the drugs cocaine and heroine,Kebarle and Tang found that the ESI response could notbe described in terms of evaporation rates alone, andthat the additional factor of surface activity had to beconsidered (Tang & Kebarle, 1993).
The equilibrium-partitioning model (Enke, 1997;Constantopoulos, Jackson, & Enke, 1999; Cech & Enke,2000; Constantopoulos, Jackson, & Enke, 2000; Cech &Enke, 2001; Sjoberg et al., 2001), originally put forth byEnke (1997), rationalized the effect of nonpolar characteron ESI response without invoking ion evaporation rates.This model considered the fact that a fixed amount ofexcess charge is produced in the ESI process, and thatthis charge must necessarily reside on the surface of ESIdroplets. The interior of the droplets must be electricallyneutral, and will consist of cations and anions that balanceeach other in charge. Because neutralized analytes or ion-paired analytes would evaporate to form neutral salts,they would not be observed mass spectrometrically. Theequilibrium-partitioning model, therefore, assumed that
& CECH AND ENKE
368

only analytes that could become part of this excess chargephase on the surface of the ESI droplet would beresponsive to ESI. Thus, the more likely an analyte is toexist as part of the excess charge, the higher its ESIresponse will be.
1. Surface Activity and the Fissioning Process
The process of generating ions from electrospray involvesmultiple steps of fissioning and evaporation. This fissioningprocess has been documented photographically, and it iswell known that when the parent droplet reaches theRayleigh limit and fissions, multiple, small, highly chargeddroplets are formed (Fig. 6) (Gomez & Tang, 1994). Whatis not known is exactly how many times the parent dropletfissions, and whether the ions produced by the offspringdroplets result from successive fissioning events or fromdirect ion-evaporation. However, it is generally acceptedthat the offspring droplets produced in the ESI process arethe major source of ions observed in ESI mass spectra(Gomez & Tang, 1994; Tang & Smith, 1999, 2001).
It has been shown that when ESI droplets fission,the parent droplet retains a smaller fraction of its chargethan its mass (Taflin, Ward, & Davis, 1989). Because it isthe surface layer of the parent droplet that extends intoa cone and breaks up into offspring droplets, it is reason-able to assume that surface active analytes will followthe charge during fissioning and that analytes with lowsurface activity will not. Thus, the offspring droplets,which are enriched in the excess charge, will also beenriched in the surface-active analytes. This phenomenonwas demonstrated experimentally by Tang and Smith
(2001), who photographed fluorescent species depositedon a metal counter electrode by an ESI spray. Theyshowed that the outer ring of the ESI spray, which consistsof the lighter offspring droplets, is enriched in surfactant,whereas analytes that are not surface-active are equallydistributed throughout the ESI spray.
The net result of this uneven fissioning of ESI dropletsis that, if analytes that are not surface-active do not end upin these offspring droplets, then they may not be chargedin the ESI process. This failure to charge analytes in thedroplet interior can occur even if there is plenty of excesscharge in the initial parent droplets. Experimental evid-ence for this assertion comes from comparing the elec-trospray ionization response of solvophillic species andsurface-active species, using conventional ESI and nano-spray. Oligosaccharides and glycosides, which have poorresponse with conventional ESI due to their low surfaceactivity, can be quite responsive in nanospray analysis(Bahr et al., 1997; Karas, Bahr, & Dulcks, 2000).According to Karas et al., the better response observedwith nanospray analysis can be explained by the fact thatthe droplets generated with nanospray are already smallenough to produce gas-phase ions directly, without rely-ing on fissioning (Karas, Bahr, & Dulcks, 2000). Thus,analytes with poor surface activity are not lost in thefissioning process, but become charged in the initialnanospray droplets, which have very high surface-to-volume ratios. Ultimately, the uneven fissioning of massand charge is another explanation for the enhancement inresponse of surface-active analytes as compared to thosethat are less surface-active (Kebarle & Peschke, 1999;Cech & Enke, 2001; Zhou & Cook, 2001). This effect maycompound other effects such as the partitioning withinthe ESI droplet and make surface activity even moreimportant in determining ESI response (Cech & Enke,2001).
2. Predicting ESI Response from Other Parameters
The fact that surface-activity affects ESI response meansthat various parameters related to analyte structure can beused to predict suitability for analysis with ESI. ConsiderFigure 7, which is a mass spectrum of an equimolar mixtureof six tripeptides with different C-terminal residues (Cech& Enke, 2000). It is obvious that the peaks in the massspectrum are most intense for the peptides that have themost nonpolar (hydrophobic) side-chains. The electro-spray response increases as the side chains progressfrom glycine to phenylalanine, but the response for thepeptide with tyrosine as its C-terminal residue is lowerthan that for the phenylalanine-containing peptide, due tothe polar OH group on the phenyl ring in tyrosine. Thesedata are in agreement with the results of Zhou and Cook,who showed that response is significantly higher for the
FIGURE 6. Photograph of a charged droplet in the act of fissioning.The droplet distorts, creating a miniature Taylor cone, and a string ofoffspring droplets are ejected [Reprinted from Gomez & Tang, PhysFluids, 1994, 6:404–414 with permission of American Institute ofPhysics].
ELECTROSPRAY IONIZATION MASS SPECTROMETRY &
369

nonpolar amino acid phenylalanine than for the polaramino acid serine (Zhou & Cook, 2001). Raffaelli & Bruins(1991) also documented lower ESI response to be asso-ciated the presence of nonpolar groups as part of the analytestructure.
There are several different accessible variables relatedto analyte polarity that can be correlated with ESI re-sponse (Cech & Enke, 2000; Cech, Krone, & Enke,2001a). There is a relatively linear relationship betweenESI response and of nonpolar surface area (calculatedfrom literature values (Karplus, 1996)) of the peptide(Cech & Enke, 2000). ESI response can also be correlatedwith Gibbs free energy of transfer from nonpolar to polarsolutions. Analytes with higher Gibbs free energy oftransfer (more nonpolar analytes) tend to have higher ESIresponse (Cech & Enke, 2000). Furthermore, it has beenshown that for simple, singly charged analytes, a relation-ship exists between HPLC retention time and ESI re-sponse (Cech, Krone, & Enke, 2001a). The nonpolaranalytes, which have a higher ESI response, are alsoretained longer in reversed phase HPLC (Cech, Krone, &Enke, 2001a) (Fig. 8). The relationship between ESIresponse and HPLC retention time for larger, multiplycharged peptides and proteins has yet to be determined.However, it has been shown that the ESI response is
higher for larger peptides that have a significant number ofnonpolar residues than for those that are more polar (Cech,Krone, & Enke, 2001b).
C. The Role of Analyte pKa and Solvent pH
Under circumstances where ionization in ESI involvesprotonation or deprotonation, one might expect the pKa’s ofanalyte functional groups to play an important role in anESI response. However, this is not always the case.Certainly, in order for an analyte to become protonatedwith ESI, it must be basic in solution or in the gas phase.The same is true for acidic analytes and deprotonation.Furthermore, ESI analysis of basic analytes generallyworks best at low pH’s, whereas the analysis of acidicanalytes is best accomplished at higher pH’s (Wang &Cole, 1997). However, it is well known that protonated ionsof basic analytes can be observed, when ESI-MS analysis isperformed with basic solutions (where the pH is higherthan the analyte pKa) (Kelly et al., 1992; Wang & Cole,1994; Zhou & Cook, 2000) and deprotonated ions can beobserved in the ESI analysis of acidic solutions (Wang &Cole, 1994; Zhou & Cook, 2000). For example, Figure 9shows a mass spectrum of a polypeptide in a basic(pH¼ 10) solution (Kelly et al., 1992). Positive (Fig. 9a)
FIGURE 7. Mass spectrum of an equimolar mixture of six tripeptides that have different C-terminalresidues. ESI response increases in proceeding from G-G-G to G-G-F as the side chain on the C-terminalresidue becomes increasingly nonpolar (see structures in boxes). The ESI response of the peptide G-G-Yis less than that of G-G-F due to the addition of the polar OH group on the phenyl ring [Reprinted fromCech & Enke, Anal Chem, 2000, 72:2717–2723 with permission of American Chemical Society].
& CECH AND ENKE
370

and negative (Fig. 9b) ions were both detected, even thoughone would not expect protonation of the basic amino acidsat such a high pH.
Many explanations have been put forth for thisphenomenon. Quite simply, a fixed amount of excesscharge dictated by the solution flow rate, and the appliedvoltage is produced in the ESI process (Enke, 1997). Thisexcess charge must be carried by some species on thedroplet surface. In the case of positive ion ESI in proticsolvents, the excess charge is in the form of protons, theconcentration of which depends not on the solution pH buton the flow rate and applied voltage. These protons mustreside either on the analyte or the solvent. Provided thatthe analyte partitions to the droplet surface and has a pKa
lower than that of the solvent, it will become protonatedeven if it’s pKa is below the solution pH. Whatever chargedoes not go to the analyte will go to the formation ofprotonated solvent molecules or clusters.
The possibility of analyte molecules being protonatedonce they have left the solution is also important. Gas-phase proton-transfer reactions with strong gas-phaseacids such as ammonia or with protonated solvent mole-cules may lead to the protonation of species that arereleased from the droplets as neutrals (Wang & Cole,1997; Zhou & Cook, 2000). It is also possible for positive
ions to be formed through corona discharge in neutral orbasic solutions of high ionic strength (Zhou & Cook,2000).
Further complications in attempting to establish acorrelation between solution pH and analyte pKa resultbecause the pH of the electrospray droplets may be con-siderably different from that of the bulk solution. In somesituations, the generation of protons through the electro-lytic oxidation of water in positive ion ESI can decreasethe droplet pH by as much as four pH units (Van Berkel,Zhou, & Aronson, 1997). Furthermore, the aforemen-tioned uneven fissioning of mass and charge from parentdroplets to offspring droplets may cause the offspringdroplets (the major source of ions) to be significantlyenriched in protons as compared to the parents (Kebarle &Ho, 1997).
D. Improving ESI Response Through Derivatization
In the previous sections, we have outlined the charac-teristics that make an analyte amenable to analysis byESI-MS. The analyte must already be in its ionic form in thesolution phase, or be chargeable through adduct formation,electrochemical reactions, or gas-phase reactions. Further-more, analytes most responsive to ESI analysis will havesignificant nonpolar regions, which give them a highaffinity for the surface of the ESI droplet. Derivatizationreactions enhance the ESI response of an analyte, either bymaking it more easily charged (Colton, Traeger, & Harvey,1992; Hiraoka et al., 1992; Wilson & Wu, 1993; Van Berkel& Asano, 1994; Matsuura & Takashina, 1998; Van Berkelet al., 1998; Van Berkel, Quirke, & Adams, 2000) or byincreasing its surface activity (Che et al., 1999; Watervalet al., 2000; Cech, Krone, & Enke, 2001b).
Most derivatization reactions for ESI introduce char-geable groups onto neutral molecules. For example, VanBerkel and coworkers have shown that neutral organicmolecules such as alkenes, alkynes (Van Berkel, Quirke,& Adams, 2000), aromatics (Van Berkel & Asano, 1994),alkyl halides, alcohols, phenols, thiols, and amines(Quirke, Adams, & Van Berkel, 1994) can be derivatizedby the addition of various functional groups. These func-tional groups facilitate ion formation through sodiumadduct formation or protonation. An alternative method ofderivatization that facilitates charging involves introdu-cing electrochemically reactive functional groups into themolecular structure (Van Berkel et al., 1998). Ionization isaccomplished for the derivatives through electrochemicaloxidation or reduction. An example of this approach isshown in Figure 10, where a non-responsive analyte(cholesterol) has been converted to its ferrocenecarbamateester. The molecular ion of the derivitized cholesterol canbe clearly seen at an m/z value of 613 (Van Berkel et al.,1998).
FIGURE 8. Response as a function of experimental retention timefor the same tripeptides shown in Figure 7. Isocratic analyses wereperformed in a solvent of 65:35 water:methanol, 0.5% acetic acid.Retention time and response were both calculated relative to G-G-G(responses of all other peptides were divided by that of G-G-G and theretention time of G-G-G was subtracted from the other retentiontimes). The general trend in the data is that, as retention time increases,so does ESI response [Reprinted from Cech, Krone & Enke, AnalChem, 2001, 73:208–213 with permission of American ChemicalSociety].
ELECTROSPRAY IONIZATION MASS SPECTROMETRY &
371

Nonpolar groups can be added to non-responsiveanalytes to increase their droplet surface affinity andenhance their ESI response. For example, oligosacchar-ides, which are quite hydrophilic in their free form, arenot particularly well suited for conventional ESI analysis(Burlingame, 1996). However, when they are modified byreductive amination with hydrophobic species prior toanalysis by ESI, significant improvements in response canbe accomplished (Okamoto, Takahashi, & Doi, 1995;Yoshino et al., 1995). Okamoto et al. demonstrated a5,000-fold improvement in the ESI response of theoligosaccharide maltopentaose by reacting it with thederivatizing agent trimethyl-( p-aminophenyl )ammonium(TMPA). It is worth noting that this derivatizing agentincreases the proton affinity and the hydrophobicity ofthe oligosaccharide; thus, the improvement in ESI respon-siveness is due to a combination of these effects. The
use of derivatizing agents that only increased the hydro-phobicity and not the proton affinity of the oligosac-charide only resulted in an increase in ESI response ofapproximately 500-fold (Okamoto, Takahashi, & Doi,1995).
Most of the literature in ESI has focused on makingsmall modifications in analyte structure to improve ESIresponse. An alternative approach is to bind a smallorganic analyte with a much larger molecule such as apeptide (Cech, Krone, & Enke, 2001b). This approachsignificantly improves the responsiveness of small organicmolecules because peptides, which can be multiply char-ged and can contain many nonpolar amino acid sidechains, are highly responsive to analysis by ESI. Further-more, the signal-to-noise ratio for the analyte can beimproved because the mass of the adduct is shifted out ofthe low-mass region of the mass spectrum—a region that
FIGURE 9. ESI mass spectra of equine myoglobin in 50% methanol, 50% water solution at pH 10.Spectrum (a) was collected in the positive ion mode and spectrum (b) in the negative ion mode. Despitethe fact that the solution pH is well above the pKa’s of the basic amino acids, protonated protein ions areclearly observed [Reprinted from Kelly et al., Org Mass Spectrom, 1992, 27:1143–1147 with permissionof John Wiley & Sons, Ltd.].
& CECH AND ENKE
372

is typically complicated by the presence of solvent clustersand other contaminants. An example of that approach isdemonstrated in Figure 11, which shows the ESI massspectrum of 1,3-butadiene diepoxide bound to the peptide
Leu-enkephalin-Arg-Arg (Cech, Krone, & Enke, 2001b).The epoxide is completely non-responsive to ESI analysisalone, but the peptide-bound adduct can be clearly ob-served at the characteristic shift of 43 in m/z.
IV. THE WORKING CURVE AND DYNAMIC RANGE
Ideally, the working curve obtained when quantitativeanalysis is performed with ESI is linear over three to fourorders of magnitude. Such a curve is demonstrated inFigure 12. Deviations from linearity occurs at high con-centrations (usually around 10�5 M (Tang & Kebarle,1993; Zook & Bruins, 1997; Cech & Enke, 2000)) asresponse becomes saturated, and at low concentrations dueto background interference. In the next section, we discussthe potential sources of limitation at the high and low endsof the ESI working curve, and present some potentialmethods to improve the linear dynamic range of ESIanalysis.
A. Detection Limits With ESI
1. Background Interferences
Chemical noise is a significant source of backgroundinterference in ESI mass spectra (Ramsey, Goeringer, &
FIGURE 10. ESI mass spectrum of a ferrocenecarbamate ester ofcholesterol. Cholesterol alone is non-responsive to ESI analysis, butthis derivative is ionized electrochemically by ESI, and the derivatizedmolecular ion at m/z 613 (corresponding to the mass of thecholesterolþ 277) can clearly be seen. The smaller peak at m/z 245corresponds to a fragment (ferrocenecarbamic acid) of the parent ion,which is formed in the interface region of the ion trap massspectrometer. [Reprinted from Van Berkel et al., Anal Chem, 1998,70:1544 with permission of American Chemical Society].
FIGURE 11. Mass spectrum of Leu-Enkephalin-Arg-Arg and theadduct of this peptide with 1,3-butadiene diepoxide (BDO2). Theadduct appears at a mass shift of 43, half the molecular weight ofBDO2, because the peptide it reacts with is doubly charged [Reprintedfrom Cech, Krone and Enke, Rapid Commun Mass Spectrom, 2001,15:1040–1044 with permission of John Wiley & Sons, Ltd.].
FIGURE 12. Typical ESI calibration curve generated on a TSQ 7000triple quadrupole mass spectrometer. The analyte is the surface-activetrimethyldecylammonium cation, dissolved in a solution of 50% water,50% methanol, 0.5% acetic acid. Deviations in linearity are observed atthe low end due to background interference, and at the high end due tosaturation in ESI response.
ELECTROSPRAY IONIZATION MASS SPECTROMETRY &
373

McLuckey, 1993; Purves, Gabryelske, & Li, 1998;Guevremont et al., 2000). This chemical noise is fixed-pattern noise, manifested at specificm/z ratios and resultingfrom the mass analysis of charged species other than theanalyte. Just like the analyte, the interfering species mustbecome charged by one of the mechanisms discussedearlier. Thus, interferences are either ions or salt adducts inthe electrospray solution, species generated electrochemi-cally, or neutral species present in the atmosphere aroundthe ESI spray that are charged in the gas phase by protontransfer.
Protonated, sodiated, or ammoniated solvent clustersare often observed in ESI mass spectra, and tend to be aparticularly prevalent source of interference at low masses.Because the solvent is more volatile than the ESI analyte,it is usually possible to reduce the mass spectral responseof solvent clusters by heating the electrospray dropletsbefore they enter into the high vacuum region of the massspectrometer. Heating can be accomplished with a heatedcapillary interface and/or a heated nitrogen bath gas(Bruins, 1997). It has the additional benefit of decreasingthe abundance of solvent-analyte clusters, and thus furthersimplifying the mass spectrum.
2. Random Noise
An observation of a mass spectrum obtained with ESI-MSreveals some sort of background noise at virtually everym/z value. This ubiquity of noise throughout the massspectrum suggests that there must be a source of randomnoise in ESI-MS; that is, noise for which there is an equalprobability of occurrence at every m/z value. The sourcesof random noise in ESI-MS have yet to be determined.We speculate that one possible source of random noise isthat a fraction of the ions produced in the ESI process mayreach the detector without going through the mass analysisprocess. For these ions, mass spectral response would notbe a function of m/z values, because they would arrive atthe detector at times that are not correlated to the m/zsetting of the mass analyzer. However, the mechanism bywhich ions would reach the detector without undergoingmass selection is not clear, and may differ, depending onthe type of mass analyzer used (i.e., ion trap versus triplequadrupole, etc.).
Another potential source of random noise is thepassage of large, highly charged clusters of analyte andsolvent through the mass analyzer. Under conventionalESI conditions, some ESI droplets may not desolvatecompletely, and thus highly charged solvent/analyte/coun-terion clusters may be formed (Mann, Fenn, & Wong,1990). These clusters might impact the deflector plate onthe detector and create a shower of fragments with variousm/z values (Voyksner, 2001).
3. Ion Transmission and Sensitivity
Although background noise is often the limiting factor indetermining the lower limit of the linear dynamic rangewith ESI, sensitivity, which is defined as the slope ofthe working curve, is also important. Sensitivity in ESImay be determined by one of two factors, the efficiency bywhich molecules are converted into gas-phase ions and theefficiency by which these gas-phase ions are transferredthrough the various stages of the mass spectrometer anddetected. The fraction of the ions produced that are actuallyanalyzed will depend not only on the quality of the iontransfer optics (Shaffer et al., 1999) in the mass spectro-meter, but also on the type of mass analyzer and the way inwhich it is used. For example, ion trap instruments providefull-spectrum analysis with higher sensitivity than quadru-pole instruments (Voyksner, 1996) because they employbatch processing, but a quadrupole instrument operated inselected ion monitoring (SIM) mode may have the highestsensitivity for a single analyte. In general, higher sen-sitivity in an ESI analysis is better. Higher sensitivityanalyses require fewer scans to be averaged in order toobtain a clean spectrum. Thus, less time is needed in orderto accomplish the analysis, and less sample is consumed.In situations where chemical noise is not limiting, im-provements in sensitivity will also result in improvementsin detection limit.
The issue of just how efficient the ESI process is atcreating gas-phase ions is still somewhat under debate.It is generally accepted throughout the literature that thelimiting factor in sensitivity with ESI is not the ionizationprocess itself but the transfer of the ions through the massspectrometer (Mann, Fenn, & Wong, 1990; Zook &Bruins, 1997; Shaffer et al., 1999). This ion transferprocess can result in an ion loss on the order of four to fiveorders of magnitude (Mann, Fenn, & Wong, 1990; Zook &Bruins, 1997). However, this conclusion is inherently dif-ficult to support, because ions cannot be measured directlyas they leave ESI droplets.
Smith et al. agree that ion transmission limits thesensitivity of ESI, and have sought to improve the effi-ciency of ion transfer from the source to the mass analyzerof triple quadrupole mass spectrometers. Their innova-tions for improved ion transmission include an ‘‘ionfunnel’’, which consists of multiple ring electrodes ofdecreasing diameter (Shaffer et al., 1999; Belov et al.,2000; Kim et al., 2000a; Kim, Udseth, & Smith, 2000b),and a multi-capillary inlet (Kim, Udseth, & Smith,2000b), a device similar to Thermo Finnigan’s heatedcapillary, but with multiple inlets rather than only one.With the combination of the multi-capillary inlet and theion funnel, Kim et al. have been able to accomplish iontransmission 23-times higher than that with conventionalESI ion optics (Kim, Udseth, & Smith, 2000b). Using this
& CECH AND ENKE
374

configuration, Kim et al. report the ability to detect 3–4%of the ions originally produced from the ESI solution;that detection efficiency is comparable to that reportedfor nanospray analysis (Wilm & Mann, 1996; Geremanos,Freckleton, & Tempst, 2000).
Another route to improve the sensitivity of ESI-MSmay be to improve the efficiency of charging ESI analytes.One method to improve efficiency is to implement mul-tiple ESI sprayers rather than just one. In their initialexperiments using multiple sprayers to accomplish ESI,Kostiainen and Bruins showed that the upper limit of thedynamic range in ESI is limited not by the mass of analyte(the amount) but by its concentration. They observed thatthe upper limit in linearity of ESI calibration curves isreached at the same analyte concentration, even if twoESI spray capillaries are used simultaneously to producecharged droplets for mass analysis (Kostiainen & Bruins,1994). Making use of this fact, Tang et al. have developeda microarray of electrospray emitters that enables multiplestable Taylor cones, all emitting droplets, to be generatedsimultaneously (Fig. 13). The use of this microsprayemitter facilitates operation at higher flow rates and higherspray currents, and a 2–3 fold increase in sensitivity ascompared to single spray electrospray has been demon-strated (Tang et al., 2001).
B. Sources of Signal Saturation at HighConcentrations
1. Limited Amount of Excess Charge
Several theories have been proposed for why ESI res-ponse is limited at high concentrations. Kebarle and Tangoriginally suggested a limitation in ESI response at highconcentrations to be a result of an upper limit in the amountof analyte that can be charged in the ESI process (Tang &Kebarle, 1993a,b). Enke expanded on this assumption,pointing out that, because a fixed amount of excess chargeis available on ESI droplets at the point at which the analyteconcentration exceeds the excess charge concentration, itsESI response should level off (Enke, 1997). However, onlyin situations where the charging of analyte is completelyefficient will the upper limit in the calibration curve cor-respond exactly with the point at which the analyte con-centration exceeds the concentration of excess charge.If all of the analyte is not being charged, then presumablythe ESI response can increase even after the analyticalconcentration of analyte exceeds the concentration of ex-cess charge. Nonetheless, if no other factors were involved,then one would expect to see the saturation in the ESIresponse due to charge limitation occur at some point afterthe analyte concentration becomes greater than the excesscharge concentration.
Bruins et al. performed experiments that led them toconclude that saturation in the ESI response is not a resultof charge limitation (Kostiainen & Bruins, 1994, 1996;Bruins, 1997; Zook & Bruins, 1997). They observed thatthis saturation occurred at approximately the same analyteconcentration regardless of the electrolyte concentrationand applied voltage. We have made similar observationsthat, despite changes in flow rate or applied voltage, whichshould affect the concentration of excess charge on dropletsurfaces, approximately the same saturation point is ob-served in ESI calibration curves generated for surface-active organic molecules. However, it is worth mentioningthat, because all of the experimental parameters affect thestability of ESI operation, it is difficult to change one (i.e.,applied voltage) without changing others (i.e., flow rate).Furthermore, changes in applied voltage that are sig-nificant enough to profoundly affect the available amountof excess charge are difficult to accomplish while stillmaintaining stable ESI operation.
2. Limited Space on Droplet Surfaces
An alternative reason for response limitation at highconcentrations was proposed by Bruins and coworkers(Kostiainen & Bruins, 1994, 1996; Bruins, 1997; Zook &Bruins, 1997). They suggested that, at high analyte con-centrations, the ESI droplets become so saturated withanalyte that their surfaces are completely filled, and that ionejection becomes inhibited because ions are trapped withinthe droplet interiors. In support of this hypothesis, Bruinspresents calculations that compare the surface area of ESI
FIGURE 13. Photograph of nine electrospray Taylor cones on amicrofabricated emitter array. Charging of the ESI solution is moreefficient with multiple Taylor cones than with just one [Reprinted fromTang et al., Anal Chem, 2001, 73:1568–1663 with permission ofAmerican Chemical Society].
ELECTROSPRAY IONIZATION MASS SPECTROMETRY &
375

droplets with the area taken up by small organic moleculesthat might reside on their surfaces. These calculations showthat, in theory, when 10�5 M solutions are used, the dropletsurface could be completely covered after several fission-ing steps (Bruins, 1997). Experimental evidence doesindeed show that proton-bound dimers (clusters of ionswith neutral ion/counterion pairs) are observed in ESI athigh analyte concentrations but not at lower concentrations(Zook & Bruins, 1997). Because these proton-bounddimers could be caused by increased molecule-moleculeinteractions on the droplet surface, the fact that they areobserved primarily at high concentrations may indeedindicate that saturation of the droplet surface is takingplace.
3. Suppression and Competition at High Concentrations
When operating in the saturation region of the ESIcalibration curve, the responses of some analytes will besuppressed. This suppression effect was demonstrated byTang & Kebarle (1993), who showed that, at high con-centrations of ammonia, the response of the cesium cation(Csþ) was suppressed ten-times more than that of thesurface-active tetrabutyl ammonium cation (TBAþ). Theyexplained this observation based upon the fact that Csþ,being more solvated, is expected to evaporate more slowlyfrom the ESI droplet than TBAþ. Experiments perfor-med in our laboratory have shown that the response ofsolvophilic analytes (analytes that prefer to be solvated)can be suppressed drastically in the presence of very highconcentrations of surface-active analytes, but that theresponse of the surface-active analytes is not affected byhigh concentrations of solvophilic analytes (Cech & Enke,2000). Similarly, in studying factors that affect suppressionin the ESI response, Bonfiglio et al. (1999) concluded thatanalyte characteristics were of key importance, citing thefact that they observed their most polar analyte to undergothe most suppression in its ESI response.
Our results, as well as those of Bonfiglio and Tang,could be explained based upon a competition for a limitedresource, either space or charge. Surface-active analyteswould be expected to out-compete polar analytes for thelimited excess charge and/or space on the droplet surface.Thus, in the suppression region of the ESI calibrationcurve, surface-active analytes should suppress the res-ponse of more polar analytes (Cech & Enke, 2000).Regardless of the mechanism for suppression, it is impor-tant to keep in mind that in the high concentration range,competition and suppression will occur with solutionsthat contain multiple analytes. For this reason, dilutingthe sample, performing chromatographic separations,or eliminating any solvent additives responsible for sup-pression may be necessary to accomplish successfulanalyses.
C. Improving the Detection Limit and LinearDynamic Range
1. Extending to Higher Concentrations
Extension in the high end of the linear dynamic rangecould be highly advantageous for improved quantitativeanalysis with ESI-MS. The difficulty here lies in the factthat the reason for a limitation in the ESI response at highconcentrations is still not fully understood. In actuality, thislimitation in response is most likely due to a combinationbetween instrumental factors and perhaps some funda-mental limitation in the ability to produce a charged analytein the ESI process. Thus, possible ways to extend the lineardynamic range to higher concentrations might include amore efficient charging of gas-phase analyte molecules,evaporating ESI droplets more effectively, or improvingion transmission through the mass spectrometer. However,instrument companies and researchers have explored manyavenues to improve the efficiency of ESI and, as yet, havehad little affect on the upper limit of the linear dynamicrange. The creation of smaller-diameter droplets throughnanospray techniques (Wilm & Mann, 1996; Karas, Bahr,& Dulcks, 2000) and the use of various pneumatic(Hopfgartner et al., 1993; Kostiainen & Bruins, 1996) orpiezoelectric (Hager et al., 1994) nebulization techniquesand heated bath gases have all failed to extend the limits inthe linear dynamic range much above analyte concentra-tions of approximately 10�5 M for surface-active analytes.
2. Extending to Lower Concentrations
There is keen interest within the ESI community to ex-tend the capabilities of ESI-MS to allow for the analysis oflower analyte concentrations. In many types of biologicalanalysis, sample size can be severely limited, and thusbetter detection limits with ESI-MS would be highlyadvantageous. We have already discussed methods thathave been employed to improve the sensitivity of ESI-MS.However, when a detection limit is limited by chemicalinterference, improvements in sensitivity will have littleaffect on the lowest analyte concentration that can bedetected. In order to improve the detection limit (in terms ofanalyte concentration), it is necessary to eliminate thechemical noise by improving the selectivity of the analysis;i.e., eliminating the chemical noise. When noise is nolonger limiting, increases in sensitivity will improve thedetection limit.
When a triple-quadrupole mass spectrometer is used,selected-reaction monitoring can be employed to improvethe selectivity of the analysis. Selected-reaction monitor-ing is accomplished through MS–MS analysis, such thatonly ions that produce a particular fragment ion areselected. In this way, interfering ions that have the same
& CECH AND ENKE
376

m/z ratio as the precursor ion, but do form the samefragment ions, are eliminated. Most quantitative analysisexperiments with ESI-MS that require very low detectionlimits are accomplished with selected reaction moni-toring. However, this technique only works for targetedanalysis, in which the m/z ratio of the precursor ion isknown. To identify an unknown species, the entire massspectrum must be scanned, and the ability to eliminateinterferences and thus facilitate detection of species ofinterest in this process is key.
In attempting to improve the capabilities for analysiswith ESI-MS in the low-concentration range of the cali-bration curve, we confront the same issues as in the high-concentration range of the calibration curve. The sourcesof the limitation, in this case random and fixed patternnoise, are still not completely understood. Ultimately, abetter understanding of the factors that contribute to noisein ESI mass spectra may be the key to improving detectionlimits. For this reason, continued studies into the sourcesof noise in ESI are highly relevant.
V. INSTRUMENTAL PARAMETERS AND STABILITY
Microscopic inspection indicates that the ESI spray isstable when the Taylor cone has a constant shape, and whenthere is a steady stream of droplets issuing from it (Rollgen& Juraschek, 1998) (the cone-jet mode of operation)(Cloupeau & Prunet-Foch, 1989). Unstable operation ischaracterized by the formation of blobs of liquid at the tipor by multiple and gyrating jets of liquid emanating from it(Rollgen & Juraschek, 1998). In general, ESI operatorsprefer to operate in the stable cone jet mode, where the ESIcurrent is the most reproducible. Several variables thataffect the stability of ESI operation and the ability toachieve stable and effective spray conditions include theapplied voltage (Vapp), the nebulizing gas flow rate, thedistance between the spray capillary and the counterelectrode, and the solution flow rate (G), viscosity, anddielectric constant (De La Mora & Loscertales, 1994; Chen& Pui, 1997). The results described below show that thespray is stable when a steady cone can be observed, whenthere are no spikes or pulses of current in the externalcircuit, and when operating in the constant current sectionof the ESI gap’s current–voltage curve. Measurements ofthe current–voltage curve have been useful in demonstrat-ing why stable sprays are difficult or impossible to obtainwith certain solvents and operating conditions.
A. Current–Voltage Curves
The electrical characteristics of any device (excludingcapacitance and inductance) can be defined by its current–voltage curve, which plots the current through the device
(Y axis) as a function of the voltage across it (X axis). Theelectrospray gap has been characterized as a constant-current device (Van Berkel & Zhou, 1995). The current–voltage curve for a constant-current device is a horizontalline, which indicates a current that is independent ofthe voltage across the device. This constant current modelhas been tested by the experimental determination of thecurrent–voltage curve (Jackson & Enke, 1999).
A typical current–voltage curve for a 100 mm stain-less steel capillary with a solution of 0.5% acetic acid inmethanol is shown in Figure 14 (solid line with squaredata points). The voltage plotted is the voltage across thegap (Vgap). The approximate shape of this curve is that ofa step with a relatively steep rise in current at the lowervoltage, a relatively constant current in the middle, anda steep rise in current at the higher voltages. The threeregions of the current–voltage curve correspond to threemodes of ESI operation. Only in the relatively constantcurrent region do we observe a stable Taylor cone andan orderly generation of charged droplets. In the highercurrent region, multiple cones and jets appear and thedroplet ejection is in rapidly changing off-axis directions.In the low voltage, low current region, the Taylor coneforms briefly, ejects a droplet stream, and collapses againin relatively reproducible cycles (Fig. 15).
FIGURE 14. Current–voltage curves generated for acidified solutionsthat contain various percentages of methanol. The lines are drawnthrough the constant-current regions of the current–voltagediagrams for 100, 75, and 50% methanol solutions. The constant-current region for the 100% methanol solution spans approximately800 V, whereas for the 90% water solution it is non-existent. Thisdifference demonstrates the fact that no applied voltage will allowaccess to the stable cone-jet mode of operation in highly aqueoussolutions.
ELECTROSPRAY IONIZATION MASS SPECTROMETRY &
377

Another aspect of stable operation is the maintenanceof a steady current in the external circuit. Charge mustflow in the external circuit when new solution surface isbeing charged at the capillary tip. If there is a steadystream of newly charged droplets emitted from the tip,then the current in the external circuit will be steady. Inthe low-voltage, low-current region, the Taylor coneforms, emits droplets, and collapses. This process givesrise to pulsations in the current, which occur during theelongation of the solution at the capillary tip (Rollgen &Juraschek, 1998; Amad, Cech, & Enke, 2001), as demon-strated with the oscillogram that accompanies the photo-graphs in Figure 15. Current spikes are also associatedwith the high-voltage, high-current mode of operation.It has been suggested that a pulse detector in the externalcircuit could be used to determine when the ESI wasoperating in the stable mode (Amad, Cech, & Enke,2000).
B. Effect of Instrumental Parameters on theCurrent–Voltage Curve
It is well known that it is difficult or impossible to obtain astable spray in an aqueous solution without the addition ofmethanol or the use of pneumatic assistance. Observationof the current–voltage curve of the spray gap explains whythis stable aqueous spray is so difficult to obtain. Figure 14shows the current–voltage curve for four solvent mixturesthat range from pure methanol to 90% water. As the volumefraction of water increases, the constant current regionwhere the stable spray is observed becomes increasinglynarrow and shifts to higher voltages. This shift to highervoltages makes sense, when one considers that it is neces-sary to balance the applied voltage with the solution surfacetension in order to maintain a stable cone-jet operation. Asthe aqueous content (and thus the surface tension) of theESI solution increases, it is necessary to apply a higher
FIGURE 15. Oscillogram and photographs obtained when operating in the pulsed cone jet mode with asolution of 50% water, 50% methanol, 0.5% acetic acid. Periodic pulsations in the current give rise topeaks in the voltage–time curve. The current is observed to increase as the volume of the meniscusincreases, and to maximize when the surface tension of the liquid is overcome and a jet of liquid isejected. The current then decreases as the liquid relaxes back into a meniscus. This process repeats itselfat regular intervals (on the Hz time scale).
& CECH AND ENKE
378

voltage in order to access the cone jet mode. Unfortunately,the necessity of using higher applied voltages with solu-tions that have a higher aqueous content increases thelikelihood of electrochemical discharge.
With a solution of 90% water, the stable region inthe current–voltage curve disappears entirely (Fig. 14).The stable region of the current curve also disappearswhen very high solution flow rates are used. This disap-pearance of the stable region demonstrates the fact that,under certain experimental conditions, it is impossible toachieve stable cone jet operation at any applied voltage(Amad, Cech, & Enke, 2000). It is for this reason thatpneumatic nebulization, which decreases the reliance oncone-jet operation for droplet formation, is necessarywhen operating at high flow rates or with solutions of highsurface tension.
C. Self-Stabilizing Operation
Given the fact that stable ESI operation depends on theability to balance so many variables, maintaining stableoperation when solution conditions are changing (as withgradient elution liquid chromatographic introduction) canbe difficult. Several solutions to the difficulty of main-taining a stable spray have been developed. If the analytesolution composition is changing or if the chromatographiceffluent is not suitable for ESI, then a sheath solution isprovided concentrically at, or just before, the capillarytip (Huber & Krajete, 2000; Matz et al., 2001). Alternately,the ESI process can be allowed some additional degrees offreedom so that self-adjustment is possible. For example,if the ESI process is allowed to set the solution flow rate,then it will automatically be the correct value. This self-adjustment of flow rate can be accomplished by filling(with the sample solution) a length of tubing that leads tothe capillary. The back end of the tube is left open and noforce is applied to the solution. The ESI process pulls thesolution to the tip at the appropriate rate. This process isthe typical method by which nanospray is accomplished(Wilm & Mann, 1996).
Another way to facilitate self-adjustment is to let theESI process have some control over the voltage of the gap.A large series resistor (� 10 GO) placed between thepower supply and the contact to the ESI solution accom-plishes this goal. With this resistor, the voltage across theESI gap is the difference between the applied voltage andthe iR drop through the resistance. If the charge generationrate decreases, then the iR drop across the series resistordecreases, and the gap voltage increases to correct thechange. We have found significantly increased stabilityand a decreased tendency for arcing through the inclusionof this resistor in the circuit (Jackson & Enke, 1999;Amad, Cech, & Enke, 2000).
D. Non-Conductive vs. Conductive Spray Capillaries
The ESI capillary tip may be made of conducting ornon-conducting material. Examples of conducting capil-laries are the stainless steel hypodermic needles andmetallized glass capillaries. Non-conducting capillariesare generally made of microbore fused silica tubing,which can be ground, etched, or pulled into a tip of thedesired outer and inner diameter. A much smaller innerdiameter is practical with glass capillary than with stain-less steel. As already discussed, the smaller the innerdiameter, the lower the flow rate that can be used. Becausethe rate of excess charge production is not significantlyreduced, the concentration of excess charge is larger. Intheory, this increase in excess charge concentration couldincrease dynamic range and reduce interferences amonganalytes.
Our microscopic examination of the electrosprayprocess indicates that the liquid protruding from theelectrospray capillary expands to form a Taylor cone withits base supported by the outer walls of the spray capillary.Consequently, it is the outer diameter of the capillaryrather than its inner diameter that determines the diameterof the Taylor cone. Therefore, for the production of thesmallest droplets, it is desirable to have a very small boreand a thin wall at the capillary tip. This combination isaccomplished with microspray and nanospray sources,especially when pulled glass capillaries are used. Thedisadvantage to using these very small capillaries is theirfragile nature and tendency to clog easily (Karas, Bahr, &Dulcks, 2000).
Another difference between conducting and non-conducting capillaries is the location of the power supplyconnection relative to the capillary tip. When a conductivecapillary is used, the electrochemical reaction occurs veryclose to the tip end of the capillary. For non-conductingcapillaries, a metallic union or inserted wire some distancefrom the spray capillary tip provides the contact betweenthe power supply and the solution. The portion of thiscontact closest to the tip is the site of the electrochemicalreaction. As explained in the introduction, the extent ofoxidation (for positive ion formation) or reduction (fornegative ion formation) is equal to the total amount ofexcess charge. The electrochemical reaction at this contactnecessarily produces excess charge at the exact rate atwhich the charge separation occurs at the capillary tip.Consequently, the solution volume between the emittercontact and the capillary tip must be charged. This chargedvolume is very small in the case of conductive capillary.However, with a remote contact, the charged solutionvolume and length can be significant.
One can now consider how the excess charge will beconducted from the site of its creation (the contact) to thesite of its separation (the tip). One possible mechanism is
ELECTROSPRAY IONIZATION MASS SPECTROMETRY &
379

the flow of the solution itself. If the solution contains thecharge such that the velocity of charge flow is the sameas the velocity of solution flow, then the conductionmechanism is completely satisfied. With such a scenario,the analytical solution need not be conducting because theconductivity of the excess charge is provided entirely bythe solution flow.
Some experiments suggest that there are conditionsunder which solution conductivity is necessary (Jackson& Enke, 1999). The excess charge in the solution volumebetween the contact and the tip will be forced to theoutside walls of its container. These outside walls are thewalls of the capillary. For laminar flow, the velocity of asolution along the walls of a capillary through which itflows is less than the average solution velocity because ofthe friction between the capillary walls and the solution.This difference in velocities would cause the velocityof the charge to be less than the solution velocity. Thisresult would require that the difference between the chargeflow rate and the solution flow rate be made up by ionicconduction through the solution or by electroosmotic flowalong the capillary walls. In either case, an electrical fieldgradient between the contact and the capillary tip wouldbe required to sustain this process, and an electrolyticsolution would be required.
In summary, the use of conductive capillaries pro-vides the least complicated contact to the solution andthe shortest time for the electrolytic products to react withthe analyte solution. On the other hand, the use of dispo-sable, pulled-glass capillary tips is very attractive be-cause of the potential for small inner diameters and thedecreased tendency of arcing and electrical discharge.Remote contact may increase the requirement for elec-trolyte in the analytical solution and increase the appliedvoltage required because of the voltage drop through thesolution between the contact and the tip.
VI. SOLUTION CHARACTERISTICS
The ideal solvent composition for ESI analysis varies,depending on the application. Analysis in the positiveion mode requires different solvent characteristics thananalysis in the negative ion mode, and the response of agiven analyte can be enhanced or suppressed in differentsolvent systems. Here, we discuss which ESI solvents areideal for analysis in the positive and negative ion modes.It is important to keep in mind that it may be necessary todeviate from this ideal in order to maintain non-covalentinteractions and protein conformation, or to interface withLC gradients. However, deviations from the ideal solventcomposition may result in significant compromises in ESIperformance.
A. The Ideal ESI Solvent
As mentioned previously, the flow rate, applied voltage,conductivity, and liquid surface tension must be properlybalanced in order to accomplish the formation of a stableESI spray. Thus, an important characteristic of the idealESI solvent is that its surface tension is within the range thatfacilitates the generation of a stable spray. It is generallyeasy to create a stable spray in the positive ion mode withconductive solutions that have at least 50% of a moderatelypolar organic solvent such as methanol or acetonitrile, andwith the rest of the solvent being aqueous. As the solutionbecomes more aqueous, its surface tension increases, andit becomes increasingly more difficult to adjust the ESIparameters such that a stable spray can be achieved (see thesection on Current–Voltage Curves). On the other hand,it is also difficult to achieve stable electrospray operationwith nonpolar liquids (Drozin, 1955) such as hexane ortrichloromethane, due to their very low surface tension,high volatility, and low dielectric constant. These problemscan be circumvented to some extent with the use of pne-umatically assisted ESI. As mentioned earlier, the use ofnebulization as an aid in droplet formation reduces thereliance on the stable Taylor cone in forming chargeddroplets, and thus facilitates the use of solvents whosesurface tension and conductivity are not ideal. By allowingoperation in more aqueous solvents and at higher flowrates, pneumatic assistance can be highly beneficial wheninterfacing ESI with HPLC. However, sensitivity in termsof response per mass of analyte may decrease due to a lowerfraction of the analyte becoming vaporized.
The solvent composition in ESI analysis has impor-tant effects on the ESI mass spectrum. Firstly, backgroundin the form of solvent clusters can be a significant sourceof chemical noise. The ideal ESI solvent wouldn’t clusterto the analyte nor would it create significant amounts ofbackground in the form of solvent clusters with addedelectrolyte. Analyte mass spectral response can also bedependent on solution composition. In many cases, theESI response of typical organic analytes is higher in solu-tions with higher percentages of organic solvents (Zhou &Hamburger, 1995; Lu et al., 1996; Temesi & Law, 1999;Zook, Forsmo-Bruce, & Briem, 2000). This higher res-ponse may be a result of more efficient desolvation of theanalyte when a more volatile solvent is used and of im-proved spray stability due to decreased surface tension. Insome cases, however, organic content above about 80%can actually result in a decreased ESI response (Zhou &Hamburger, 1995). This decrease in response is likely dueto the liquid surface tension being decreased below theideal for maximum spray stability. Because spray dyna-mics are highly dependent on instrumental parameters,the percentage of organic content that maximizes ESIresponse will vary, depending on the parameters chosen.
& CECH AND ENKE
380

As discussed in the Instrumental Parameters andStability section, the conductivity of the ESI solution isimportant. ESI is generally performed with solutions thatcontain a significant concentration of some ionic species.The presence of ionic species is necessary for the processof charge separation at the tip. These species may be ionicanalyte, added electrolyte (such as acetic acid or am-monium acetate), and/or charged products of the electro-chemical reaction. Without a charge carrier to facilitatethe charge-separation process, stable spray dynamics arenot achieved, and the ion current obtained at the detectortends to fluctuate drastically.
B. Solvent Choice for Analysis in thePositive Ion Mode
The charge carrier in positive ion ESI can be a cationsuch as sodium, lithium, or ammonium, which can beadded to the solution in the form of a neutral salt (such asammonium acetate). Neutral salts are usually added tothe solution to facilitate the analysis of polar, neutralanalytes through adduct formation. However, positive ionESI is most often performed with protonated solutionsof acetonitrile/water or methanol/water. In this case, thecharge is carried by protonated solvent clusters, which arecreated by reaction of the solvent with a weak acid (such asacetic, formic, or propionic acid) that is added to thesolution. The low pH of acidic solutions has the distinctadvantage of facilitating protonation of the analyte; thus,acidic solvents are ideal for the analysis of analytes such asproteins and organic molecules that have basic functionalgroups.
C. Solvent Choice for Analysis in theNegative Ion Mode
Intuitively, one might think that negative ion mode ana-lysis could be accomplished by using the same solventsas those used in positive ion mode, but by making thesolution basic instead of acidic. Early studies of ESI-MSin the negative ion mode did just that. Ammonium hydro-xide was added to aqueous solutions to facilitate deproto-nation of acidic analytes (Loo et al., 1992). Unfortunately,negative ion mode analysis with basic methanol or watersolutions tends to be quite unstable, because stable anionsare not formed to any appreciable extent, and thus nopredominant species is created to carry the negative chargeat low analyte concentrations. As a result, the use ofmethanolic or aqueous solutions that contain ammoniumhydroxide for negative ion mode analysis generallyyields poorer detection limits and less stability than canbe accomplished with acidic solutions in the positive ionmode.
In order to accomplish more stable and successfulanalysis in the negative ion mode, it is necessary to usea solvent that creates stable anions. When halogenatedsolvents are used as electrospray solvents, they can formnegative ions through electrochemical reduction. Forexample, chloride ions are created from chloroform whenit is reduced at the electrical contact. Analyte anions areformed from this solution by proton abstraction or chlo-ride attachment (Cole & Zhu, 1999; Zhu & Cole, 2000).Recently, a mixture of hexafluoroisopropanol and metha-nol, neutralized to pH 7, gave excellent results for theanalysis of oligonucleotides in the negative ion mode(Apffel et al., 1997; Griffey et al., 1997; Huber & Krajete,2000). The fluorinated solvent creates a very stable depro-tonated anion that carries the negative charge at low ana-lyte concentrations, and at neutral pH’s, the negativelycharged oligonucleotides are favored in solution and arethus observed in ESI mass spectra. Zhang et al. recom-mend the use of 10% 2,2,2-trifluoroethanol/90% methanolfor negative ion ESI (Zhang, Cech, & Enke, 2002). Thissolvent produces the CF3CH2O� ethoxide ion and H2
gas as a result of the inherent electrochemical reductionthat occurs in the ESI process. The solvent spectrum forthis system is exceptionally clean, and facilitates detectionlimits of around 10�8 M for fatty acids and 10�7 M forpeptides. The 2,2,2-trifluoroethanol solvent system isalso effective for the analysis of oligonucleotides withoutrequiring neutralization to pH 7. The oligonucleotidecharge states achieved with the 2,2,2-trifluoroethanolsolvent are significantly higher than those achieved withhexafluoroisopropanol, likely due to the higher gas-phaseproton affinity of 2,2,2-trifluoroethanol (Zhang, Cech, &Enke, 2002).
The tendency for the occurrence of corona dis-charge is another factor that makes negative ion ESI morechallenging than positive ion ESI. Corona discharge(electrical discharge from the capillary tip (Kebarle &Ho, 1997)) results in the chemical ionization of the gas-phase analyte and solvent molecules that are present inthe space around the ESI spray capillary. An ESI massspectrum obtained during corona discharge is often cha-racterized by significant amounts of background (due toionized solvent molecules) and poor stability. Further-more, arcing tends to occur in the corona discharge mode.This arcing not only causes a loss in ESI current, but canalso damage electronic components of the mass spectro-meter. For these reasons, negative ion mode analysis isgenerally performed with electron-scavenging gases(Cole & Harrata, 1993; Straub & Voyksner, 1993) or withhalogenated solvents (Cole & Harrata, 1992; Hiraokaet al., 1992; Cole & Harrata, 1993); both suppress coronadischarge. The large series resistor discussed earlier alsosuppresses corona discharge to some extent, and elimi-nates arcing.
ELECTROSPRAY IONIZATION MASS SPECTROMETRY &
381

D. Compatibility Between ESI and LiquidSeparation Techniques
The presence of non-volatile, ionic species such asphosphate and sulfate buffers in the ESI spray is dele-terious. These non-volatile species cause salt deposits toform on the metal surfaces within the instrument and canresult in a complete loss of ion transmission. Furthermore,the issue of ion-pairing has been presented as a potentialproblem with the use of inorganic buffers (Cole & Harrata,1992, 1993; Hiraoka et al., 1992). If the anion or cationpairs too strongly with the analyte, then the analyte ionsmay be prevented from carrying the excess charge on thedroplet surfaces; as a result, the ESI response for theanalyte may be very low. For these reasons, when ESI isinterfaced to HPLC or CE, volatile buffers composed ofweak acids and bases are generally used in place of non-volatile buffers. Common choices of buffers include am-monium acetate and ammonium formate (Voyksner, 1997).
Strong acids, such as trifluoroacetic(TFA), hepta-fluorobutyric, and hydrochloric acid, which are used asion-pairing agents in HPLC, also tend to mask the analytesignal in ESI-MS (Apffel et al., 1995; Kuhlmann et al.,1995; Temesi & Law, 1999). This masking of the responsemay be a result of the aforementioned ion-pairing effects;TFA (pKa 0.23) is significantly more acidic than weakacids like acetic acid (pKa 4.72), which don’t cause thesame signal suppression. Kulhmann et al. supported thehypothesis that ion-pairing is responsible for the signalsuppression observed with TFA by showing that, whereasthe ion signal is severely suppressed for strongly basicanalyte species (those that would be expected to pair moststrongly with the TFA), weakly basic analytes are hardlyaffected.
In cases, where adequate chromatographic separa-tion requires strongly acidic ion-pairing agents like TFA,it is possible to overcome the resulting signal suppressionthrough post-column addition of a weak acid such aspropionic acid (Apffel et al., 1995; Kuhlmann et al.,1995). Signal enhancement by as much as 50-times, ascompared to that with just TFA, can be achieved with thistechnique. Kulmann et al. propose that this signalenhancement is a result of the volatile TFA (bp 728C)evaporating quickly from the ESI droplets, and of theanalyte/TFA pairs being replaced with analyte/propionicacid pairs, which are less tightly bound.
VII. SUMMARY
In this review, we have presented some important factors tobe considered in performing analysis with ESI-MS. Oneconsideration is the characteristics of the analyte. For ananalyte to be suitable for analysis with ESI-MS, it musteither exist as a preformed ion in solution or be chargeable
through protonation or deprotonation, adduct formation,or electrochemical oxidation or reduction. Analyte pkahas less of an effect on ESI responsiveness than might beimagined, due to energy considerations in the ESI processand differences in pH between the ESI droplet and the bulksolution.
The structure of the analyte can also influence its ESIresponse. Analytes with significant nonpolar (hydropho-bic) portions will generally have a higher electrosprayresponse than more polar analytes. This higher responsearises because hydrophobic analytes have higher affinitiesfor electrospray droplet surfaces and, thus, tend to carrya greater fraction of the excess charge produced in theelectrospray process.
Knowledge of the factors that affect ESI responsive-ness can help the user to predict the suitability of a givenanalyte for analysis with ESI-MS. This knowledge canalso provide insights into methods of improving the res-ponsiveness of analytes poorly suited for the technique.When an analyte is poorly responsive to analysis withESI-MS, its response can be improved through derivatiza-tion. Derivatization reactions are performed so that thederivatized analyte will have an increased chargeability, agreater nonpolar character, or a combination of both.
Sources of the limitation at the upper and lower endsof the calibration curve are important when performingquantitative analysis with ESI-MS. The detection limit inESI is usually determined by the presence of chemicalinterference due to clusters of solvent molecules withionic impurities. When chemical interference is not limit-ing, the sensitivity of the instrument may determine thedetection limit. It is generally believed that ion transmis-sion through the mass spectrometer is the key factor thatgoverns sensitivity. Therefore, most research to improvesensitivity of ESI-MS focuses on improvements of sourceand instrument design for enhanced ion transmission.
There is still some uncertainty as to the source ofsaturation in the electrospray response at high concen-trations. This saturation may arise due to inherent limi-tations in the number of ions that can be produced in theESI process. An alternative explanation is that instru-mental factors, such as transmission of ions from atmo-spheric pressure into the mass spectrometer, are limiting.Regardless of the mechanism of saturation, it is importantto realize that competition effects are common whenworking in the saturation region of the calibration curve,and cause a suppression in response for some analytes.
The success of analysis with ESI-MS depends notonly on the characteristics of the analyte and its con-centration, but also on instrumental parameters. StableESI operation can be achieved by balancing the solutionflow rate and applied voltage with the surface tension ofthe liquid. If the flow rate of the solution or its surfacetension is too high, then it is impossible to accomplish
& CECH AND ENKE
382

stable ESI operation. The balance of the parameters ofvoltage, flow rate, and surface tension can be facilitatedwith the use of self-stabilization, either by the addition ofa large series resistor or by allowing the ESI process to setthe solution flow rate.
Lastly, characteristics of the solvent used for the ESIanalysis can greatly influence its success. For analysis inthe positive ion mode, solutions of water with a highpercentage of either methanol or acetonitrile are generallypreferred. A volatile, weak acid, such as acetic acid, isadded to this solvent to increase conductivity and to faci-litate the protonation of the analyte. This solvent systemhas advantages of conductivity and surface tension thatare compatible with ESI analysis, and low levels of back-ground solvent clusters. Solvent choice for analysis inthe negative ion mode is complicated by the fact that itis difficult to produce stable, negative ions to carry theexcess negative charge at low analyte concentrations.Furthermore, corona discharge often occurs in the nega-tive ion mode, the results of which are fluctuations in spraystability and background in the form of ionized solvent.The use of a solvent system that contains a small percen-tage of some halogenated solvent (such as chloroform,hexafluoroisopropanol, or 2,2,2-trifluoroethanol) has thedual benefits of suppressing corona discharge and facilitat-ing the formation of stable negative ions through the elec-trochemical reduction inherent to the electrospray process.
When interfacing ESI-MS to HPLC, additional issuesmust be considered in solvent selection. It is necessaryto modify separation protocols to eliminate non-volatilebuffers and ion-pairing reagents, which may cause back-ground interference and signal suppression. It is also oftennecessary to deviate from the ideal solvent compositionand flow rate for ESI in order to accomplish successfulseparation of the analytes. If highly aqueous solvents orhigh flow rates are necessary for the separation, thenpneumatically assisted ESI is employed to aid in dropletformation and desolvation.
This review presents some fundamental studies ofthe ESI-MS process that shed light on issues of interest tothe ESI-MS user. However, this review is by no means theend of the story. Further research in ESI-MS fundamentalswill undoubtedly lead to an improved understanding ofthe process. The results of such research may includeimprovements in quantitative capabilities, increases inthe dynamic range and detection limit, and enhancedperformance in the negative ion mode.
ACKNOWLEDGMENT
The authors thank to Gary Van Berkel, Laurence Charles,and Dominic Desiderio for their immensely helpful reviewsof this manuscript.
REFERENCES
Ackloo SZ, Smith RW, Terlouw JK, McCarry BE. 2000.Characterization of Ginseng Saponins using electrospraymass spectrometry and collision-induced dissociation ex-periments of metal-attachment ions. Analyst 125:591–597.
Alomirah HF, Alli I, Konishi Y. 2000. Applications of massspectrometry to food proteins and peptides. J Chrom A893:1–21.
Amad MH, Cech NB, Jackson GS, Enke CG. 2000. Importanceof gas-phase proton affinities in determining the electro-spray ionization response for analytes and solvents. J MassSpectrom 35:784–789.
Amad MH, Cech NB, Enke CG. 2000. Characterizing theconstant current and constant voltage modes of electro-spray ionization. 48th Conference on Mass Spectrometryand Allied Topics, June 2000, Long Beach, California.
Apffel A, Fisher S, Goldberg G, Goodley PC, Kuhlmann FE.1995. Enhanced sensitivity for peptide-mapping withelectrospray liquid-chromatography mass-spectrometry inthe presence of signal suppression due to trifluoroaceticacid–containing mobile phases. J Chrom A 712:177–190.
Apffel A, Chakel JA, Fischer S, Lichtenwalter K, Hancock WS.1997. Analysis of oligonucleotides by HPLC-electrosprayionization mass spectrometry. Anal Chem 69:1320–1325.
Apffel A, Chakel J, Udiavar S, Swedberg S, Hancock WS,Souders C, Pungor E. 1998. Application of new analyticaltechnology to the production of a ‘‘well-characterizedbiological’’. Dev Biol Stand 96:11–25.
Bahr U, Pfenninger A, Karas M, Stahl B. 1997. High-sensitivityanalysis of neutral underivatized oligosaccharides by nano-electrospray mass spectrometry. Anal Chem 69:4530–4535.
Belov ME, Gorshkov MV, Udseth HR, Anderson GA, SmithRD. 2000. Zeptomole-sensitivity electrospray ionization:Fourier transform ion cyclotron resonance mass spectro-metry of proteins. Anal Chem 10:2271–2279.
Bonfiglio R, King RC, Olah TV, Merkle K. 1999. The effects ofsample preparation methods on the variability of the elec-trospray ionization response for model drug compounds.Rapid Commun in Mass Spectrom 13:1175–1185.
Bowers MT (Ed.). 1973. Gas phase ion chemistry. vol 2. NewYork: Academic Press. pp 1–14.
Bruins AP. 1997. ESI source design and dynamic rangeconsiderations In: Cole RB (Ed.). Electrospray ionizationmass spectromertry. New York: John Wiley and Sons, Inc.pp 107–135.
Bruins AP, Henion JD, Covey TR. 1987. Ion spray interfacefor combined liquid chromatography/atmospheric pressureionization mass spectrometry. Anal Chem 59:2642–2646.
Burlingame AL. 1996. Characterization of protein glycosyla-tion by mass spectrometry. Curr Opin Biotechnol 7:4–10.
Cao P, Moini M. 1998. Capillary electrophoresis electrosprayionization high mass accuracy time-of-flight mass spectro-metry for protein identification using peptide mapping.Rapid Commun Mass Spectrom 12:864–870.
ELECTROSPRAY IONIZATION MASS SPECTROMETRY &
383

Cech NB, Enke CG. 2000. Relating electrospray ionizationresponse to non-polar character of small peptides. AnalChem 72:2717–2723.
Cech NB, Enke CG. 2001. The effect of affinity for chargeddroplet surfaces on the fraction of analyte charged in theelectrospray process. Anal Chem 73:4632–4639.
Cech NB, Krone JR, Enke CG. 2001a. Predicting electrosprayresponse from chromatographic retention time. Anal Chem73:208–213.
Cech NB, Krone JR, Enke CG. 2001b. Electrospray ionizationdetection of an inherently nonresponsive epoxide bypeptide binding. Rapid Commun Mass Spectrom 15:1040–1044.
Che FY, Song JF, Aeng R, Wang KY, Xia QC. 1999. Analysis of8-aminonapthalene-1,3,6-trisulfonate-derivatized oligosac-charides by capillary electrsophresis-electrospray ioniza-tion quadrupole ion trap mass spectrometry. J ChromatogrA 858:229–238.
Chen DR, Pui DYH. 1997. Experimental investigation ofscaling laws for electrospraying: dielectric constant effect.Aerosol Science and Technology 27:367–380.
Cheng ZL, Siu KW, Guevremont R, Bergman SS. 1992.Electrospray mass spectrometry: a study of some aqueous-solutions of metal-salts. J Am Soc Mass Spectrom 3:281.
Cloupeau M, Prunet-Foch B. 1989. Electrostatic spraying ofliquids in cone-jet mode. J Electrostat 22:135–159.
Cole RB, Harrata AK. 1992. Charge-state distribution andelectric-dicharge suppression in negative-ion electrospraymass-spectrometry using chlorinated solvents. Rapid Com-mun Mass Spectrom 6:536–539.
Cole RB, Harrata AK. 1993. Solvent effect on analyte chargestate, signal intensity, and stability in negative ion elec-trospray mass spectrometry; implications for the mechan-ism of negative ion formation. J Am Soc Mass Spectrom4:546–556.
Cole RB, Zhu JH. 1999. Chloride ion attachement in negativeion electrospray ionization mass spectrometry. RapidCommun Mass Spectrom 13:607–611.
Colton R, Traeger JC, Harvey J. 1992. Electrospray massspectrometric studies of some phosphonium cations. OrgMass Spectrom 27:1030–1033.
Constantopoulos TL, Jackson GS, Enke CG. 1999. Effects ofsalt concentration on analyte response using electrosprayionization mass spectrometry. J Am Soc Mass Spectrom10:625–634.
Constantopoulos TL, Jackson GS, Enke CG. 2000. Challengesin achieving a fundamental model for ESI. Anal ChimActa 406:37–52.
De La Mora JF, Loscertales JG. 1994. The current emitted byhighly conducting Taylor Cones. J Fluid Mech 260:155–184.
Dole M, Mack LL, Hines RL, Mobley RC, Ferguson LD, AliceMB. 1968. Molecular beams of macroions. J Chem Phys49:2240–2249.
Drozin VG. 1955. The electrical dispersion of liquids asaerosols. J Colloid Sci 7:616.
Emmett MR, Caprioli RM. 1994. Micro electrospray massspectrometry: ultra-high-sensitivity analysis of peptidesand proteins. J Am Soc Mass Spectrom 5:605–613.
Enke CG. 1997. A predictive model for matrix and analyteeffects in electrospray ionization of singly-charged ionicanalytes. Anal Chem 69:4885–4893.
Fenn JB. 1993. Ion formation from charged droplets: roles ofgeometry, energy and time. J Am Soc Mass Spectrom 4:524–535.
Fenn JB, Mann M, Meng CK, Wong SF, Whitehouse CM. 1989.Electrospray ionization for mass spectrometry of largebiomolecules. Science 246:64–71.
Gelpi E. 1995. Biomedical and biochemical applications ofliquid chromatography-mass spectrometry. J Chrom A 703:59–80.
Geremanos S, Freckleton G, Tempst P. 2000. Tuning of anelectrospray ionization source for maximum peptide-iontransmission into a mass spectrometer. Anal Chem 4:777–790.
Gomez A, Tang K. 1994. Charge and fission of droplets inelectrostatic sprays. Phys Fluids 6:404–414.
Griffey RH, Greig MJ, Gaus HJ, Liu K, Monteith D, WinnimanM, Cummins LL. 1997. Characterization of oligonuc-leotide metabolism in vivo via liquid chromatography/electrospray tandem mass spectrometry with a quadrupoleion trap mass spectrometer. J Mass Spectrom 32:305–313.
Guevremont R, Barnett DA, Purves RW, Vandermey J. 2000.Analysis of a tryptic digest of pig hemoglobin using ESI-FAIMS-MS. Anal Chem 72:4577–4584.
Hager DB, Dovichi NJ, Klassen J, Kebarle P. 1994. Dropletelectrospray mass-spectrometry. Anal Chem 66:3944–3949.
Herderich M, Richling E, Roscher R, Schneider C, Schwab W,Humph HU, Schreier P. 1997. Application of atmosphericpressure ionization HPLC-MS–MS for the analysis ofnatural products. Chromatographia 45:127–132.
Hiraoka K, Kudaka I, Fujimaki S, Shinohara H. 1992. Obser-vation of the fullerene anions C-60(�) and C-70(�) byelectrospray ionization. Rapid Commun Mass Spectrom 6:254–256.
Hopfgartner G, Wachs T, Bean K, Henion J. 1993. High flowion spray liquid-chromatography mass-spectrometry. AnalChem 65:439–446.
Huber CG, Krajete A. 2000. Sheath liquid effects in capillaryhigh-performance liquid chromatography-electrospraymass spectrometry of oligonucleotides. J Chrom A 870:413–424.
Iribarne JV, Thomson BA. 1976. On the evaporation of chargedions from small droplets. J Chem Phys 64:2287–2294.
Iribarne JV, Dziedzic PJ, Thomson BA. 1983. Atmosphericpressure ion evaporation-mass spectrometry. Int J MassSpectrom Ion Phys 50:331–347.
Jackson GS, Enke CG. 1999. The electrical equivalence ofelectrospray ionization mass spectrometry. Anal Chem71:3777–3784.
& CECH AND ENKE
384

Jeannot R, Sauvard E. 1999. High-performance liquid chro-matography coupled with mass spectrometry applied toanalyses of pesticides in water. Results obtained in HPLC/MS/APCI in positive mode. Analusis 27:271–280.
Karas M, Bahr U, Dulcks T. 2000. Nano-electrospray ionizationmass spectrometry: adressing analytical problems beyondroutine. Fresenius J Anal Chem 366:669–676.
Karplus PA. 1996. Hydrophobicity regained. Protein Sci6:1302–1307.
Kebarle P, Ho Y. 1997. On the mechanism of electrospray massspectrometry In: Cole RB (Ed.). Electrospray ionizationmass spectrometry. New York: Wiley. p 14.
Kebarle P, Peschke M. 1999. On the mechanisms by which thecharged droplets produced by electrospray lead to gasphase ions. Analytica Chemica Acta 20070:1–25.
Kelly MA, Vestling MM, Fenselau CC, Smith PB. 1992.Electrospray analysis of proteins: a comparison of positive-ion and negative-ion mass spectra at high and low pH. OrgMass Spectrom 27:1143–1147.
Kertesz V, Van Berkel GJ. 2001. Minimizing analyte electro-lysis in an electrospray emitter. J Mass Spectrom 36:204–210.
Kim T, Tolmachev AV, Harkewicz R, Prior DC, Anderson GA,Udseth HR, Smith RD, Bailey TH, Rakov S, Futrell JH.2000a. Design and implementation of a new electrohy-dronamic ion funnel. Anal Chem 72:2247–2255.
Kim T, Udseth HR, Smith RD. 2000b. Improved ion trans-mission from atmospheric pressure to high vacuum using amulticapillary inlet and electrodynamic ion funnel inter-face. Anal Chem 72:5014–5019.
Kostiainen R, Bruins AP. 1994. Effect of multiple sprayers ondynamic range and flow rate limitations in electrosprayand ionspray mass spectrometry. Rapid Commun MassSpectrom 8:549–558.
Kostiainen R, Bruins AP. 1996. Effect of solvent compositionon dynamic range and sensitivity of pneumatically-assistedelectrsopray (ion spray) mass spectrometry. Rapid Com-mun Mass Spectrom 10:1393–1399.
Kuhlmann FE, Apffel A, Fisher SM, Goldberg G, Goodley PC.1995. Signal enhancement for gradient reverse-phasehigh-performance liquid-chromatography electrospray-ionization mass spectrometry analysis with trifluoroaceticand other strong acid modifiers by postcolumn addition ofpropionic-acid and isopropanol. J Am Soc Mass Spectrom6:1221–1225.
Le Bihan T, Pinto D, Figeys D. 2001. Nanoflow gradientgenerator coupled with m-LC-ESI-MS/MS for proteinidentification. Anal Chem 73:1307–1315.
Liu C, Wu Q, Harms AC, Smith RD. 1996. On-line micro-dialysis sample cleanup for electrospray ionization massspectrometery of nucleic acid samples. Anal Chem 68:3295–3299.
Liu CL, Muddiman DC, Tang KQ, Smith RD. 1997. Improvingthe microdialysis procedure for electrospray ionizationmass spectrometry of biological samples. J Mass Spectrom36:425–431.
Loo JA, Loo RRO, Light KJ, Edmonds CG, Smith RD. 1992.Multiply charged negative-ions by electrospray ionizationof polypeptides and proteins. Anal Chem 64:81–88.
Lu WZ, Poon GK, Carmichael PL, Cole RB. 1996. Analysis oftamoxifen and its metabolites by on-line capillary electro-phoresis-electrospray ionization mass spectrometry emp-loying nonaqueous media containing surfactants. AnalChem 68:668–674.
Mann M, Fenn JB, Wong SF. 1990. Where do all the charges goin electrospray ionization? In: Hedin A, Sundqvist B,Benninghoven A (Eds.) Ion formation from organic solids.New York: John Wiley & Sons. pp 139–144.
Matsuura K, Takashina H. 1998. Effects of functional groups ofacrylic acid derivatives as derivatization reagents for thiolcompounds on molecular ion responses in electrsprayionization mass spectrometry. J Mass Spectrom 33:1199–1208.
Matz LM, Clowers BH, Steiner WE, Siems WF, Hill HH. 2001.Liquid-sheath-flow electrospray ionization feasibility studyof direct water analysis with the use of high-resolution ion-mobility spectrometry. Field Analytical Chemistry andTechnology 5:91–96.
Mehlis B, Kertscher U. 1997. Liquid chromatography massspectromery of peptides of biological samples. AnalyticaChimica Acta 352:71–83.
Miketova P, Schram KH. 1997. Mass spectrometry ofnucleotides and oligonucleotides. Mol Biotechnol 8:249–253.
Muddiman DC, Smith RD. 1998. Sequencing and characteriza-tion of larger oligonucleotdies by electrospray ionizationFourier transform ion cyclotron resonance mass spectro-metry. Rev Anal Chem 17:1–68.
Niessen WMA, Tinke AP. 1995. Liquid chromatography-massspectrometry general principles and instrumentation. JChrom A 703:37–57.
Ogorzalek Loo RR, Smith RD. 1994. Investigations of the gas-phase structure of electrosprayed proteins using ion-molecule reactions. J Am Soc Mass Spectrom 5:221–229.
Okamoto M, Takahashi K, Doi T. 1995. Sensitive detection andstructural characterization of trimethyl(p-aminophenyl)-ammonium derivatized oligosaccharides by electrosprayionization mass spectrometry and tandem mass spectro-metry. Rapid Commun Mass Spectrom 9:641.
Owens DR, Bothner B, Phung Q, Harris K, Siuzdak G. 1998.Aspects of oligonucleotide and peptide sequencing withMALDI and electrospray mass spectrometry. Bioorg MedChem 6:1547–1554.
Purves RW, Gabryelske W, Li L. 1998. Investigation of thequantitative capabilities of an electrospray ionization iontrap linear time-of-flight mass spectrometer. Rapid Com-mun Mass Spectrom 12:695–700.
Quirke JME, Adams CL, Van Berkel GJ. 1994. Chemicalderivitization for electrospray-ionization mass-spectrome-try. 1.Alkyl-halides, alcohols, phenols, thiols and amines.Anal Chem 66:1302–1315.
ELECTROSPRAY IONIZATION MASS SPECTROMETRY &
385

Raffaelli A, Bruins AP. 1991. Factors affecting the ionizationefficiency of quaternary ammonium compounds in electro-spray/ionspray mass spectrometry. Rapid Commun MassSpectrom 5:269–275.
Ramsey RS, Goeringer DE, McLuckey SA. 1993. Active-chemical background-noise reduction in capillary electro-phoresis/ion trap mass-spectrometry. Anal Chem 65:3521–3524.
Rollgen FW, Juraschek R. 1998. Pulsation phenomenon duringelectrospray ionization. Int J Mass Spectrom 177:1–5.
Saf R, Mirtl C, Hummel K. 1994. Electorospray mass-spectrometry using potassium-iodide in aprotic organicsolvents for the ion formation by cation attachment.Tetrahedron Lett 35:6653–6656.
Shaffer SA, Tolmachev A, Prior DC, Anderson GA, UdsethHR, Smith RD. 1999. Characterization of an improvedelectrodynamic ion funnel interface for electrosprayionization mass spectrometry. Anal Chem 15:2957–2964.
Shen XD, Perreault H. 1998. Characterization of carbohydratesusing a combination of derivatization, high-performanceliquid chromatography, and mass spectrometry. J Chrom A811:47–59.
Sjoberg PJR, Bokman CF, Bylund D, Markides KE. 2001.A method for determination of ion distribution withinelectrosprayed droplets. Anal Chem 73:23–28.
Slobodnik J, van Barr BLM, Brinkman UAT. 1995. Columnliquid chromatography-mass spectrometry: selected tech-niques in environmental applications for polar pesticidesand related compounds. J Chrom A 703:81–121.
Steen RJCA, Hogenboom AC, Leonards PEG, PererboomRAL, Cofino WP, Brinkman UAT. 1999. Ultra-trace-leveldetermination of polar pesticides and their transformationproducts in surface and estuarine water samples usingcolumn liquid chromatography-electrospray tandem massspectrometry. J Chrom A 857:157–166.
Stephenson JL, McLuckey SA. 1996. Ion/ion proton transferreactions for protein mixture analysis. Anal Chem 68:4026.
Straub RF, Voyksner RD. 1993. Negative ion formation inelectrospray mass spectrometry. J Am Soc Mass Spectrom4:578–587.
Strege MA. 1999. High-performance liquid chromatoraphicelectrospray ionization mass spectrometric analyses for theintegration of natural products with modern high-through-put screening. J Chrom B 725:67–78.
Taflin DC, Ward TL, Davis EJ. 1989. Electrified droplet fissionand the Rayleigh limit. Langmuir 5:376–384.
Tang L, Kebarle P. 1991. Effect of the conductivity ofthe electrosprayed solution on the electrospray current.Factors determining analyte sensitivity in electrospraymass spectrometry. Anal Chem 63:2709–2715.
Tang L, Kebarle P. 1993a. Dependence of ion intensity inelectrospray mass spectrometry on the concentration ofanalytes in the electrosprayed solution. Anal Chem 65:3654–3668.
Tang L, Kebarle P. 1993b. From ions in solution to ions in thegas phase. Anal Chem 65:972A–985A.
Tang K, Smith RD. 1999. Theoretical prediction of chargeddroplet evaporation and fission in electrospray ionization.Int J Mass Spectrom 185/186/187:97–105.
Tang K, Smith RD. 2001. Physical/chemical separations in thebreak-up of highly charged droplets from electrosprays.J Am Chem Soc 12:343–347.
Tang K, Lin Y, Matson DW, Kim T, Smith RD. 2001.Generation of multiple electrosprays using microfabricatedemitter arrays for improved mass spectrometric sensitivity.Anal Chem 73:1658–1663.
Temesi D, Law B. 1999. The effect of LC eluent compositionon MS response using electrospray ionization. LC–GC17:627–632.
Troxler H, Kuster T, Rhyner JA, Gehrig P, Heizmann CW.1999. Electrospray ionization mass spectrometry: analysisof the Ca2þ-binding properties of human recombinantalpha-parvalbumin and nine mutant proteins. Anal Bio-chem 268:64–71.
Van Berkel GJ. 1997. The electrolytic nature of electrosprayionization In: Cole RB (Ed.). Electrospray ionization massspectrometry. New York: Wiley. pp 65–105.
Van Berkel GJ. 1998. Electrolytic corrosion of a stainless-steelelectrospray emitter monitored using an electrospray-photodiode array system. J Anal At Spectrosc 13:603–607.
Van Berkel GJ. 2000. Insights into analyte electrolysis in anelectrospray emitter from chronopotentiometry experi-ments and mass transport calculations. J Am Soc MassSpectrom 11:951–960.
Van Berkel GJ, Asano KG. 1994. Chemical derivatization forelectrospray ionization mass spectrometry. 2. Aromaticand highly conjugated molecules. Anal Chem 66:2096–2102.
Van Berkel GJ, Zhou F. 1995. Characterization of an elec-trospray ion source as a controlled-current electrolytic cell.Anal Chem 67:2916–2923.
Van Berkel GJ, McLuckey SA, Glish GL. 1992. Electrochemi-cal origin of radical cations observed in electrosprayionization mass spectra. Anal Chem 64:1586–1593.
Van Berkel GJ, Zhou F, Aronson JT. 1997. Changes in bulksolution pH caused by the inherent controlled-currentelectrolytic process of an electrospray source. Int J MassSpectrom Ion Proc 162:55–67.
Van Berkel GJ, Quirke JM, Tigani RA, Dilley AS. 1998.Derivatization for electrospray ionizatino mass spectro-metry. 3. Electrochemically ionizable derivatives. AnalChem 70:1544–1554.
Van Berkel GJ, Quirke JM, Adams CL. 2000. Derivatization forelectrospray ionization mass spectrometry. 4. Alkenes andalkynes. Rapid Commun Mass Spectrom 14:849–858.
Voyksner RD. 1996. Atmospheric pressure ionization liquidchromatography mass spectrometry for environmentalanalysis. Biochem Biotech App Electrospray IonizationMass Spectrom 619:565–582.
& CECH AND ENKE
386

Voyksner RD. 1997. Combining liquid chromatography withelectospray mass spectrometry . In: Cole RB (Ed.).Electrospray ionization mass spectrometry. New York:Wiley. pp 323–341.
Voyksner RD. 2001. (personal communication).
Wang G, Cole RB. 1994. Disparity between solution-phaseequilibria and charge state distributions in positive-ionelectrospray mass spectrometry. Organic Mass Spectro-metry 29:419–427.
Wang G, Cole RB. 1997. Solution, gas-phase, and instrumentalparameter influences on charge-state distributions in elec-trospray ionization mass spectrometry. In: Cole RB (Ed.).Electrospray ionization mass spectrometry. New York:Wiley. pp 137–174.
Waterval JCM, Lingeman H, Bult A, Underberg WJM. 2000.Derivatization trends in capillary electrophoresis. Electro-phoresis 21:4029–4055.
Whitelegge JP, Gunderson CB, Faull KF. 2001. Electrosprayionization mass spectrometry: analysis of the Ca2þ-binding properties of human recombinant alpha-parvalbu-min and nine mutant proteins. Protein Science 7:1423–1430.
Wilm M, Mann M. 1996. Analytical properties of the nanoe-lectrospray source. Anal Chem 68:1–8.
Wilson SR, Wu Y. 1993. Applications of electrospray ionizationmass spectrometry to neutral organic molecules includingfullerenes. J Am Soc Mass Spectrom 4:596–603.
Yen T-Y, Charles MJ, Voyksner RD. 1996. Processes that affectelectrospray ionization-mass spectrometry of nucleobasesand nucleosides. J Am Soc Mass Spectrom 7:1106–1108.
Yeung B, Porter TJ, Vath JE. 1997. Direct isoform analysisof high-mannose containing glycoproteins by on-line
capillary electrophoresis electrospray mass spectrometry.Anal Chem 69:2510–2516.
Yoshino K, Takao T, Murata H, Shimonshi Y. 1995. Use ofderivitizing agent 4-aminobenzoic acid 2-(diethlyamino)ethyl ester for high-sensitivity detection of oligosaccharidsby electrospray ionization mass spectrometry. Anal Chem67:4028.
Zhang JC, Cech NB, Enke CG. 2002. 2,2,2-Trifluoroethanol asan additive for low-noise negative ion electrospray massspectrometry. Anal Chem (submitted).
Zhou S, Cook KD. 2000. Protonation in electrospray massspectrometry: wrong way round or right-way-round? J AmSoc Mass Spectrom 11:961–966.
Zhou S, Cook KD. 2001. A mechanistic study of electrospraymass spectrometry: charge gradients within electrospraydroplets and their influence on ion response. J Am SocMass Spectrom 12:206–214.
Zhou S, Hamburger M. 1995. Effects of solvent composition ofmolecular ion response in electrospray mass spectrometry:investigation of the ionization process. Rapid Comm MassSpectrom 9:1516–1521.
Zhu JH, Cole RB. 2000. Formation and decompositions ofchloride adduct ions, [MþCl]�, in negative ion electro-spray ionization mass spectrometry. J Am Soc MassSpectrom 11:932–941.
Zook DR, Bruins AP. 1997. On cluster ions, ion transmission,and linear dynamic range limitations in electrospray(ionspray) mass spectrometry. Int J Mass Spectrom IonProcess 162:129–147.
Zook DR, Forsmo-Bruce H, Briem S. 2000. ESI-MS responsecharacteristics of a synthetic peptide. Chromatographia52:S60–S64.
ELECTROSPRAY IONIZATION MASS SPECTROMETRY &
387