practical experiments / oil/protein...
TRANSCRIPT

ASPECTS OF PRODUCT QUALITY IN PLANT PRODUCTION
1. Glucosinolates
2. NIRS for oil / protein / carbohydrate … content
Practical experiments / Oil/protein crops

Analytical methods for crop
quality determination
• large sample numbers to be managed in a short
period of time (plant breeding, silo ...)
• small sample size (e.g. single plant harvest)
• whole seed measurement (non-destructive
measurement) in plant breeding
• sufficient accuracy (depending on goal of
measurement)
• adequate sampling (problems of sample
disintegration, single plant samples etc.)
Pre-requisites

Analytical methods for crop
quality determination
• Kjeldahl nitrogen determination (protein)
• Soxhlet extraction (oil)
• GC (gas chromatography), HPLC (high performance liquid
chromatography) e.g. for fatty acids, amino acids and many other separable constituents such as agrochemical residues, toxins etc.
• NIRS (near-infrared reflectance spectroscopy) for different organic constituents
• Element analyzer (e.g. CN analyzer)
Universal methods

Analytical methods for crop
quality determination
• sedimentation
• farinogram
• extensiogram
• amylogram
• falling number
• vitrousness
• carotinoid content
• polarisation
• glucosinolate tests
Specific methods (a few examples)
• image analysis
• iodine value
• paper chromatography for erucic acid
• thiobarbituric test for linolenic acid
• electrophoresis (SDS-PAGE) for specific protein patterns
• DNA markers

Determination of glucosinolate content
Glucosinolates: Present in all Brassicaceae plants
S-D-thioglucose, sulfate ester, R = organic side chain.116 different glucosinolates according to side chain.
Some glucosinolates are toxic or mutagenic and used as biocides to sterilize soils, other glucosinolates are known to have health benefits in human nutrition.

Determination of glucosinolate content
DIRECT DETERMINATION METHODS USING DEGRADATION PRODUCTS
1. determination of glucose
2. formation of coloured complexes
3. determination of sulphate
METHODS BASED ON DETERMINATION AND SUMMATION OF INDIVIDUAL
GLUCOSINOLATES
1. Gas chromatography of trimethylsilylated desulphoglucosinolates
2. HPLC methods of desulphoglucosinolates or intact glucosinolates
3. Capillary electrophoresis
INDIRECT METHODS (NON-DESTRUCTIVE)
1. X-ray fluorescence
2. Near IR spectroscopy

Determination of glucosinolate content
Method 1: determination of sulphate

Method 2: determination of glucose
glucosinolate is hydrolized by the enzyme myrosinase
(present in cells, active when cells are destroyed), glucose
is determined using a glucose testing strip with o-tolidine
1 mole glucose = 1 mole of glucosinolate
high glucosinolate
low glucosinolate
Determination of glucosinolate content

Image analysis
Analysis of digital images:
Numerical information on color, intensity, distance, area,
perimeter, shape and other characteristics can be
obtained from digital images.
Sample applications:
Medicine, remote sensing, quality control, agriculture,
biometrics etc.

Image analysis applications in agriculture
Quality control: seed coloration, sample purity etc.
Quality determination: yellow pigmentation of durum wheat, cotton grades (color), fibre content of flax from stem cross-section micrographs
Microscopic image analysis of quality features in cereal grains and flours (wheat, barley , oat)
Agronomy: Nitrogen fertilization control (leaf color), irrigation control, plant density measurement, leaf area, weed density etc.
Yield: yield estimation from satellite images or aerial pictures

Image analysis (color)

Image analysis (color)original
overlay

Overlay area measurement

Image analysis (intensity)

Image analysis (intensity)

Image analysis (pore size of bread samples)

Image analysis (pore size of bread samples)
Pores in bw-mode

Image analysis (pore size of bread samples)
Pore analysis results
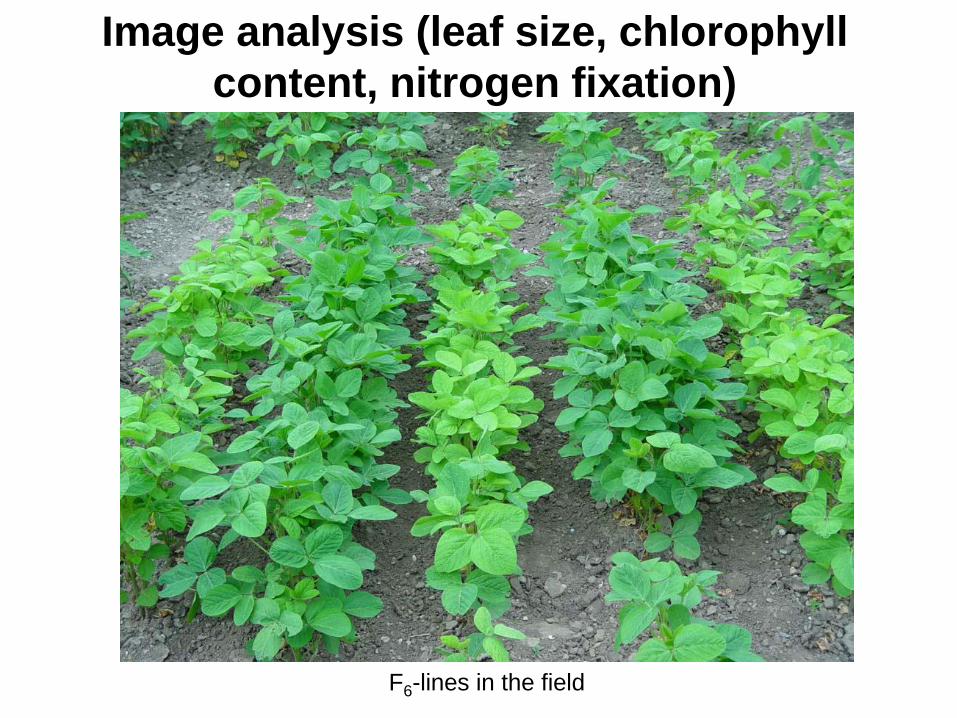
Image analysis (leaf size, chlorophyll
content, nitrogen fixation)
F6-lines in the field

nod-nod+
Image analysis (leaf size, chlorophyll
content, nitrogen fixation)

Image analysis (nitrogen fixation)
saturation (HSB leaf image analysis)
0,50 0,55 0,60 0,65 0,70 0,75 0,80 0,85
se
ed p
rote
in c
onte
nt
(g/k
g)
300
350
400
450
Col 2 vs Col 3
Col 6 vs Col 7
Plot 1 Regr
r = -0.83

Thiobarbituric acid test for linolenic acid
Testing principle:
linolenic acid from seed is oxidized using
UV and / or acids,
thiobarbituric acid (TBA) + oxidized
linolenic acid forms a complex of intense
red color.
Applications: Selection for low or high
linolenic acid in oilseeds, control of lipid
oxidation in food control

TBA test during selection for linolenic acid

near-infrared: 800-2500 nm
mid-infrared
far-infrared
micro-waves

NIRS as an example of
a physical analytical method
• Principle: NIRS uses reflections/absorption of light in the range of 800-2500 nm wavelength to determine the content of organic components of a sample
• Calibration of NIRS machine with known reference samples / Validation
• Routine measurement (scanning) of samples
• Prediction of chemical content
• Advantages / problems over other methods
NIRS: Near infrared reflectance spectroscoopy

Reference
samples
Chemical
analysis
NIRS calibration
development
NIRS
spectra
Calibration model development Routine analysis
Samples
NIRS
spectra
Prediction of
results
NIRS principles / procedures

Analytical methods for crop
quality determination
NIRS (near-infrared reflectance spectroscopy) machines
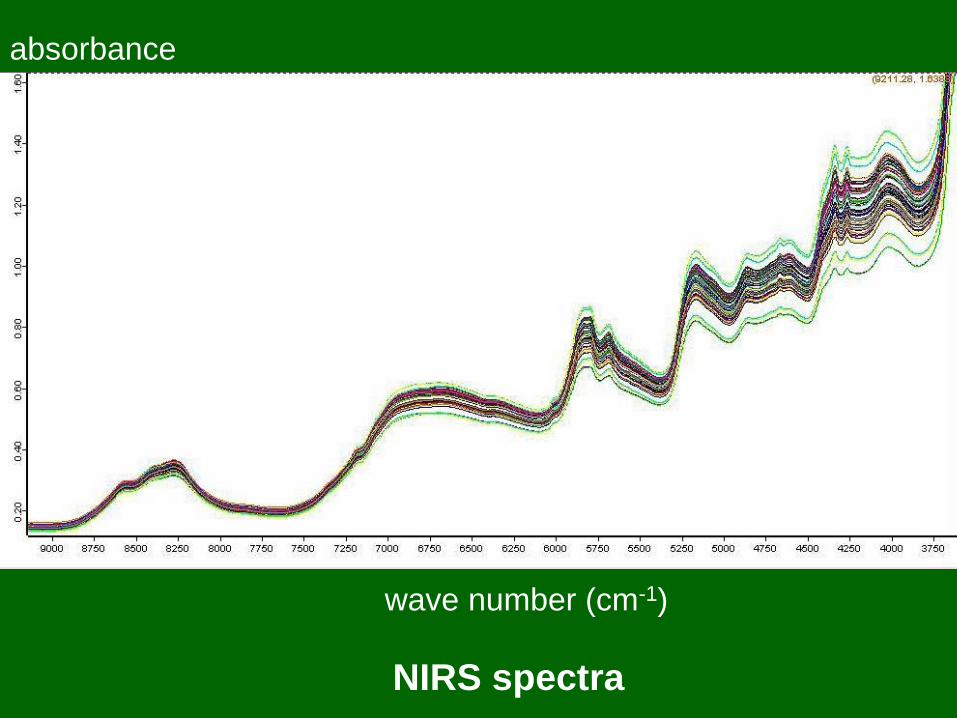
NIRS spectra
wave number (cm-1)
absorbance

Chemical wavelength (nm)
-CH3 1195
water 1450
C=O 1450
urea 1490
-NH 1500
protein 1520
starch 1540
cellulose 1780
water 1790
protein 2055
oil 2070
starch 2100
protein 2180
oil 2310
Examples of NIRS absorbance areas

NIRS principles
Spectroscopic absorbance peaks
at different wavelengths are due to
different constituents, e.g. water
peak at 1450 nm.

Vis-NIR spectra for zeaxanthin (black), lutein (blue), and
lutein mixtures (maize; Brenner & Berardo, 2004)

NIRS principles
Spectroscopic absorbance peaks
at different wavelengths are due to
different constituents, e.g. water
peak at 1450 nm.
The Beer-Lambert law describes
the linear relationship between
absorbance and concentration of
an absorber of electromagnetic
radiation.

NIRS spectra
wave number (cm-1)
absorbance

NIRS applications in plant breeding
Quantitative predictions (examples):
oil, protein, starch, fibre, sugars, moisture
fatty acids, amino acids, glucosinolates
carotinoides, isoflavones, beta-glucane
breadmaking parameters, brewing parameters
grain hardiness, particel size, digestibility,
botanical composition (hay) etc.
Qualitative applications
Diversity analysis, sample/genotype discrimination,
metabolic analysis ... (mutant identification ?)


Prediction of seed protein content in soybean(Bruker Matrix I / OPUS Quant validation)


Prediction of malt extract content in brewing barley

NIRS developments:
GenotypingCultivar identificationReal time measurement


Analytical methods for crop
quality determination
Examples of molecular genetic techniques
PCR-based DNA-
markers
(microsatellites)
SDS-PAGE type
electrophoresis
of proteins (wheat)

Kunitz trypsin inhibitor of soybean
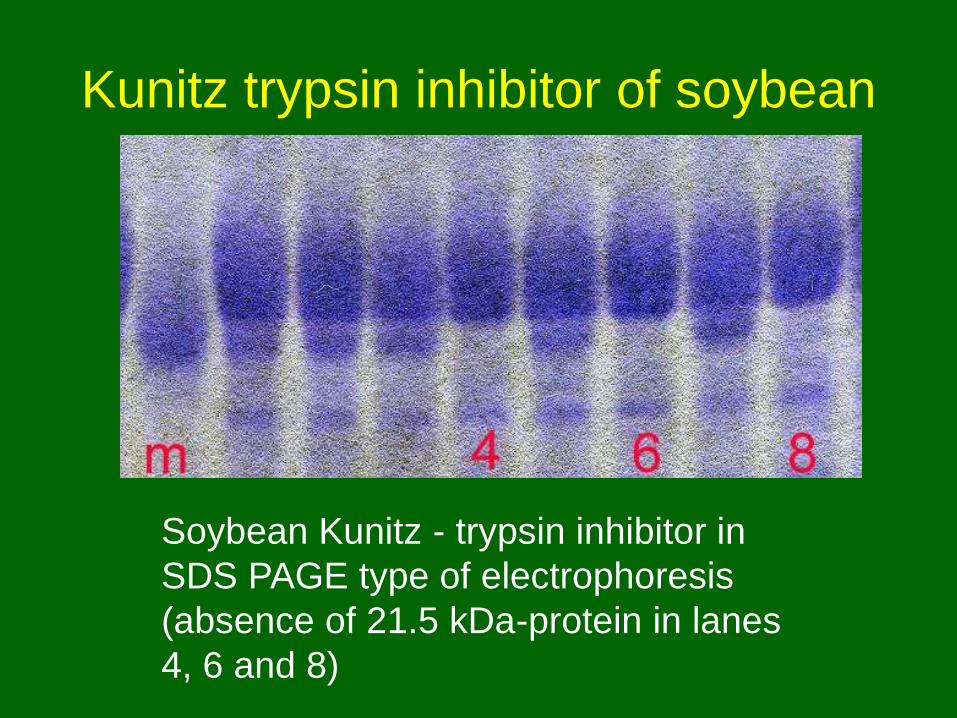
Soybean Kunitz - trypsin inhibitor in
SDS PAGE type of electrophoresis
(absence of 21.5 kDa-protein in lanes
4, 6 and 8)
Kunitz trypsin inhibitor of soybean
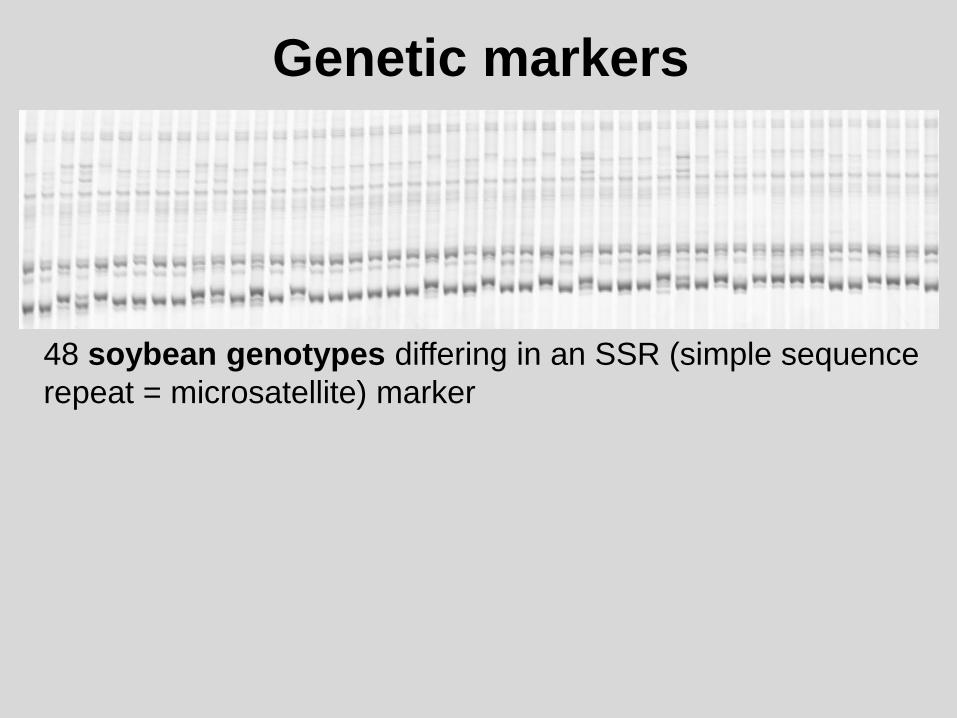
Genetic markers
48 soybean genotypes differing in an SSR (simple sequence
repeat = microsatellite) marker

Genetic markers
48 soybean genotypes differing in an SSR (simple sequence
repeat = microsatellite) marker
SSR marker SacK149 associated with low (lo) or high
(hi) cadmium (Cd) accumulation in soybean seed

Genetic markers
Seed cadmium content in four soybean
genotypes at three Cd rates in the soil
Merlin, Gallec:
Allele for high Cd
OAC Erin, ES Mentor:
Allele for low Cd