practical experience with full-scale performance
TRANSCRIPT

International Journal of High-Rise Buildings
June 2021, Vol 10, No 2, 85-92
https://doi.org/10.21022/IJHRB.2021.10.2.85
International Journal of
High-Rise Buildingswww.ctbuh-korea.org/ijhrb/index.php
Practical Experience with Full-scale Performance Verification of
Dynamic Vibration Absorbers installed in Tall Buildings
J.S. Love1 and B. Morava
1
1Motioneering Inc., Canada
Abstract
Dynamic vibration absorbers (DVAs) in the form of tuned sloshing dampers (TSDs) and tuned mass dampers (TMDs) are commonly used to reduce the wind-induced motion of high-rise buildings. Full-scale performance of structure-DVA systems must be evaluated during the DVA commissioning process using structural monitoring data. While the random decrement technique (RDT) is sometimes employed to evaluate the DVA performance, it is shown to have no theoretical justification for application to structure-DVA systems, and to produce erroneous results. Subsequently, several practical methods with a sound theoretical basis are presented and illustrated using simulated and real-world data. By monitoring the responses of the structure and DVA simultaneously, it is possible to directly measure the effective damping of the system or perform system identification from which the DVA performance can be evaluated.
Keywords: Dynamic vibration absorber (DVA), Tuned sloshing damper (TSD), Tuned mass damper (TMD), Wind-induced motion comfort, Structural control
1. Introduction
Modern high-rise buildings are typically slender,
lightweight, flexible, and possess low inherent structural
damping. As a result, they are susceptible to excessive
wind-induced motions, which can lead to occupant discom-
fort, building “groaning”, damage to non-structural elements,
or elevator malfunction. While wind-induced motions can
often be reduced by increasing the mass or stiffness of the
structure, or by modifying the building shape, these
options are expensive and often undesirable. Instead,
design teams are frequently employing dynamic vibration
absorbers (DVAs) in the form of tuned sloshing dampers
(TSDs) and tuned mass dampers (TMDs) to decrease the
resonant response of buildings.
A TMD is a mechanical device that is located near the
top of a building, and is composed of a rigid mass that is
connected to the structure through elements that provide
a restoring force, such as springs or pendulum cables, and
elements that dissipate energy, such as viscous damping
devices. In practice, the simple pendulum TMD is most
common, where the restoring force is provided by gravity.
The natural frequency of the TMD is “tuned” to be close
to the natural frequency of the building, and an appropriate
amount of damping is provided (Warburton 1982). When
the building experiences a resonant excitation, the TMD
mass will respond by moving out-of-phase with the
structure, thereby opposing its motion. Structure-TMD
system monitoring is conducted by installing accelerometers
on the structure and TMD mass to simultaneously measure
the response of both degrees of freedom.
A TSD consists of a tank that is located near the top of
a building and is partially filled with a liquid (typically
water) that can slosh. By selecting the proper tank length,
width, and quiescent water depth, the natural sloshing
frequency of the tank can be “tuned” to the natural frequency
of the structural mode of vibration to be controlled.
Screens or baffles are typically installed to increase the
TSD damping towards its optimal value (Tait 2008). In its
simplest form, a TSD can be represented as an “equivalent
TMD” with an equivalent mass, stiffness, and damping
(Tait 2008). Structure-TSD system monitoring is conducted
by installing accelerometers on the building and measuring
the wave heights within the TSD tank using wave probes.
In this paper, practical methods for evaluating the
performance of structure-DVA systems using structural
monitoring are presented and illustrated with examples.
First, the fundamentals of the response and performance
of structure-DVA systems are described. Next, the random
decrement technique (RDT) is discussed as a method that
continues to be erroneously applied to structure-DVA
systems. While RDT is a powerful tool for evaluating
damping in structures without DVAs, it is shown to
produce incorrect results when applied to structure-DVA
systems. Lastly, several practical methods for evaluating
the total effective damping of structure-DVA systems are
presented and demonstrated using numerical simulations
and real-world structural monitoring data.
†Corresponding author: Shayne Love
Tel: +1-519-823-1311
E-mail: [email protected]
86 J.S. Love and B. Morava | International Journal of High-Rise Buildings
2. Background
2.1. Structure-DVA Systems
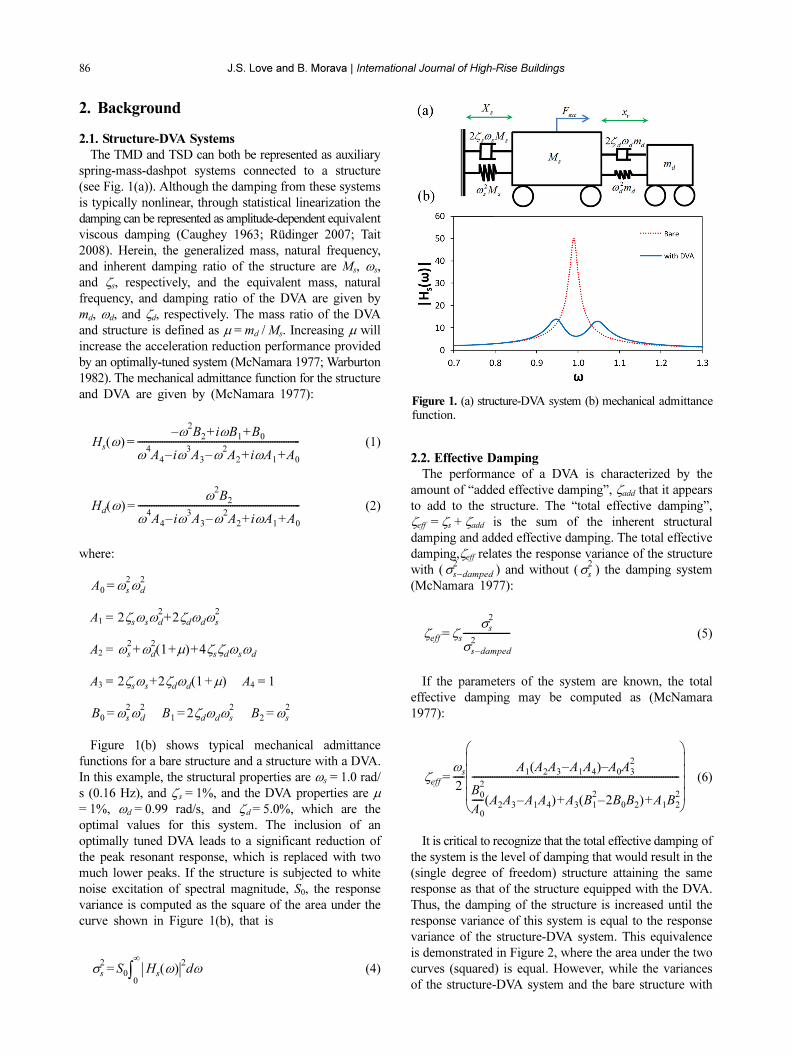
The TMD and TSD can both be represented as auxiliary
spring-mass-dashpot systems connected to a structure
(see Fig. 1(a)). Although the damping from these systems
is typically nonlinear, through statistical linearization the
damping can be represented as amplitude-dependent equivalent
viscous damping (Caughey 1963; Rüdinger 2007; Tait
2008). Herein, the generalized mass, natural frequency,
and inherent damping ratio of the structure are Ms, ωs,
and ζs, respectively, and the equivalent mass, natural
frequency, and damping ratio of the DVA are given by
md, ωd, and ζd, respectively. The mass ratio of the DVA
and structure is defined as μ = md / Ms. Increasing μ will
increase the acceleration reduction performance provided
by an optimally-tuned system (McNamara 1977; Warburton
1982). The mechanical admittance function for the structure
and DVA are given by (McNamara 1977):
(1)
(2)
where:
A1 =
A2 =
A3 = A4 = 1
Figure 1(b) shows typical mechanical admittance
functions for a bare structure and a structure with a DVA.
In this example, the structural properties are ωs = 1.0 rad/
s (0.16 Hz), and ζ s = 1%, and the DVA properties are μ
= 1%, ωd = 0.99 rad/s, and ζ d = 5.0%, which are the
optimal values for this system. The inclusion of an
optimally tuned DVA leads to a significant reduction of
the peak resonant response, which is replaced with two
much lower peaks. If the structure is subjected to white
noise excitation of spectral magnitude, S0, the response
variance is computed as the square of the area under the
curve shown in Figure 1(b), that is
(4)
2.2. Effective Damping
The performance of a DVA is characterized by the
amount of “added effective damping”, ζadd that it appears
to add to the structure. The “total effective damping”,
ζeff = ζs + ζadd is the sum of the inherent structural
damping and added effective damping. The total effective
damping,ζeff relates the response variance of the structure
with ( ) and without ( ) the damping system
(McNamara 1977):
(5)
If the parameters of the system are known, the total
effective damping may be computed as (McNamara
1977):
(6)
It is critical to recognize that the total effective damping of
the system is the level of damping that would result in the
(single degree of freedom) structure attaining the same
response as that of the structure equipped with the DVA.
Thus, the damping of the structure is increased until the
response variance of this system is equal to the response
variance of the structure-DVA system. This equivalence
is demonstrated in Figure 2, where the area under the two
curves (squared) is equal. However, while the variances
of the structure-DVA system and the bare structure with
Hs ω( )ω
2B2
iωB1
B0
+ +–
ω4A4
iω3A3ω
2A2
iωA1
A0
+ +––------------------------------------------------------------------------=
Hd ω( )ω
2B2
ω4A4
iω3A3ω
2A2
iωA1
A0
+ +––------------------------------------------------------------------------=
A0
ωs
2ωd
2=
2ζsωsωd
22ζdωdωs
2+
ωs
2ωd
21 μ+( ) 4ζsζdωsωd+ +
2ζsωs 2ζdωd 1 μ+( )+
B0
ωs
2ωd
2= B
12ζdωdωs
2= B
2ωs
2=
σs
2S0
Hs ω( ) 2 ωd0
∞
∫=
σs damped–
2σs
2
ζeff ζs
σs
2
σs damped–
2---------------------=
ζeff
ωs
2-----
A1
A2A3
A1A4
–( ) A0A3
2–
B0
2
A0
----- A2A3
A1A4
–( ) A3
B1
22B
0B2
–( ) A1B2
2+ +
--------------------------------------------------------------------------------------------
⎝ ⎠⎜ ⎟⎜ ⎟⎜ ⎟⎜ ⎟⎛ ⎞
=
Figure 1. (a) structure-DVA system (b) mechanical admittance function.
Practical Experience with Full-scale Performance Verification of Dynamic Vibration Absorbers installed in Tall Buildings 87
higher effective damping are equal, the responses themselves
(that is, the shape of the curves) are very different.
3. A False Start: Random Decrement and the DVA
Before describing methods that can be used to evaluate
the DVA performance, it is first necessary to dispel a
“false start” that the authors have seen employed by
numerous researchers and practitioners. The random
decrement technique (RDT) is a method that has been
used for decades to estimate the inherent damping of
uncoupled structures subjected to random excitation (Cole
1971). RDT generates an artificial free decay (or “RDT
signature”) of the structure by superimposing many segments
of the measured structural response together after a
specified trigger condition has been met. Although each
individual response segment includes the effects of the
random loading, when many segments are superimposed,
the resulting structural response “averages out” the effects
of the uncorrelated random loading, leaving only the free
decay from the specified trigger level. Under certain
conditions, the RDT signature can be generated using the
autocorrelation of the measured response (Asmussen et
al. 1998). The logarithmic decrement technique is then
applied to estimate the structural damping by enveloping
the RDT signature according to:
(7)
where A' is the specified trigger level or starting amplitude.
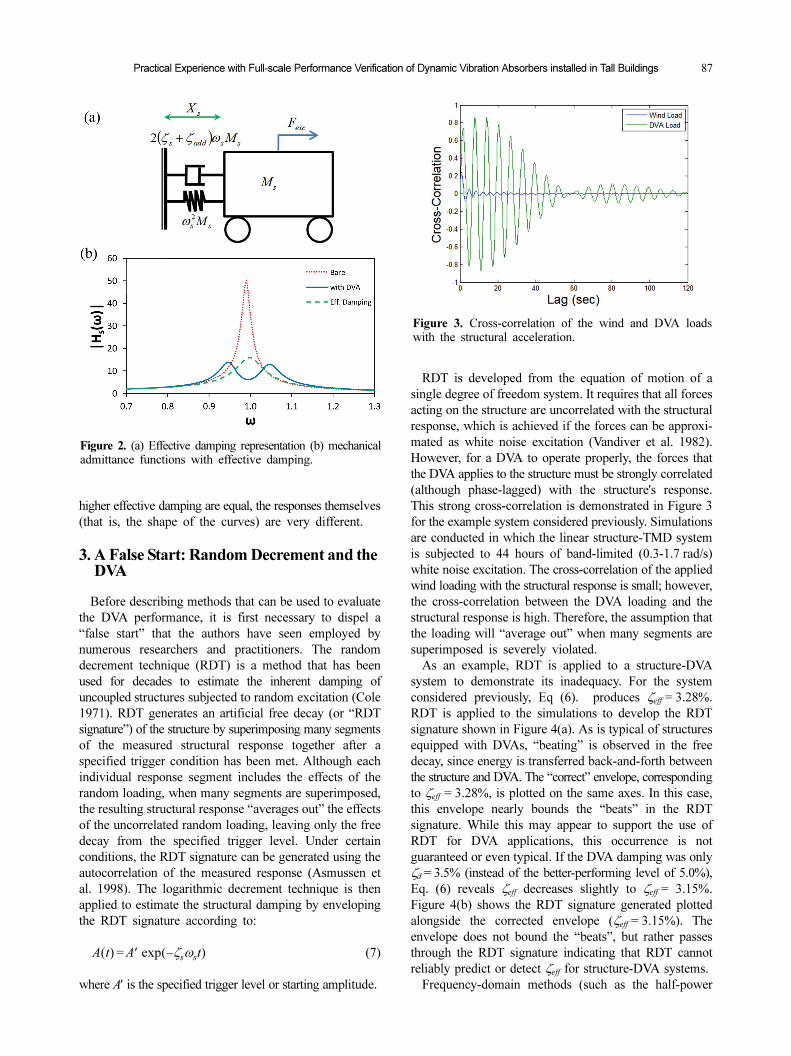
RDT is developed from the equation of motion of a
single degree of freedom system. It requires that all forces
acting on the structure are uncorrelated with the structural
response, which is achieved if the forces can be approxi-
mated as white noise excitation (Vandiver et al. 1982).
However, for a DVA to operate properly, the forces that
the DVA applies to the structure must be strongly correlated
(although phase-lagged) with the structure's response.
This strong cross-correlation is demonstrated in Figure 3
for the example system considered previously. Simulations
are conducted in which the linear structure-TMD system
is subjected to 44 hours of band-limited (0.3-1.7 rad/s)
white noise excitation. The cross-correlation of the applied
wind loading with the structural response is small; however,
the cross-correlation between the DVA loading and the
structural response is high. Therefore, the assumption that
the loading will “average out” when many segments are
superimposed is severely violated.
As an example, RDT is applied to a structure-DVA
system to demonstrate its inadequacy. For the system
considered previously, Eq (6). produces ζeff = 3.28%.
RDT is applied to the simulations to develop the RDT
signature shown in Figure 4(a). As is typical of structures
equipped with DVAs, “beating” is observed in the free
decay, since energy is transferred back-and-forth between
the structure and DVA. The “correct” envelope, corresponding
to ζeff = 3.28%, is plotted on the same axes. In this case,
this envelope nearly bounds the “beats” in the RDT
signature. While this may appear to support the use of
RDT for DVA applications, this occurrence is not
guaranteed or even typical. If the DVA damping was only
ζd = 3.5% (instead of the better-performing level of 5.0%),
Eq. (6) reveals ζeff decreases slightly to ζeff = 3.15%.
Figure 4(b) shows the RDT signature generated plotted
alongside the corrected envelope (ζeff = 3.15%). The
envelope does not bound the “beats”, but rather passes
through the RDT signature indicating that RDT cannot
reliably predict or detect ζeff for structure-DVA systems.
Frequency-domain methods (such as the half-power
A t( ) A′ exp ζsωst–( )=
Figure 2. (a) Effective damping representation (b) mechanical admittance functions with effective damping.
Figure 3. Cross-correlation of the wind and DVA loads with the structural acceleration.

88 J.S. Love and B. Morava | International Journal of High-Rise Buildings
bandwidth method (Chopra 2007)) employed for estimating
the damping of bare structures are also unsuitable for
structure-DVA systems. Like RDT, these methods are
derived from the equation of motion of an uncoupled single-
degree-of-freedom system, and do not properly accom-
modate the dynamic interaction between the structure and
DVA. The issues that plague RDT in the time domain also
plague the half-power bandwidth method in the frequency
domain.
4. Direct Measurement
Damping is proportional to the rate of energy removal
from a dynamic system relative to the total energy in that
system. To properly quantify the total energy in a structure-
DVA system, the responses of both the structure and DVA
must be measured synchronously. In this section, practical
methods to quantify the added effective damping and the
inherent structural damping of a structure-DVA system
are described.
4.1. Added Effective Damping Estimation
When a structure is subjected to random white noise
excitation, the added effective damping can be calculated
as (Love and Tait 2017):
(8)
where is the covariance between the measured
structural acceleration and measured DVA velocity, and
is the variance of the measured structural acceleration.
Since the kinetic energy of an oscillator is proportional to
its mass, it is necessary that the DVA mass ratio, μ is
known beforehand, and the structure's natural frequency,
ωs must also be known or determined from the structural
monitoring. This method has been validated using numerical
simulations, and scale-model testing (Love and Tait 2017),
and has been applied to structural monitoring data obtained
from several full-scale structure-TMD and structure-TSD
systems (Love et al. 2018, 2020; Love and Haskett 2019).
Equation (8) provides a practical means to directly
quantify the added effective damping, ζadd provided by a
DVA. To determine the total effective damping, ζeff the
inherent structural damping, ζ s must be determined as
described in the next section.
4.2. Inherent Structural Damping Estimation
The simplest means to obtain ζ s is to measure the
ambient response of the structure prior to the DVA
commissioning (that is, before the TMD mass is released
or liquid is added to the TSD tank). The bare structure
response enables ζ s to be estimated using RDT. Unfortunately,
damping estimation techniques often require modest to
large wind events to ensure the structural response
overcomes the measurement “noise”, and captures any
amplitude dependency of ζ s (Tamura 2012). If a modest
wind event is not captured by structural monitoring
between the time of substantial construction completion
and DVA commissioning, then it will be challenging to
reliably estimate ζ s using traditional methods.
A modified version of RDT has been proposed for
structure-DVA systems subjected to random wind loading
(Love and Haskett 2019). Like the traditional RDT, the
method generates RDT signatures or "free decays" of the
structure and DVA using cross-correlation functions. The
RDT signature of the structure from a specified level is
composed of a “free decay” component as the structural
response decays from the specified trigger level, and a
“forced” component arising from the loads imparted from
the DVA on the structure. Mathematically, this can be
represented as (Love and Haskett 2019),
(9)
(10)
ζadd
ωsμE X··
sx·r[ ]
2E X··
S
2
[ ]---------------------------=
E X··
sx·r[ ]
E X··
S
2
[ ]
DX t( ) ζsωst–( ) ωst( ) md h t τ–( )Dx·· τ( ) τd
0
t
∫+cosexp=
h t( )1
ωsMs
------------ ζsωst–( )sin ωst( )exp=
Figure 4. Example of erroneous application of RDT alongside known free decay envelopes (a) ζd = 5.0%, (b) ζd=3.5%.

Practical Experience with Full-scale Performance Verification of Dynamic Vibration Absorbers installed in Tall Buildings 89
(11)
(12)
where DX(t) is the RDT signature of the structural
displacement, is the RDT signature of the DVA
acceleration, h(t) is the impulse response function of the
bare structure, is the cross-correlation function of
structural acceleration with the structural displacement,
and is the cross-correlation function of structural
acceleration with the DVA acceleration. With the RDT
signature for the DVA acceleration, measured
through DVA monitoring, Eq. (9) is used to determine the
values of ωs and ξs that produce the best fit to the RDT
signature of structural displacement, DX(t). Figure 5(a)
shows the RDT signatures for the simulated system
considered in Section 2.1, and Figure 5(b) shows the fit
to DX(t). The values ωs = 1.0 rad/s and ζs = 1.0% provide
an excellent fit to the data. The best fit values for ωs and
ζs can be determined using a numerical optimization
routine, although an energy balance approach using linear
regression has also been suggested (Love and Haskett
2019).
If synchronous measurements of the structural and
DVA responses can be obtained, and μ is known, ζ s and
ζadd can be directly predicted using the methodologies
presented herein. These methods make no assumptions
regarding the DVA tuning ratio, damping ratio, or even
the form (e.g. linear, quadratic, etc.) of the DVA damping.
They instead rely only upon the inertial force that the
DVA applies to the structure.
5. System Identification
If measurements of the structural and DVA responses
are not synchronous, it is not possible to quantify the flow
of energy within the structure-DVA system. Instead, the
performance of a DVA may be ascertained using system
identification, whereby structural monitoring is used to
estimate the dynamic properties of the structure and DVA.
With the dynamic properties estimated, the theoretical
performance of the DVA is calculated using Eq. (6).
While several sophisticated algorithms have been proposed
to identify the properties of structure-TMD systems
(Hazra et al. 2010; Roffel and Narasimhan 2016), herein
robust, practical methods are employed. Two forms of
system identification are described: those relying upon
ambient excitation, and those relying upon intentional
excitation.
5.1. Ambient Monitoring
The dynamic properties of the structure and DVA may
be estimated using monitoring data collected during
ambient wind excitation. Since the excitation is random
and unknown, the dynamic properties are estimated by
comparing the measured response spectra of the structure
and DVA to the predicted spectra. The dynamic properties of
the system are adjusted until the predicted spectra match the
measured spectra.
Since TSDs are frictionless systems, the liquid will
respond under all amplitudes of structural excitation.
However, TSD damping is nonlinear and will be very low
on calm days. This low damping can be advantageous for
system identification, since it results in clear peaks in the
measured spectra, which can be readily aligned with
peaks in the predicted spectra to confirm natural frequencies
of the structure and TSD tank(s).
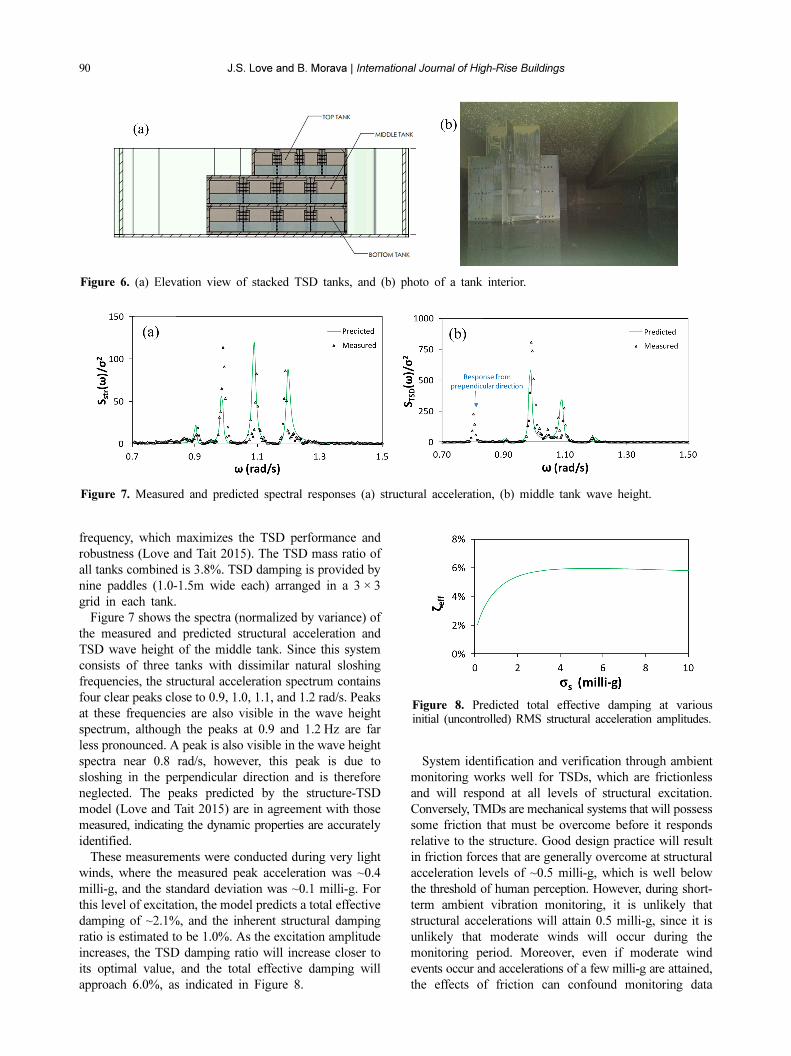
Figure 6 shows a stacked three-tank TSD system installed
in a 70-storey building in Chicago, USA. The measured
structural frequency is 1.07 rad/s. The key dimensions
(length × width × water depth) of the three tanks are
12.0 m × 16.0 m × 1.45 m (bottom tank), 12.0 m ×16.0 m,
× 1.83 m (middle tank), and 12.0 m × 9.45 m × 2.43 m
(top tank). Each tank is tuned to a slightly different
DX τ( )R
X··Xτ( )
E X··
s
2
[ ]---------------–=
Dx·· τ( )
RX··x·· τ( )
E X··
s
2
[ ]---------------=
Dx·· τ( )
RX··Xτ( )
RX··x·· τ( )
Dx·· τ( )
Figure 5. (a) RDT signature of structural displacement and DVA acceleration, (b) fit of structural displacement RDT signature ζ s = 1.0%, ω s = 1.0 rad/s.
90 J.S. Love and B. Morava | International Journal of High-Rise Buildings
frequency, which maximizes the TSD performance and
robustness (Love and Tait 2015). The TSD mass ratio of
all tanks combined is 3.8%. TSD damping is provided by
nine paddles (1.0-1.5m wide each) arranged in a 3 × 3
grid in each tank.
Figure 7 shows the spectra (normalized by variance) of
the measured and predicted structural acceleration and
TSD wave height of the middle tank. Since this system
consists of three tanks with dissimilar natural sloshing
frequencies, the structural acceleration spectrum contains
four clear peaks close to 0.9, 1.0, 1.1, and 1.2 rad/s. Peaks
at these frequencies are also visible in the wave height
spectrum, although the peaks at 0.9 and 1.2 Hz are far
less pronounced. A peak is also visible in the wave height
spectra near 0.8 rad/s, however, this peak is due to
sloshing in the perpendicular direction and is therefore
neglected. The peaks predicted by the structure-TSD
model (Love and Tait 2015) are in agreement with those
measured, indicating the dynamic properties are accurately
identified.
These measurements were conducted during very light
winds, where the measured peak acceleration was ~0.4
milli-g, and the standard deviation was ~0.1 milli-g. For
this level of excitation, the model predicts a total effective
damping of ~2.1%, and the inherent structural damping
ratio is estimated to be 1.0%. As the excitation amplitude
increases, the TSD damping ratio will increase closer to
its optimal value, and the total effective damping will
approach 6.0%, as indicated in Figure 8.
System identification and verification through ambient
monitoring works well for TSDs, which are frictionless
and will respond at all levels of structural excitation.
Conversely, TMDs are mechanical systems that will possess
some friction that must be overcome before it responds
relative to the structure. Good design practice will result
in friction forces that are generally overcome at structural
acceleration levels of ~0.5 milli-g, which is well below
the threshold of human perception. However, during short-
term ambient vibration monitoring, it is unlikely that
structural accelerations will attain 0.5 milli-g, since it is
unlikely that moderate winds will occur during the
monitoring period. Moreover, even if moderate wind
events occur and accelerations of a few milli-g are attained,
the effects of friction can confound monitoring data
Figure 6. (a) Elevation view of stacked TSD tanks, and (b) photo of a tank interior.
Figure 7. Measured and predicted spectral responses (a) structural acceleration, (b) middle tank wave height.
Figure 8. Predicted total effective damping at various initial (uncontrolled) RMS structural acceleration amplitudes.

Practical Experience with Full-scale Performance Verification of Dynamic Vibration Absorbers installed in Tall Buildings 91
interpretation, since the TMD will be “free” and “locked”
during different parts of the wind event when the building
response is large or small. For this reason, pull tests are
typically required to verify the TMD performance, as
described in the next section.
5.2. Pull Tests
Pull tests are generally required to identify or confirm
the dynamic properties of structure-TMD systems for
performance verification. For these tests, the TMD mass
is manually displaced using a temporary system that
offers high mechanical advantage, and then is suddenly
released. After release, the TMD will oscillate, transmitting
energy to the structure, which will in turn begin to
oscillate. Energy will continue to be transmitted back-
and-forth between the structure and TMD as the system
response decays. The accelerations of the structure and
TMD are measured, and the measured response is
compared to the predicted response to confirm system
parameters.
Figure 9 shows an example of an opposed-pendulum
style of TMD (Morava et al. 2012) which is installed in
a 71-storey tower in New York City, USA. The measured
tower natural frequency is ωs = 0.702 rad/s, and the TMD
mass ratio is 4.4%. A suite of pull tests was conducted at
several initial TMD displacement amplitudes. For each
pull test, numerical optimization is used to determine the
structure and TMD properties that provide a best fit to the
measured structure and TMD responses. Figure 10 (a)
and (b) show the measured and best fit responses for tests
that were conducted with the TMD’s viscous damping
Figure 10. Pull test at 0.4m initial TMD amplitude (a) VDDs disconnected, (b) VDDs connected.
Figure 9. TMD (a) schematic, and (b) photo.
Figure 11. Predicted total effective damping at various initial (uncontrolled) RMS structural acceleration amplitudes.
92 J.S. Love and B. Morava | International Journal of High-Rise Buildings
devices (VDDs) disconnected, and connected, respectively.
As expected, the TMD and structural response amplitudes
are larger and last longer when the VDDs are disconnected.
With the system properties identified, ζeff can be predicted
for various levels of uncontrolled structural acceleration
amplitudes as shown in Figure 11.
6. Conclusions
Full-scale performance verification of dynamic vibration
absorbers has received little attention in the literature. In
this paper, the errors associated with using techniques
intended for uncoupled systems, such as RDT, are described
and illustrated with examples. To properly assess DVA
performance, structural monitoring should measure the
response of the structure and DVA so that the transmission
and dissipation of energy within the structure-DVA
system can be quantified. Ideally, synchronous measurements
of the structure and DVA responses are conducted to
allow the added effective damping provided by the DVA
and inherent structural damping to be directly measured.
If the measured responses are not synchronous, structural
monitoring is conducted to identify or verify the structure
and DVA properties and then the total effective damping
is estimated using theory. Ambient monitoring is typically
used for TSD systems, whereas pull tests are often
employed for TMD systems. Through the proper use of
structural monitoring data, the performance of DVAs
installed to improve the motion comfort of tall buildings
can be verified.
References
Asmussen, J. C., Ibrahim, S. R., and Brincker, R. (1998).
“Random decrement: Identification of structures subjected
to ambient excitation.” Proceedings of the International
Modal Analysis Conference - IMAC, 914-921.
Caughey, T. K. (1963). “Equivalent Linearization Techniques.”
The Journal of the Acoustical Society of America, 35(11),
1706-1711.
Chopra, A. K. (2007). Dynamics of Structures: Theory and
Applications to Earthquake Engineering. Pearson Prentice
Hall, Upper Saddle River, NJ.
Cole, H. A. (1971). Failure detection of a space shuttle wing
flutter model by random decrement. NASA-TM-X-62041,
Moffett Field, California.
Hazra, B., Roffel, A. J., Narasimhan, S., and Pandey, M. D.
(2010). “Modified Cross-Correlation Method for the
Blind Identification of Structures.” Journal of Engineering
Mechanics, 136(7), 889-897.
Love, J. S., and Haskett, T. C. (2019). “Measuring inherent
structural damping of structure-TMD systems.” Engineering
Structures, Elsevier, 196(June), 109300.
Love, J. S., Haskett, T. C., and Morava, B. (2018).
“Effectiveness of dynamic vibration absorbers implemented
in tall buildings.” Engineering Structures, Elsevier, 176
(September), 776-784.
Love, J. S., Morava, B., and Smith, A. W. (2020).
“Monitoring of a Tall Building Equipped with an
Efficient Multiple-Tuned Sloshing Damper System.”
Practice Periodical on Structural Design and Construction,
25(3), 05020003.
Love, J. S., and Tait, M. J. (2015). “Multiple Tuned Liquid
Dampers for Efficient and Robust Structural Control.”
Journal of Structural Engineering, 141(12), 04015045.
Love, J. S., and Tait, M. J. (2017). “Estimating the added
effective damping of SDOF systems incorporating multiple
dynamic vibration absorbers with nonlinear damping.”
Engineering Structures, Elsevier Ltd, 130, 154–161.
McNamara, R. J. (1977). “Tuned Mass Dampers for Buildings.”
Journal of the Structural Division, 103(9), 1785-1798.
Morava, B., Haskett, T., and Smith, A. (2012). “Enhancing
the serviceability performance of tall buildings using
supplemental damping systems.” Ingegneria Sismica, 29(1),
60-70.
Roffel, A. J., and Narasimhan, S. (2016). “Results from a
Full-Scale Study on the Condition Assessment of Pendulum
Tuned Mass Dampers.” Journal of Structural Engineering,
142(1), 04015096.
Rüdinger, F. (2007). “Tuned mass damper with nonlinear
viscous damping.” Journal of Sound and Vibration, 300(3-
5), 932-948.
Tait, M. J. (2008). “Modelling and preliminary design of a
structure-TLD system.” Engineering Structures, 30(10),
2644-2655.
Tamura, Y. (2012). “Amplitude Dependency of Damping in
Buildings and Critical Tip Drift Ratio.” International
Journal of High-Rise Buildings, 1(1), 1-13.
Vandiver, J. K., Dunwoody, A. B., Campbell, R. B., and
Cook, M. F. (1982). “A Mathematical Basis for the
Random Decrement Vibration Signature Analysis Technique.”
Journal of Mechanical Design, 104(2), 307-313.
Warburton, G. B. (1982). “Optimum absorber parameters for
various combinations of response and excitation parameters.”
Earthquake Engineering & Structural Dynamics, 10(3),
381-401.