pr mondal - mgmiindia.inmgmiindia.in/other/pdf/2018/mgmi_trans_vol_114_apr17_mar18.pdf · pr...
TRANSCRIPT

Chief Advisor to the Editorial CommitteeProf SP Banerjee, Former President & Former Director ISM Dhanbad
Editorial Committee
Binay Dayal, Director (Technical), CIL
BC Bhattacharya, Former Editor, MGMI Dr Anupendu Gupta, Former DDG, GSI
Prof (Dr) SK Mukhopadhyay, Former Professor, IIT Kharagpur Dr Biswjit Samanta, Professor, IIT Kharagpur and Asso Edt, MGMI Prof Atul Verma, HOD, Applied Geology, IIT-ISM
President Dr NK Nanda, Director (Technical), NMDC
Vice-Presidents AK Jha, Chairman, CIL
Avijit Ghosh, CMD, HEC JP Goenka, Mg Partner, NMC
PR Mondal, Former Advisor, Ministry of Coal
Immediate Past President AN Sahay, Former CMD, MCL
Immediate Past Secretary Prasanta Roy, Sr Manager (CV), CIL
Honorary Secretary Rajiw Lochan, Chief Manager (Geology/CBM), CMPDI
Hony Jt Secretary Hony Treasurer Hony Editor Ranajit Talapatra Samir Kumar Ghosh Prof (Dr) Khanindra Pathak Sr Manager (CP), CIL Former Mgr (Met), HCL IIT Kharagpur, Kharagpur
Council Members
Amrita Acharya, Former Coal Controller Bhaskar Chakraborti, Former Dir (SG), GSI
VK Arora, Chief Mentor (Coal), KCT & Bros Prof (Dr) Sajal Dasgupta, VC, Univ of Engg & Mgt
Dr JP Barnwal, Former Chief Sc & Head, RRL AK Karmakar, GM (Admn), CIL
Prof (Dr) Ashis Bhattacherjee, IIT Kharagpur Prof (Dr) GP Karmakar, IIT Kharagpur
BC Bhattacharya, Former CGM (WBPD), CIL Prof (Dr) SK Mukhopadhyay, Former Professor, IIT Kharagpur
Anup Biswas, Former DDG, Mines Safety Dr Kalyan Sen, Former Director, CMRI
LK Bose, Former ED, CIL Anil Kumar Singh, TS/GM to Dir (Tech), MCL
Dr Amalendu Sinha, Former Director, CSIR-CIMFR
MGMI Council for 2017-18

ISSN 0371-9538 Volume 114 : April 2017 – March 2018
TRANSACTIONS
A Technical Publication of The Mining, Geological and Metallurgical Institute of India
MGMI
Established 1906

CONTENTSFrom Editor’s Desk
Prof (Dr) Khanindra Pathak
Presidential Address Dr NK Nanda
16th Foundation Day Lecture Dr S Chandrasekhar
TECHNICAL PAPERS
Strategies for Underground Extraction of the Inclined Coal Seams by Continuous Miner ....................................................................................................1 Arka Jyoti Das, Prabhat Kr Mandal, Partha Sarathi Paul and Rabindra Kr Sinha
Utilisation of Low Grade Chromite Ore for the Production of Carbon Free Ferrochrome .....................................................................................13 Dr Rajib Dey, Amit Kr Bhandary, Maharshi Ghosh Dastidar, Siddhartha Mukherjee and Mahua Ghosh Chaudhuri
Geotechnical Characterization of Strata for pre-split Blasting to Control pit-wall damage ........................................................................................24 Dr RK Paswan, Dr MP Roy, Dr PK Singh
Pressure Signature Analysis in Gravity Blind Backfilling Method..............................40 Prof (Dr) Samir Kr Pal, Dr Anup Kr Tripathi, Susmita Panda and Sathish Kumar Palaniappan
Rocks Within Wine – Importance of Geology in Global Viticulture and Wine Making with an Apology to Indian Scenario ..........................................51 Amitava Bandyopadhyay
Sedimentation and Stratigraphy at the Interface of the Indian Shied and Himalayan Oogen : A critical Resume of evolution of the Ganga and Siwalik Basins ...............................................................................60 Dr Barendra Purkait
i
Are we handling our mineral wealth and resources economically?MGMI has been consistent in its effort to the objective defined in 1906 to promote the study of all branches of mining methods and mineral occurrences in India, with a view to disseminating the information for facilitating the economic development of the mineral industries in the country. However, after independence and with the change of governance and formation of new ministries and regulations, the institute now seldom receives requests from State or Central Government seeking suggestions/comments of the institute in wide range of mining and mineral development issues. In the past, the MGMI used to suggest in matters ranging from “induction of safety measures in underground mines to “income tax” slabs for small scale mines.
Utilization of natural resource of India for the country’s economic growth requires technological and scientific understanding of various endowment of mineral deposits and its economics of mining, processing and metallurgical treatments. Number of academic and research organizations in India are engaged in imparting mining and mineral education and conducting relevant research. However, MGMI is still a platform where the academia and industry merge for developing consciousness and concerns on various issues. The MGMI transactions are being published regularly and reveals a glimpse of such activities.
The resource availability and distribution contributes to mineral market behaviors different from other commodities. Gordon and Tilton (2008)1 discussed how mineral economics emerged as different disciplines in countries like the USA, Canda or the UK. Unfortunately, though India is a mining country the academic and research activities on mineral economics and mining finance is not much visible. If we look at others, the Pennsylvania State University was the first to offer academic degrees in mineral economics. In 1946, its School of Mineral Industries (now the College of Earth and Mineral Sciences) created a Department of Mineral Economics and began awarding B.S., M.S., and Ph.D. degrees in the field. Later the Colorado School of Mines, the University of West Virginia, the University of Arizona, and Michigan Technological University also introduced degree-granting programs at the graduate level. In addition, some mineral schools, such as Stanford, Columbia, McGill, and Queens, maintained mineral-economics programs with a single faculty member designing a student’s curriculum from courses offered elsewhere in the university. Such initiatives were not there in India.
The world has advanced in studies of mineral economics. Students can now earn degrees in mineral economics from the Curtin University of Technology in Australia, the University of the Witwatersrand in South Africa, the Catholic University of Chile, and the University of Chile—most of these programs have been initiated since 1993. With the exception of the Catholic University of Chile, these programs are taught in concentrated sessions to accommodate students working full time in the industry, rather than as standard academic
From Editor’s Desk
1Richard L. Gordon , John E. Tiltonb, Mineral economics : Overview of a discipline, Resources Policy 33 (2008) 4–11

ii
programs. In addition, the University of Dundee in Scotland also used to offer a program in mineral law with a significant focus on mineral economics.
It is also important to note that government agencies in producing countries, including Indian Bureau of Mines, Nagpur, Natural Resources Canada, the Australian Bureau of Agriculture and Resource Economics (ABARE), and the Chilean Copper Commission (Cochilco), today support a wide agenda of research in the field.
It is important for MGMI to bring Indian mining and mineral industry stakeholders to get engaged in focusing mineral economics, mineral trade and mining finance issues along with exploration and mining of minerals. Numerous issues are there to address, e.g.
• Mineralcommoditymarketanalysis,includingpriceanddemandforecasts.
• Reliabilityofprojectevaluationusingdiscountedcashflowandotherfinancialtools.• Internationalmineralcompaniesandtheirrelationswiththehostcountriesinwhichthey
operated, including taxation issues.• StrategicandcriticalmaterialsfromSARC,ASEAN• Depletionandthelong-runavailabilityofmineralcommodities.• Monopolyandantitrustpolicyinthecoal,petroleum,aluminum,steel,andothermineral
industries.• Regulationoftheenergyindustries.• Commoditymarketanalysise,gtindemandsandneedsofinternationalagreements.• Theenvironmentaleffectsofextraction,processing,anduseofminerals,andtheroleof
government policy and corporate responsibility for controlling them.• The impact of mining and energy production on indigenous people and local
communities.• Theroleofmineralexploitationineconomicdevelopment,includingissuessurrounding
the resource curse, the Dutch disease, and the links between mineral wealth on one hand and corruption and conflict on the other.
• Currentglobalcompetitionandmarketforcesformineralresources.
Indian mining and mineral industry needs quality human resources to handle various issues related to mineral resources, however, paramount amongst them perhaps is understanding and application of resource economics to excel in domestic mineral market as well as to serve the global raw material supply business.
I hope our members will take note of these issues and will consider initiating more involvement in various resource economics aspects, including associated areas such as transportation economics, environmental economics and closure economics that are relevant to mineral industry.
Dr Khanindra Pathak
iii
PRESIDENTIAL ADDRESSFor 111th Annual General Meeting at the hotel, The Westin Kolkata Rajarhat, 10th November 2017
Dr NK Nanda*
* Presidential Address delivered on 10th November 2017, at the 111th Annual General Meeting, at the hotel, The Westin Kolkata Rajarhat.
** President, MGMI and Director (Technical), NMDC
My Friends of MGMI, Guests, Ladies and Gentlemen,
All democratic nations strive for continuously improving the well-being of their citizens. For achieving this objective the nations endeavor to improve national productivity, production and income by building sound economic base. And such we all know that economic base rests on good infrastructure and efficient basic industries using natural resources.
Mining is a basic industry for extracting, developing and processing natural minerals for supporting scores of secondary industries like Power, Metals, Fertilizers, Cement, Chemicals etc. these secondary mineral based industries provide the foundation for almost the entire industrial growth of the nation, covering all major sectors like Civic needs, Manufacturing, Construction, Agriculture, Defense, Aviation, Shipping, Transportation, Power, Consumer durables etc. thus the services rendered by the mining engineers, geologists and metallurgists indirectly reach to every walk of life of our fellow citizens.
It is unfortunate that despite such high importance of the mineral industry in our national economy, it does not receive the priority in national planning to the desired extent. Presently, national level planning
for development of mining industry is based more on crisis management approach than on the principle of sustainable fast growth. For example, we should have “proposed development maps” for mineral exploitation on the same lines as geological maps. These “development maps” should indicate the extent of forest and revenue land required for future mining projects, as also required for railway lines, roads and bridges, power transmission, telecommunication, water supply potential etc. so that the State and Central Governments can take note of these factors in their regional development plans well before the mining projects are proposed for construction. Based on these maps the mining companies can also apply for forest and other land, rail and road connections and other infrastructural facilities long before finalization of projects. This will not only save processing time, but also same sizable funds of the coal company which are diverted for development of social infrastructure on behalf of the Government. In fact, all these entire social infrastructure can be funded by the Governments of the States and Centre by spending a small part of the Royalty and Taxes collected from the mining projects, once these go into production.
iv
However, such an approach can be inculcated within the government only when the mineral ministries are headed at administrative levels by such persons who have extensive knowledge and experience of minerals and geo-mining aspect of the projects. This was strongly realized in the early seventies of the last century and Secretaries of Department of Coal and Department of Steel were selected from amongst the leading mining engineers and metallurgists respectively. Similar experiment was also done in the Railway Ministry.
To-day the mining industry is unable to attract talented young professionals, as the jobs offer neither challenging nor attractive as compared to the past. After graduation, the talented mining engineers to-day try to migrate to more rewarding careers in Information Technology or Business Management and the less talented ones reluctantly join the mining industry, where the authority and remunerations of Mine Managers have since been grossly diluted and leveled up with incumbents of other disciplines. This is reflecting on the quality and efficiency of operations and resulting in lack of innovation and development of technologies. Therefore, it is high time to restructure and raise the levels of the heirarchial status, authority and remuneration of mine managers.
Most of the large mining companies in our country are to day in Public Sector with strong Administrative culture of Government departments. This is not conductive to modern day competitive business culture,
so essential for survival within a liberalized and globallised economy. Even if these companies continue to remain in Public Sector, they should be given almost total autonomy in planning, decision making, operating and marketing so as to achieve capital productivity, profitability and consumer satisfaction comparable to those of national and global private sector companies.
Extending this business like approach, the government may also give freedom to service-sector government organizations like Railways to take more proactive approach towards mining industry. For example, Railways can consider providing dedicated railway lines for mining projects. Similarly, Railway can frame special rules for rail movement of minerals. Going by the same considerations, mining companies may be permitted to purchase power in bulk directly from public sector or private sector power producers. Lastly, the State and Central Governments may constitute special cells to serve as single window problem solving point for mining industry and speedy follow up of mining industry’s cases pending with the Governments.
One of the reasons for lack of awareness about paramount importance of mining industry in national economy and for failure in gibing it a priority treatment, is the lacks of intellectual focus on the industry. There is hardly any organization which can forcefully take up the cause of mining industry with the national government as well as with the international forum. The

v
nearest any organization has gone to address the problem is MGMI, which has its own limitations. So far, MGMI has mainly been holding seminars, workshops, symposia etc., to increase awareness in the areas of relevant technologies. This has only augmented the efforts of the academia and has not helped in putting forward the strategic and economic aspects of the mining industry. It at all MGMI intends to serve as the main organ for serving the cause of the mining and allied industries, it has to consider undertaking the following activities in additional to what it has been doing so far.
• ItshouldoperateaPolicyCellforminingand allied industries to have its voice heard on national and global issues of relevance as is done by FICCI and FII.
• ItshouldactivateitsConsultancyCellonbusiness lines.
• It should hold National MineralConvention every year to round up the mineral scenario.
• It should constitute a Board ofGovernors with eminent industry- leaders, economists, academicians, technologists etc. to continuously review the ground situation and to often advice.
• It should introduce and run in collaboration with professionals/academic bodies, professional courses/programmes for mineral industries as is being done by All India Management Association for the management professional. Some of the courses/programme suggested are:
a. Post Graduate Executive Diploma on Management of Mineral Business (with specialization in coal or metal)
b. Certified Mineral Economists andBusiness Analysts.
c. Post Graduate Executive Diploma in Human Resource Management for Mineral Industries.
• It should institute a CorporateLeadership Award for Mineral Industry to be presented to the Corporate Leader who measures up to a set of specified performance parameters.A person can be nominated for the Award only once in his career. If in any year, suitable candidate is not available, the Award may be withheld for that year.
• It should also institute five timeAchievement Awards to be presented every year to retired persons below the Board Level who have rendered such outstanding services to the mineral industry which have left positive impact in the industry.
It is high time, therefore, that MGMI may consciously decide whether it will remain a knowledge sharing organization or endeavor to take the leadership of the mineral industry professionally to elevate the industry in high pedestal of Indian Economy that if rightfully deserves.
Even going by the job already done by MGMI during the long existence, one is inclined to be depressed to see the manner in which the recommendations of its umpteen number of

vi
vii
16th Foundation Day Lecture
RoLe oF Science in Human WeLLbeing
Dr S chandrasekhar*Science can be subdivided into many disciplines, major three are Physical (Physics & Chemistry), Biological (Botany & Zoology) and Earth Sciences (Geology and Astronomy). Human wellbeing has contributions from all the branches of science, some very obvious (like Chemistry) and others not so conspicuous (for example Astronomy). Life expectancy of humans has doubled in the last hundred years due to the contributions of scientists. Though sportspersons and movie actors get a huge fan following and are treated as Celebrities, none can forget the names like Newton, Einstein, Watson & Crick and closer to home, Prof CNR Rao and Dr APJ Abdul Kalam. They remain celebrities for a very long time. With improvements in medicare and personal hygiene, humans on an average live upto ~70 years worldwide whereas the average age was ~35 years in the last century. Good health encompasses prevention of diseases, early and accurate diagnosis, total cure and preferentially, personalised medicine. Indians have 6 modes of treatment comprising of Ayurveda, Yoga, Unani, Siddha, Homeopathy and Allopathy (modern medicine). Modern medicine concentrates on use of molecules for treatment of human diseases. Molecules as small as Aspirin to big ones like antibodies and proteins have been used for treatment of diseases. Aspirin is a celebrity molecule as it has been used for more than a century and still occupies a prime position with new uses being discovered even now. Simpler molecules like aspirin or paracetamol to complex molecules like eribulin or rapamycin or big molecules like insulin or antibodies have contributed for the human wellbeing. CSIR has contributed immensely in the development of technologies for some of the important drug molecules. The first generation of drug molecules were very effective initially but the emergence of resistant parasites has changed the focus to identification of new drug molecules. CSIR in general and CSIR-IICT in particular has been working constantly to develop technologies for new molecules. Some of the examples of drug molecules that CSIR-IICT has been working on are:1. Bedaquiline is the latest molecule identified for the treatment of multi-drug resistant TB.
CSIR-IICT has developed a process for effective synthesis of this very important molecule.2. Malaria is another disease of the tropical countries with a report of 214 million deaths in 2015.
Hyderabad is proud of the contributions of Dr Ronald Ross who was awarded a Nobel prize for identifying the lifecycleofmalarialparasite.Theearlier identifiedmolecules-quinineandchloroquinefacedtheissueofresistance.Identificationofartemisininandkalhinolhavehelpedin treatment of resistant malaria.
3. Eribulin is one of the biggest and complex synthesized drug molecule. CSIR-IICT has successfully completed the synthesis of this molecule in the lab, the second only after the company marketing this drug.
In a poll conducted on the millennials, climate change has appeared as the highest concern of the world. Instead of focusing on the GDP, the countries are measured on happiness index. Healthy years of life expectancy is one of the criteria for deciding the happiness index. In addition to the silent pharmaceutical revolution that has contributed to the human wellbeing, Green, White and Blue revolutions have changed the way we live today. We all should strive for meeting the UN’s Sustainable Goals.
* Director, CSIR-Indian Institute of Chemical Technology, Hyderabad

Technical PaPers
1
STRATEGIES FOR UNDERGROUND EXTRACTION OF THE INCLINED COAL SEAMS BY CONTINUOUS MINER
Arka Jyoti Das1, Prabhat Kumar Mandal2, Partha Sarathi Paul3, Rabindra Kumar Sinha4
ABSTRACT
Large-scale mechanisation in underground coal mining becomes necessaryto meet the gap between the demand and the supply of coal in Indiabyimprovingthe production and productivity. The mechanisation becomes difficult when the inclination of the coal seam is high,as it involves a number of geotechnical and operational issues. In India, there are huge reserves of the coal where the seams are inclined. Unless, these coal seams are extracted applying proper methodologies, the working would be jeopardised due to the severe geotechnical problems. Therefore, it is important to understand the behaviour of the rock mass during the working in the inclined coal seam. In this study, the field investigation and the numerical modelling are carried out to assess the stability of the workings of the inclined coal seams. The effect of the inclination on the stability of surrounding rock masses is evaluated by parametric study through numerical modelling. The variation of the inclined pillar strength, the stress regime and the failure zone are presented in this study. The case study of the Shantikhani Mine ofSingereni Collieries Company Limited are presented where the workingsare carried out in the inclined coal seams.
Keywords : Inclined coal seam, apparent dip, ubiquitous joint, rhombus shaped pillar, yield zone
1Scientist, CSIR-Central Institute of Mining and Fuel Research, Barwa Road, Dhanbad, 826015, Email : [email protected] / [email protected] Principal Scientist, CSIR-Central Institute of Mining and Fuel Research, Barwa Road, Dhanbad, 826015, Email : [email protected] / [email protected] Professor, Indian Institute of Technology (Indian School of Mines), Dhanbad, 826004, Email : [email protected] Professor, Indian Institute of Technology (Indian School of Mines), Dhanbad, 826004, Email : [email protected]
1.0 Introduction
Right from its genesis, the commercial coal mining in India has been dictated by the needs of the domestic consumption. Due to the growing demand for coal in India, the production requires to increase manifold to bridge the gap between the demand and supply. Underground coal mining needs large-scale mechanisation for improvement of the production, productivity and its sustainability which is generally found poor in comparison to opencast mining. Therefore, the mechanisation of underground coal mines is required by adopting mass production technologies. The mechanisation of underground mines becomes difficult when the inclination of the coal seam is high as it involves a number of geotechnical and operational issues (Mandal et al., 2015, Das et al., 2017). Mechanised extraction
of an inclined coal seam by the bord and pillar method of mining is a major challenge to the mining industry. The recommendations of the 10th National Conference on Safety in Mines also emphasised the introduction of mechanisation even in dipping seams to phase out manual loading for improving the safety standards and also to offset the human drudgery.
The deployment of machinery for extraction of the dipping coal seams encounters several operational and strata control problems. In India, a large amount of coal reserve exists in the dipping coal seams. To extract these coal seams, proper methodology of mining and strata management techniques should be designed for geotechnical and strata control point of view. Due to the inclination of the coal seams,

2
it creates problems to the manoeuvring of man and machinery. Therefore, it is practised to develop the coal seam by familiar bord and pillar method along the apparent dip of the seam resulting formation of rhombus shaped pillars consisting two acute angled corners. As these corners are situated adjacent to the junction, highstress values are developed on these corners resulting failure of the corners and the increase of the area of exposure of the junction causing instability or failure of the junction. Therefore, the stability of the junction is a serious concern during the working in the inclined coal seam. Due to the inclination of the strata, the bedding planes also try to slide along the true dip (He et al. 2012; Ran et al., 1994). As the rock is weak in shear, there is a possibility of shearing and separation among the bedding planes (Yun-Mei et al., 1984; Xin et al., 2014). This problem is further accentuated when the roof strata are watery. This is due to the additional pressure of water along the direction of sliding. The presence of water in strata further reduces the shear strength of the bedding planes. Another important parameter of the stability of the strata is the orientation of the in-situ stresses. If the direction of the major principal in-situ stress is along the direction of the inclination of the bedding planes, it further helps the bedding planes to slide and reduce the stability of the overlying strata. If these steeply inclined coal seams are developed and extracted in the same manner as a flat deposit, there may be chances of serious instability issues in respect of ground control besides operational difficulties. In this paper, the effect of the inclination of the strata and the coal seam on the stability of the surrounding rock masses is evaluated by parametric study through numerical modelling with FLAC3D (Itasca, 2017). The ubiquitous joint model (Kazakidis and Diederichs, 1993; Wang and Huang, 2014) is used to consider the shearing effect of the bedding planes. A parametric study is done to know the stress distribution and stability of the strata with respect to the inclination of the strata. The rock load height above the galleries is estimated by calculating the safety factor of the immediate roof. One case-study of the working in the inclined coal
seam at theShantikhaniMine of Singereni Collieries Company Limited (SCCL) in India has been presented in this study.
2.0 Design of numerical model
In this study, numerical modelling is carried out to evaluate the effect of the various parameters of the inclined coal seam on the strength of the coal pillar as well as the stress regime. In each case, prior to excavation, the model was initially consolidated to reach equilibrium under the specified boundary conditions and the gravity the rock mass in order to produce the in-situ stress field. Here, the model is first assumed to be an elastic medium. Such equilibrium condition is determined through monitoring the system unbalance force history. Once the model is reached to the equilibrium state, the calibrated properties of the Mohr-Coulomb strain softening model are assigned to the coal seam whereas the surrounding rock strata are simulated by the Mohr-Coulomb elasto-plastic model (Mandal et al., 2008). The properties of the ubiquitous joint model are applied to the numerical modelling to simulate the behaviour of the bedding planes.Then, the excavation is carried out to evaluate the behaviour and the stability of the surrounding rock mass.
2.1 Numerical modelling of bedding planes by ubiquitous joint model
The change in the local stress magnitude or orientation significantly affects the slipping behaviour of the surrounding rock mass along the discontinuities plane. In spite of havingthesame magnitude of the stress, the rotation of the stress tensor can induce slippage along the planes of weakness if the direction of the induced stress is unfavourable to the discontinuities present in the rock mass. In an inclined coal seam, the bedding planes are found to be as major weakness planes. The effects of these weakness planes of the coal seam are considered as ubiquitous joint and simulated as continuum model by FLAC3D (Lorig and Cabrera, 2013). It is generally accepted that the presence of the ubiquitous planes of weakness does not alter the stress regime from the model without the
3
weakness planes until and unless the failure is initiated (Kazakidis and Diederichs, 1993). The ubiquitous planes remain unnoticed until the shear stress acting on them exceeds the strength of the weakness planes. The direction of movement at the onset of shear failure should coincide with the direction of maximum shear stress on the slip plane immediately before the strength is exceeded. To simulate the effect of the bedding planes on the strength and the deformation of a coal seam, at first, the pillar is modelled as elastic material to generate the in-situ stresses within the pillar. During the development stage, the bedding planes are incorporated by the ubiquitous joint model. The calibrated ubiquitous Mohr-Coulomb strain softening constitutive model is used for the coal matrix. Therefore, both the matrix failure and the bedding planes failure determine the load bearing capacity of the coal pillar. The strength is estimated by the compressive testing which is analogous to that of the laboratory estimation of the uniaxial compressive strength under the servo-controlled testing conditions.
2.2 Determination of the rock mass properties
The determination of the input parameters for numerical modelling is not a trivial task. Scaling of the physico-mechanical properties of the laboratory test of the intact rock to the rock mass is essential for successful simulation of an underground working (Das et al., 2017).
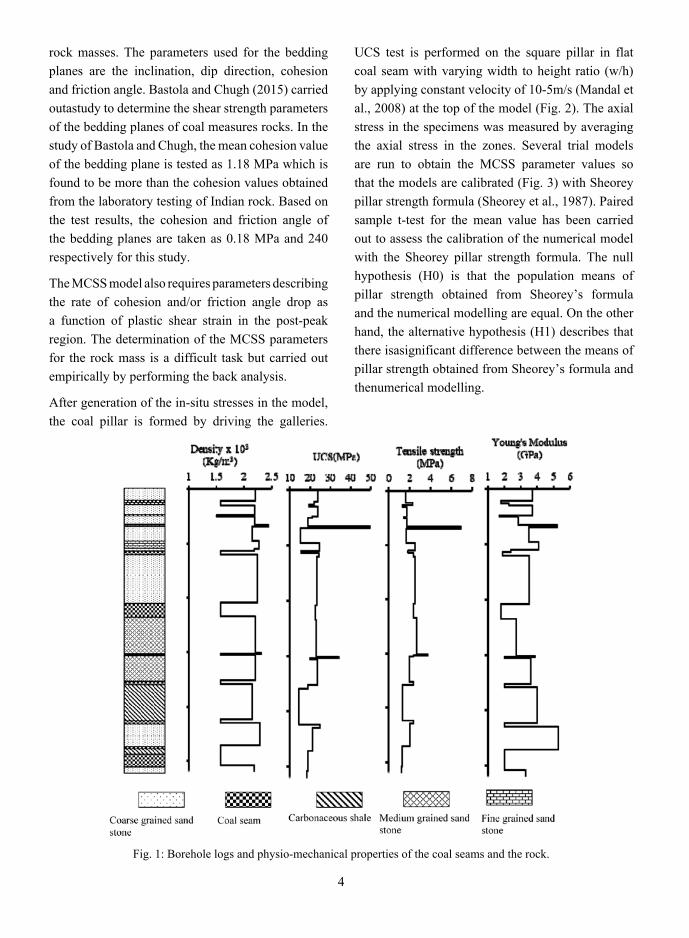
The various strength and elastic constants of both the rock matrix and the bedding planes for numerical modelling using FLAC3D in the strain-softening model with ubiquitous joint represented as bedding planes are: a) elastic constants as given in Fig. 1 b) peak and residual cohesions and friction angles, c) variation of cohesion and friction angles with plastic shear strain for rock matrix, d) in-situ stress condition and e) dip, dip direction, cohesion and friction angle of bedding planes. The shear strength and friction angle for the rock matrix are estimated using Sheorey (1997) failure criterion for rock masses. This criterion uses the 1976 version of RMR
of Bieniawski (1976) for reducing the laboratory strength parameters to give the corresponding rock mass values. It is found from the study (Mohan et al., 2001; Kushwaha et al., 2005; Kushwaha and Banerjee, 2005) that the values of rock mass shear strength and friction angle, so determined is required to be changed slightly to account for the fact that the Mohr-Coulomb strain softening (MCSS) plasticity model in FLAC3D uses the linear Mohr–Coulomb criterion while the Sheorey criterion is non-linear. The value of rock mass shear strength obtained from the Sheorey criterion is increased by 10% and that of rock mass friction angle is reduced by 50 to use them as the Mohr–Coulomb parameters.
2.3 In-situ stress
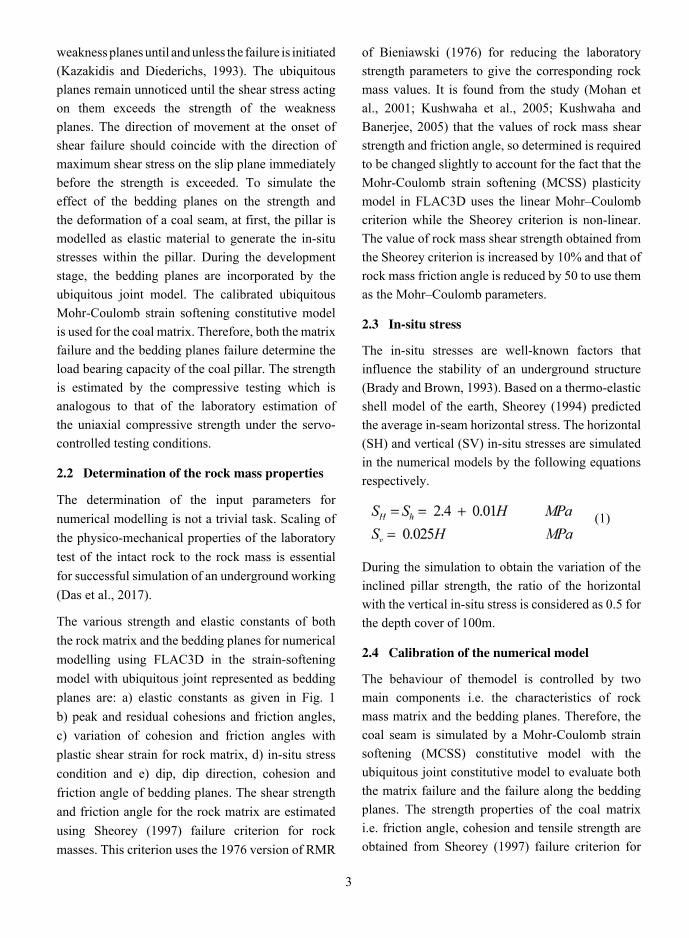
The in-situ stresses are well-known factors that influence the stability of an underground structure (Brady and Brown, 1993). Based on a thermo-elastic shell model of the earth, Sheorey (1994) predicted the average in-seam horizontal stress. The horizontal (SH) and vertical (SV) in-situ stresses are simulated in the numerical models by the following equations respectively.
(1)
During the simulation to obtain the variation of the inclined pillar strength, the ratio of the horizontal with the vertical in-situ stress is considered as 0.5 for the depth cover of 100m.
2.4 Calibration of the numerical model
The behaviour of themodel is controlled by two main components i.e. the characteristics of rock mass matrix and the bedding planes. Therefore, the coal seam is simulated by a Mohr-Coulomb strain softening (MCSS) constitutive model with the ubiquitous joint constitutive model to evaluate both the matrix failure and the failure along the bedding planes. The strength properties of the coal matrix i.e. friction angle, cohesion and tensile strength are obtained from Sheorey (1997) failure criterion for
4
rock masses. The parameters used for the bedding planes are the inclination, dip direction, cohesion and friction angle. Bastola and Chugh (2015) carried outastudy to determine the shear strength parameters of the bedding planes of coal measures rocks. In the study of Bastola and Chugh, the mean cohesion value of the bedding plane is tested as 1.18 MPa which is found to be more than the cohesion values obtained from the laboratory testing of Indian rock. Based on the test results, the cohesion and friction angle of the bedding planes are taken as 0.18 MPa and 240 respectively for this study.
The MCSS model also requires parameters describing the rate of cohesion and/or friction angle drop as a function of plastic shear strain in the post-peak region. The determination of the MCSS parameters for the rock mass is a difficult task but carried out empirically by performing the back analysis.
After generation of the in-situ stresses in the model, the coal pillar is formed by driving the galleries.
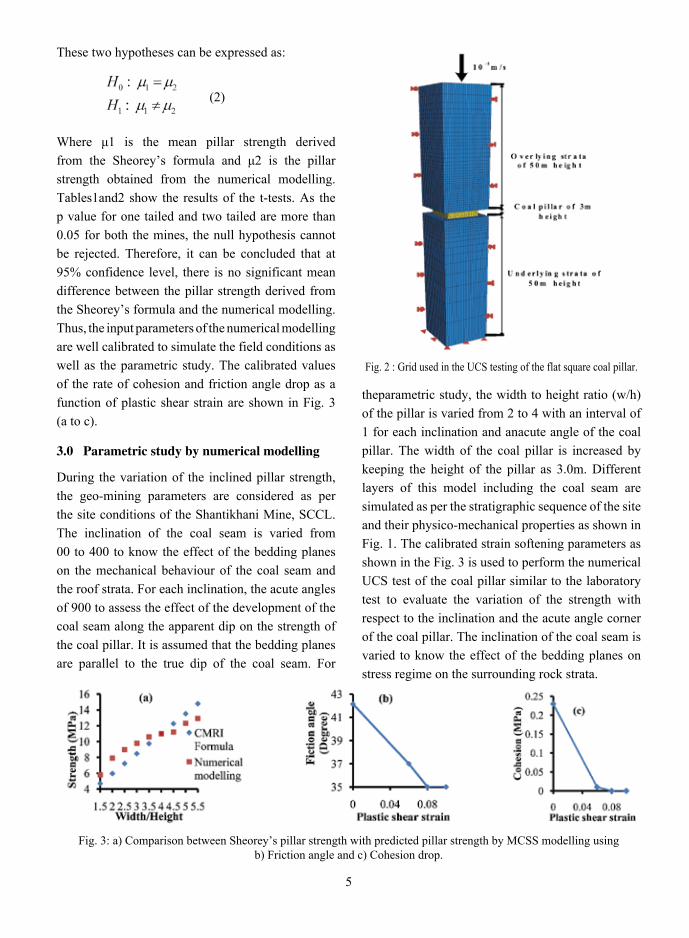
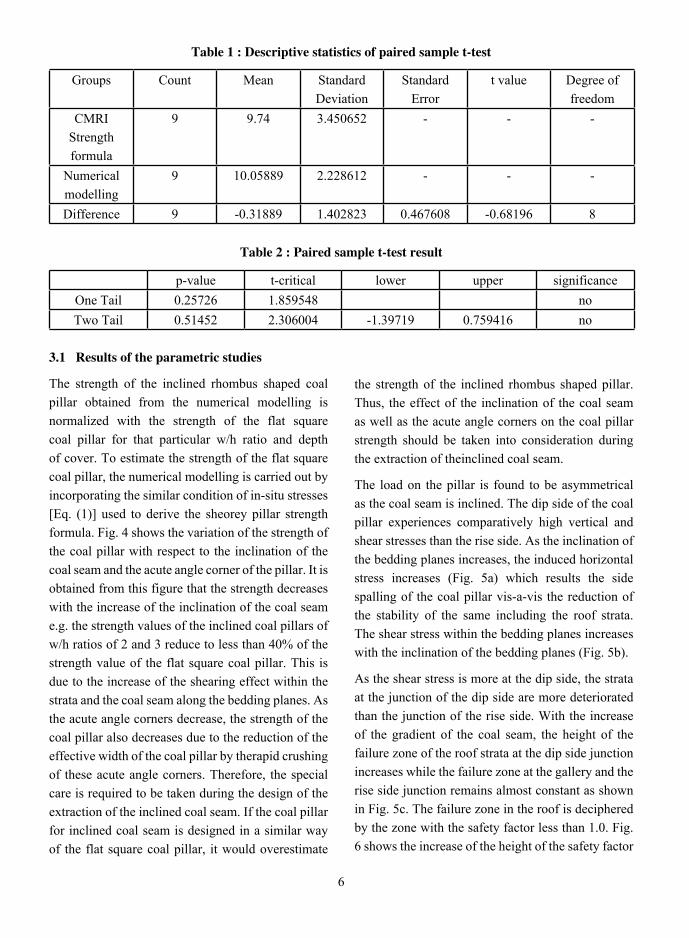
UCS test is performed on the square pillar in flat coal seam with varying width to height ratio (w/h) by applying constant velocity of 10-5m/s (Mandal et al., 2008) at the top of the model (Fig. 2). The axial stress in the specimens was measured by averaging the axial stress in the zones. Several trial models are run to obtain the MCSS parameter values so that the models are calibrated (Fig. 3) with Sheorey pillar strength formula (Sheorey et al., 1987). Paired sample t-test for the mean value has been carried out to assess the calibration of the numerical model with the Sheorey pillar strength formula. The null hypothesis (H0) is that the population means of pillar strength obtained from Sheorey’s formula and the numerical modelling are equal. On the other hand, the alternative hypothesis (H1) describes that there isasignificant difference between the means of pillar strength obtained from Sheorey’s formula and thenumerical modelling.
Fig. 1: Borehole logs and physio-mechanical properties of the coal seams and the rock.
5
These two hypotheses can be expressed as:
(2)
Where μ1 is the mean pillar strength derived from the Sheorey’s formula and μ2 is the pillar strength obtained from the numerical modelling. Tables1and2 show the results of the t-tests. As the p value for one tailed and two tailed are more than 0.05 for both the mines, the null hypothesis cannot be rejected. Therefore, it can be concluded that at 95% confidence level, there is no significant mean difference between the pillar strength derived from the Sheorey’s formula and the numerical modelling. Thus, the input parameters of the numerical modelling are well calibrated to simulate the field conditions as well as the parametric study. The calibrated values of the rate of cohesion and friction angle drop as a function of plastic shear strain are shown in Fig. 3 (a to c).
3.0 Parametric study by numerical modelling
During the variation of the inclined pillar strength, the geo-mining parameters are considered as per the site conditions of the Shantikhani Mine, SCCL. The inclination of the coal seam is varied from 00 to 400 to know the effect of the bedding planes on the mechanical behaviour of the coal seam and the roof strata. For each inclination, the acute angles of 900 to assess the effect of the development of the coal seam along the apparent dip on the strength of the coal pillar. It is assumed that the bedding planes are parallel to the true dip of the coal seam. For
Fig. 2 : Grid used in the UCS testing of the flat square coal pillar.
theparametric study, the width to height ratio (w/h) of the pillar is varied from 2 to 4 with an interval of 1 for each inclination and anacute angle of the coal pillar. The width of the coal pillar is increased by keeping the height of the pillar as 3.0m. Different layers of this model including the coal seam are simulated as per the stratigraphic sequence of the site and their physico-mechanical properties as shown in Fig. 1. The calibrated strain softening parameters as shown in the Fig. 3 is used to perform the numerical UCS test of the coal pillar similar to the laboratory test to evaluate the variation of the strength with respect to the inclination and the acute angle corner of the coal pillar. The inclination of the coal seam is varied to know the effect of the bedding planes on stress regime on the surrounding rock strata.
Fig. 3: a) Comparison between Sheorey’s pillar strength with predicted pillar strength by MCSS modelling using b) Friction angle and c) Cohesion drop.
6
Table 1 : Descriptive statistics of paired sample t-test
Groups Count Mean Standard Deviation
Standard Error
t value Degree of freedom
CMRI Strength formula
9 9.74 3.450652 - - -
Numerical modelling
9 10.05889 2.228612 - - -
Difference 9 -0.31889 1.402823 0.467608 -0.68196 8
Table 2 : Paired sample t-test result
p-value t-critical lower upper significanceOne Tail 0.25726 1.859548 noTwo Tail 0.51452 2.306004 -1.39719 0.759416 no
3.1 Results of the parametric studies
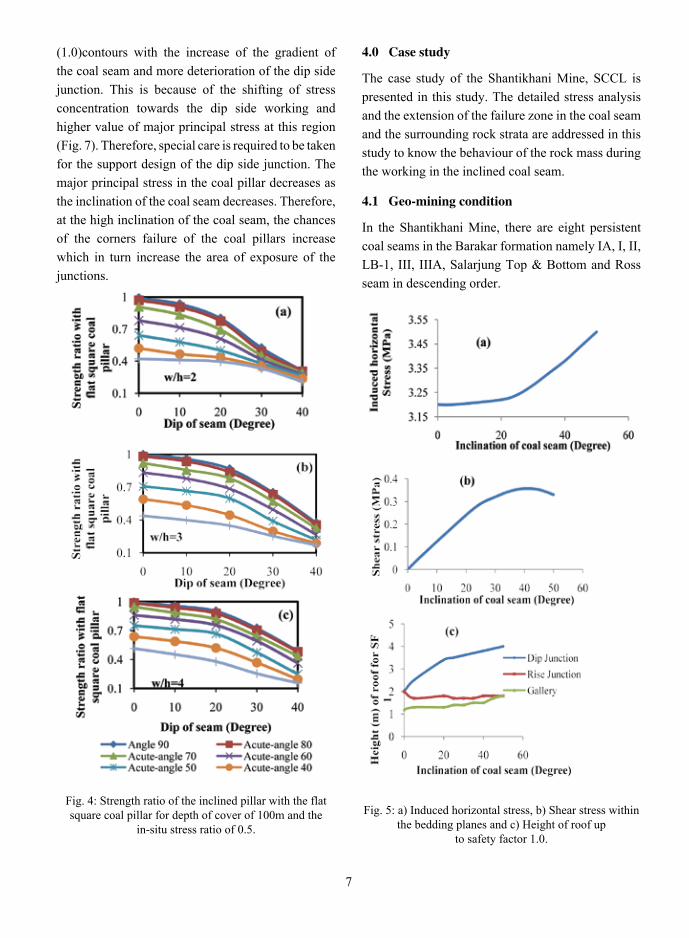
The strength of the inclined rhombus shaped coal pillar obtained from the numerical modelling is normalized with the strength of the flat square coal pillar for that particular w/h ratio and depth of cover. To estimate the strength of the flat square coal pillar, the numerical modelling is carried out by incorporating the similar condition of in-situ stresses [Eq. (1)] used to derive the sheorey pillar strength formula. Fig. 4 shows the variation of the strength of the coal pillar with respect to the inclination of the coal seam and the acute angle corner of the pillar. It is obtained from this figure that the strength decreases with the increase of the inclination of the coal seam e.g. the strength values of the inclined coal pillars of w/h ratios of 2 and 3 reduce to less than 40% of the strength value of the flat square coal pillar. This is due to the increase of the shearing effect within the strata and the coal seam along the bedding planes. As the acute angle corners decrease, the strength of the coal pillar also decreases due to the reduction of the effective width of the coal pillar by therapid crushing of these acute angle corners. Therefore, the special care is required to be taken during the design of the extraction of the inclined coal seam. If the coal pillar for inclined coal seam is designed in a similar way of the flat square coal pillar, it would overestimate
the strength of the inclined rhombus shaped pillar. Thus, the effect of the inclination of the coal seam as well as the acute angle corners on the coal pillar strength should be taken into consideration during the extraction of theinclined coal seam.
The load on the pillar is found to be asymmetrical as the coal seam is inclined. The dip side of the coal pillar experiences comparatively high vertical and shear stresses than the rise side. As the inclination of the bedding planes increases, the induced horizontal stress increases (Fig. 5a) which results the side spalling of the coal pillar vis-a-vis the reduction of the stability of the same including the roof strata. The shear stress within the bedding planes increases with the inclination of the bedding planes (Fig. 5b).
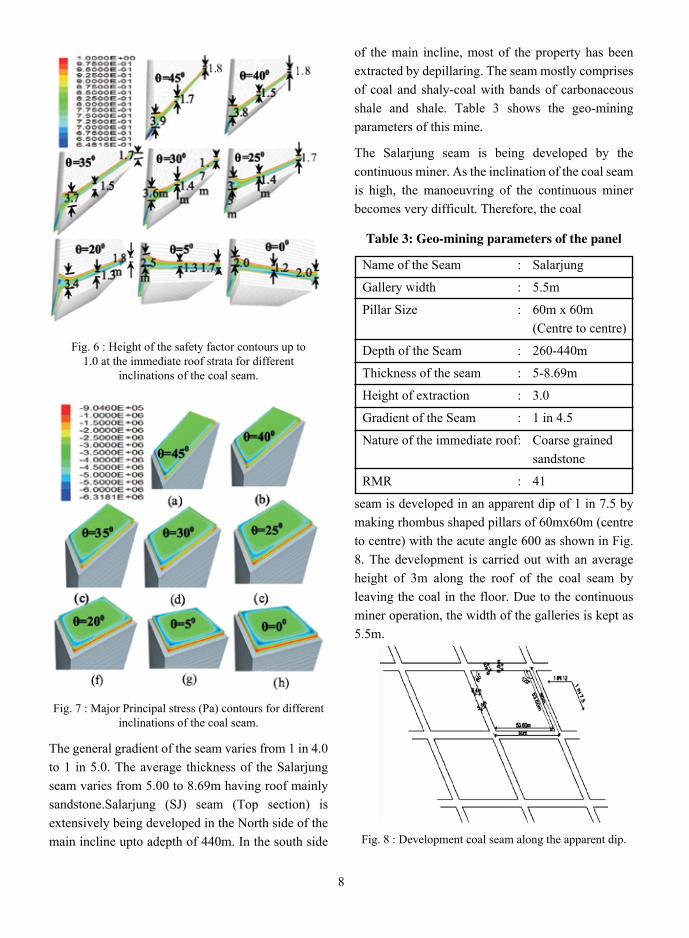
As the shear stress is more at the dip side, the strata at the junction of the dip side are more deteriorated than the junction of the rise side. With the increase of the gradient of the coal seam, the height of the failure zone of the roof strata at the dip side junction increases while the failure zone at the gallery and the rise side junction remains almost constant as shown in Fig. 5c. The failure zone in the roof is deciphered by the zone with the safety factor less than 1.0. Fig. 6 shows the increase of the height of the safety factor
7
4.0 Case study
The case study of the Shantikhani Mine, SCCL is presented in this study. The detailed stress analysis and the extension of the failure zone in the coal seam and the surrounding rock strata are addressed in this study to know the behaviour of the rock mass during the working in the inclined coal seam.
4.1 Geo-mining condition
In the Shantikhani Mine, there are eight persistent coal seams in the Barakar formation namely IA, I, II, LB-1, III, IIIA, Salarjung Top & Bottom and Ross seam in descending order.
Fig. 5: a) Induced horizontal stress, b) Shear stress within the bedding planes and c) Height of roof up
to safety factor 1.0.
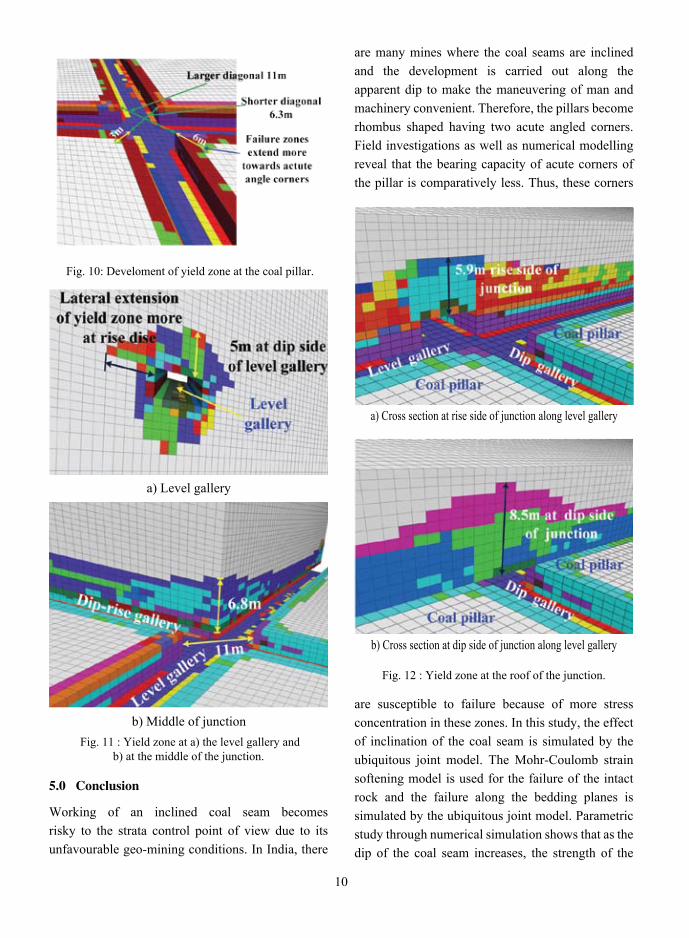
(1.0)contours with the increase of the gradient of the coal seam and more deterioration of the dip side junction. This is because of the shifting of stress concentration towards the dip side working and higher value of major principal stress at this region (Fig. 7). Therefore, special care is required to be taken for the support design of the dip side junction. The major principal stress in the coal pillar decreases as the inclination of the coal seam decreases. Therefore, at the high inclination of the coal seam, the chances of the corners failure of the coal pillars increase which in turn increase the area of exposure of the junctions.
Fig. 4: Strength ratio of the inclined pillar with the flat square coal pillar for depth of cover of 100m and the
in-situ stress ratio of 0.5.
8
of the main incline, most of the property has been extracted by depillaring. The seam mostly comprises of coal and shaly-coal with bands of carbonaceous shale and shale. Table 3 shows the geo-mining parameters of this mine.
The Salarjung seam is being developed by the continuous miner. As the inclination of the coal seam is high, the manoeuvring of the continuous miner becomes very difficult. Therefore, the coal
Table 3: Geo-mining parameters of the panel
Name of the Seam : Salarjung
Gallery width : 5.5m
Pillar Size : 60m x 60m (Centre to centre)
Depth of the Seam : 260-440m
Thickness of the seam : 5-8.69m
Height of extraction : 3.0
Gradient of the Seam : 1 in 4.5
Nature of the immediate roof : Coarse grained sandstone
RMR : 41
seam is developed in an apparent dip of 1 in 7.5 by making rhombus shaped pillars of 60mx60m (centre to centre) with the acute angle 600 as shown in Fig. 8. The development is carried out with an average height of 3m along the roof of the coal seam by leaving the coal in the floor. Due to the continuous miner operation, the width of the galleries is kept as 5.5m.
Fig. 8 : Development coal seam along the apparent dip.
Fig. 6 : Height of the safety factor contours up to 1.0 at the immediate roof strata for different
inclinations of the coal seam.
Fig. 7 : Major Principal stress (Pa) contours for different inclinations of the coal seam.
The general gradient of the seam varies from 1 in 4.0 to 1 in 5.0. The average thickness of the Salarjung seam varies from 5.00 to 8.69m having roof mainly sandstone.Salarjung (SJ) seam (Top section) is extensively being developed in the North side of the main incline upto adepth of 440m. In the south side

9
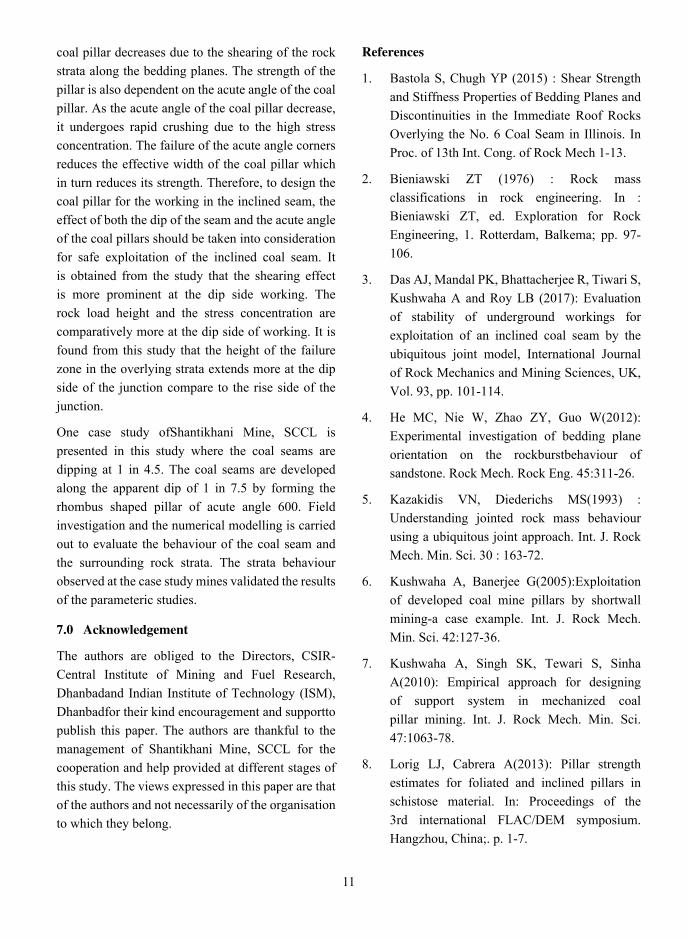
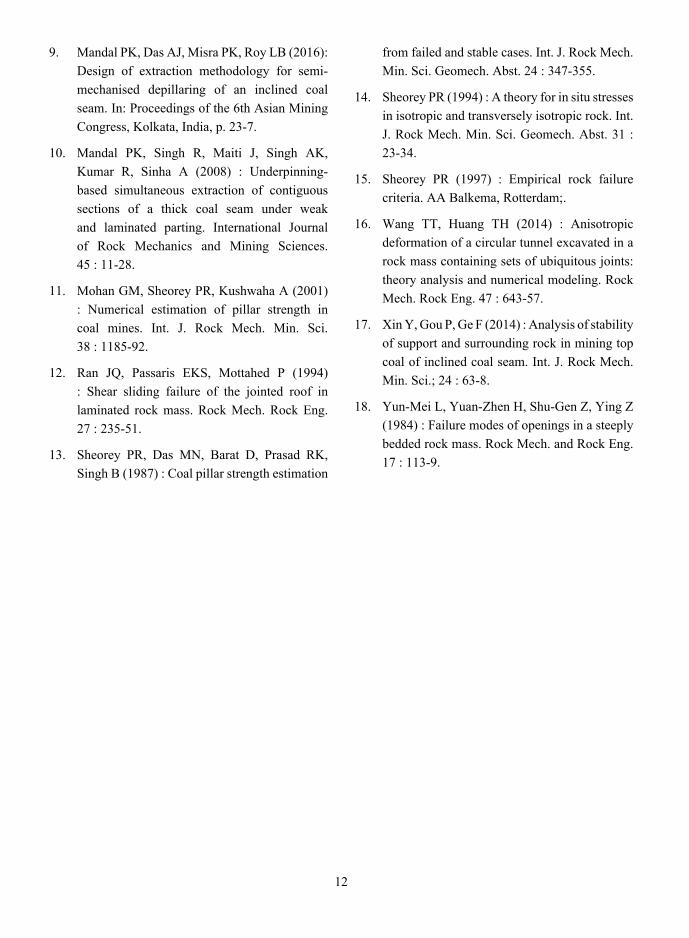
of the failure zones is more at the dip side of the level gallery. But, the lateral extension of the yield zone for the edge of the pillar is more on the rise side of the level gallery. As the coal seam is developed along the apparent dip, the junction also becomes the rhombus shaped along with the coal pillar. Therefore, the larger diagonal of the junction is 11m and the shorter diagonal is 6m. With these dimensions of the junction, the height of the failure zone at the middle of the junction becomes 6.8m as shown in Fig. 11(b). But, the height decreases to 5.9m at the rise side and increases to 8.5m at the dip side of the junction as shown in the Fig. 12. Therefore, the dip side of the junction should be supported properly to ensure the stability of the junction. The failure of the acute angle corners of the pillar should be prevented by the side bolting to restrict the further increase of the area of the junction. As the shear failure of the roof rock at the rise side of the gallery and the junction is dominant, the top row of the side bolt should be inserted in such a way that the bolt should penetrate both coal pillar and the roof rock. It would prevent the sliding of the roof rock along the interface of the coal pillar.
Fig. 9 : Contours showing stress development in coal pillar.
4.3 Numerical modelling for the analysis of stresses and failure zone
To evaluate the stress distribution and the failure zone analysis, the numerical modelling is carried out as per the borehole data and the physico-mechanical properties shown in Fig. 1. The intact rock properties are converted to the rock mass properties bySheorey (1997) failure criterion for rock masses. The calibrated strain softening parameters as shown in Fig. 3 are used to simulate the coal seams. The measured values of the in-situ stresses are used in the numerical model which is varied with the depth of cover according to the Eq. (3). The level and dip-rise galleries make the angle of 330 and 170 respectively with the direction of the major horizontal stress. Therefore, the in-situ stresses are resolved into the components along the x and y direction to apply in the numerical simulation.
(3)
4.4 Results of the numerical modelling
For the Fig. 9, it is obtained that the maximum vertical and the major principal stresses are around 18MPa which is almost two times of the vertical in-situ stress. This stress concentration occurs at the acute angle corners of the rhombus shaped coal pillar. Due to the high stress concentration at the acute angle corners, the failure zones extend more compare to the obtuse angle corners. Fig. 10 shows that the length of the failure zones at the acute angle corners is 6m whereas failure zones extend 3m at the obtuse angle corners. This is because of the larger exposure of the junction along the along the acute angle corners than the exposure along obtuse angle corners. With the 5.5m width of the gallery, the height of the failure zones at the level gallery reaches to 5m as shown in Fig. 11(a). This figure illustrates theasymmetrical distribution of the failure zone at the roof of the level gallery. Due to the tendency of the sliding down of the roof strata along the bedding planes, the height
10
are many mines where the coal seams are inclined and the development is carried out along the apparent dip to make the maneuvering of man and machinery convenient. Therefore, the pillars become rhombus shaped having two acute angled corners. Field investigations as well as numerical modelling reveal that the bearing capacity of acute corners of the pillar is comparatively less. Thus, these corners
are susceptible to failure because of more stress concentration in these zones. In this study, the effect of inclination of the coal seam is simulated by the ubiquitous joint model. The Mohr-Coulomb strain softening model is used for the failure of the intact rock and the failure along the bedding planes is simulated by the ubiquitous joint model. Parametric study through numerical simulation shows that as the dip of the coal seam increases, the strength of the
Fig. 10: Develoment of yield zone at the coal pillar.
Fig. 11 : Yield zone at a) the level gallery and b) at the middle of the junction.
5.0 Conclusion
Working of an inclined coal seam becomes risky to the strata control point of view due to its unfavourable geo-mining conditions. In India, there
Fig. 12 : Yield zone at the roof of the junction.
a) Cross section at rise side of junction along level gallery
b) Cross section at dip side of junction along level gallery
a) Level gallery
b) Middle of junction
11
coal pillar decreases due to the shearing of the rock strata along the bedding planes. The strength of the pillar is also dependent on the acute angle of the coal pillar. As the acute angle of the coal pillar decrease, it undergoes rapid crushing due to the high stress concentration. The failure of the acute angle corners reduces the effective width of the coal pillar which in turn reduces its strength. Therefore, to design the coal pillar for the working in the inclined seam, the effect of both the dip of the seam and the acute angle of the coal pillars should be taken into consideration for safe exploitation of the inclined coal seam. It is obtained from the study that the shearing effect is more prominent at the dip side working. The rock load height and the stress concentration are comparatively more at the dip side of working. It is found from this study that the height of the failure zone in the overlying strata extends more at the dip side of the junction compare to the rise side of the junction.
One case study ofShantikhani Mine, SCCL is presented in this study where the coal seams are dipping at 1 in 4.5. The coal seams are developed along the apparent dip of 1 in 7.5 by forming the rhombus shaped pillar of acute angle 600. Field investigation and the numerical modelling is carried out to evaluate the behaviour of the coal seam and the surrounding rock strata. The strata behaviour observed at the case study mines validated the results of the parameteric studies.
7.0 Acknowledgement
The authors are obliged to the Directors, CSIR-Central Institute of Mining and Fuel Research, Dhanbadand Indian Institute of Technology (ISM), Dhanbadfor their kind encouragement and supportto publish this paper. The authors are thankful to the management of Shantikhani Mine, SCCL for the cooperation and help provided at different stages of this study. The views expressed in this paper are that of the authors and not necessarily of the organisation to which they belong.
References
1. Bastola S, Chugh YP (2015) : Shear Strength and Stiffness Properties of Bedding Planes and Discontinuities in the Immediate Roof Rocks Overlying the No. 6 Coal Seam in Illinois. In Proc. of 13th Int. Cong. of Rock Mech 1-13.
2. Bieniawski ZT (1976) : Rock mass classifications in rock engineering. In : Bieniawski ZT, ed. Exploration for Rock Engineering, 1. Rotterdam, Balkema; pp. 97-106.
3. Das AJ, Mandal PK, Bhattacherjee R, Tiwari S, Kushwaha A and Roy LB (2017): Evaluation of stability of underground workings for exploitation of an inclined coal seam by the ubiquitous joint model, International Journal of Rock Mechanics and Mining Sciences, UK, Vol. 93, pp. 101-114.
4. He MC, Nie W, Zhao ZY, Guo W(2012): Experimental investigation of bedding plane orientation on the rockburstbehaviour of sandstone. Rock Mech. Rock Eng. 45:311-26.
5. Kazakidis VN, Diederichs MS(1993) : Understanding jointed rock mass behaviour using a ubiquitous joint approach. Int. J. Rock Mech. Min. Sci. 30 : 163-72.
6. Kushwaha A, Banerjee G(2005):Exploitation of developed coal mine pillars by shortwall mining-a case example. Int. J. Rock Mech. Min. Sci. 42:127-36.
7. Kushwaha A, Singh SK, Tewari S, Sinha A(2010): Empirical approach for designing of support system in mechanized coal pillar mining. Int. J. Rock Mech. Min. Sci. 47:1063-78.
8. Lorig LJ, Cabrera A(2013): Pillar strength estimates for foliated and inclined pillars in schistose material. In: Proceedings of the 3rd international FLAC/DEM symposium. Hangzhou, China;. p. 1-7.
12
9. Mandal PK, Das AJ, Misra PK, Roy LB (2016): Design of extraction methodology for semi-mechanised depillaring of an inclined coal seam. In: Proceedings of the 6th Asian Mining Congress, Kolkata, India, p. 23-7.
10. Mandal PK, Singh R, Maiti J, Singh AK, Kumar R, Sinha A (2008) : Underpinning-based simultaneous extraction of contiguous sections of a thick coal seam under weak and laminated parting. International Journal of Rock Mechanics and Mining Sciences. 45 : 11-28.
11. Mohan GM, Sheorey PR, Kushwaha A (2001) : Numerical estimation of pillar strength in coal mines. Int. J. Rock Mech. Min. Sci. 38 : 1185-92.
12. Ran JQ, Passaris EKS, Mottahed P (1994) : Shear sliding failure of the jointed roof in laminated rock mass. Rock Mech. Rock Eng. 27 : 235-51.
13. Sheorey PR, Das MN, Barat D, Prasad RK, Singh B (1987) : Coal pillar strength estimation
from failed and stable cases. Int. J. Rock Mech. Min. Sci. Geomech. Abst. 24 : 347-355.
14. Sheorey PR (1994) : A theory for in situ stresses in isotropic and transversely isotropic rock. Int. J. Rock Mech. Min. Sci. Geomech. Abst. 31 : 23-34.
15. Sheorey PR (1997) : Empirical rock failure criteria. AA Balkema, Rotterdam;.
16. Wang TT, Huang TH (2014) : Anisotropic deformation of a circular tunnel excavated in a rock mass containing sets of ubiquitous joints: theory analysis and numerical modeling. Rock Mech. Rock Eng. 47 : 643-57.
17. Xin Y, Gou P, Ge F (2014) : Analysis of stability of support and surrounding rock in mining top coal of inclined coal seam. Int. J. Rock Mech. Min. Sci.; 24 : 63-8.
18. Yun-Mei L, Yuan-Zhen H, Shu-Gen Z, Ying Z (1984) : Failure modes of openings in a steeply bedded rock mass. Rock Mech. and Rock Eng. 17 : 113-9.

13
UTILISATION OF LOW GRADE CHROMITE ORE FOR THE PRODUCTION OF CARBON FREE FERROCHROME
Rajib Dey1, Siddhartha Mukherjee1, Maharshi Ghosh Dastidar1 Amit Kumar Bhandary2 , Mahua Ghosh Chaudhuri2
ABSTRACT
High Chromium containing alloy steel possesses superior metallurgical properties like hardenability, corrosion resistance and strength. This kind of alloy steel is extensively used for the production of various type of alloy steels like stainless steel, tool steel, high temperature alloy steel and super alloy. The conventional metallurgical process for the production of ferrochrome is submerged electrical arc furnace (SEAF) by the reduction of high grade chromite ore (Cr2O3contain>40%) withm etallurgical grade petroleum coke. However the problems arise in this process is huge consumption of metallurgical grade coke and high grade chromite ore for the preparation of ferrochrome. Besides that, availability of high grade chromiteore with Cr-Fe ratio more than 2.5 is also decreasing day by day with increasing huge demand. On the other hand enormous fines are generated during chromite mining with a low Cr:Fe ratio. Hence the proper use of these fines is very important after agglomeration. Further, after reduction of chromite ore by coke, it is very difficult toremove the remaining carbon unless going for second stage smelting using Fe-Si. The product so obtained during the preparation of ferrochrome is basically saturated with carbon (6-8% w/w) which generates a number of problems in low carbon alloy making. An attempt is being taken to pre-treat low grade chromite ore by coal gasification followed by aluminothermic smelting to get carbon free ferrochrome
Keywords : Low grade chromite ore, Agglomeration, Low carbon ferrochrome.
I. Introduction
Ferrochrome is one of the major ferro-alloys in the stainless steel making. It is the chief source of chromium and it is essential for the production of stainless steel. Chromium is used as alloying constituent of varieties of alloy steel. The main purpose of chromium is to impart stainless property in steels [1-2] It also makes the steel self-hardening and increases its hardenability and hardness. With low carbon content, high chromium steels (Cr>12%) are corrosion resistant. With high carbon content, chromium raises the abrasion and wear resistance.Chromium also increases the strength at high temperature. Due to these useful contributions ferrochrome finds wide application in alloy steel making.
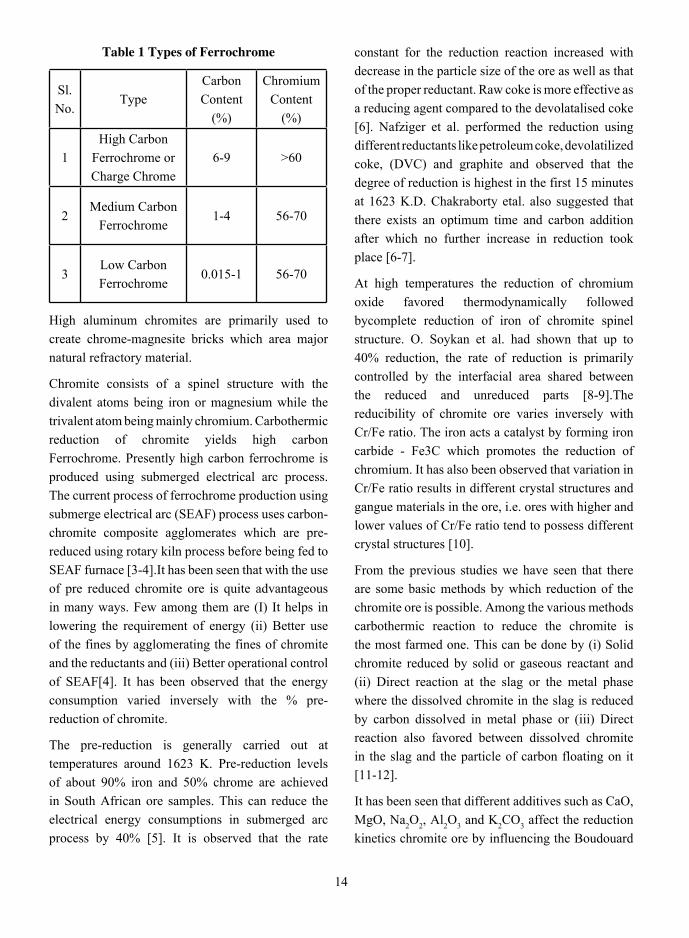
More than 80% of the world production of ferrochrome is used in stainless steel making. There are four major grades of ferrochromium produced commercially. These are classified broadly in table 1 in terms of their carbon content and chromium content.
Chromite and magnesiochromite are ores of chromium. They are first smelted for the purpose of ferrochrome production. Apart from iron and chromium, chromite also contain minor amount of cobalt and nickel. Leaching processes have been developed which are effectively carried out to leach cobalt and nickel from existing chromite ore. The chromite is one of constituents for the chief production of natural refractory materials, ceramics and electrodes.
1Department Metallurgical and Material Engineering, Jadavpur University, Kolkata - 700 032, India2School of Materials Science and Nano Technology, Jadavpur University, Kolkata - 700 032, India
14
Table 1 Types of Ferrochrome
Sl. No.
TypeCarbon Content
(%)
Chromium Content
(%)
1High Carbon
Ferrochrome or Charge Chrome
6-9 >60
2Medium Carbon
Ferrochrome1-4 56-70
3Low Carbon Ferrochrome
0.015-1 56-70
High aluminum chromites are primarily used to create chrome-magnesite bricks which area major natural refractory material.
Chromite consists of a spinel structure with the divalent atoms being iron or magnesium while the trivalent atom being mainly chromium. Carbothermic reduction of chromite yields high carbon Ferrochrome. Presently high carbon ferrochrome is produced using submerged electrical arc process. The current process of ferrochrome production using submerge electrical arc (SEAF) process uses carbon-chromite composite agglomerates which are pre-reduced using rotary kiln process before being fed to SEAF furnace [3-4].It has been seen that with the use of pre reduced chromite ore is quite advantageous in many ways. Few among them are (I) It helps in lowering the requirement of energy (ii) Better use of the fines by agglomerating the fines of chromite and the reductants and (iii) Better operational control of SEAF[4]. It has been observed that the energy consumption varied inversely with the % pre-reduction of chromite.
The pre-reduction is generally carried out at temperatures around 1623 K. Pre-reduction levels of about 90% iron and 50% chrome are achieved in South African ore samples. This can reduce the electrical energy consumptions in submerged arc process by 40% [5]. It is observed that the rate
constant for the reduction reaction increased with decrease in the particle size of the ore as well as that of the proper reductant. Raw coke is more effective as a reducing agent compared to the devolatalised coke [6]. Nafziger et al. performed the reduction using different reductants like petroleum coke, devolatilized coke, (DVC) and graphite and observed that the degree of reduction is highest in the first 15 minutes at 1623 K.D. Chakraborty etal. also suggested that there exists an optimum time and carbon addition after which no further increase in reduction took place [6-7].
At high temperatures the reduction of chromium oxide favored thermodynamically followed bycomplete reduction of iron of chromite spinel structure. O. Soykan et al. had shown that up to 40% reduction, the rate of reduction is primarily controlled by the interfacial area shared between the reduced and unreduced parts [8-9].The reducibility of chromite ore varies inversely with Cr/Fe ratio. The iron acts a catalyst by forming iron carbide - Fe3C which promotes the reduction of chromium. It has also been observed that variation in Cr/Fe ratio results in different crystal structures and gangue materials in the ore, i.e. ores with higher and lower values of Cr/Fe ratio tend to possess different crystal structures [10].
From the previous studies we have seen that there are some basic methods by which reduction of the chromite ore is possible. Among the various methods carbothermic reaction to reduce the chromite is the most farmed one. This can be done by (i) Solid chromite reduced by solid or gaseous reactant and (ii) Direct reaction at the slag or the metal phase where the dissolved chromite in the slag is reduced by carbon dissolved in metal phase or (iii) Direct reaction also favored between dissolved chromite in the slag and the particle of carbon floating on it [11-12].
It has been seen that different additives such as CaO, MgO, Na2O2, Al2O3 and K2CO3 affect the reduction kinetics chromite ore by influencing the Boudouard

15
reaction positively. In chromite ore reduction process MgO and SiO2 are hampered the reduction process. MgO inhibited the carbothermic reduction process by the formation of more stable phase MgCr2 O4. Similarlyin presence of SiO2 the reduction rate apparently lowered in the Cr metallic process because the liquid phase of CrO-SiO2 formed. In the presence of CaO, decrease in the particle size of Chromite ore increased the reduction kinetics [3,13]. Considering the catalytic effects of additives, it is observed that lime acted as a catalyst in reduction of carbon chromite composite pellets. This is attributed to the fact that lime went into the spinel structure of chromite and released the FeO, thus increasing the reducibility of the chromite. During the reduction of chromite ore Al3O3 also increase the rate of reduction by the diffusion of Cr3+ in the solid phase [13]. M.H. Farjadiand S.McCllough also mention that the MgO/Al2O3 ratio is directly proportionate to the Cr2O3
in the slag and the higher MgO/Al2O3 ratio of this deposit will require higher operating temperatures than typically used in the smelting of chromite ores [14].
Using a stoichiometric ionic model for the spinel EDAX revealed that, within the outer core, Fe2+ and Cr3+ions diffused outward, whereas Cr2+, Al3+ and Mg2+ions diffused inward.Initially, Fe3+ and Fe2+ions at the surface of chromite particle are reduced to the metallicstate. This is followed immediately by the reduction of Cr3+ ions to the divalent state. Cr2+ions diffusing toward the centre of the particle reduced the Fe3+ions in the spinel under the surface of the particle to Fe2+ at the interface between the inner and outer cores. Fe2+ions diffuse toward the surface, where they are reduced to metallic iron. After the iron is completely reduced, Cr3+ and any Cr2+ that is present are reduced to the metallic state, leaving an iron and chromium free spinel, MgAl2O4. The metallized iron and chromium carburized during the reduction into (Fe, Cr) 7C3 [6, 15, 16].
But all above discussion leading to the use of SEAF adds up to the same electricity requirement of
which the ever increasing demand for electricity has surged its price too. Also thepre reduction process which comprises of pelletizing and the level of pre-reduction must also be taken in account for the operational perspective of the SEAFs as because it is highly affected by those parameters like extent of Pre-reduction, residual Carbon Content, and the temperature of the feed [17].
In the present work we specially restrict ourselves to minimize the use of electricity or any other fuels thereby keeping it as a low cost production of ferrochrome. On the other hand low grade ore sare used for the availability of ores and reduce the production cost. But several factors may arise due to the application of different types of furnaces and methods for the production of ferrochrome.
II. Materials and Method
A. Raw Materials Used:
Chromite Ore: Low grade chromite ore samples are collected from Sukinda mines with the help of Tata Steel Limited.
Coal Dust: Coal fines are collected from Vizag Steel Plant, India.
Molasses: Molasses are obtained from Tata steel plant, Jamshedpur, Jharkhand, India.
Bentonite: Bentonite is collected from JSW Steel, toranagallu, Bellary, Karnataka, India.
B. Experimental Setup:
Low grade chromite ores has been collected from sukinda mines, Jajpur district, Orissa with Cr2O3 contain<30%, is used for the preparation of ferrochrome. This low grade ore is crushed to fines of size below +75μm and selected for experiment. Composite pellets are made with these fines by addition of suitable binder in appropriate percentage to get proper strength. The composite pelletsare made by using fine chromite ore mixed homogeneously with bentonite, molasses and water.12.5 g of the sample mixture is taken into drum pelletizer for the preparation of green pellets. These green pellets are

16
fired at 12000C to incorporate the strength into the pellets. Flow diagram of chromite pellets making is given below.
These pellets arer educed in a gasification reactor with help of synergetic gas. The reduced pellets are then be crushed and subjected to magnetic separation to separate out the chromite enrich fraction. All the enriched raw materials are characterized by AAS, XRD and SEM.
The segregated nonmagnetic portion after the reduction of chromite pellets, are then subjected to aluminothermic reduction melting to form ferrochrome using magnesium ribbon.
On the other hand another part of the non-magnetic fraction is blended with 20% magnetic fraction and is subjected to the same experimental method. The quality analysis of ferrochrome has been assessed with extent of reduction of the material.
III. Results and Discussion
1. Characterization of Materials:
1.1. WDXRF Analysis of Chromite Ore:
The fine particles (below 75μm) chromite overburden have been analysed by using wavelength dispersive x-ray fluorescence (WDXRF; PAN analytical) and the result is summarized in Table 2.
It is observed that chromite ore contain mainly 26.88% Cr2O3 with 23.72% Fe, 5.10% MgO and 21.07% Al2O3.
1.2. XRD Analysis of Chromite Ore:
XRD pattern of the raw ore sample is given in Fig. 2. It is observed that the major peak is of Chromite Fe (Al, Cr) 2O4 along with minor peaks of hematite (Fe2O3), aluminum hydroxide (Al2(OH)3) and Magnesium iron silicate. The d values of the phases are identified by matching with the standard JCPDS d values. [JCPDS – 85-0987, 84-1435, 86-1630, 86-1410].
1.3. SEM Images of the Chromite Ore:
The surface morphology of chromite ore has been observed using a scanning electron microscope and the SEM images (Fig. 3 – Fig. 4) are shown below with different resolutions.
Product Binders
Raw Material
Crushing & Grinding (-75mm)
Wet Screening
Drying
Drum Pelletizer
Green Pellets
Firing at 12000C
Pellets
Fig. 1 Flow Diagram of Pellets Making

17
2. Characterization of Coal:
2.1. Proximate Analysis of Coal:
The proximate analysis of the coal used for reduction has carbon content of 28.08%. The composition of coal fine has been analysed and presented in Table 3.
It is observed from the image that the shapes of the grains are irregular in nature associated with gangue particles.
Fig. 3 SEM Image of Chromite Ore Sample at 500X
Fig. 4 SEM Image of Chromite Ore Sample at 2000X
2.2. TG/DTA Analysis for Boiler Coal:
Thermal analysis of coal dust has been done under nitrogen atmosphere from room temperature to 10000C and is shown in Fig 5.
The maximum weight loss occurred at 3000C to 6000C due to the removal of volatile matter. The volatile matter contained in the coal is approximately 25-30%. This is the single most important step during the gasification.
18
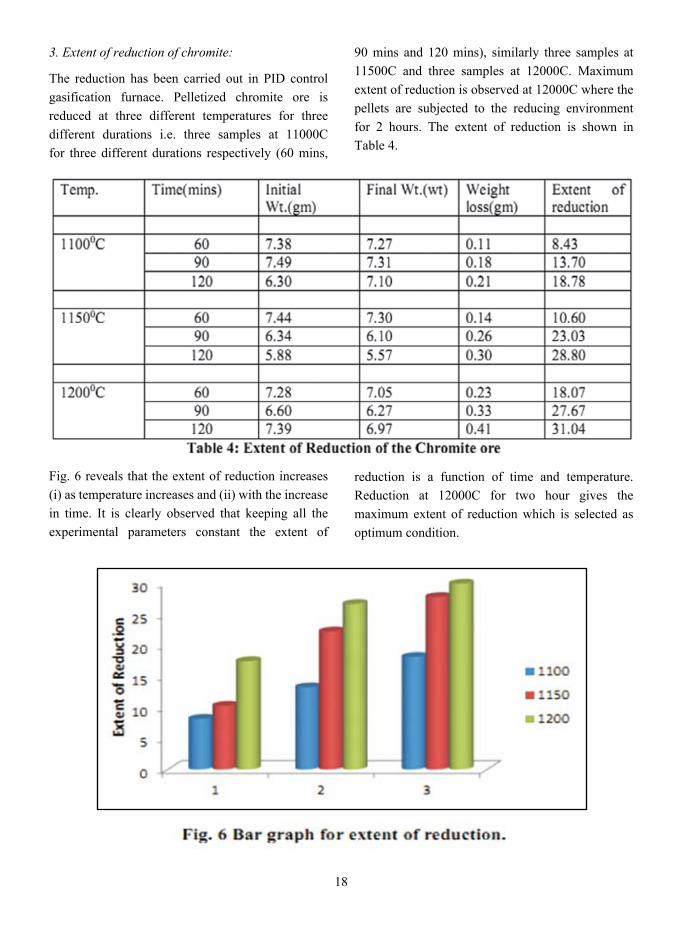
3. Extent of reduction of chromite:
The reduction has been carried out in PID control gasification furnace. Pelletized chromite ore is reduced at three different temperatures for three different durations i.e. three samples at 11000C for three different durations respectively (60 mins,
90 mins and 120 mins), similarly three samples at 11500C and three samples at 12000C. Maximum extent of reduction is observed at 12000C where the pellets are subjected to the reducing environment for 2 hours. The extent of reduction is shown in Table 4.
Fig. 6 reveals that the extent of reduction increases (i) as temperature increases and (ii) with the increase in time. It is clearly observed that keeping all the experimental parameters constant the extent of
reduction is a function of time and temperature. Reduction at 12000C for two hour gives the maximum extent of reduction which is selected as optimum condition.
19
4. Characterization of Reduced chromite ore:
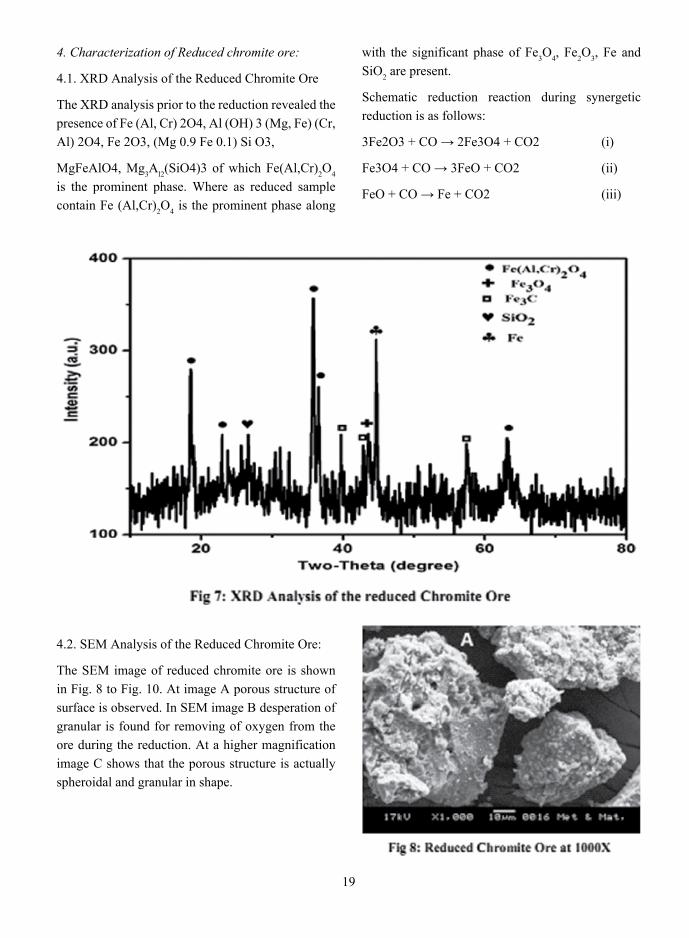
4.1. XRD Analysis of the Reduced Chromite Ore
The XRD analysis prior to the reduction revealed the presence of Fe (Al, Cr) 2O4, Al (OH) 3 (Mg, Fe) (Cr, Al) 2O4, Fe 2O3, (Mg 0.9 Fe 0.1) Si O3,
MgFeAlO4, Mg3Al2(SiO4)3 of which Fe(Al,Cr)2O4 is the prominent phase. Where as reduced sample contain Fe (Al,Cr)2O4 is the prominent phase along
with the significant phase of Fe3O4, Fe2O3, Fe and SiO2 are present.
Schematic reduction reaction during synergetic reduction is as follows:
3Fe2O3 + CO → 2Fe3O4 + CO2 (i)
Fe3O4 + CO → 3FeO + CO2 (ii)
FeO + CO → Fe + CO2 (iii)
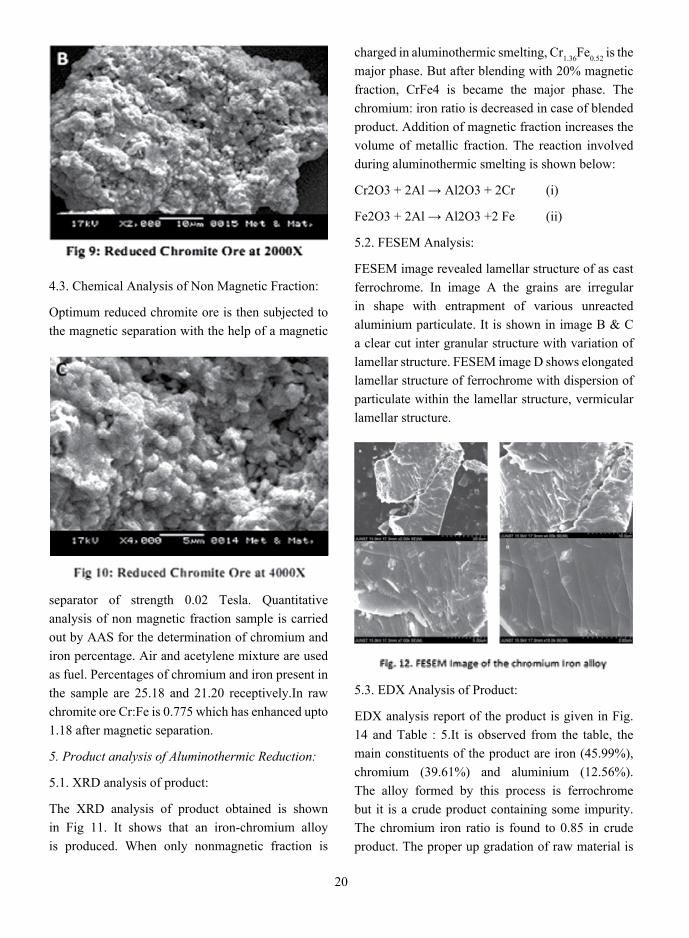
4.2. SEM Analysis of the Reduced Chromite Ore:
The SEM image of reduced chromite ore is shown in Fig. 8 to Fig. 10. At image A porous structure of surface is observed. In SEM image B desperation of granular is found for removing of oxygen from the ore during the reduction. At a higher magnification image C shows that the porous structure is actually spheroidal and granular in shape.
20
4.3. Chemical Analysis of Non Magnetic Fraction:
Optimum reduced chromite ore is then subjected to the magnetic separation with the help of a magnetic
charged in aluminothermic smelting, Cr1.36Fe0.52 is the major phase. But after blending with 20% magnetic fraction, CrFe4 is became the major phase. The chromium: iron ratio is decreased in case of blended product. Addition of magnetic fraction increases the volume of metallic fraction. The reaction involved during aluminothermic smelting is shown below:
Cr2O3 + 2Al → Al2O3 + 2Cr (i)
Fe2O3 + 2Al → Al2O3 +2 Fe (ii)
5.2. FESEM Analysis:
FESEM image revealed lamellar structure of as cast ferrochrome. In image A the grains are irregular in shape with entrapment of various unreacted aluminium particulate. It is shown in image B & C a clear cut inter granular structure with variation of lamellar structure. FESEM image D shows elongated lamellar structure of ferrochrome with dispersion of particulate within the lamellar structure, vermicular lamellar structure.
separator of strength 0.02 Tesla. Quantitative analysis of non magnetic fraction sample is carried out by AAS for the determination of chromium and iron percentage. Air and acetylene mixture are used as fuel. Percentages of chromium and iron present in the sample are 25.18 and 21.20 receptively.In raw chromite ore Cr:Fe is 0.775 which has enhanced upto 1.18 after magnetic separation.
5. Product analysis of Aluminothermic Reduction:
5.1. XRD analysis of product:
The XRD analysis of product obtained is shown in Fig 11. It shows that an iron-chromium alloy is produced. When only nonmagnetic fraction is
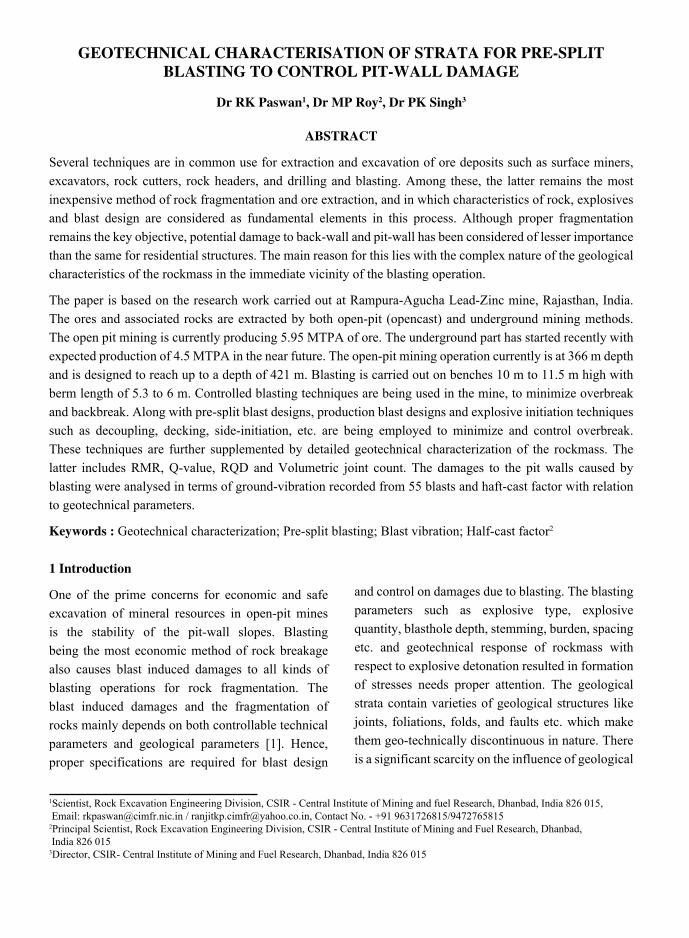
5.3. EDX Analysis of Product:
EDX analysis report of the product is given in Fig. 14 and Table : 5.It is observed from the table, the main constituents of the product are iron (45.99%), chromium (39.61%) and aluminium (12.56%). The alloy formed by this process is ferrochrome but it is a crude product containing some impurity. The chromium iron ratio is found to 0.85 in crude product. The proper up gradation of raw material is
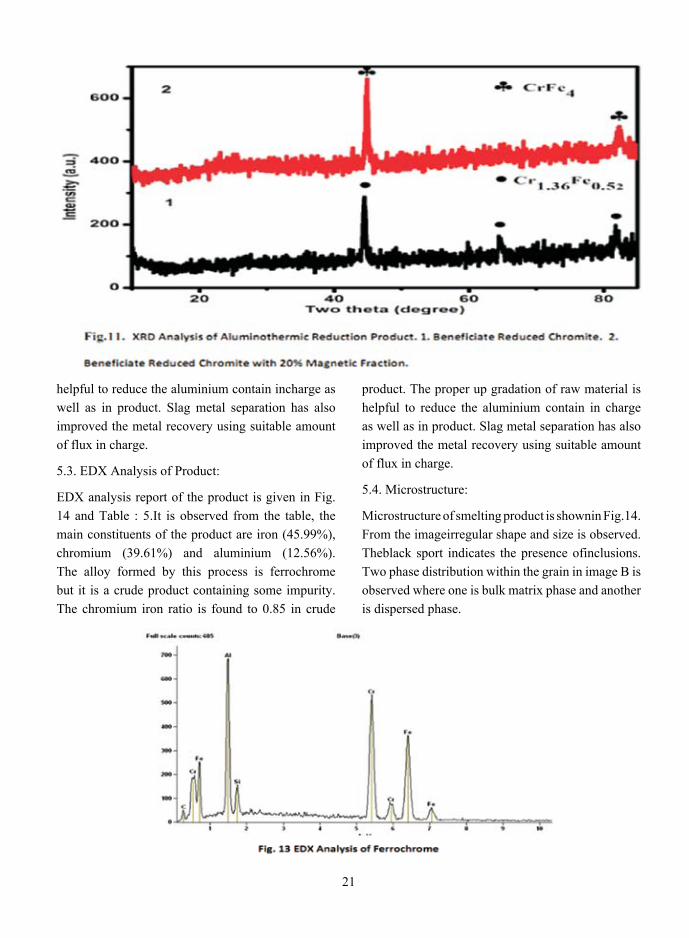
21
helpful to reduce the aluminium contain incharge as well as in product. Slag metal separation has also improved the metal recovery using suitable amount of flux in charge.
5.3. EDX Analysis of Product:
EDX analysis report of the product is given in Fig. 14 and Table : 5.It is observed from the table, the main constituents of the product are iron (45.99%), chromium (39.61%) and aluminium (12.56%). The alloy formed by this process is ferrochrome but it is a crude product containing some impurity. The chromium iron ratio is found to 0.85 in crude
product. The proper up gradation of raw material is helpful to reduce the aluminium contain in charge as well as in product. Slag metal separation has also improved the metal recovery using suitable amount of flux in charge.
5.4. Microstructure:
Microstructure of smelting product is shownin Fig.14. From the imageirregular shape and size is observed. Theblack sport indicates the presence ofinclusions. Two phase distribution within the grain in image B is observed where one is bulk matrix phase and another is dispersed phase.

22
6. CONCLUSION
1. WDXRF analysis confirms the presence of iron, chromium and aluminium oxide in large amount in chromite ore.
2. Identified phase from the XRD pattern shows Fe(Al,Cr)2O4 as the major phase in raw chromite ore along with some free iron oxide and magnesium iron aluminium oxide.
3. The magnetic separation after the reduction of chromite ore in gasification furnace improves the chromium iron ratio from 0.775 to 1.18.
4. The analysis of the product reveals that an iron chromium alloy has been produced. In absence of blending Cr1.36Fe0.52 phase is observed whereas in case of 20% blending with the magnetic fraction CrFe4 phase is observed. Increasing the blending ratio decreases the Cr:Fe ratio.
5. FESEM image shows clear lamellar structure of the ferroalloy.
6. Composition of product in terms of various constituent is shown with Cr/Fe 0.85.
7. Two phase distribution within the grain and plenty of inclusion in the product have been observed.
8. The addition of magnetic fraction in the charge increases the volume of metalized phase.
9. The product whatever obtained needs further up gradation by developing proper slag phase with decreasing aluminium in the charge by replacing with Fe-Si reducer.
ACKNOWLEDGMENT
One of the authors (RD) would like to thank Ministry of Mines and TEQJP Phase - II for providing funding under their Science and Technology project scheme. Also thanks to Tata Steel Limited to collect the low grade chromite ore.
References:
[1] P.J. Bhonde, A.M. Ghodgaonkar and R.D. Angal “VARIOUS TECHNIQUES TO PRODUCE LOW CARBON FERROCHROME” INFACON XI (2007) p 85-90.
Table 5 : EDX Analysis of Ferrochrome

23
[2] Peter Weber, R. Hurman Eric, “There duction of chromite in the presence of silica flux”, Minerals Engineering (2006) vol. 19 (3) p 318-324 .
[3] JSJ Van Deventer, “THE EFFECT OF ADDITIVES ON THE REDUCTION OF CHROMITE BY GRAPHITE : AN ISOTHERMAL KINETIC STUDY”, Thermochimica Acta (1987) vol. 127 p 25-35.
[4] C. Takano, A.P. Zambrano, A.E.A. Nogueira, M.B. Mouraoand Y.I guchi, “Chromite Reduction Reaction Mechanisms in Carbon - Chromites Composite Agglomerates at 1773k”, ISIJ International (2007) vol. 47 (11) p. 1585-1589.
[5] S. Mc Cullough, S. Hockaday, C. Johnson and N.A. Barcza, “Pre-reduction and smelting characteristics of Kazakhstan ore samples”, Ferrochromium – Pretreatment for Smelting (2010) p 249-262.
[6] D. Chakraborty, S. Ranganathan and S.N. Sinha, “Influence of Temperature and Particle Size on Reduction of Chromite Ore”, INFACON XI (2007) p 145-152.
[7] R.H Nafziger, J.I Paige and J.E Tress, Metallurgical Transactions B, (1979) Vol. 10B, pp. 5-14.
[8] O. Soykan, R.H Eric and R.P King, 1991 December, Met. Trans. B, Vol. 22B, pp. 801-810.
[9] O. Soykan, R.H Eric and R.P King, 1991 February, Met. Trans. B, Vol. 22B, pp. 53-63.
[10] A. Atasoy and F.R. Sale “An Investigation on the Solid State Reduction of Chromite Concentrate”, Solid State Phenomena (2009) Vols. 147-149 p 752-757.
[11] W.J Rankin, “Reduction of chromite by graphite and carbon monoxide” Trans. Inst. Min. Metall. (1979) 88, 107.
[12] F. Meng, M. Hiura and Y. Iguchi, REDUÇÃOCARBOTÉRMICADEPELOTAS AUTOREDUTORASDECROMITAUTILIZA
NDOENERGIADEMICRO-ONDAS”, Tetso-to-Hagane, (2003) vol. 89 p 229.
[13] Y. Wang , L. Wang , K.C. Chou “EFFECTS OF CaO, MgO, Al2O3ANDSiO2 ON THE CARBOTHERMIC REDUCTION OF SYNTHETIC FeCr2O4” J. Min. Metall. Sect.B-Metall (2015) vol. 51 (1) p 17 – 24.
[14] M.H.Farjadi and J.Azari“EFFECTOFCHROMEOREQUALITYONFERROCHROME PRODUCTION EFFICIENCY”, INFACON X: Transformation through Technology (2004) p 103-107.
[15] O. Soykan, R.H.Eric, R.P.King, “There duction mechanism of an aturalchromiteat 1416oC”, Metallurgical Transaction B (1991) vol. 22 (1) p 53–63.
[16] Y.L. Ding and N.A. Warner, “Catalytic Reduction of Carbon-Chromite Composite Pellets By Lime”, Ther mochimica Acta 1996 Vol. 292 (1–2) P 85-94.
[17] Ding, Y.L., Warner, N.A., “Kinetics and mechanism of reduction of carbon-chromite composite pellets”, Iron making and Steelmaking (1997) Vol. 24 (3) p 224-229.
APPENDIX 1
100 gm pellet contains: chromite : 26.88; hematite: 33.88; Bentonite: 4%, Molasses: 2%, Moisture: 2% During induration 18% bentonite, 95% molasses and 100% moisture is lost. For reduction of 7.381 gm of pellet: 82% bentonite and 5% molasses have to be deducted. Weight of bentonite (Wb) : 7.381*0.04*0.82 Weight of Molasses (Wm) : 7.381*0.02*0.05 Total weight of the Pellet excluding bentonite and molasses(Wp) = 7.381- (Wb+Wm) = 7.131 Chromite In the Pellet (Wc) : Wp* 0.2688 Hematite In pellet (WH) : Wp* 0.3388 Oxygen In Chromite (OC) : Wc*0.315 Oxygen in Hematite (OH) : WH*0.3 Total Oxygen = OC+OH = 1.328 Weight loss during Reduction : 0.112 Extent of reduction : (0.112/1.328)*100 = 8.43
24
Geotechnical characterisation of strata for pre-split blastinG to control pit-wall damaGe
dr rK paswan1, dr mp roy2, dr pK singh3
abstract
Several techniques are in common use for extraction and excavation of ore deposits such as surface miners, excavators, rock cutters, rock headers, and drilling and blasting. Among these, the latter remains the most inexpensive method of rock fragmentation and ore extraction, and in which characteristics of rock, explosives and blast design are considered as fundamental elements in this process. Although proper fragmentation remains the key objective, potential damage to back-wall and pit-wall has been considered of lesser importance than the same for residential structures. The main reason for this lies with the complex nature of the geological characteristics of the rockmass in the immediate vicinity of the blasting operation.
The paper is based on the research work carried out at Rampura-Agucha Lead-Zinc mine, Rajasthan, India. The ores and associated rocks are extracted by both open-pit (opencast) and underground mining methods. The open pit mining is currently producing 5.95 MTPA of ore. The underground part has started recently with expected production of 4.5 MTPA in the near future. The open-pit mining operation currently is at 366 m depth and is designed to reach up to a depth of 421 m. Blasting is carried out on benches 10 m to 11.5 m high with berm length of 5.3 to 6 m. Controlled blasting techniques are being used in the mine, to minimize overbreak and backbreak. Along with pre-split blast designs, production blast designs and explosive initiation techniques such as decoupling, decking, side-initiation, etc. are being employed to minimize and control overbreak. These techniques are further supplemented by detailed geotechnical characterization of the rockmass. The latter includes RMR, Q-value, RQD and Volumetric joint count. The damages to the pit walls caused by blasting were analysed in terms of ground-vibration recorded from 55 blasts and haft-cast factor with relation to geotechnical parameters.
Keywords : Geotechnical characterization; Pre-split blasting; Blast vibration; Half-cast factor2
1 introduction
One of the prime concerns for economic and safe excavation of mineral resources in open-pit mines is the stability of the pit-wall slopes. Blasting being the most economic method of rock breakage also causes blast induced damages to all kinds of blasting operations for rock fragmentation. The blast induced damages and the fragmentation of rocks mainly depends on both controllable technical parameters and geological parameters [1]. Hence, proper specifications are required for blast design
1Scientist, Rock Excavation Engineering Division, CSIR - Central Institute of Mining and fuel Research, Dhanbad, India 826 015, Email: [email protected] / [email protected], Contact No. - +91 9631726815/94727658152Principal Scientist, Rock Excavation Engineering Division, CSIR - Central Institute of Mining and Fuel Research, Dhanbad, India 826 015 3Director, CSIR- Central Institute of Mining and Fuel Research, Dhanbad, India 826 015
and control on damages due to blasting. The blasting parameters such as explosive type, explosive quantity, blasthole depth, stemming, burden, spacing etc. and geotechnical response of rockmass with respect to explosive detonation resulted in formation of stresses needs proper attention. The geological strata contain varieties of geological structures like joints, foliations, folds, and faults etc. which make them geo-technically discontinuous in nature. There is a significant scarcity on the influence of geological

25
discontinuities on effectiveness of blast results. The field-scale experimental investigation on influence of geological discontinuities present in rockmass on blast performance needs proper and more studies to stabilise the wall of slopes for safe and economic fragmentation of an open pit mine. The controlled blasting techniques (e.g. line drilling, pre-splitting etc.) for wall control are commonly being used in open cut mining operations. Lewandowski et al. have given a methodology and outlined an idealised pre-split design process considering geological, geotechnical and drilling parameters (Figure 1) [2].
Rampura-AguchaPb-Zn open-pit Mine of Hindustan Zinc Limited is the world’s largest leadzinc mine with an annual ore production capacity of 6.15 Mt. The massive ore deposit is of lens shaped. Rampura-AguchaPb-Zn mine is one of the lowest cost zinc producer in the world and reached its final limits in foot wall (western side of the pit). Controlled blasting technique (pre-splitting) is being used to prevent damages to the final wall from the production blasting and being successfully practiced but the impressions
of half barrels are missing wherever geological discontinuities are more frequent that implies that there is a significant impact of geotechnical parameters of the rockmass. The purpose of this study is to investigate the effect of pre-splitting on smoothness of wall and role played by geological discontinuities to assess the potential reason for wall damage whether it is because of discontinuities or the blast induced damage. The assessment of blast damage was determined by the blast induced ground vibration, joints analysis (frequency and orientation) and the half cast factor (HCF).
1.1 theory of pre-split blasting for final wall control
The basic theory of controlled blasting is to control the effects of blasting while keeping the inherent strength of the final wall rock nearly unaffected. This can be achieved certainly by keeping the explosive energy released by the production blast far away from the final wall so that the damage can be avoided significantly [3]. Different controlled
Figure 1. A methodology for the design of pre-split blasts (after Lewandowski et al., 1996).
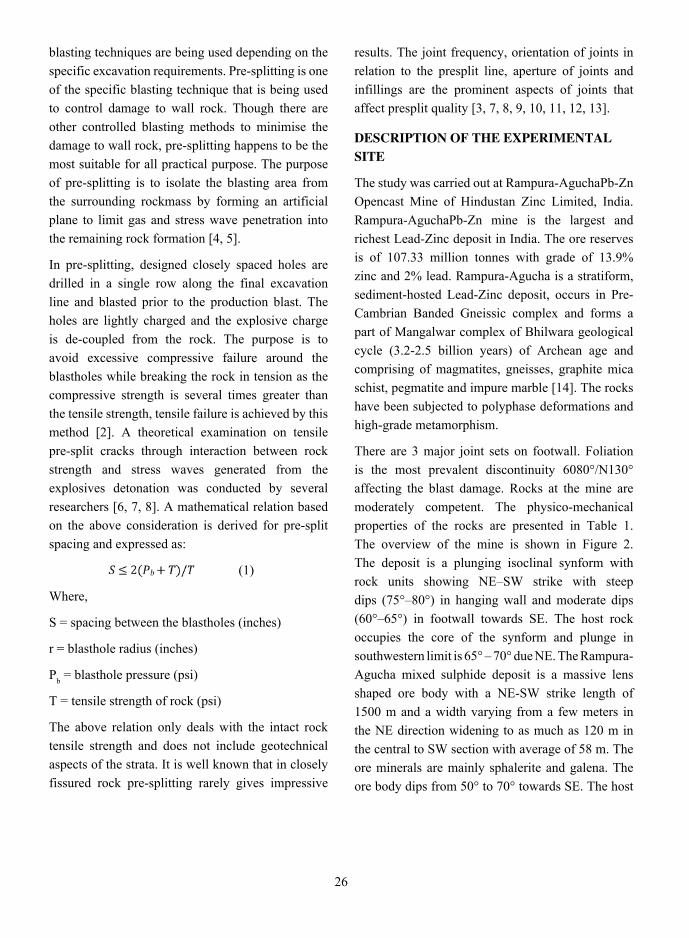
26
blasting techniques are being used depending on the specific excavation requirements. Pre-splitting is one of the specific blasting technique that is being used to control damage to wall rock. Though there are other controlled blasting methods to minimise the damage to wall rock, pre-splitting happens to be the most suitable for all practical purpose. The purpose of pre-splitting is to isolate the blasting area from the surrounding rockmass by forming an artificial plane to limit gas and stress wave penetration into the remaining rock formation [4, 5].
In pre-splitting, designed closely spaced holes are drilled in a single row along the final excavation line and blasted prior to the production blast. The holes are lightly charged and the explosive charge is de-coupled from the rock. The purpose is to avoid excessive compressive failure around the blastholes while breaking the rock in tension as the compressive strength is several times greater than the tensile strength, tensile failure is achieved by this method [2]. A theoretical examination on tensile pre-split cracks through interaction between rock strength and stress waves generated from the explosives detonation was conducted by several researchers [6, 7, 8]. A mathematical relation based on the above consideration is derived for pre-split spacing and expressed as:
(1)
Where,
S = spacing between the blastholes (inches)
r = blasthole radius (inches)
Pb = blasthole pressure (psi)
T = tensile strength of rock (psi)
The above relation only deals with the intact rock tensile strength and does not include geotechnical aspects of the strata. It is well known that in closely fissured rock pre-splitting rarely gives impressive
results. The joint frequency, orientation of joints in relation to the presplit line, aperture of joints and infillings are the prominent aspects of joints that affect presplit quality [3, 7, 8, 9, 10, 11, 12, 13].
description of the eXperimental site
The study was carried out at Rampura-AguchaPb-Zn Opencast Mine of Hindustan Zinc Limited, India. Rampura-AguchaPb-Zn mine is the largest and richest Lead-Zinc deposit in India. The ore reserves is of 107.33 million tonnes with grade of 13.9% zinc and 2% lead. Rampura-Agucha is a stratiform, sediment-hosted Lead-Zinc deposit, occurs in Pre-Cambrian Banded Gneissic complex and forms a part of Mangalwar complex of Bhilwara geological cycle (3.2-2.5 billion years) of Archean age and comprising of magmatites, gneisses, graphite mica schist, pegmatite and impure marble [14]. The rocks have been subjected to polyphase deformations and high-grade metamorphism.
There are 3 major joint sets on footwall. Foliation is the most prevalent discontinuity 6080°/N130° affecting the blast damage. Rocks at the mine are moderately competent. The physico-mechanical properties of the rocks are presented in Table 1. The overview of the mine is shown in Figure 2. The deposit is a plunging isoclinal synform with rock units showing NE–SW strike with steep dips (75°–80°) in hanging wall and moderate dips (60°–65°) in footwall towards SE. The host rock occupies the core of the synform and plunge in southwestern limit is 65° – 70° due NE. The Rampura-Agucha mixed sulphide deposit is a massive lens shaped ore body with a NE-SW strike length of 1500 m and a width varying from a few meters in the NE direction widening to as much as 120 m in the central to SW section with average of 58 m. The ore minerals are mainly sphalerite and galena. The ore body dips from 50° to 70° towards SE. The host
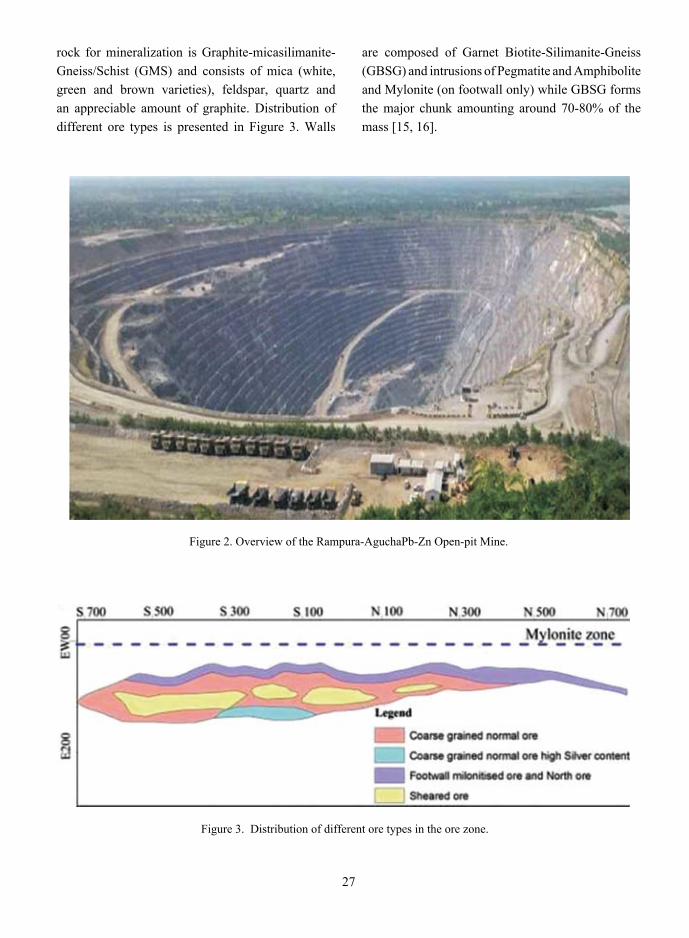
27
rock for mineralization is Graphite-micasilimanite-Gneiss/Schist (GMS) and consists of mica (white, green and brown varieties), feldspar, quartz and an appreciable amount of graphite. Distribution of different ore types is presented in Figure 3. Walls
Figure 2. Overview of the Rampura-AguchaPb-Zn Open-pit Mine.
are composed of Garnet Biotite-Silimanite-Gneiss (GBSG) and intrusions of Pegmatite and Amphibolite and Mylonite (on footwall only) while GBSG forms the major chunk amounting around 70-80% of the mass [15, 16].
Figure 3. Distribution of different ore types in the ore zone.
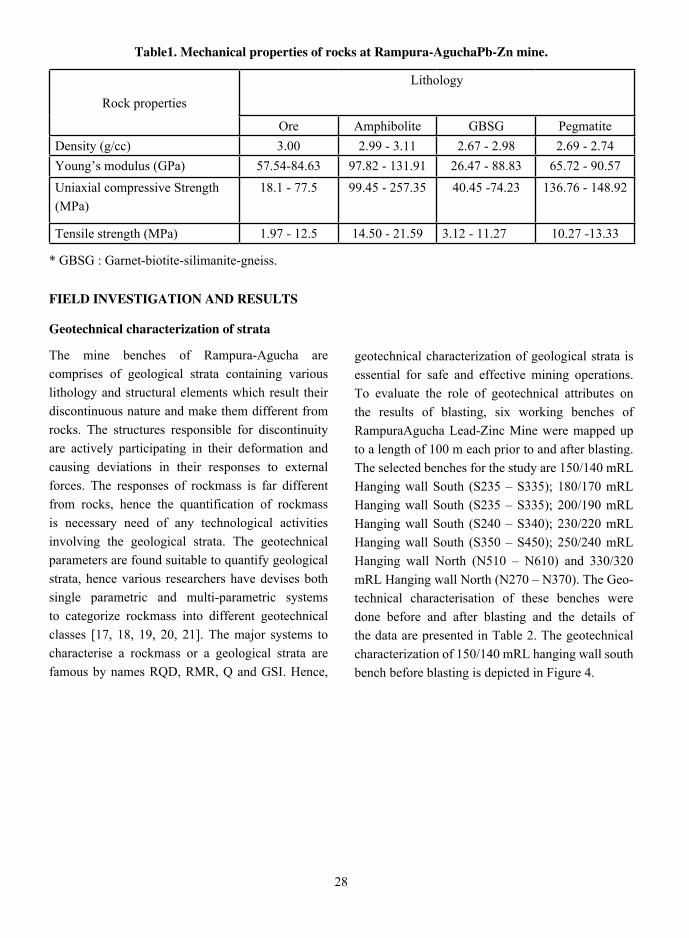
28
table1. mechanical properties of rocks at rampura-aguchapb-Zn mine.
Rock properties
Lithology
Ore Amphibolite GBSG PegmatiteDensity (g/cc) 3.00 2.99 - 3.11 2.67 - 2.98 2.69 - 2.74Young’s modulus (GPa) 57.54-84.63 97.82 - 131.91 26.47 - 88.83 65.72 - 90.57Uniaxial compressive Strength (MPa)
18.1 - 77.5 99.45 - 257.35 40.45 -74.23 136.76 - 148.92
Tensile strength (MPa) 1.97 - 12.5 14.50 - 21.59 3.12 - 11.27 10.27 -13.33
* GBSG : Garnet-biotite-silimanite-gneiss.
field inVestiGation and resUlts
Geotechnical characterization of strata
The mine benches of Rampura-Agucha are comprises of geological strata containing various lithology and structural elements which result their discontinuous nature and make them different from rocks. The structures responsible for discontinuity are actively participating in their deformation and causing deviations in their responses to external forces. The responses of rockmass is far different from rocks, hence the quantification of rockmass is necessary need of any technological activities involving the geological strata. The geotechnical parameters are found suitable to quantify geological strata, hence various researchers have devises both single parametric and multi-parametric systems to categorize rockmass into different geotechnical classes [17, 18, 19, 20, 21]. The major systems to characterise a rockmass or a geological strata are famous by names RQD, RMR, Q and GSI. Hence,
geotechnical characterization of geological strata is essential for safe and effective mining operations. To evaluate the role of geotechnical attributes on the results of blasting, six working benches of RampuraAgucha Lead-Zinc Mine were mapped up to a length of 100 m each prior to and after blasting. The selected benches for the study are 150/140 mRL Hanging wall South (S235 – S335); 180/170 mRL Hanging wall South (S235 – S335); 200/190 mRL Hanging wall South (S240 – S340); 230/220 mRL Hanging wall South (S350 – S450); 250/240 mRL Hanging wall North (N510 – N610) and 330/320 mRL Hanging wall North (N270 – N370). The Geo-technical characterisation of these benches were done before and after blasting and the details of the data are presented in Table 2. The geotechnical characterization of 150/140 mRL hanging wall south bench before blasting is depicted in Figure 4.
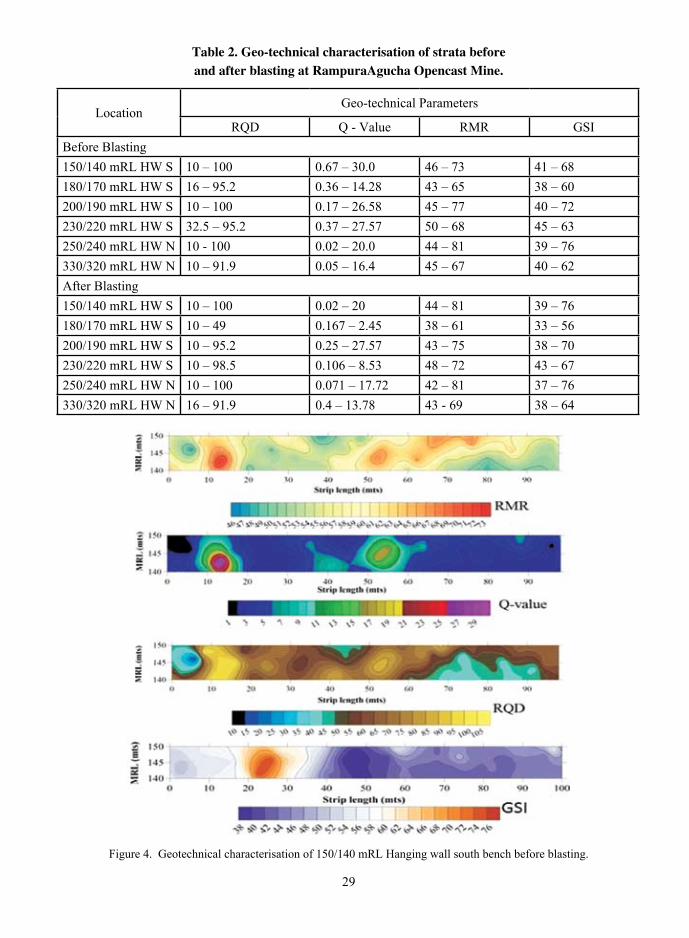
29
table 2. Geo-technical characterisation of strata before and after blasting at rampuraagucha opencast mine.
LocationGeo-technical Parameters
RQD Q - Value RMR GSIBefore Blasting150/140 mRL HW S 10 – 100 0.67 – 30.0 46 – 73 41 – 68180/170 mRL HW S 16 – 95.2 0.36 – 14.28 43 – 65 38 – 60200/190 mRL HW S 10 – 100 0.17 – 26.58 45 – 77 40 – 72230/220 mRL HW S 32.5 – 95.2 0.37 – 27.57 50 – 68 45 – 63250/240 mRL HW N 10 - 100 0.02 – 20.0 44 – 81 39 – 76330/320 mRL HW N 10 – 91.9 0.05 – 16.4 45 – 67 40 – 62After Blasting150/140 mRL HW S 10 – 100 0.02 – 20 44 – 81 39 – 76180/170 mRL HW S 10 – 49 0.167 – 2.45 38 – 61 33 – 56200/190 mRL HW S 10 – 95.2 0.25 – 27.57 43 – 75 38 – 70230/220 mRL HW S 10 – 98.5 0.106 – 8.53 48 – 72 43 – 67250/240 mRL HW N 10 – 100 0.071 – 17.72 42 – 81 37 – 76330/320 mRL HW N 16 – 91.9 0.4 – 13.78 43 - 69 38 – 64
Figure 4. Geotechnical characterisation of 150/140 mRL Hanging wall south bench before blasting.
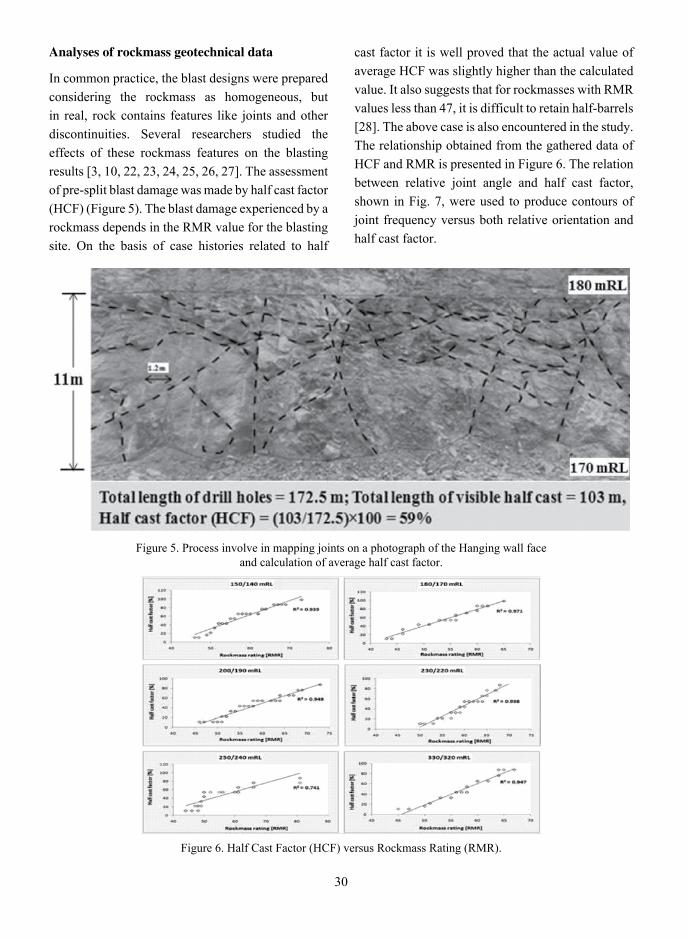
30
analyses of rockmass geotechnical data
In common practice, the blast designs were prepared considering the rockmass as homogeneous, but in real, rock contains features like joints and other discontinuities. Several researchers studied the effects of these rockmass features on the blasting results [3, 10, 22, 23, 24, 25, 26, 27]. The assessment of pre-split blast damage was made by half cast factor (HCF) (Figure 5). The blast damage experienced by a rockmass depends in the RMR value for the blasting site. On the basis of case histories related to half
cast factor it is well proved that the actual value of average HCF was slightly higher than the calculated value. It also suggests that for rockmasses with RMR values less than 47, it is difficult to retain half-barrels [28]. The above case is also encountered in the study. The relationship obtained from the gathered data of HCF and RMR is presented in Figure 6. The relation between relative joint angle and half cast factor, shown in Fig. 7, were used to produce contours of joint frequency versus both relative orientation and half cast factor.
Figure 5. Process involve in mapping joints on a photograph of the Hanging wall face and calculation of average half cast factor.
Figure 6. Half Cast Factor (HCF) versus Rockmass Rating (RMR).
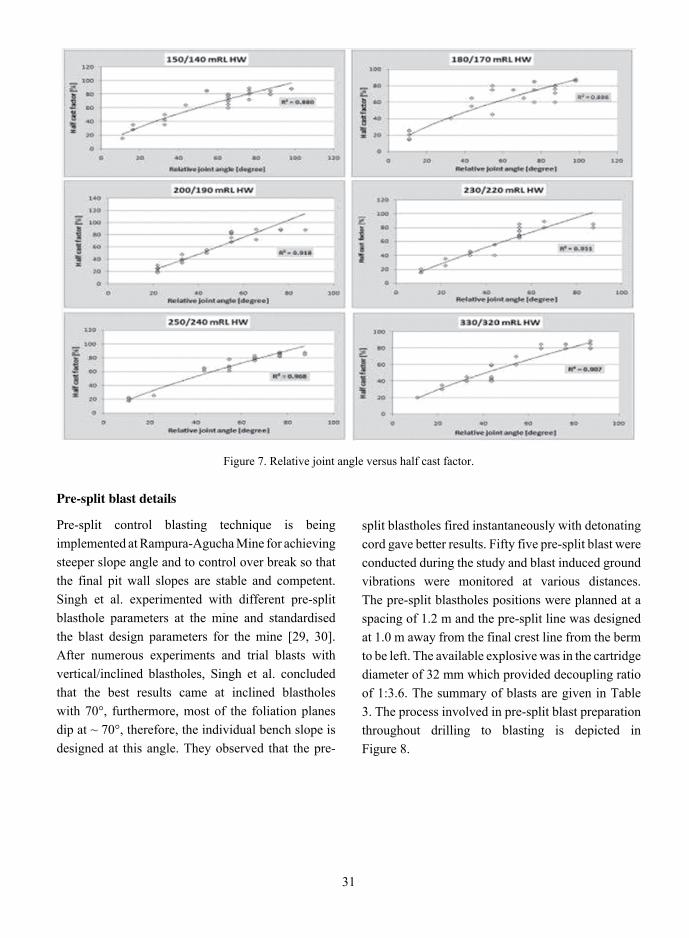
31
Figure 7. Relative joint angle versus half cast factor.
pre-split blast details
Pre-split control blasting technique is being implemented at Rampura-Agucha Mine for achieving steeper slope angle and to control over break so that the final pit wall slopes are stable and competent. Singh et al. experimented with different pre-split blasthole parameters at the mine and standardised the blast design parameters for the mine [29, 30]. After numerous experiments and trial blasts with vertical/inclined blastholes, Singh et al. concluded that the best results came at inclined blastholes with 70°, furthermore, most of the foliation planes dip at ~ 70°, therefore, the individual bench slope is designed at this angle. They observed that the pre-
split blastholes fired instantaneously with detonating cord gave better results. Fifty five pre-split blast were conducted during the study and blast induced ground vibrations were monitored at various distances. The pre-split blastholes positions were planned at a spacing of 1.2 m and the pre-split line was designed at 1.0 m away from the final crest line from the berm to be left. The available explosive was in the cartridge diameter of 32 mm which provided decoupling ratio of 1:3.6. The summary of blasts are given in Table 3. The process involved in pre-split blast preparation throughout drilling to blasting is depicted in Figure 8.

32
table 3. summarized blast details.
Blasting details Details of dataNumber of blasts 55Number of peak particle velocity data recorded 195Range of total explosive weight detonated (kg) 42 – 480Range of explosive weight per delay detonated (kg) 32 – 156Range of effective explosive weight per delay detonated (kg) 10.7 – 135Range of blast vibration monitoring distance (m) 5.9 – 1510
Range of recorded peak particle velocity (mm/s) 0.554 – 67.3Powder Factor (kg/m3) 0.44 – 0.65
Figure 8. Process involved in pre-split blast preperation and result. [A] Drilling of designed pre-split blastholes; [B] Prepared explosive charge column; [C] Charging of pre-split Blastholes; [D] Result after pre-split blast.
optimization of blast design parameters for pre-split blasting
It is very important to select proper pre-split design parameters. These are governed by rock characteristics, mining methods, the degree of mechanization, and the rate of mining. The pre-split holes are drilled with a smaller diameter than production holes for minimizing damage to the pit-wall. The inclination of pre-split holes is determined by inter ramp and overall pit slope angle which depends essentially upon the joint/foliation characteristics of the mine. The final width after pre-splitting of the benches (berm length) and the angle of the final bench slope with horizontal (batter) is primarily dependent on the design of the benches and inclination of pre-split
blastholes respectively. Further, the competency of ground also plays a key role as competent ground, facilitate steeper pit slope
angle therefore a narrower berm with steeper batter angle can be designed. Further, incompetent rocks facilitate gentle pit slope angle with wider berms and the steeper batter which is unfavourable for long term stability. The design parameters for optimization of pre-split blasts includes:
i. Pre-split blasthole diameter
ii. Pre-split blasthole spacing
iii. Pre-split blasthole inclination

33
iv. Pre-split blasthole explosive decoupling factor
v. Borehole pressure
vi. Adjacent production blasts design (Buffer holes, stab holes, initiation time etc.)
All the above mentioned parameters were optimized with numerous varying experimental trials and given in Table 3. Some of the results of pre-split blast are presented in Figure 9.
table 3. Various design parameters established for the hanging wall.
Blast Type
Hole diameter
(mm)
Decouple ratio
Burden (m)
Spacing (m)
Stem (m)
Subgrade (m)
Hole depth (m)
Charge length
(m)Inclination
Production 165 0 4 5.5 4 1 11 7 90°
Buffer 115 0 3 3 5 1 11 6 90°
Pre-split 115 0.22-0.28 0.5-1 1.2 0 0.5 11.6 8 70°
monitoring of blast induced ground vibration signals and analyses
The blast induced ground vibrations were recorded at near points to far off distances. The monitoring location distances were in the range of 5.9 to 1510 m. The vibrations recorded were in the range of 0.554 – 67.3 mm/s. The maximum vibration recorded was
67.3 mm/s at 5.9 m distance. The total explosives detonated in this blast round was 85 kg with explosive weight per delay of 85 kg. The blast wave signature recorded from the pre-split blast at 5.9 m depicted in Figure 10.
Figure 9. [A] crack resulted due to pre-split blasting; [B] Final wall with half barrel impressions of pre-split holes.
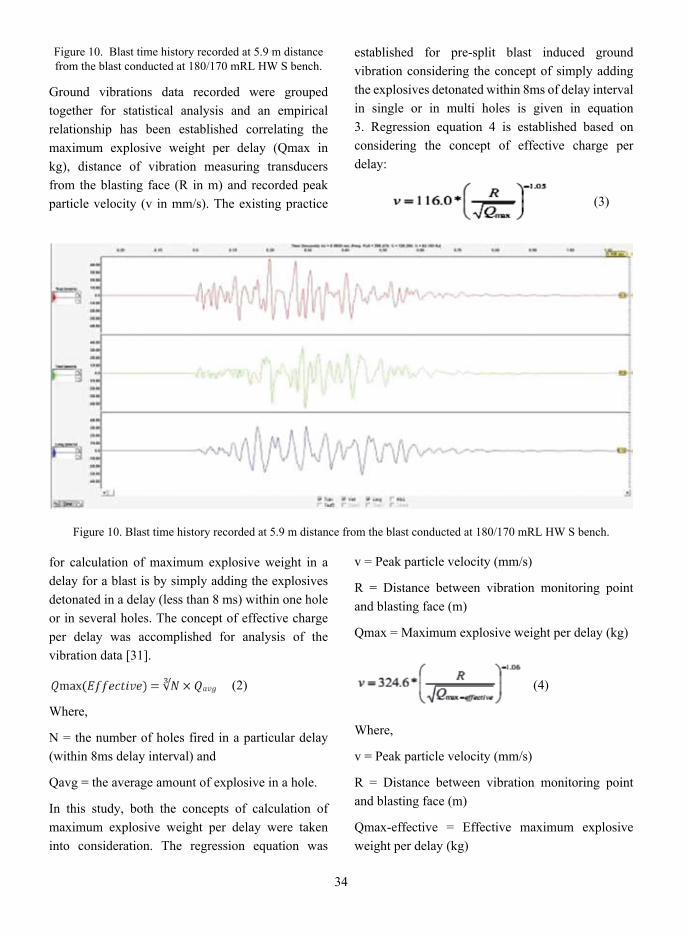
34
Figure 10. Blast time history recorded at 5.9 m distance from the blast conducted at 180/170 mRL HW S bench.
Ground vibrations data recorded were grouped together for statistical analysis and an empirical relationship has been established correlating the maximum explosive weight per delay (Qmax in kg), distance of vibration measuring transducers from the blasting face (R in m) and recorded peak particle velocity (v in mm/s). The existing practice
for calculation of maximum explosive weight in a delay for a blast is by simply adding the explosives detonated in a delay (less than 8 ms) within one hole or in several holes. The concept of effective charge per delay was accomplished for analysis of the vibration data [31].
(2)
Where,
N = the number of holes fired in a particular delay (within 8ms delay interval) and
Qavg = the average amount of explosive in a hole.
In this study, both the concepts of calculation of maximum explosive weight per delay were taken into consideration. The regression equation was
established for pre-split blast induced ground vibration considering the concept of simply adding the explosives detonated within 8ms of delay interval in single or in multi holes is given in equation 3. Regression equation 4 is established based on considering the concept of effective charge per delay:
(3)
v = Peak particle velocity (mm/s)
R = Distance between vibration monitoring point and blasting face (m)
Qmax = Maximum explosive weight per delay (kg)
(4)
Where,
v = Peak particle velocity (mm/s)
R = Distance between vibration monitoring point and blasting face (m)
Qmax-effective = Effective maximum explosive weight per delay (kg)
Figure 10. Blast time history recorded at 5.9 m distance from the blast conducted at 180/170 mRL HW S bench.
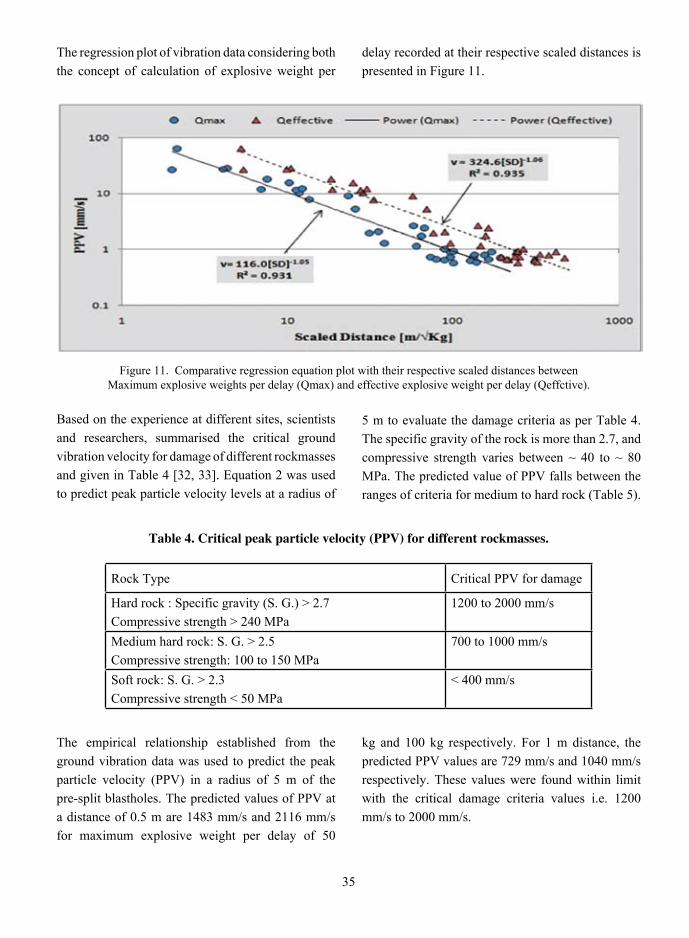
35
The regression plot of vibration data considering both the concept of calculation of explosive weight per
Based on the experience at different sites, scientists and researchers, summarised the critical ground vibration velocity for damage of different rockmasses and given in Table 4 [32, 33]. Equation 2 was used to predict peak particle velocity levels at a radius of
5 m to evaluate the damage criteria as per Table 4. The specific gravity of the rock is more than 2.7, and compressive strength varies between ~ 40 to ~ 80 MPa. The predicted value of PPV falls between the ranges of criteria for medium to hard rock (Table 5).
delay recorded at their respective scaled distances is presented in Figure 11.
Figure 11. Comparative regression equation plot with their respective scaled distances between Maximum explosive weights per delay (Qmax) and effective explosive weight per delay (Qeffctive).
table 4. critical peak particle velocity (ppV) for different rockmasses.
Rock Type Critical PPV for damage
Hard rock : Specific gravity (S. G.) > 2.7 Compressive strength > 240 MPa
1200 to 2000 mm/s
Medium hard rock: S. G. > 2.5 Compressive strength: 100 to 150 MPa
700 to 1000 mm/s
Soft rock: S. G. > 2.3 Compressive strength < 50 MPa
< 400 mm/s
The empirical relationship established from the ground vibration data was used to predict the peak particle velocity (PPV) in a radius of 5 m of the pre-split blastholes. The predicted values of PPV at a distance of 0.5 m are 1483 mm/s and 2116 mm/s for maximum explosive weight per delay of 50
kg and 100 kg respectively. For 1 m distance, the predicted PPV values are 729 mm/s and 1040 mm/s respectively. These values were found within limit with the critical damage criteria values i.e. 1200 mm/s to 2000 mm/s.
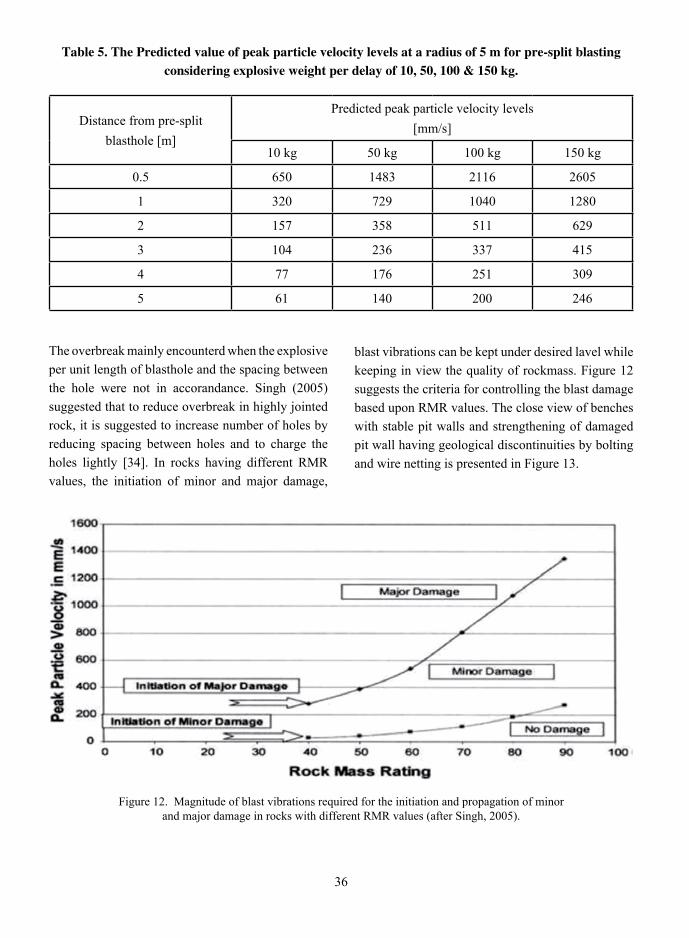
36
table 5. the predicted value of peak particle velocity levels at a radius of 5 m for pre-split blasting considering explosive weight per delay of 10, 50, 100 & 150 kg.
Distance from pre-split blasthole [m]
Predicted peak particle velocity levels [mm/s]
10 kg 50 kg 100 kg 150 kg
0.5 650 1483 2116 2605
1 320 729 1040 1280
2 157 358 511 629
3 104 236 337 415
4 77 176 251 309
5 61 140 200 246
The overbreak mainly encounterd when the explosive per unit length of blasthole and the spacing between the hole were not in accorandance. Singh (2005) suggested that to reduce overbreak in highly jointed rock, it is suggested to increase number of holes by reducing spacing between holes and to charge the holes lightly [34]. In rocks having different RMR values, the initiation of minor and major damage,
blast vibrations can be kept under desired lavel while keeping in view the quality of rockmass. Figure 12 suggests the criteria for controlling the blast damage based upon RMR values. The close view of benches with stable pit walls and strengthening of damaged pit wall having geological discontinuities by bolting and wire netting is presented in Figure 13.
Figure 12. Magnitude of blast vibrations required for the initiation and propagation of minor and major damage in rocks with different RMR values (after Singh, 2005).

37
Figure 13 [A] The close view of benches with stable pit walls; [B] Strengthening of damaged pit wall having geological discontinuities by bolting and wire netting.
conclUsions
The pre-split blast design parameters being practiced have been found optimum and best suited for pre-split blasting and control wall damage. As cracks were encountered beyond pre-split line in case of adjacent production blasts being carried out before pre-splitting, therefore, it has been recognised that each pre-split blastholes should be detonated before the drilling of adjacent production blastholes. For pre-split blasthole diameter of 115 mm, blasthole spacing of 1.2 m was found optimum. Depending upon the rock formation powder factor of 0.44 to 0.65 kg/m3 was used and yielded desired results. The pre-split holes drilled with 60° inclination on footwall and 70° on Hangwall found as best suited in achieving stable pit walls.
The empirical relationship established from the ground vibration data was used to predict the peak particle velocity (PPV) in a radius of 5 m of the pre-split blastholes. The predicted value of PPV at a distance of 1 m Ground vibrations data recorded were of 720 mm/s and 1040 mm/s for maximum explosive weight per delay of 50 kg and 100 kg respectively.
It was observed that in rockmass having RMR value less than 47, half-barrel impression of pre-split
blastholes were not retained. The comparative plot of HCV with respect to RMR value and Joint frequency suggests that with higher RMR values HCF also increases whereas it shows decreasing trend with increased joint frequency.
Besides the influence of rockmass properties, there are a significant impact of blast design parameters such as blasthole diameter, spacing, inclination, charge density, split–factor etc. and all these parameters are highly interrelated. The presplit blasting in 70° inclination exhibited suitable and good result in comparison to pre-split blasting performed in 90° and 80° blast inclined blast holes. It may be due to minimum scattering of explosive gases along foliations/discontinuities.
The similar pre-split blasting in blastholes of 1.2 m spacing shows suitable and appropriate result for minimum damage in comparison to 1 m and 1.5 m spacing, may be due to closer and wider locations of hole. The blasting with charge factor 0.48 to 0.50 kg/m2 imparted suitable result in comparison to 0.65 kg/m2. A vertical buffer row of (115 mm) at a stand-off distance of 1 to 1.5 m results in improved presplit half cast impressions. The number
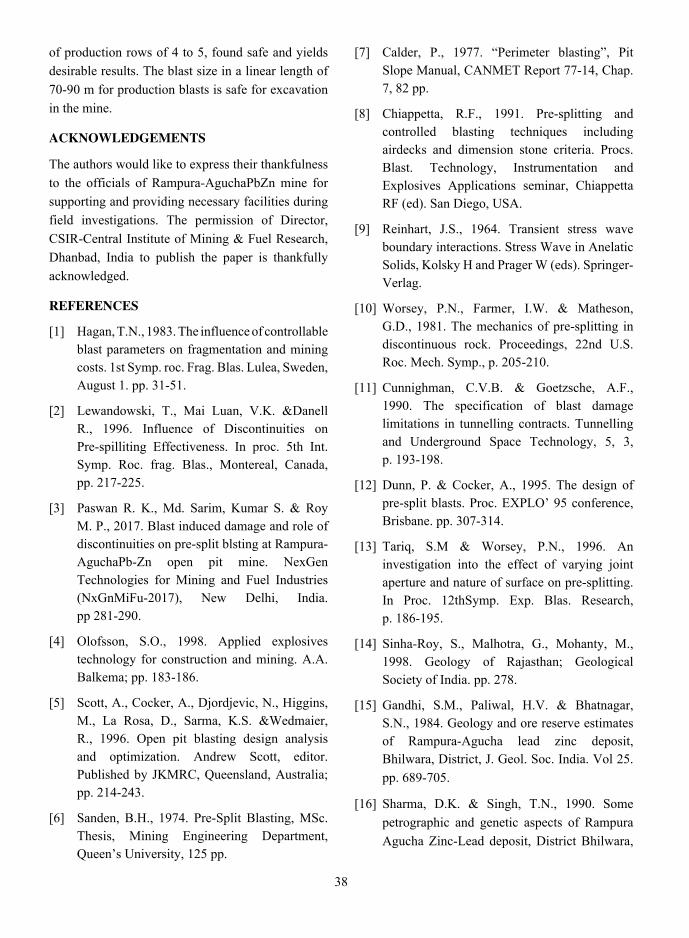
38
of production rows of 4 to 5, found safe and yields desirable results. The blast size in a linear length of 70-90 m for production blasts is safe for excavation in the mine.
acKnowledGements
The authors would like to express their thankfulness to the officials of Rampura-AguchaPbZn mine for supporting and providing necessary facilities during field investigations. The permission of Director, CSIR-Central Institute of Mining & Fuel Research, Dhanbad, India to publish the paper is thankfully acknowledged.
references
[1] Hagan, T.N., 1983. The influence of controllable blast parameters on fragmentation and mining costs. 1st Symp. roc. Frag. Blas. Lulea, Sweden, August 1. pp. 31-51.
[2] Lewandowski, T., Mai Luan, V.K. &Danell R., 1996. Influence of Discontinuities on Pre-spilliting Effectiveness. In proc. 5th Int. Symp. Roc. frag. Blas., Montereal, Canada, pp. 217-225.
[3] Paswan R. K., Md. Sarim, Kumar S. & Roy M. P., 2017. Blast induced damage and role of discontinuities on pre-split blsting at Rampura-AguchaPb-Zn open pit mine. NexGen Technologies for Mining and Fuel Industries (NxGnMiFu-2017), New Delhi, India. pp 281-290.
[4] Olofsson, S.O., 1998. Applied explosives technology for construction and mining. A.A. Balkema; pp. 183-186.
[5] Scott, A., Cocker, A., Djordjevic, N., Higgins, M., La Rosa, D., Sarma, K.S. &Wedmaier, R., 1996. Open pit blasting design analysis and optimization. Andrew Scott, editor. Published by JKMRC, Queensland, Australia; pp. 214-243.
[6] Sanden, B.H., 1974. Pre-Split Blasting, MSc. Thesis, Mining Engineering Department, Queen’s University, 125 pp.
[7] Calder, P., 1977. “Perimeter blasting”, Pit Slope Manual, CANMET Report 77-14, Chap. 7, 82 pp.
[8] Chiappetta, R.F., 1991. Pre-splitting and controlled blasting techniques including airdecks and dimension stone criteria. Procs. Blast. Technology, Instrumentation and Explosives Applications seminar, Chiappetta RF (ed). San Diego, USA.
[9] Reinhart, J.S., 1964. Transient stress wave boundary interactions. Stress Wave in Anelatic Solids, Kolsky H and Prager W (eds). Springer-Verlag.
[10] Worsey, P.N., Farmer, I.W. & Matheson, G.D., 1981. The mechanics of pre-splitting in discontinuous rock. Proceedings, 22nd U.S. Roc. Mech. Symp., p. 205-210.
[11] Cunnighman, C.V.B. & Goetzsche, A.F., 1990. The specification of blast damage limitations in tunnelling contracts. Tunnelling and Underground Space Technology, 5, 3, p. 193-198.
[12] Dunn, P. & Cocker, A., 1995. The design of pre-split blasts. Proc. EXPLO’ 95 conference, Brisbane. pp. 307-314.
[13] Tariq, S.M & Worsey, P.N., 1996. An investigation into the effect of varying joint aperture and nature of surface on pre-splitting. In Proc. 12thSymp. Exp. Blas. Research, p. 186-195.
[14] Sinha-Roy, S., Malhotra, G., Mohanty, M., 1998. Geology of Rajasthan; Geological Society of India. pp. 278.
[15] Gandhi, S.M., Paliwal, H.V. & Bhatnagar, S.N., 1984. Geology and ore reserve estimates of Rampura-Agucha lead zinc deposit, Bhilwara, District, J. Geol. Soc. India. Vol 25. pp. 689-705.
[16] Sharma, D.K. & Singh, T.N., 1990. Some petrographic and genetic aspects of Rampura Agucha Zinc-Lead deposit, District Bhilwara,

39
Rajasthan, India. In proc. Pacific Rim Congress’ 90. Vol II, AIMM, pp. 515-520.
[17] Terzaghi, K. 1946. Rock defects and loads on tunnel supports. In Rock tunnelling with steel supports, (eds R. V. Proctor and T. L. White) 1, Youngstown, OH: Commercial Shearing and Stamping Company. pp. 17-99.
[18] Deere, D.U., Hendron, A.J., Patton, F.D. & Cording, E.J., 1967. Design of surface and near surface construction in rock. In Failure and breakage of rock, proc. 8th U.S. symp. rock mech., (ed. C. Fairhurst), New York: Soc. Min. Engrs, Am. Inst. Min. Metall. PetrolmEngrs. pp. 237-302.
[19] Bieniawski, Z.T., 1976. Rock Mass Classification in Rock Engineering. Procceeding of the Symposium on Exploration for Rock Engineering, Johannesburg, pp. 97-106.
[20] Barton, N.R., Lien, R. &Lunde, J., 1974. Engineering classification of rock masses for the design of tunnel support. Rock Mech. Vol. 6(4), pp. 189-239.
[21] Palmstrom, A., 1982. The volumetric joint count - a useful and simple measure of the degree of rock jointing. Proc. 4th congr. Int. Assn Engng Geol., Delhi. pp. 221-228.
[22] Burkle, W.C., 1979. Geology and its Effect on Blasting. Proceedings of the 5th Conference on Explosives and Blasting Techniques, SEE, pp. 105-120.
[23] Worsey, P.N. & Qu, S., 1987. Effect of Joint Separation and Filling on Presplit Blasting. Proceedings 3rd mini Symposium on Explosives and Blasting Research, Miami, USA, pp. 26-40.
[24] Scoble, M., Lizotte, Y. &Paventi, M., 1996. Rock Mass Damage from Blasting: Characterization and Impact. In: Franklin J. and Katasbanis P. (Eds.), Proceedings of the workshop on Measurement of Blast Fragmentation, A.A. Balkema, pp. 225-235.
[25] Hustrulid, W., 1999. Blasting Principles for Open Pit Mining. Volume 1, A.A. Balkema Pub., p. 382.
[26] Singh, S.P. & Xavier, P., 2005. Causes, Impact and Control of Overbreak in Underground Excavations. Tunnelling and Underground Space Technology, Vol. 20, pp. 63-71.
[27] Singh, S.P. & Narendrula, R., 2007. The Influence of Rock Mass Quality in Controlled Blasting. 26th International Conference on Ground Control in Mining, pp. 314-319.
[28] Singh, S.P., 2014. Influence Geology Blast Damage. Mine Design Wiki-Collaborating to create mining best practice, Sudbury, Ontario CIM Bulletin. Vol. 94, N˚ 1048. h t tps : / /www.minewiki .o rg / index .php/Influence_Geology_Blast_Damage
[29] Singh, P.K., Roy, M.P., Joshi, A. & Joshi, V.P., 2009. Controlled blasting (Pre-splitting) at an open-pit mine in India. In proc. 9th Int. Symp. Rock Frag by Blast. Fragblast-9, Granada, Spain September 13-17. pp 481-489.
[30] Singh, P.K., Roy, M.P. & Paswan, R.K., 2013. Controlled Blasting for Long Term Stability of Pit-walls. Int. J. of Rock Mech. Min. Sci. Vol. 70., pp 388-399.
[31] Roy, M.P., Singh, P.K., Mishra, A.K. & Jawed, M., 2014. Impact of total explosive weight detonated in blasting round on blast induced ground vibration. International Journal of World of Mining - Surface and underground. Vol. 66, No. 3, pp 177-182.
[32] Holmberg, R. & Persson, P., 1979. Design of tunnel perimeter blasthole patterns to prevent rock damage. Procs. Tunnelling ’79, IMM, p. 250-283.
[33] Tsoutrelis, C., Kapenis, A. &Theophili, C., 1995. Determination of blast induced damage zonesin pillars by seismic imaging. Proceedings, EXPLO ’95 Conference. pp. 387-393.
[34] Singh, S.P., 2005. Blast Damage Control in Jointed Rock Mass. Fragblast, Vol. 9, No. 3, pp. 175-187.
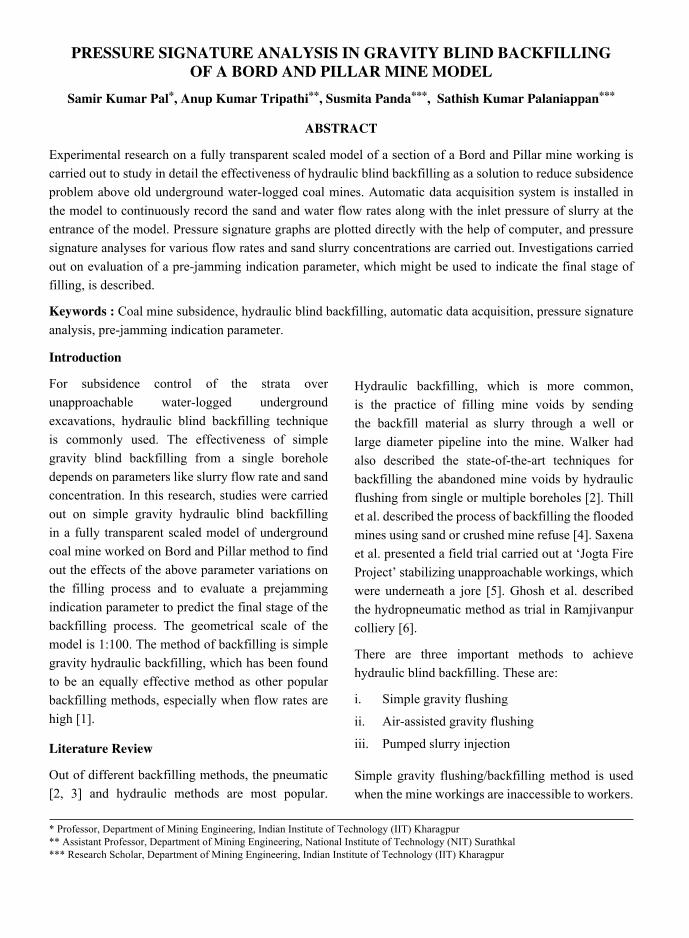
40
PRESSURE SIGNATURE ANALYSIS IN GRAVITY BLIND BACKFILLING OF A BORD AND PILLAR MINE MODEL
Samir Kumar Pal*, Anup Kumar Tripathi**, Susmita Panda***, Sathish Kumar Palaniappan***
ABSTRACT
Experimental research on a fully transparent scaled model of a section of a Bord and Pillar mine working is carried out to study in detail the effectiveness of hydraulic blind backfilling as a solution to reduce subsidence problem above old underground water-logged coal mines. Automatic data acquisition system is installed in the model to continuously record the sand and water flow rates along with the inlet pressure of slurry at the entrance of the model. Pressure signature graphs are plotted directly with the help of computer, and pressure signature analyses for various flow rates and sand slurry concentrations are carried out. Investigations carried out on evaluation of a pre-jamming indication parameter, which might be used to indicate the final stage of filling, is described.
Keywords : Coal mine subsidence, hydraulic blind backfilling, automatic data acquisition, pressure signature analysis, pre-jamming indication parameter.
Introduction
For subsidence control of the strata over unapproachable water-logged underground excavations, hydraulic blind backfilling technique is commonly used. The effectiveness of simple gravity blind backfilling from a single borehole depends on parameters like slurry flow rate and sand concentration. In this research, studies were carried out on simple gravity hydraulic blind backfilling in a fully transparent scaled model of underground coal mine worked on Bord and Pillar method to find out the effects of the above parameter variations on the filling process and to evaluate a prejamming indication parameter to predict the final stage of the backfilling process. The geometrical scale of the model is 1:100. The method of backfilling is simple gravity hydraulic backfilling, which has been found to be an equally effective method as other popular backfilling methods, especially when flow rates are high [1].
Literature Review
Out of different backfilling methods, the pneumatic [2, 3] and hydraulic methods are most popular.
Hydraulic backfilling, which is more common, is the practice of filling mine voids by sending the backfill material as slurry through a well or large diameter pipeline into the mine. Walker had also described the state-of-the-art techniques for backfilling the abandoned mine voids by hydraulic flushing from single or multiple boreholes [2]. Thill et al. described the process of backfilling the flooded mines using sand or crushed mine refuse [4]. Saxena et al. presented a field trial carried out at ‘Jogta Fire Project’ stabilizing unapproachable workings, which were underneath a jore [5]. Ghosh et al. described the hydropneumatic method as trial in Ramjivanpur colliery [6].
There are three important methods to achieve hydraulic blind backfilling. These are:
i. Simple gravity flushing
ii. Air-assisted gravity flushing
iii. Pumped slurry injection
Simple gravity flushing/backfilling method is used when the mine workings are inaccessible to workers.
* Professor, Department of Mining Engineering, Indian Institute of Technology (IIT) Kharagpur ** Assistant Professor, Department of Mining Engineering, National Institute of Technology (NIT) Surathkal *** Research Scholar, Department of Mining Engineering, Indian Institute of Technology (IIT) Kharagpur

41
With this approach, a slurry of backfill material is gravity fed through a well (either a drilled well or a mine shaft) into the mine until the well will not accept any additional backfill material [7, 8]. Air-assisted gravity flushing/backfilling method, also known as hydro-pneumatic backfilling technique, is developed and practiced in India. In this system, solid-water mixture is sent to fill underground voids through a larger diameter pipe and compressed air is fed through a smaller diameter pipe concentrically placed inside the larger diameter pipe [9]. The solids used for filling may be sand, fly ash, small size gravel, crushed stone or washery-rejects. Detailed research work in this area in the form of model studies had been conducted at CMRI [5] and at IIT Kharagpur, India [9]. Pumped slurry injection is similar to simple gravity flushing except that the slurry is pumped down a borehole rather than dropped by gravity. With this approach, enhanced area-wide distribution of the fill material within the mine can be achieved due to the increased velocity at which the slurry is injected. As more material is injected, the fluid velocity increases in the mine workings and the solid materials are transported further away from the borehole [10]. Various types of material (i.e. crushed stones, mine refuse and/or fly ash) can
be used for pumping them into the mine with water. The fill material is transported into the mine as slurry and deposited in the void until the void is completely filled.
Out of the above three techniques of hydraulic backfilling, the simple gravity flushing is a low cost area-wide backfilling technique which can be used to fill a large portion of the mine with backfill material from single feeding borehole through proper control on the slurry flow rate and solid concentration. This method can be considered to be a very useful one for a country like India, where costly slurry pumps are not readily available in our indigenous market. In all the three methods, filling has to be abandoned due to sudden choking or jamming of the injection pipe/roadway thereby making it unusable for further filling. The onset of sudden jamming is a major drawback of all the hydraulic backfilling methods. Till date, no research work has been directed towards the analysis of causes leading to sudden jamming and also there are no reports available on the method of prediction of imminent jamming condition. Therefore, in the present study, it is aimed to critically analyze the inlet pressure signature during the entire phase of filling operation for a simple gravity blind backfilling method through a laboratory model study
Figure 1: Schematic diagram of the experimental set up for gravity blind backfilling
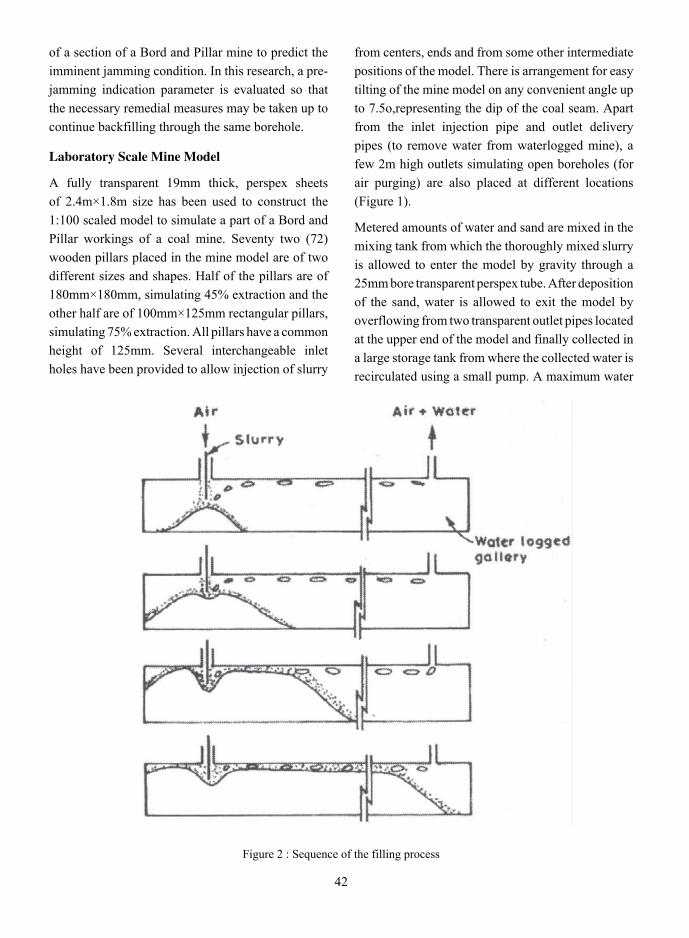
42
of a section of a Bord and Pillar mine to predict the imminent jamming condition. In this research, a pre-jamming indication parameter is evaluated so that the necessary remedial measures may be taken up to continue backfilling through the same borehole.
Laboratory Scale Mine Model
A fully transparent 19mm thick, perspex sheets of 2.4m×1.8m size has been used to construct the 1:100 scaled model to simulate a part of a Bord and Pillar workings of a coal mine. Seventy two (72) wooden pillars placed in the mine model are of two different sizes and shapes. Half of the pillars are of 180mm×180mm, simulating 45% extraction and the other half are of 100mm×125mm rectangular pillars, simulating 75% extraction. All pillars have a common height of 125mm. Several interchangeable inlet holes have been provided to allow injection of slurry
from centers, ends and from some other intermediate positions of the model. There is arrangement for easy tilting of the mine model on any convenient angle up to 7.5o,representing the dip of the coal seam. Apart from the inlet injection pipe and outlet delivery pipes (to remove water from waterlogged mine), a few 2m high outlets simulating open boreholes (for air purging) are also placed at different locations (Figure 1).
Metered amounts of water and sand are mixed in the mixing tank from which the thoroughly mixed slurry is allowed to enter the model by gravity through a 25mm bore transparent perspex tube. After deposition of the sand, water is allowed to exit the model by overflowing from two transparent outlet pipes located at the upper end of the model and finally collected in a large storage tank from where the collected water is recirculated using a small pump. A maximum water
Figure 2 : Sequence of the filling process
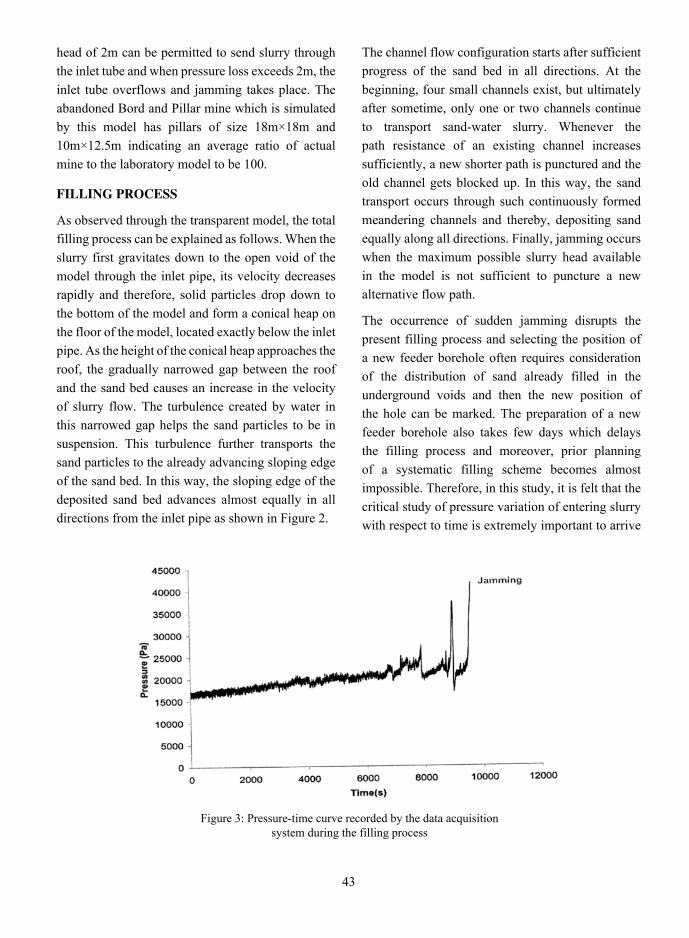
43
head of 2m can be permitted to send slurry through the inlet tube and when pressure loss exceeds 2m, the inlet tube overflows and jamming takes place. The abandoned Bord and Pillar mine which is simulated by this model has pillars of size 18m×18m and 10m×12.5m indicating an average ratio of actual mine to the laboratory model to be 100.
FILLING PROCESS
As observed through the transparent model, the total filling process can be explained as follows. When the slurry first gravitates down to the open void of the model through the inlet pipe, its velocity decreases rapidly and therefore, solid particles drop down to the bottom of the model and form a conical heap on the floor of the model, located exactly below the inlet pipe. As the height of the conical heap approaches the roof, the gradually narrowed gap between the roof and the sand bed causes an increase in the velocity of slurry flow. The turbulence created by water in this narrowed gap helps the sand particles to be in suspension. This turbulence further transports the sand particles to the already advancing sloping edge of the sand bed. In this way, the sloping edge of the deposited sand bed advances almost equally in all directions from the inlet pipe as shown in Figure 2.
The channel flow configuration starts after sufficient progress of the sand bed in all directions. At the beginning, four small channels exist, but ultimately after sometime, only one or two channels continue to transport sand-water slurry. Whenever the path resistance of an existing channel increases sufficiently, a new shorter path is punctured and the old channel gets blocked up. In this way, the sand transport occurs through such continuously formed meandering channels and thereby, depositing sand equally along all directions. Finally, jamming occurs when the maximum possible slurry head available in the model is not sufficient to puncture a new alternative flow path.
The occurrence of sudden jamming disrupts the present filling process and selecting the position of a new feeder borehole often requires consideration of the distribution of sand already filled in the underground voids and then the new position of the hole can be marked. The preparation of a new feeder borehole also takes few days which delays the filling process and moreover, prior planning of a systematic filling scheme becomes almost impossible. Therefore, in this study, it is felt that the critical study of pressure variation of entering slurry with respect to time is extremely important to arrive
Figure 3: Pressure-time curve recorded by the data acquisition system during the filling process

44
at a pre-jamming indication parameter that may be used in future for prediction of imminent jamming condition during advanced stage of filling.
PRESSURE SIGNATURE ANALYSIS
The inlet pressure in the feeder tube was continuously recorded using a data acquisition system. Side by side video images of the experiments were also recorded for explanation of the pressure
signature patterns in terms of changes in physical phenomena during the filling process. Simultaneous recording of video image of the experiments and the corresponding pressure variations were found to be extremely helpful in obtaining information about the meandering process of the channels during filling in different directions from the inlet hole. Figure 3 shows a typical pressure-time curve recorded by the data acquisition system.
Figure 4 : Correlation between the pressure signature curve and the physical phenomens of channel-changing when filling at 30 I/min flow rate and 9% sand concentration
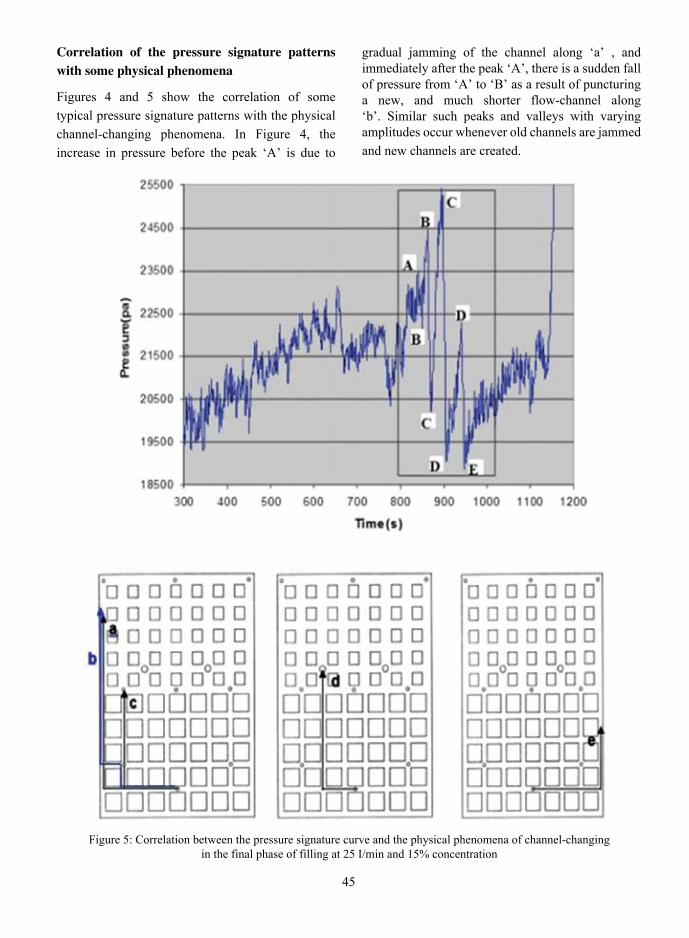
45
Correlation of the pressure signature patterns with some physical phenomena
Figures 4 and 5 show the correlation of some typical pressure signature patterns with the physical channel-changing phenomena. In Figure 4, the increase in pressure before the peak ‘A’ is due to
gradual jamming of the channel along ‘a’ , and immediately after the peak ‘A’, there is a sudden fall of pressure from ‘A’ to ‘B’ as a result of puncturing a new, and much shorter flow-channel along ‘b’. Similar such peaks and valleys with varying amplitudes occur whenever old channels are jammed and new channels are created.
Figure 5: Correlation between the pressure signature curve and the physical phenomena of channel-changing in the final phase of filling at 25 I/min and 15% concentration
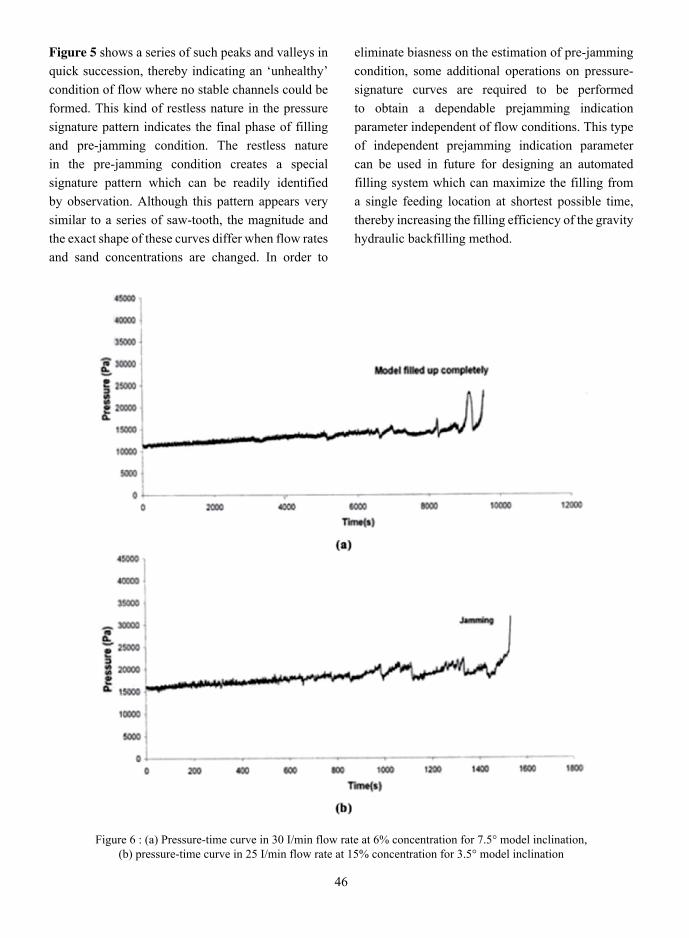
46
Figure 5 shows a series of such peaks and valleys in quick succession, thereby indicating an ‘unhealthy’ condition of flow where no stable channels could be formed. This kind of restless nature in the pressure signature pattern indicates the final phase of filling and pre-jamming condition. The restless nature in the pre-jamming condition creates a special signature pattern which can be readily identified by observation. Although this pattern appears very similar to a series of saw-tooth, the magnitude and the exact shape of these curves differ when flow rates and sand concentrations are changed. In order to
eliminate biasness on the estimation of pre-jamming condition, some additional operations on pressure-signature curves are required to be performed to obtain a dependable prejamming indication parameter independent of flow conditions. This type of independent prejamming indication parameter can be used in future for designing an automated filling system which can maximize the filling from a single feeding location at shortest possible time, thereby increasing the filling efficiency of the gravity hydraulic backfilling method.
Figure 6 : (a) Pressure-time curve in 30 I/min flow rate at 6% concentration for 7.5° model inclination, (b) pressure-time curve in 25 I/min flow rate at 15% concentration for 3.5° model inclination

n10
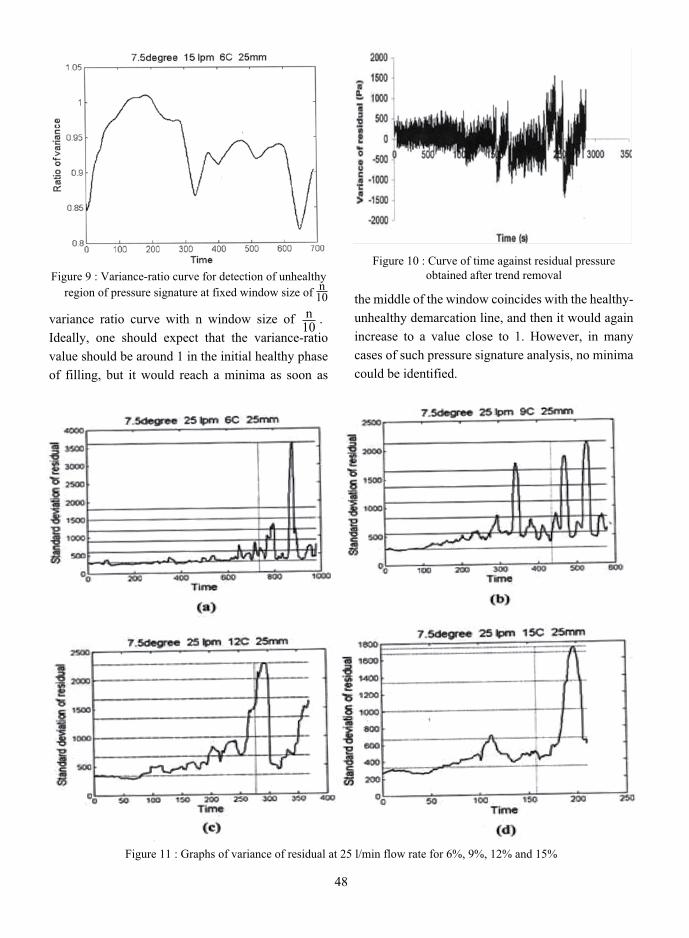


51
Rocks Within Wine-impoRtance of GeoloGy in Global ViticultuRe and Wine makinG
With an apoloGy to indian scenaRio
amitava bandyopadhyay*
abstRact
The taste of wine is as important to a drinker as the geology of wine to a wine-maker. A geologist’s interest in the wine is though in its taste but more on what lies beneath the vineyards. The world has of late acknowledged an immense importance of geology in viticulture to enhance the growth of high quality of grapes in a vineyard suitable for making the finest quality of wine. Many wine theologians had earlier mentioned geology in their writings about a wine region but played economy on giving importance in the development process due to lack of appropriate knowledge on the subject. Sometimes the subject has been either dealt in a wrong way or misguided. Soils from weathered bedrock and groundwater play a vital role as the plants require a suitable soil to hold its roots and draw water mostly from 0.6 m below the surface but in most cases they rely on water down below 2 m depth for transpiration. But in draught period they draw water even from further below. Thus geological influence becomes minimal in areas of deep soil horizons, but in other way, on thinner soil horizons the geology will control the quality of grapes indirectly through influence on soil composition, water retention and geomorphology. The bedrock composition responsible for adding nutrients to the soil controls the colour and taste of grapes and wine. This paper envisages the study made in world’s famous wine cultivation areas to establish the importance of geology but not before introducing wine and its brief history.
introductory
What is wine?
Wine is an alcoholic beverage made from grapes fermented without addition of sugars, enzymes, acids, water or other nutrients (Johnson, 1989). There are other alcoholic beverages too which are not termed wine because of the main ingredients used. Even the beverage made from grapes having alcohol content more than 15.5% are not called wine. Alcohol by volume in wine should be maintained within 5.5% and 15.5%. The grapes used for fermentation is not generally the table grapes but its generic name is Vitisveniferasylvertis. However, by genetic crossing of two species, cultivated grapes are also used for producing wine. In Latin this extracted alcohol is termed vinum, anglicised into wine. The name of grape tree is vine and vineyard is the cultivated vine.
Yeast consumes the sugar in the grapes and converts it to ethanol and carbon dioxide. Different varieties of grapes and strains of yeasts produce different styles of wine. These variations result from the complex interactions between the biochemical development of the grape, the reactions involved in fermentation, the terroir, and the production process. Many countries enact legal appellations intended to define styles and qualities of wine. These typically restrict the geographical origin and permitted varieties of grapes, as well as other aspects of wine production. However, some wines are not made from grapes but from rice and fruits like plum, cherry, pomegranate and elderberry.
* Former Director Geological Survey of India F-403, Larica Tolly, 57 Haridebpur, Dhali Para Road, Kolkata 700104, E-mail : [email protected]
52
history of wine
Tracing back into the archaeological and archaeobotanical evidences reveal viniculture and making of wine was in practice in the territory of modern Georgia as past as 8000 years ago. [“Evidence of ancient wine found in Georgia a vintage quaffed some 6,000 years BC”. Euronews. 21 May 2015. Retrieved 24 May 2015]. Hames (2010) has mentioned that about 9000 years before present (ybp) consumption of similar alcoholic beverage was in practice in China. Wines are also traced in Iran (7000 ybp; Berkowitz, Mark, 1996) and Sicily (6000 ybp; Tondo, Lorenzo, 30 August 2017). Armenia carries the pride of having the evidence of first winery in VayotsDzor cave dating 6100 ybp [“Earliest Known Winery Found in Armenian Cave”. National Geographic. 12 January 2011]. Wine reached the Balkans by 4500 BC and was consumed and celebrated in ancient Greece, Thrace and Rome. Throughout history, wine has been consumed for its intoxicating effects. In ancient literatures, epics and mythologies of various countries including India, as also in cave arts and stone reliefs wines are referred in different context.
colour of wine
Wine is of either red colour or white colour. But there is a range of both red and white ones, from a little lighter to darker. What makes the colour of wine? It is the skin of the grapes. Darker grapes are for red ones and lighter ones for white wines. The actual colour of the wine can range from violet, typical of young wines, through red for mature wines, to brown for older red wines. The juice from most purple grapes is actually greenish-white; the red colour comes from anthocyan pigments (also called anthocyanins) present in the skin of the grape. Fermentation of the non-coloured grape pulp produces white wine. White wine can be straw-yellow, yellow-green, or yellow-gold. The grapes from which white wine is produced are typically green or yellow. Rose wine is another popular variety developed from skin.
Thus the colour and texture of wine depend on those of the grapes. Who controls the colour of grapes? The simple answer is geology of an area. Geology is not only responsible for the colour but also the taste and texture of grapes and its final product that is wine. Here comes the importance of geology in the role of wine industry. Some of the western wine-producing countries have realised it in the post-War era of the last century and have developed the subject Wine Geology that has been included in their university curricula as an inclusive part of Geology.
Wine GeoloGy
introduction
Pelgi Wallace presented a paper on geology of wine in the 24th International Geological Congress in 1972. After that there were some publications in French language. Publications in English on the subject were very few till in 1998 J. E. Wilson published a book on Terroir. Wilson emphasized the vineyard geology as a precursor to the soil, and subsoil through which grape vine grows, and that the geology controls the topography and landform type present, thus influencing drainage and microclimate. J. M. Huggett (2005) reviewed the relation between wine and geology. As the subject is very new as a distinct discipline in geology the number of research papers is not yet satisfactory but its immense importance to the wine industry invites many to carry out the field-specific research. Almost all the famous vineyards throughout the globe depend heavily on the geology of the region for best production in the highly competitive markets and thus the subject becomes an integral part of the study though in India there is least interest in the subject both at the universities and in the field. According to Fuchs (2013), for a good observation of the soil and geology of a terrain for viticulture, a large scale mapping is warranted and for a hilly valley terrain the scale 1:2400 should be maintained.
The physical characteristics of wine like colour, taste, smell etc and its chemistry were the subjects of research for developing wine industry for a long

53
time. While carrying out the research on the soil chemistry, only then the importance of the geology could be realised some half a century ago. In the previous books and scientific literatures, though geology could be traced in the write-up, hardly any importance or details were mentioned. This was first realised by some European and Australian geologists like Jake Hancock, Julian Baker and others. Their observations led European and American wine industrialists to involve geologists in research on the geology, hydrogeology, geomorphology and soils of their respective grapevines. They realised that the quality of grapes depended on the soil characters, the bedrocks and the local environmental factors.
Chemistry of the soil is directly related to density of vines, size and sugar content of its fruits but still, it may be mentioned that all such fruits may not be useful in wine-making. If the vine density is more, sugar content in the grapes is likely to be low, colour will be lighter, may be tasteless also as the trees themselves consume most nutrients depriving their fruits. Vines do not require much water and the trees try hard to draw the water to save their fruits – this is good for the skin, size and sugar content. Thus sloping ground favours for good harvest of grapes.
The rocks beneath the surface influence in the soil making and thus play the most vital role in viticulture. Vine roots penetrate through fractures and joints of the rocks to varying degrees. The geomorphology that controls the slope and the rainwater drainage also depend on the lithology. These factors will be dealt in discussing the wine geology.
The concept of ‘terroir’, originated in France, is defined by Jake Hancock (1999) as “a delimited area with its own characteristic of geology, climate and methods of viticulture”. In 1825, Australian wine expert Busby plausibly first conceived a relation between wine and soil. Later Coquand (1857 in Huggett, 2005) published a correlation of cognac quality with chalkiness of the ground in which it was grown. He was challenged for a long time till White (2003) admitted that the relation between
terroir and wine was not in terms of quantity but exclusively quality. The concept of terroir associates wine flavour and saltiness with the soil or bedrock. Flavours of seaweeds, shale or flint in wine evidently support the soil/bedrock as also vineyard proximity to sea coast likely to have influence of slight salty taste in wine.
soil and Wine
Vines do not survive growing on pure rock. The rocks need to be broken down to form soil. Rocks do weather through the action of wind, water, pressure and natural chemical reactions to form smaller particles and these rock particles combine with plant matter and micro-organisms to form soil. Minerals in rocks break down to form smaller compounds based on their primal elements of sodium, potassium and silicon among others. These, in turn, can form ions which are charged atoms or molecules. The charge is present because there is a mismatch between the number of electrons and the number of protons. If there are more electrons than protons the ion is negatively charged (and it is called an anion) and if there are more protons it is positively charged (and is called a cation). These smaller elements, ions and compounds can pass through the membranes of plants and eventually end up in the fruit. But plants tend to be very selective about what they let through and which part of the plant they allow them reach (White, 2003, Dyson and McShane, 2013). There are a number of essential elements or nutrients for vine health - Carbon (C), Hydrogen (H), Nitrogen (N), Oxygen (O); Macronutrients (200 – 2000 mg/l) : Phosphorus (P), Potassium (K), Calcium (Ca), Magnesium (Mg), Sulphur (S); Micronutrients (5 – 50 mg/l): Iron (Fe), Manganese (Mn), Copper (Cu), Zinc (Zn), Boron (B), Molybdenum (Mo), Chlorine (Cl). These elements are readily found, in the air for first fours and for the rest in the minerals of rocks such as granite and dolerite and sandstone and usually in limestone (Zoecklein, et al, 1999).
Grapes are essentially deep rooting plants that dislike wetlands and grow best on well-drained
54
soil. Viniculture requires special kind of soil on which the tree trunk can stand erect and through which the roots can easily penetrate. Tree can tolerate slight variation in acidity, alkalinity and salt content. But the soil has to be porous to permeate the easy flow of water. In stagnant water the roots lose its grip. Some important physical characters of the soil for viticulture are compactness, colour, depth and organic components besides shape and size of clay particles. Strata variation and ratio of acid and alkaline contents are also significant. The density, thickness and mineral contents of the entire column of soil are equally important. Composition of the soil is another factor for grape cultivation. If the sand content is more, porosity plays vital role in passing out the water while clay restricts water flow, stagnation prevails. If clay content is less than one-fourth of soil component, there is deficiency in moisture while more than forty percent clay turns the soil highly moisture. Thus for viticulture soil should have clay content in between 25% and 40%. The pH content of the soil may be slightly acidic (pH>5-7) for firm grip of the roots but should copper, zinc and iron compounds are mixed in acidic soil, it will not be useful for producing wine quality grapes. Sand-mixed clay is the most suitable for cultivation though lime-mixed soil over limestone bedrock is used in some areas. Whatever be the character and composition of the soil, the nutrients drawn by the roots from the minerals associated with the soil should reach to the fruits to make the wines nutritious and tasty.
Bedrock influences soil chemistry except in alluvial terrains. Any well maintained soil usually contains N, P, Mg, Fe and K in its mineral contents and most plants including vines survive on these nutrients. Of these, N, Mg and Fe are required for leaf growth while K and P are essential for flower and fruit production. In many vineyards nitrogen deficiency is a common problem that is solved artificially by adding nitrogen in the form of manure and artificial fertilizer, and also by action of soil bacteria. Phosphate from fluorapatite, apatite and francolite, present in the soil or bedrock, supply required phosphorous but
in case of deficiency, which is rare too, absorb from a fungi generally associated with the vines. Potash is available in abundance in soils from its mineral contents like potassium feldspar, mica, illite, smectite and vermiculite and easily absorbed by the plants. Feldspar, mica and illite are available in wide range of rocks throughout the geological table while smectite and vermiculite are restricted to soils and Mesozoic and Tertiary sediments. Too much of essential nutrients, however, reduce the quality of vines and wine.
In clay-rich soil profile, calcium and magnesium tend to be concentrated in the lower horizon while potassium and phosphorous tend to be concentrated near the surface (Jackson, 1995). Potassium is available in abundance in volcanic rocks, slate and shale. Use of more chemical fertilizers once in Burgundy spoiled the wine quality (Hanson, 1995). Natural deficiency in nutrients in soil may occur because of underlying rocks, for example limestone is already deficient in iron and thus soils on it contain less iron. Similarly, alluvial sand and conglomerates contain less iron that may cause chlorosis of the leaves in vines. However, the Bourgueil vineyards in France are on a fine-grained limestone which contains a small amount of glauconite. The vines may obtain the iron directly from the glauconite, though it is more probably that this mineral weathers in the soil profile to form kaolinite and iron oxyhydroxides, before it becomes available to the vines.
Most of their nourishments vines draw from a depth beyond 0.6 m though they rely on water for transpiration from around 2 m depth. But during draught they draw water beyond 2 m provided the soil and bedrock be high in porosity but low in permeability. Soil thickness is also an important factor in wine quality. On thicker alluvial soils in summer draught areas like in Australia cares are taken on water retention. Soil texture varies on proportions of sand, silt, clay and pebbles. Low permeability in clay while sand and pebbles fails to hold water. Thus permeability and porosity factors in soil are vital. Presence of smectite and vermiculite, because of their
55
swelling nature, restricts water flow causing water logging and root damage or rotting (Jackson, 1995). Deep-rooted vines are better able to survive damage from heavy rain or drought than are shallow-rooted vines. Study of Burgundy soils, where good quality grapes are produced, reveals that mixing of clay with pebbles are good for vines as pebbles care for good drainage while clay holds. Soils developed from clayey sandstone are good for favourable physical environment for viticulture. In some vineyards of Burgundy, clay is 20% at the top level to 50% down the depth yields excellent product. Dark and stony soils ripen the grapes early as it absorbs and retain more heat by day and radiates at night around the fruits (Jackson, 1995). Wilson (1998) suggested that the red clay soil and ferruginous sands of the better vineyards that are important to wine quality.
Terrain gradient influences the quality of wine more than bedrock as it controls the heat radiation, flow of water during rains and frosting in spring. In hilly regions this plays a great role. In Burgundy many vineyards are in mid-slope as it receives greater amount of sunshine.
Rocks Within Wine
While wines don’t acquire minerality by slurping minerals from the rocks themselves, geology is the basis of soil composition which dictates how grapevines thrive in a given area. In essence, the bedrock of a region helps release nutrients in the topsoil, and determines water retention. Good or bad drainage, nutrient components, and the density of the soil—which ranges from heavy clay to fluffy dirt, sand, or gravel—combine in a grape growing cocktail that dictates what and how grape growers plant their vineyards. And that’s where geology comes in: tectonic activity, ancient oceans, and the movement of land masses millions of years ago have shaped today’s wine regions and you can taste the results.
Named after the Jurassic Era, France’s tiny Jura region highlights the importance of geology in winemaking. Nestled between Burgundy and Switzerland, this
tiny strip of land is mountainous and uneven, with stony peaks that leap up imposingly around small, well-manicured vines. Originally formed with shale, this area was bordered by a massive sea millions of years ago, which eventually withdrew and left a huge deposit, or graben, in the earth. This receding sea exposed layers of multicoloured soils (and loads of dinosaur fossils) perfect for grape growing. Eventually, downward pressure toward this graben forced fault lines to emerge in the Jura, and some of these layers—clay, marl, and gravel—were forced upward in jagged, seemingly random areas amidst a limestone base.
As a result, Jurassic wines display a staggering array of diversity, especially considering its France’s smallest wine region. Chardonnay and Pinot Noir flourish on its limestone soils, which contribute acidity to resulting wines, while clay and marl (a mix of muddy clay and limestone) give native grapes like Poulsard, Trousseau, and Savagnin a place to thrive. The secret is that limestone is a basic component (on the pH scale), and thus provides acid in finished wines. Clay, on the other hand, retains water, and is dominated by other minerals like calcium carbonate. Combine that mix with interspersed areas of gravel and shale, and the geologic winemaking cocktail becomes increasingly complex, as do the wines.
Sicily dramatically contrasts its Francophone neighbours, and doesn’t surprise vineyard managers with fossils. Instead, the island is characterized by rich volcanic soils that cover Mount Etna and its surrounding hills. Formed over millennia as the African continent pressed northward, Sicily rose from the Mediterranean Sea. Over millions of years, the volcanic ash that rained down on Sicily formed mineral-rich soil, combining elements like sulphur, iron, and magnesium. Because Mount Etna is an active volcano, new nutrients regularly rain down on the vineyards. This nutrient-dense soil can support nearly any grape variety, which led the island to produce high-yielding bulk wines for most of its history.
56
Some of these examples are testimonials how viticulture and world’s best wines are related to geological evolution of the terrains. However, bedrocks control the colour and character of grapes.
There are mainly three types of rocks, viz., igneous, sedimentary and metamorphic. All the three rock types have many varieties depending on the composition of minerals and formations. Igneous rocks are of volcanic origin while the sedimentary rocks are derived from the sediments deposited in aerial, aqueous or glacial environment. These two rocks when subjected to temperature and pressure, ranging from low to high, within deep or near surface depth, get metamorphosed to form metamorphic rocks. Soils, the weathered product of these rocks through physicochemical processes, rest above the rocks, and it take sufficient time for maturity to become soil. Soil contains the minerals and fragments of the rocks above which it matures and its texture depends on the admixing proportions of variable size of composed materials ie., sand, silt and clay. Thus the bedrock influences the character and nature of soil including the porosity and permeability.
Broadly, igneous rocks are mainly acidic or silica-aluminium rich and basic or silica-magnesium rich. The acidic rocks are light coloured while the basic rocks are dark coloured. This colour of the rock controls the colour of the soil above them. In turn, this colour of the soil is responsible for the colour of the skin of grapes and wine. Vines grow in a black soil above the basaltic bedrock produce black skinned grapes and those grow in a light coloured soil above the granitic bedrock yield light coloured grapes. Because of distinct mineral contents of these two rocks the minerals in the soil are different and thus the tastes of the grapes but both are rich in nutrients. Many world famous vineyards are cultivated in these two soils. Some of the famous and highly tasty red wines are produced from the grapes developed in the vineyards on black soils in south Germany, Hungary and Canary Islands, Spanish archipelago. White wines produced from light coloured grapes grown in the vines cultivated on granitic soil of Cornas and
Stellenbosch of South Africa is equally renowned. The Massif Central in France is a huge pile of granite with intrusions of basalt from the late Tertiary period. The most sought after land in the Beaujolais is granitic and there is a long established affinity between the Gamay grape and granitic soils. Globally celebrated Alsatian Riesling and Muscadet wines are the products of light coloured grapes produced on granitic soil. Some of such wines even hold the flavour of granite, a connoisseurs’ pleasure.
The second major type of rock is the group of sedimentary rocks such as sandstone, chalk, limestone, mudstone, coal, tuffeau and chert. Among the sedimentary rocks, soil above the marine limestone is favourable for viticulture. The finest wines of Chinon in the Loire Valley are raised in soils derived from the local tuffeau which was formed from sand and marine fossils. In the Coonawarra we see limestone sitting on a sandstone base and this soil and Cabernet Sauvignon seem to get along very well together. Riesling also gets benefit from sedimentary soils and sandstone in Kitterlé and limestone of Zinnkoepflé. Some of the costliest and celebrated wines are produced from the grapes developed on these soils in Tuscany of Italy and Burgundy of France. The fossils present in the limestone make the soil nutrient rich and thus the wine become nutritious with exclusive taste. Champagne produced from the grapes of the vineyards on chalky limestone soil is the best because of presence of microfossils and magnesium in the rock. All credit should go to those once living microanimals for making such drinks heavenly tasty. Fresh water limestone soils also yield good nutritious grapes. One of the finest tasty wines in this globe is Chardonnay; its vineyard is on Jurassic limestone of France which was later covered by Quaternary glaciers that fissured and cracked the rock to turn into soil. Many other fruits are produced on this soil and the fruits retain fragrance of the soil.
Physicochemical changes of the minerals during the process of metamorphism of igneous or sedimentary rocks make the soil above metamorphic rocks suitable for viticulture and wines produced from such

57
grapes do good business. However, some elements present in the minerals of the rocks enhance the quality of wine. Most of the minerals in the crust are of compounds of elements, as oxides, silicates, sulphides, carbonates etc. Oxygen and silicon are the two primary elements constituting 46% and 28% of the total elements. Quartz is made of these two elements. Some other elements combine with these two to make silicate minerals. Dark coloured igneous rocks contain Fe-Mg silicate minerals like olivine, pyroxene and amphibole (hornblende). Soils from such rocks are of dark coloured. Many significant vineyards of Italy are on this soil. Such rocks may also contain mica that may be of white muscovite or black biotite. Mica turns the grapes’ skin bright and shiny. It reflects in the wine also. In fact, Alsatian Riesling wine shines bright because of presence of mica.
Diamond and graphite are of pure carbon. Graphite mixed soils is black coloured. In some places of Spain and Austria vines cultivated on such soil produce black grapes. Soil above igneous rocks or sedimentary rocks and metamorphic rocks derived from igneous rocks generally contains enough sulphur to make it favourable for excellent viticulture as found in some fields close to young volcanic mountains of Etna, Vesuvius and Vulture of Italy.
Beside silicates, oxide and sulphate minerals in soils are also good nutrients of grapes. Among oxides, haematite (iron oxide) makes soil red and wines produced from grapes grown on such soil become red as recorded in Australia. In France, bauxite (aluminium oxide) mixed soil produce high quality grapes and wine. Vines are also cultivated in gypsum (calcium sulphate) mixed soil in Spain and western Colorado. Calcite (calcium carbonate) limestone and lime mud are incapable of retaining water, and to make it fertile for viticulture often water-absorbent montmorilonite clay is added. It has been observed in Burgundy that such treatment in soil has increased both quantity and quality of grapes. Feldspar (KAlSi3O8 – NaAlSi3O8 – CaAl2Si2O8) is a common constituent in granite. Kaolinite is
formed due to chemical erosion of feldspar. In some fields kaolinite clay is also used to maintain moisture content in soil. Some K-feldspar in granite is of pink colour and the wine produced from grapes cultivated in soil mixed with such pink feldspar clay becomes rosy.
Thus the geological environs including the bedrock and soil, and climate control the harvesting of good quality and quantity of grapes. The nature and character of soil and its clay contents, moisture content, the nature of underneath rocks and constituent minerals are very important to know. To improve the quality of soil sometimes some elements are added and to know the availability of such elements from a proximal area can only be advised by a geologist from his knowledge on the geological history and environs of the region. Thus geology suffices to improve the wine more nutritious, tasty and in turn the industry and economy.
Examples of famed wine regions where soils are derived from single rock type are Champagne (chalk), Chablis (Kimmeridgian limestone), Jerez (limestone), Porto (schist), and Mossel (slate). However, equally famous wine regions have soils derived from a mixture of rock types and are nonhomogeneous across the region, viz. Rheingau, Bourdeaux and Beaujolais (Wallace, 1972, White, 2003).
Wine industRy in india
Organised geological study for viticulture in India is lacking. Its importance has not yet unfolded either in the classrooms or in the agricultural fields. Neither there is any institutional research for growth of high quality and huge quantity of grapes suitable for producing wine. It still depends on climate, rains and topography. However, it is also true that the suitable land for viticulture is limited in this vast land. There is so much variability in rocks, soil, groundwater and climate within a region that vines cannot be grown in a large area. Coastal areas in Indian peninsula get huge rains while a vast central region experiences huge heat throughout the year barring two to three
58
winter months. Sub-Himalayan terrains remain suitably cold while higher reaches have glaciers and extreme cold. Due to excessive heat and rains in central and western part of India, viticulture is not possible yet a few slopes of Western Ghats have been identified suitable for vine cultivation. Due to slopes there is hardly any water stagnation and hills protect the vines from gusty cold winds. Vine cultivation is done generally within 200 and 1000 metre height above mean sea level and the temperature should remain in between 80 and 300 Celsius. During rainy season rainfall stands between 62 and 150 centimetre. All these along with geological environs favour cultivation. Both dark and light coloured grapes are grown depending on the soil and bedrocks. Maharashtra, Karnataka and Telengana are the principal states for viticulture. Nashik in Maharashtra is known as wine capital of India. Grapes are cultivated also in Baramati, Pune, Sangli and Sholapur. Grapes are harvested in these places in February itself. There are a few locations in Tamilnadu and Punjab where vines are grown. In Tamilnadu, Karnataka and Andhra Pradesh vines are cultivated two times in a year. Trees are rested on a high bamboo-mesh to avoid fungal attack on ground due to heat and moisture. Viticulture is carried out in India in almost three lakh acre land but all the grapes are not suitable for wine. Some famous vineyards in India for wine making are in Nashik (Sula and Jampa), Narayangaon and Akluj (Frateli) in Maharashtra, Nandi Hills (Grover) in Karnataka and Dindori in Madhya Pradesh.
conclusion
To make good quality of wine, it requires growing good quality of grapes for which good nutrient rich soil is needed. Soil comes from underneath rocks. Thus for viticulture study of geology is very important. The quality of soil can be improved with addition of some nutrients/elements. Geologists can search such elements from rocks of nearby areas. Realising the importance of geology, many wine producing countries have started educating the students’ oenology, and research scholars are
engaged in finding more relations between wine and geology from different angles. Thus the quality of wine with rich in nutrients is being enhanced. This has increased the demand and production by 2% every year. The industry is flourished. In 2015, 275.7 million Hectolitre wine has been produced. Italy, France, Spain and America are top wine producing countries. World’s three most famous vineyards are Burgundi in France, and Sicily and Tuscany in Italy. Soil characters of these vineyards are responsible for producing high nutrient-rich and tasty grapes and wine. All such famous vineyards have signboards informing the local and regional geological status, name of rocks and fossils, if any, geological age, soil characters etc. These are important for buyers to have the knowledge of the area and the quality of fruits. Identity of wine is in the soil on which grapes grow.
acknoWledGements
Acceptance of this paper for oral presentation and publishing in the Transaction volume by the MGMI is thankfully acknowledged.
References
Dyson, Sue and McShane, Roger. (April 2013). Minerality in Wine :Part1. Living Wines, Wine Talk. p. 16-20
Fuchs, William A. (2015). Viticulture Geology. Wines and Vines. January 2013
Hames, Gina. (2010). Alcohol in World History. Routledge. p. 17.
Hancock, J.M. (1999). Feature Review – “Terroir; The role of Geology, Climate and Culture in the making of French Wines” by James E. Wilson 1998. Journal of Wine Research, 10, p. 43–49.
Hanson, A. (1995). Burgundy. Faber and Faber, London.White, R.E., 2003. Soils for Fine Wines, Oxford University Press, UK
Huggett, J.M. (2005). Geology and Wine : A Review. Proceedings of Geologists’ Association. 117, p. 239-247

59
Jackson, R.S. (1995). Wine Science principles and applications. Academic Press, London
Johnson, H. (1989). Vintage : The Story of Wine. Simon & Schuster. pp. 11–6.
Voss, R. (1995). Wines of the Loire. Faber and Faber, London
Wallace, P. (1972). Geology of wine : Inernational Geological Congress, 24th Session, Montreal, Section 6, Stratigraphy and Sedimentology, p. 359-365
White, R.E. (2003). Soils for fine Wines. Oxford University Press, Oxford.
Wilson, J.E. (1998). Terroir : the role of geology, climate and culture in making French wines.Mitchell Beazley, London, UK, 336p.
Zoecklein, B.W., Fugelsang, K.C., Gump, B.H., and Nury, F.S. (1999). Wine Analysis and Production. Chapman & Hall, New York
Berkowitz, Mark (1996). “World’s Earliest Wine”. Archaeology. Archaeological Institute of America. 49 (5).
Tondo, Lorenzo (30 August 2017). “Traces of 6,000-year-old wine discovered in Sicilian cave”. The Guardian
60
Sedimentation and Stratigraphy at the interface of the indian Shield and himalayan ogogen:
a critical reSume of evolution of the ganga
dr Barendra purkait*
a B S t r a c t
Sedimentation and the structure at the interface of the Ganga and the Siwalik basins have been critically studied. The Indo-Gangetic depression produced by the downwarping of the Indian Shield contains a prism of 4.5-5 km thick Cenozoic sediments in the northern and central parts of the depression. The provenances of sedimentation in the two basins are not identical. The rising Himalaya provided eroded materials in the Siwalik Basin as molasses whereas the Vindhyan Shield area provided terrigenous and volcanogenic materials intermixed with marine intercalations for the Ganga Basin. Continuity of sedimentation across the interface occurred in the late Palaeogene-Neogene times. The geophysical study indicates the presence of a ‘plane of detachment’ in the crustal part of the Indian Shield and it extends from the basement underneath the Indo-Gangetic Alluvium and Ganga Basin northwards below the Siwalik towards the Lesser Himalaya and ultimately passes below the High Himalaya and Tibetan Plateau. The plane of detachment in the crust (including foredeep of the shield) implies tectonic activity from the Himalayan Frontal Thrust northward across the basin interface zone and onto the Himalayan orogen. Steep dipping faults at the interface could be influenced in its alignments due to this activity of the detachment plane. The critial analysis of the existing data invites attention for further investigation in this Indo-Gangetic depression covered by the thick Cenozoic sediments for any hydrocarbon potentiality of this vast alluvial cover of the Gangetic alluvial plain.
Key words : Ganga Basin, Siwalik Basin, Indo-Gangetic Alluvium, Plane of Detachment.
[* The manuscript is dedicated to Late Prof. P.K. Gangopadhyay who was the teacher of the author. Unfurtunately he expired during the preparation of the manuscript with him]
1. introduction
Two remarkable basins of sedimentation, paralleling the Himalayan front in a nearly WNW-ESE direction, are situated in contrasting geodynamic scenarios and yet interlinked through a chain of geological events. Both are broadly arc shaped: the southern one is termed as the Ganga Basin, located subsurface under the Indo-Gangetic Alluvium (IGA) and the northern one is known as the Siwalik Basin encircling the foothills of the Himalayan Orogen.
Information on the sediments and rock sequences of the Ganga Basin are known mainly through investigations (bore-hole logging, seismic, gravity and magnetic studies) conducted for exploration of oil below the alluvial cover of the Indo-Gangetic
Alluvium. The basin developed in the northern part of the Indian Shield (Figs. 1a&b).
At the northern fringe of the Indo-Gangetic alluvium cover, girdling the foothills of the entire Himalayan rangesemerges the linear belt of the Siwalik Basin. What happens at the interface of the Ganga Basin and the Siwalik Basin under the cover of the Indo-Gangetic Alluvium is still an enigma.
The Ganga Basin passed through a series of geotectonic events as it formed and developed in time since the Indian plate commenced its northward flight after the disintegration of the Gondwanaland around 200 Ma. It is an intriguing sequence of
* Former Director, Geological Survey of India, Presently : Guest faculty, Department of Geology, University of Calcutta 35, Ballygunge Circular Road, Kolkata - 700019, E-mail : [email protected], [email protected]

61
events how the basin formed on the drifting Indian plate and ultimately came in the vicinity of and locked in conjunction with the emerging Himalayan frontal region in Tertiary (~ 50-45 Ma). At this time the development of the Ganga Basin appears to be shrouded in mystery, more so because of the blanket cover of Indo-Gangetic Alluvium, which obscures the exact relationship between the rocks of the Ganga and the Siwalik Basins.
The aim of this paper is to make a critical resume of the basinal situations on the northern part of the Indian Shield as well as at the frontal part of the emerging orogen. An attempt has been made to build up the sequences of geodynamic events which ultimately led to the near juxtaposition of the Ganga and the Siwalik Basins and thereby explore the nature of interface of the two.
Fig. 1b. Sub-surface structures in the Ganga Basin (after Sengupta, 1962; Fuloria, 1969; Shastri et al., 1971).
62
2. crustal structure at the indian shield - himalayan foothill interface
2.1. geodynamic considerations
Plate tectonic concept and its application in understanding the geodynamics of the earth have outmoded the classical concept of down-buckling of the crust, sedimentation in geosynclines and birth of orogens. Instead the concept of ‘Wilsonian Cycle’ involving birth of new oceans, drifting of crustal plates, death of old oceans, collision of plates and suturing has greatly influenced the geosciences (Jacobs et al., 1974). This trend of thought is particularly reflected in the ‘rift and drift’ history of the Indian plate since the break up of the Gondwanaland, opening of the India Ocean and ultimate collision with the Eurasian plate at the Indus-Tsangpo- suture zone (ITSZ).
The Indian Shield (which is the surviving part of the Indian plate) preserves the geological history from the Precambrian (Archaean and Proterozoic) to Recent. It is remarkable that the geological evolution of the Indian subcontinent since the break up was dynamic in nature as the stratigraphy of rocks was built up when the India plate started moving northward with concurrent opening of the India Ocean. This ‘rift and drift’ phase of the Indian plate, its collision with the Tibetan Block of Eurasia and events of Himalayan orogenesis had been outlined by Le Fort (1975). Correlated with the magnetic anomalies of the Indian Ocean, the flight of the Indian plate had been tracked precisely (Table-6 of Le Fort 1975). The spreading history of the India Ocean was punctuated by important variations in rate and direction of spreading (Le Pichon and Sclater, 1968; Fischer, Sclater and McKenzie, 1971; McKenzie and Sclater, 1971). Twice the movement had slowed down, even stopped (Upper Eocene, Lower Miocene); twice it had resumed (Lower Oligocene?, Upper Miocene). Actually the movement was a rotation whose center had changed at least once since the beginning of the flight of the Indian plate. This change was from about 20N, 260E to 290N, 270E (Le Pichon and Heirtzler, 1968; Le Pichon, Francheteau and Bonin,
1973). This rotation centered on the western side of the plate and implied a relatively longer northward movement of the eastern side than that of the western side. The collision of Indian and Eurasian plates is, therefore, a complex geodynamic event. The northern part of the Indian plate, hinged at Pamir plateau in NW Himalayan region, gradually closed in an anticlockwise fashion in a dice-?like movement to complete the suture zone (ITSZ) south of Lhasa (Gupta, et al., 1982). The collision was, therefore, not ‘head-on’ but oblique in nature and hence the regional dynamic picture must have been transpression type. The bulges of the Indian plate had to be eliminated by oblique and transcurrent faulting and underthrusting. The surviving protrusions of the peninsular shield below the Indo-Gangetic Alluvium and syntaxial bends in the Himalayan Orogen do indicate the jugged nature of the northern part of the Indian plate and still partly retained as relic in the configuration of the Ganga Basin.
The Indo-Gangetic Alluvium (IGA) continues to be a tectonic enigma despite its outward simplicity as a vast alluvial plain (Mahadevan, 1994). It has been commonly interpreted as a ‘foredeep’ (Suess, 1906) but also as a rift (Burrard, 1912) filled with alluvium to a depth of nearly 16 km, as a trough at the advancing edge of the steeply subducting Indian plate (Holmes, 1965).
2.2. crustal features of ganga Basin below iga
The peninsular shield region under the IGA had been probed by geophysical methods as well as by some boreholes. Aeromagnetic surveys were done in 1956 and subsequently gravity, magnetic and seismic surveys were conducted by the Oil and Natural Gas Commision (ONGC). Body wave studies had been carried out by the AMD and NGRI (Mahadevan, 1994, pp. 312-329). Several deep bore holes and some structural wells had been drilled by the ONGC (Shastri et. al., 1971, Fuloria, 1969, Aditya et. al., 1976, Raiverman et al., 1963). The boreholes situated on the plain, are at Hosiarpur, Ujani, Tilhar, Raxaul and Purnea and structural wells are at Sira, Kasang
63
and Ujhani. A number of deep structural wells had also been drilled in the frontal Himalayan fold-belt. The structural situation of the region is depicted in Figs 1a, b. The configuration of the ‘basement’ (or hard rock below sediments) in the peninsular region is shown by topographic contours. The limits of Ganga Basin on the west are demarcated at the junction of the Punjab Basin and on the east at the border of the Bengal Basin.
An outline of the tectonic framework of the Ganga Basin had been given by Sastri et al. (1971). The criteria used in classifying the basin were as follows (op.cit., p. 225):
a) Basement configuration and the thickness of the overlying sediments as reflected in the aeromagnetic surveys,
b) The structures within the sedimentary sequence, and
c) The probable northward extension of the major tectonic lineaments in the exposed peninsular shield area into the Ganga Basin.
The main tectonic subdivisions of the basin from east to west are designated as :
i) Monghyr-Saharsa ridge
ii) East Uttar Pradesh shelf
iii) Gandak depression
iv) Faizabad ridge
v) West Uttar Pradesh shelf
vi) Sarda depression
vii) Delhi-Hardwar ridge.
These tectonic elements are shown in Figs. 1a, b. It is necessary to emphasize that the ‘basement configuration’ under the IGA had been inferred mostly on the basis of geophysical investigation. A critical resume of geophysical data covering the Ganga basin from different sources had been given by Mahadevan (1994, p. 317-329). The data include those on gravity, seismic and electromagnetic observations.
Aeromagnetic data indicated that the Ganga Basin is characterized by two major magnetic trends –
a) the regional basinal configuration follows the Himalayan orogenic trend, i.e., E-W to NE-SW, and
b) sub-surface regional features, parallel to NE-SW, simulate NE-SW Precambrian structural grains and those linear features are trending northeastward.
These two structural trends must have been guided by deep-seated structures, possibly faults, in the ‘basement’ rocks (? Precambrian). As a result, the Ganga Basin had been segmented into number of E-W and NW-SE trending sub-basins, separated by faulted horsted up ‘basement’ blocks trending NE-SW. Four major basins and separating horsts were recognized from the aeromagnetic maps. This is the basis of the reconstruction of the sub-surface structure of the Ganga Basin.
Synthesis of the data generated from several sources, geophysical and drilling, have led to the delineation of many ‘basement’ ridges and depressions (Mahadevan, 1994, p. 315). This basement geometry underneath the Indo-Gangetic Alluvium needs to be considered in relation to the ‘Siwalik foredeep’ in the north and the Precambrian Peninsular Shield in the south. It had been further indicated that the structural pattern and gravity picture of most of the ‘basement’ ridges are inferred to be bounded by faults.
2.3. tectonic situation at the ganga Basin – Siwalik Basin interface: foredeep or deep-seated fault
The northern margin of the Indian Shield is concealed below the IGA and the Siwalik Group of rocks. Whether the Indian Shield (assumed to be made predominantly of Precambrian gneisses and granites forming ‘basement’) continues further northward upto ITSZ when it buckles steeply downwards or it extends below the Tibetan region is a debatable subject (Molnar 1988).
64
Geophysical data, available so far, suggest an uneven configuration of ‘basement’ over which the rock sequences (including Tertiary rocks) of the Ganga Basin were deposited. The structural framework at this part of the ‘basement’ is characterized by depressions and intervening fault bound horsts. The arrangement of sediments under the IGA in the Ganga Basin suggests northward sloping ‘basement’ with greater depth in the northern part than in the southern part of the graben-like depressions.
The above structural framework continues towards the Siwalik Hills in the north. The Tertiary Siwalik rocks dip at low angles (200-250) northwards and are overlain by the northward dipping Lower Gandwana rocks; the junction is a structural discontinuity termed Main Boundary Fault (MBF). The Siwalik sequence remarkably continues for over 2000 km from west to east, almost fringing the arcuate outline of the Himalayan foothill. There are a few gaps in the outcrop pattern of the Gondwana over the MBF where the low-grade metamorphic rocks, occurring above the Gondwana, come in contact with the Siwalik sequence demarcating the MBF (Gansser, 1964).
The Siwalik rocks are not only consistent in their extension from west to east but also shows persistent signatures of younging northwards, locally the rocks are folded on N/NNE- S/SSW axes plunging at low angles (100-200) northwards; the folds are nearly upright. These structures are apparently correlatable with mesoscopic F3 – folds recognized in the lesser Himalayan region (Gangopadhyay, 1995).
In the above background of the tectonic framework of the Ganga Basin and the Siwalik Basin, two major issues demand attention:
1) What constitutes the basement of the Siwalik Basin?
2) What is the nature of the southern boundary of the Siwalik Sequence vis-à-vis the Ganga Basin sequence (including Tertiary rocks)?
The answer to these questions hinges on the concept of the structural configuration at the northern part of
the Indian Shield. This subject, clouded by lack of clear information on sub-surface structure, was given specific attention by Oldham (1917). He observed that it was not possible to draw a cross-section of the Gangetic trough with any degree of certainty.
Oldham (1917, p.1-2) also referred to a paper by Sir S.G. Burrard on the ‘Origin of the Himalaya Mountains’ (Survey of India, Profesional Paper No. 12, Calcutta, 1912). This paper implied that the geodetic evidence necessitated the existence of deep and comparatively narrow rift along the edge of the hills, filled with rock of lesser density than that on either side. Is this rift now occupied by Siwalik rocks? Actually the concept of a rift zone emerged through the observations by pioneering workers as stated by Oldham (1917, p. 5).
2.4. polar wander and dynamic model of geological events of the indian plate
Assuming acceptance of plate tectonics and collision along the ITSZ, the apparent polar wander of Indian plate since the Cretaceous and the regional tectonics, including the tectonic situation at the Ganga Basin – Siwalik Basin interface, can now be discussed.
Since the disintegration of the Gondwanaland around 200 Ma, the movement plan of the drifting Indian plate, along with opening of the Indian Ocean, indicates a dynamic model for geological events and rock sequences developed in the Indian plate as well as in the neighbourhood of the collision zone (ITSZ) (Le Fort, 1975; Holmes, 1992). The apparent polar wander of India since the Cretaceous had been outlined by Action (1999). He had demonstrated a location map illustrating the Reunion and Kerguelen hot spot tracks (Action, 1999, Fig. 1). It was estimated that the rate of APW (Apparent Polar Wander) had an abrupt decrease at 57 3 Ma, which correspond to when the collision or suturing of India with Eurasia began to impede India’s northward progression.
The above geodynamic reconstruction indicates two major tectonic regimes. The northern part of the Indian plate was under N-S directed compressional stress at least from ITSZ to MBF, now manifested
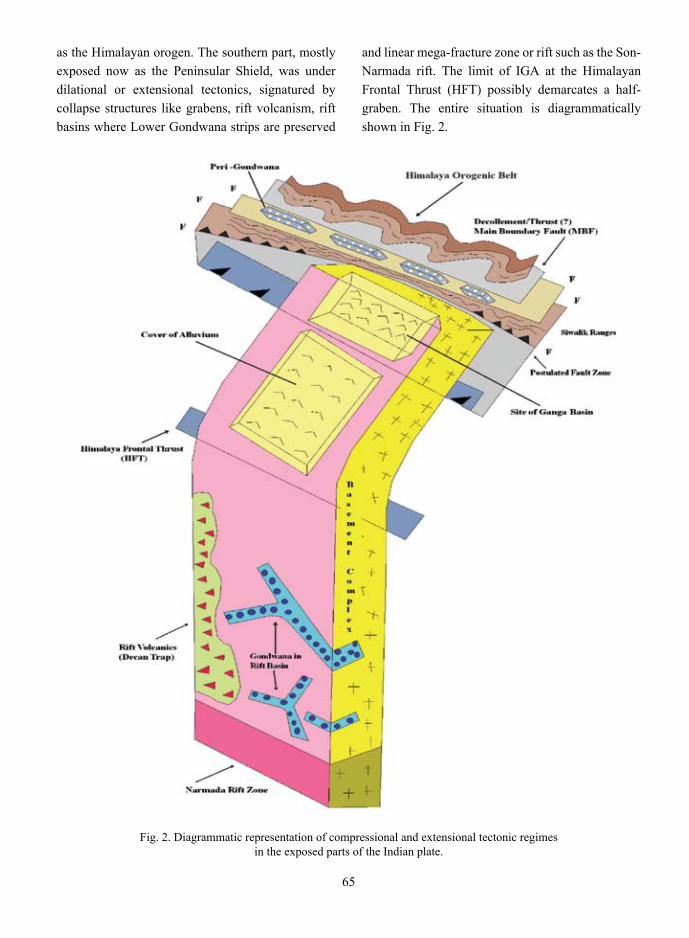
65
as the Himalayan orogen. The southern part, mostly exposed now as the Peninsular Shield, was under dilational or extensional tectonics, signatured by collapse structures like grabens, rift volcanism, rift basins where Lower Gondwana strips are preserved
and linear mega-fracture zone or rift such as the Son-Narmada rift. The limit of IGA at the Himalayan Frontal Thrust (HFT) possibly demarcates a half-graben. The entire situation is diagrammatically shown in Fig. 2.
Fig. 2. Diagrammatic representation of compressional and extensional tectonic regimes in the exposed parts of the Indian plate.
66
A contrasting complex tectonic situation is thus apparent for the drifting Indian plate.
Under the IGA, the development of graben like depressions in the regional Ganga Basin fits in with the dilatational tectonics in the southern part of the India plate. On the other hand, the development of the Siwalik basin is still an enigma. The main reason is that the basement of the Siwalik sequence is still to be ascertained physically. The freshwater Tertiary deposits of the Siwalik exhibit a remarkable physical continuity for over 2000 km in a nearly E-W direction. The preservation of a nearly 6 km thick sedimentary sequence strongly favours accumulation in a fault bound mega-graben shaped structure. It developed at the interface of the contrasting compressional and dilatational regimes during the collisional episode spanning from nearly 55 Ma onwards. The preservation of Lower Gandwana rocks, Ganga Basin sequence and Siwalik sequences was mainly due to dilatational tectonics continuing, at least, upto the MBF. The Ganga Basin and Siwalik basin interface thus indicates regional tectonic discontinuity generated in the basement of the Indian Shield. After the deposition of the Siwalik sequence, the effect of later compression is recognizable from large scale warps or folds on nearly N-S axis correlatable with the third generation F3 folds in the Himalayan orogen.
3. Sedimentation in ganga Basin and Siwalik Basin
3.1. nature of sedimentation in ganga Basin
The Indo-Gangetic depression, categorized as a ‘foredeep’ produced by the downwarping of the Indian Shield concomitant of Himalayan elevation (Suess, 1906), contains a prism of Cenozoic sediments, 4.5-5 km thick in the northern and central parts of the depression. The modern Ganga Basin is an extensive elongate feature broadly paralleling the NW-SE trend of the thrust terrain of the Lesser and sub-Himalaya. Beneath the undeformed sediments of the Ganga Basin, extension of the foreland thrust belt has been found in wells drilled by Oil and Natural Gas Commission (ONGC) (Sastri et al., 1971). Subsurface geology below the thick blanket of the Gangetic alluvium and other Sister Rivers was studied from the borehole data. Three deep wells e.g. Ujhani-1, Tilhar-1, and Raxaul-1 and four shallow structural wells, e.g., Ujhani-1, 2 &3 and Kasganj structural well-1, were drilled by ONGC covering a stretch of about 650 km of the Ganga Basin from east to west (Fig. 1a).
Further west in Punjab Basin, ONGC has drilled 8 deep wells (Adampur-1, Hoshiarpur-1, Janaury –1&2, Jawalamukhi-1&2, Behl-1, Surinsar-1) and six structural wells.
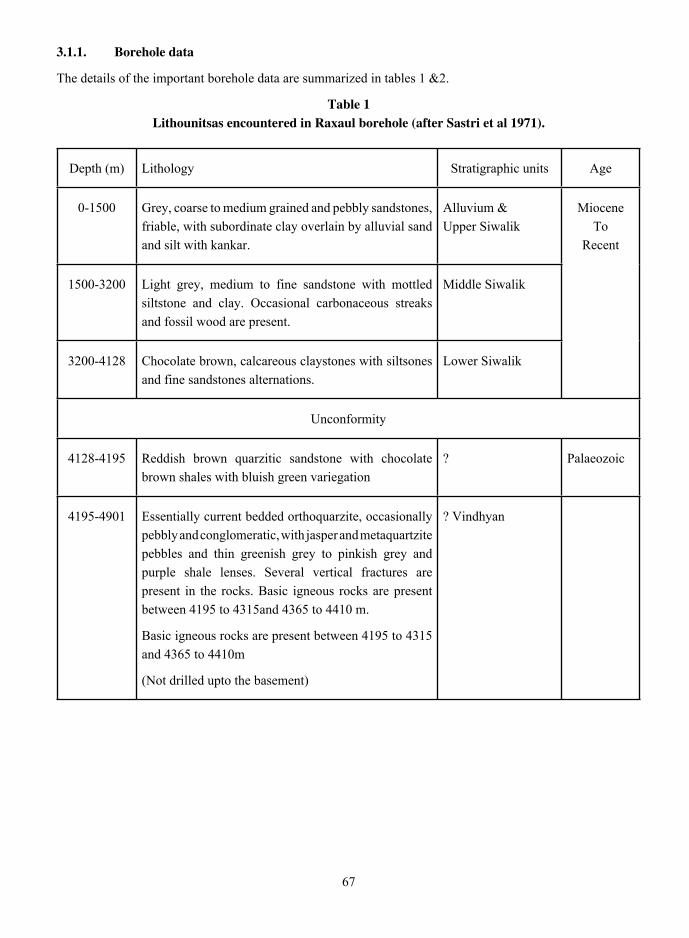
67
3.1.1. Borehole data
The details of the important borehole data are summarized in tables 1 &2.
table 1 lithounitsas encountered in raxaul borehole (after Sastri et al 1971).
Depth (m) Lithology Stratigraphic units Age
0-1500 Grey, coarse to medium grained and pebbly sandstones, friable, with subordinate clay overlain by alluvial sand and silt with kankar.
Alluvium & Upper Siwalik
Miocene To
Recent
1500-3200 Light grey, medium to fine sandstone with mottled siltstone and clay. Occasional carbonaceous streaks and fossil wood are present.
Middle Siwalik
3200-4128 Chocolate brown, calcareous claystones with siltsones and fine sandstones alternations.
Lower Siwalik
Unconformity
4128-4195 Reddish brown quarzitic sandstone with chocolate brown shales with bluish green variegation
? Palaeozoic
4195-4901 Essentially current bedded orthoquarzite, occasionally pebbly and conglomeratic, with jasper and metaquartzite pebbles and thin greenish grey to pinkish grey and purple shale lenses. Several vertical fractures are present in the rocks. Basic igneous rocks are present between 4195 to 4315and 4365 to 4410 m.
Basic igneous rocks are present between 4195 to 4315 and 4365 to 4410m
(Not drilled upto the basement)
? Vindhyan
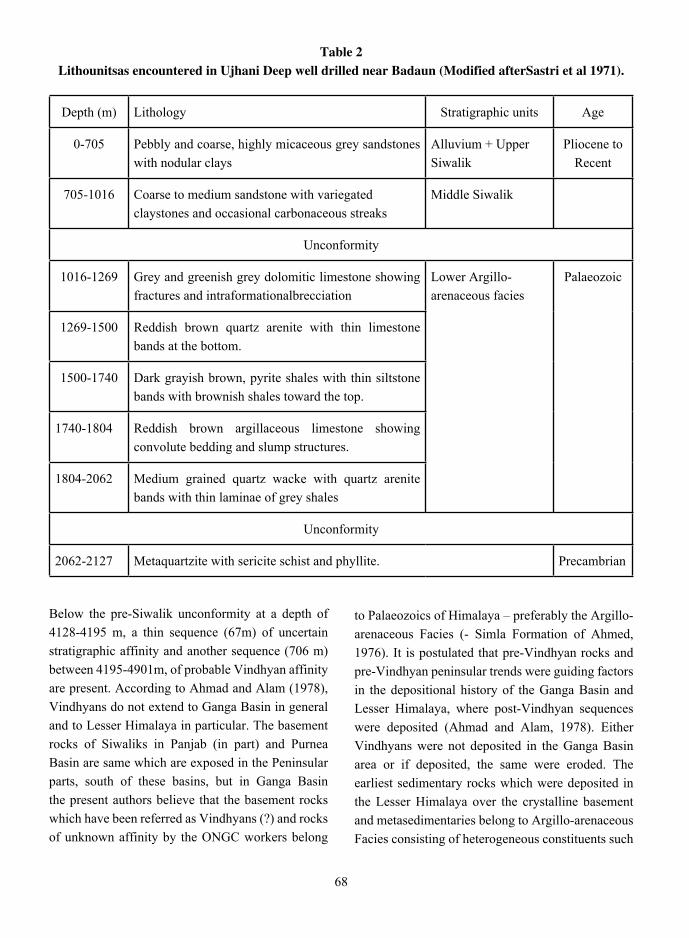
68
table 2 lithounitsas encountered in ujhani deep well drilled near Badaun (modified afterSastri et al 1971).
Depth (m) Lithology Stratigraphic units Age
0-705 Pebbly and coarse, highly micaceous grey sandstones with nodular clays
Alluvium + Upper Siwalik
Pliocene to Recent
705-1016 Coarse to medium sandstone with variegated claystones and occasional carbonaceous streaks
Middle Siwalik
Unconformity
1016-1269 Grey and greenish grey dolomitic limestone showing fractures and intraformationalbrecciation
Lower Argillo-arenaceous facies
Palaeozoic
1269-1500 Reddish brown quartz arenite with thin limestone bands at the bottom.
1500-1740 Dark grayish brown, pyrite shales with thin siltstone bands with brownish shales toward the top.
1740-1804 Reddish brown argillaceous limestone showing convolute bedding and slump structures.
1804-2062 Medium grained quartz wacke with quartz arenite bands with thin laminae of grey shales
Unconformity
2062-2127 Metaquartzite with sericite schist and phyllite. Precambrian
Below the pre-Siwalik unconformity at a depth of 4128-4195 m, a thin sequence (67m) of uncertain stratigraphic affinity and another sequence (706 m) between 4195-4901m, of probable Vindhyan affinity are present. According to Ahmad and Alam (1978), Vindhyans do not extend to Ganga Basin in general and to Lesser Himalaya in particular. The basement rocks of Siwaliks in Panjab (in part) and Purnea Basin are same which are exposed in the Peninsular parts, south of these basins, but in Ganga Basin the present authors believe that the basement rocks which have been referred as Vindhyans (?) and rocks of unknown affinity by the ONGC workers belong
to Palaeozoics of Himalaya – preferably the Argillo-arenaceous Facies (- Simla Formation of Ahmed, 1976). It is postulated that pre-Vindhyan rocks and pre-Vindhyan peninsular trends were guiding factors in the depositional history of the Ganga Basin and Lesser Himalaya, where post-Vindhyan sequences were deposited (Ahmad and Alam, 1978). Either Vindhyans were not deposited in the Ganga Basin area or if deposited, the same were eroded. The earliest sedimentary rocks which were deposited in the Lesser Himalaya over the crystalline basement and metasedimentaries belong to Argillo-arenaceous Facies consisting of heterogeneous constituents such
69
as quartzite, slate, phyllite and carbonate rocks, depicting shallow platform to shelf deposits. Broad lithological similarities in the sequences of the two sides, Peninsular and Extra-Peninsular India have often stimulated the workers to correlate the Vindhyans and pre-Vindhyans with those of the Lesser Himalayan sequences.
The palaeocurrent data, lithological and mineral assemblage may throw light on the history of sedimentation in the Ganga Basin – whether the sedimentation took place from the rising Himalayan Mountains or from the south – the Peninsular India.
The deposition of gradually younger sequences from Lesser Himalaya on to the Peninsular edge from Late Palaeozoic to Late Tertiary times indicates a progressive migration of the shore line from north to south. Moreover, the tectonic evolution and history of sedimentation of Ganga Basin can neither be totally separated from the northern edge of the Indian Peninsular nor can it be separated from the Himalaya.
Ahmad and Alam (1978) suggest that the northern syneclise (extending from Peninsular edge to Lesser Himalaya) was formed after the Vindhyans were laid down in the VindhyanSyneclise, in Peninsular part of India. In the early stages of the northern syneclise the shore line of Himalayan sea was perhaps upto Ganga Basin. The association of purple, pink, current bedded quartzite, slates and shales with brecciated pink limestone and anhydrite/gypsum streaks encountered in boreholes indicates a stable to unstable platform deposition which also confirms the initial deposition in shallow to very shallow water conditions.
Ahmed and Alam (1978) opined that the pre-Siwalik subsurface rocks of the Ganga Basin join in the north with the Lesser Himalayan Argillo-arenaceous Facies. Due to considerably greater rate of subsidence in the north and also for other reasons, the sea water perhaps receded from the Ganga Basin regions and this part became dry and thus non-deposition of any sediments except Siwaliks is represented by
60 m thick conglomerate encountered in the Ujhani structural well-1 depicting a hiatus for the greater part of Palaeozoic, the entire Mesozoic and Palaeogene, in the marginal parts of this great syneclise.
The aeromagnetic survey (Agocs, 1957) and later drilling by the ONGC have proved that the thickness of sub-surface sequences gradually and constantly increasesnorthwards till it reaches about 6000 m near the frontal folded zone of the Himalaya. The trend of increasing thickness northwards continues beyond the Ganga Basin into the Lesser Himalaya. Thus the Indo-Gangetic Basin continues into the Lesser Himalaya or in other words, it is an integrate part of the Himalayan Basin.
Results of geophysical surveys (Sengupta, 1962, and Mool Chand et al., 1964) have indicated NW-SE basement contours which are in general conformity with the Himalayan trends. The aeromagnetic survey (Agocs, 1957) has indicted basement depths from 1515 m to 9090 m. Below Siwaliks, the unconformity occurs at shallow depths, in the southern part of the Ganga Basin and it slopes gently northwards till it becomes deeper as the foot hills are approached. While the Siwalik rocks dip gently, the rocks below the unconformity show folding and faulting as revealed by the geophysical survey.
Lithologically, the Gandak sub-basin is dominantly shaly, brown and grey coloured, with some limestone and marl in the lower part at Gandak (A.C. Mahajan, 1985, unpublished, quoted by Raiverman, 2002). Hystrichospherid flora in Gandak indicates a shallow marine environment. Electrologs indicate high salinity in Gandak well while in Raxaul well the lower half is saline.
The sandstones of Ujhani well, grades from ferruginous protoquarzite at base to white colouredorthoquarzite towards top (Srivastava, 1961). This compares well with similar features in the outcropping Subathu Formation (Late Paleocene – Mid. Eocene) of marine origin. The early Tertiary palynoflora from this horizon in Ujhani well has been reported (Lukose and Ghosh, 1961). Puranpur well has yielded a 9 m
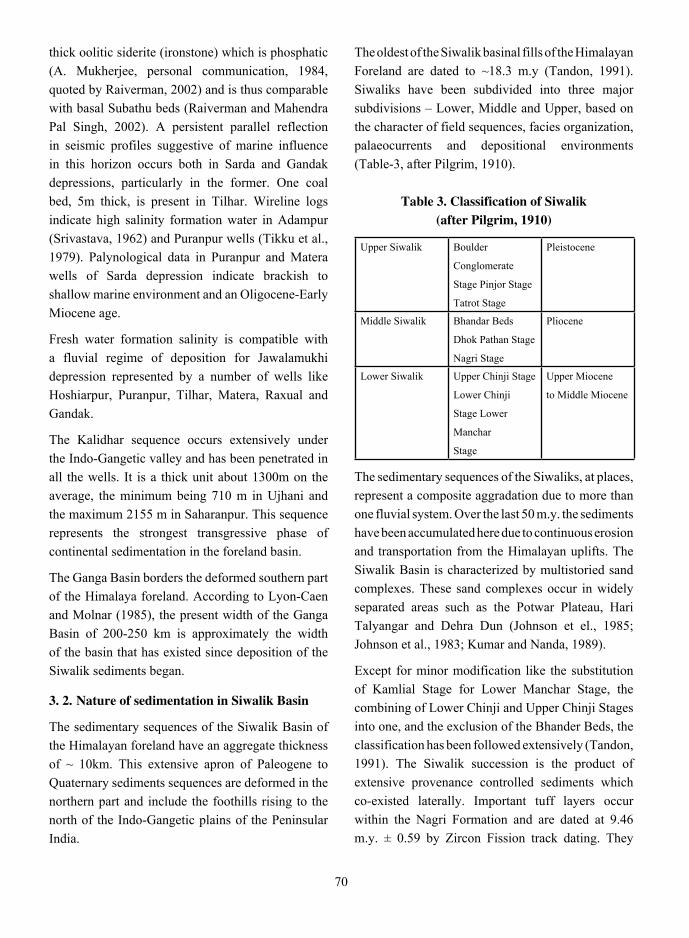
70
thick oolitic siderite (ironstone) which is phosphatic (A. Mukherjee, personal communication, 1984, quoted by Raiverman, 2002) and is thus comparable with basal Subathu beds (Raiverman and Mahendra Pal Singh, 2002). A persistent parallel reflection in seismic profiles suggestive of marine influence in this horizon occurs both in Sarda and Gandak depressions, particularly in the former. One coal bed, 5m thick, is present in Tilhar. Wireline logs indicate high salinity formation water in Adampur (Srivastava, 1962) and Puranpur wells (Tikku et al., 1979). Palynological data in Puranpur and Matera wells of Sarda depression indicate brackish to shallow marine environment and an Oligocene-Early Miocene age.
Fresh water formation salinity is compatible with a fluvial regime of deposition for Jawalamukhi depression represented by a number of wells like Hoshiarpur, Puranpur, Tilhar, Matera, Raxual and Gandak.
The Kalidhar sequence occurs extensively under the Indo-Gangetic valley and has been penetrated in all the wells. It is a thick unit about 1300m on the average, the minimum being 710 m in Ujhani and the maximum 2155 m in Saharanpur. This sequence represents the strongest transgressive phase of continental sedimentation in the foreland basin.
The Ganga Basin borders the deformed southern part of the Himalaya foreland. According to Lyon-Caen and Molnar (1985), the present width of the Ganga Basin of 200-250 km is approximately the width of the basin that has existed since deposition of the Siwalik sediments began.
3. 2. nature of sedimentation in Siwalik Basin
The sedimentary sequences of the Siwalik Basin of the Himalayan foreland have an aggregate thickness of ~ 10km. This extensive apron of Paleogene to Quaternary sediments sequences are deformed in the northern part and include the foothills rising to the north of the Indo-Gangetic plains of the Peninsular India.
The oldest of the Siwalik basinal fills of the Himalayan Foreland are dated to ~18.3 m.y (Tandon, 1991). Siwaliks have been subdivided into three major subdivisions – Lower, Middle and Upper, based on the character of field sequences, facies organization, palaeocurrents and depositional environments (Table-3, after Pilgrim, 1910).
table 3. classification of Siwalik (after pilgrim, 1910)
Upper Siwalik Boulder
Conglomerate
Stage Pinjor Stage
Tatrot Stage
Pleistocene
Middle Siwalik Bhandar Beds
Dhok Pathan Stage
Nagri Stage
Pliocene
Lower Siwalik Upper Chinji Stage
Lower Chinji
Stage Lower
Manchar
Stage
Upper Miocene
to Middle Miocene
The sedimentary sequences of the Siwaliks, at places, represent a composite aggradation due to more than one fluvial system. Over the last 50 m.y. the sediments have been accumulated here due to continuous erosion and transportation from the Himalayan uplifts. The Siwalik Basin is characterized by multistoried sand complexes. These sand complexes occur in widely separated areas such as the Potwar Plateau, Hari Talyangar and Dehra Dun (Johnson et el., 1985; Johnson et al., 1983; Kumar and Nanda, 1989).
Except for minor modification like the substitution of Kamlial Stage for Lower Manchar Stage, the combining of Lower Chinji and Upper Chinji Stages into one, and the exclusion of the Bhander Beds, the classification has been followed extensively (Tandon, 1991). The Siwalik succession is the product of extensive provenance controlled sediments which co-existed laterally. Important tuff layers occur within the Nagri Formation and are dated at 9.46 m.y. ± 0.59 by Zircon Fission track dating. They
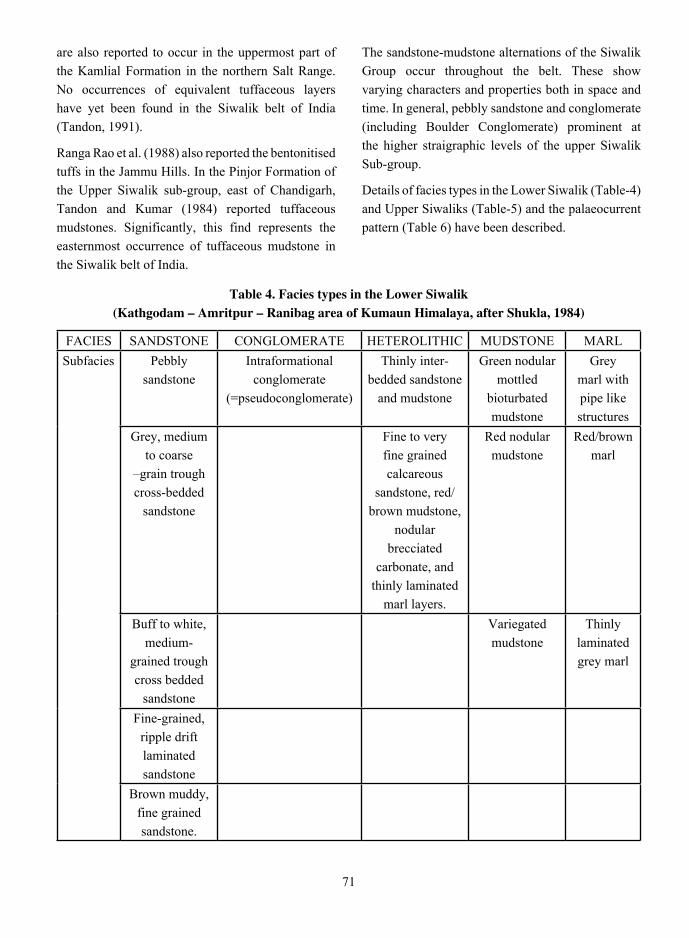
71
are also reported to occur in the uppermost part of the Kamlial Formation in the northern Salt Range. No occurrences of equivalent tuffaceous layers have yet been found in the Siwalik belt of India (Tandon, 1991).
Ranga Rao et al. (1988) also reported the bentonitised tuffs in the Jammu Hills. In the Pinjor Formation of the Upper Siwalik sub-group, east of Chandigarh, Tandon and Kumar (1984) reported tuffaceous mudstones. Significantly, this find represents the easternmost occurrence of tuffaceous mudstone in the Siwalik belt of India.
The sandstone-mudstone alternations of the Siwalik Group occur throughout the belt. These show varying characters and properties both in space and time. In general, pebbly sandstone and conglomerate (including Boulder Conglomerate) prominent at the higher straigraphic levels of the upper Siwalik Sub-group.
Details of facies types in the Lower Siwalik (Table-4) and Upper Siwaliks (Table-5) and the palaeocurrent pattern (Table 6) have been described.
table 4. facies types in the lower Siwalik (Kathgodam – amritpur – ranibag area of Kumaun himalaya, after Shukla, 1984)
FACIES SANDSTONE CONGLOMERATE HETEROLITHIC MUDSTONE MARLSubfacies Pebbly
sandstoneIntraformational
conglomerate (=pseudoconglomerate)
Thinly inter-bedded sandstone
and mudstone
Green nodular mottled
bioturbated mudstone
Grey marl with pipe like structures
Grey, medium to coarse
–grain trough cross-bedded
sandstone
Fine to very fine grained calcareous
sandstone, red/brown mudstone,
nodular brecciated
carbonate, and thinly laminated
marl layers.
Red nodular mudstone
Red/brown marl
Buff to white, medium-
grained trough cross bedded
sandstone
Variegated mudstone
Thinly laminated grey marl
Fine-grained, ripple drift laminated sandstone
Brown muddy, fine grained sandstone.
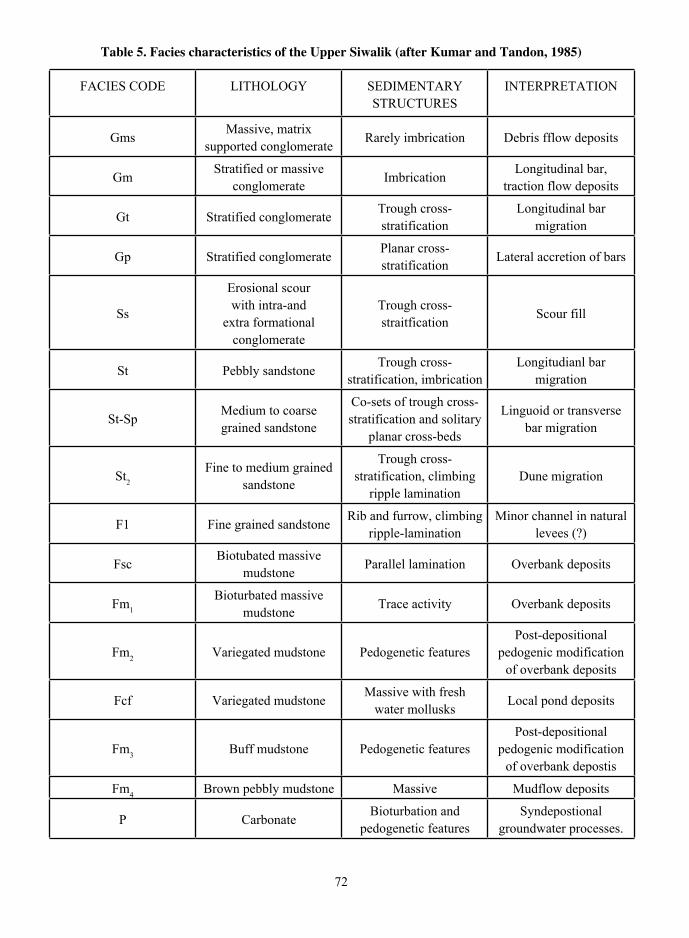
72
table 5. facies characteristics of the upper Siwalik (after Kumar and tandon, 1985)
FACIES CODE LITHOLOGY SEDIMENTARY STRUCTURES
INTERPRETATION
Gms Massive, matrix supported conglomerate Rarely imbrication Debris fflow deposits
Gm Stratified or massive conglomerate Imbrication Longitudinal bar,
traction flow deposits
Gt Stratified conglomerate Trough cross-stratification
Longitudinal bar migration
Gp Stratified conglomerate Planar cross-stratification Lateral accretion of bars
Ss
Erosional scour with intra-and
extra formational conglomerate
Trough cross-straitfication Scour fill
St Pebbly sandstone Trough cross-stratification, imbrication
Longitudianl bar migration
St-Sp Medium to coarse grained sandstone
Co-sets of trough cross-stratification and solitary
planar cross-beds
Linguoid or transverse bar migration
St2
Fine to medium grained sandstone
Trough cross-stratification, climbing
ripple laminationDune migration
F1 Fine grained sandstone Rib and furrow, climbing ripple-lamination
Minor channel in natural levees (?)
Fsc Biotubated massive mudstone Parallel lamination Overbank deposits
Fm1
Bioturbated massive mudstone Trace activity Overbank deposits
Fm2 Variegated mudstone Pedogenetic featuresPost-depositional
pedogenic modification of overbank deposits
Fcf Variegated mudstone Massive with fresh water mollusks Local pond deposits
Fm3 Buff mudstone Pedogenetic featuresPost-depositional
pedogenic modification of overbank depostis
Fm4 Brown pebbly mudstone Massive Mudflow deposits
P Carbonate Bioturbation and pedogenetic features
Syndepostional groundwater processes.
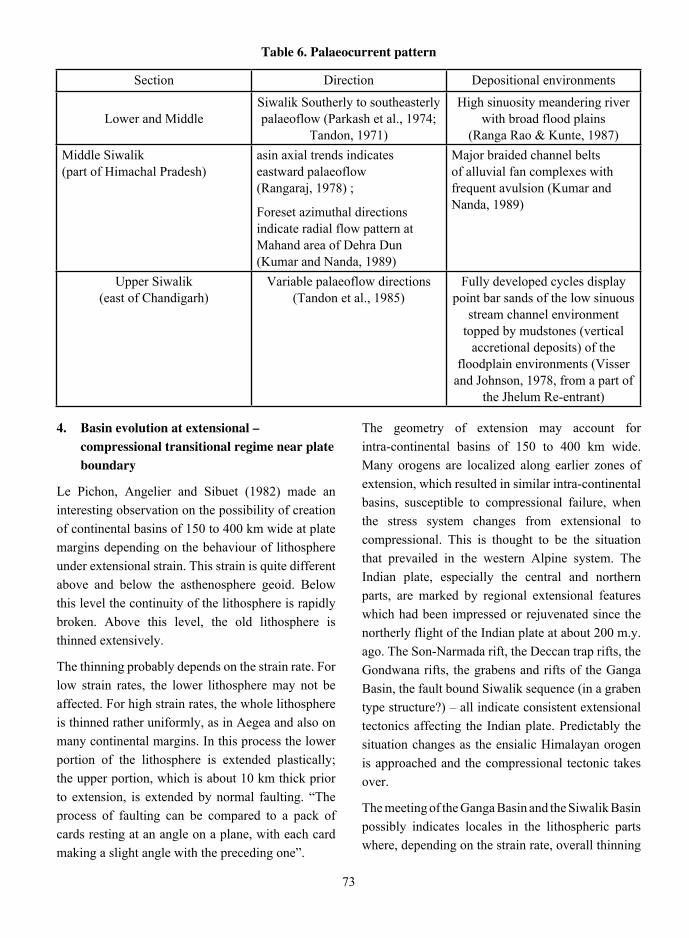
73
table 6. palaeocurrent pattern
Section Direction Depositional environments
Lower and MiddleSiwalik Southerly to southeasterly palaeoflow (Parkash et al., 1974;
Tandon, 1971)
High sinuosity meandering river with broad flood plains
(Ranga Rao & Kunte, 1987)Middle Siwalik (part of Himachal Pradesh)
asin axial trends indicates eastward palaeoflow (Rangaraj, 1978) ;
Foreset azimuthal directions indicate radial flow pattern at Mahand area of Dehra Dun (Kumar and Nanda, 1989)
Major braided channel belts of alluvial fan complexes with frequent avulsion (Kumar and Nanda, 1989)
Upper Siwalik (east of Chandigarh)
Variable palaeoflow directions (Tandon et al., 1985)
Fully developed cycles display point bar sands of the low sinuous
stream channel environment topped by mudstones (vertical
accretional deposits) of the floodplain environments (Visser
and Johnson, 1978, from a part of the Jhelum Re-entrant)
4. Basin evolution at extensional – compressional transitional regime near plate boundary
Le Pichon, Angelier and Sibuet (1982) made an interesting observation on the possibility of creation of continental basins of 150 to 400 km wide at plate margins depending on the behaviour of lithosphere under extensional strain. This strain is quite different above and below the asthenosphere geoid. Below this level the continuity of the lithosphere is rapidly broken. Above this level, the old lithosphere is thinned extensively.
The thinning probably depends on the strain rate. For low strain rates, the lower lithosphere may not be affected. For high strain rates, the whole lithosphere is thinned rather uniformly, as in Aegea and also on many continental margins. In this process the lower portion of the lithosphere is extended plastically; the upper portion, which is about 10 km thick prior to extension, is extended by normal faulting. “The process of faulting can be compared to a pack of cards resting at an angle on a plane, with each card making a slight angle with the preceding one”.
The geometry of extension may account for intra-continental basins of 150 to 400 km wide. Many orogens are localized along earlier zones of extension, which resulted in similar intra-continental basins, susceptible to compressional failure, when the stress system changes from extensional to compressional. This is thought to be the situation that prevailed in the western Alpine system. The Indian plate, especially the central and northern parts, are marked by regional extensional features which had been impressed or rejuvenated since the northerly flight of the Indian plate at about 200 m.y. ago. The Son-Narmada rift, the Deccan trap rifts, the Gondwana rifts, the grabens and rifts of the Ganga Basin, the fault bound Siwalik sequence (in a graben type structure?) – all indicate consistent extensional tectonics affecting the Indian plate. Predictably the situation changes as the ensialic Himalayan orogen is approached and the compressional tectonic takes over.
The meeting of the Ganga Basin and the Siwalik Basin possibly indicates locales in the lithospheric parts where, depending on the strain rate, overall thinning
74
of the lithosphere occurred. During this process the lower part of the lithosphere responded by ductile flow, whereas the upper 10 km part underwent brittle deformation. This resulted in extensive rift system, grabens and fault bound basins on the drifting Indian plate.
A new dimension to the geotectonic model connecting the basement of the Ganga Basin and Siwalik Basin has emerged through the microearthquake study throughout the Himalaya including the frontal part of the mountain range (Kayal, 2001). The study indicates that a ‘plane of detachment’ occurs in the crustal part of the Indian Shield and it extends from the basement underneath the IGA and Ganga Basin northwards below the Siwalik towards the Lesser Himalaya and ultimately passes below the High Himalaya and Tibetan Plateau as suggested by Seeber et. al. (1981) and Ni and Barazangi (1984). Following the plane of detachment model as deduced from microearthquake activity in India, its approximate position has been shown in the crustal part of the Indian Shield, in the down-buckled ‘foredeep’ until it passes below the Ganga Basin-Siwalik Basin interface region by the present authors (Fig. 2) . In this model the upper part of the~50 km thick Indian Continental Crust is under thrust type drag motion. Ganga Basin and Siwalik Basin, especially in the foredeep region, should be influenced by this detachment. The southern limit of the detachment is the HFT.
Seismic activity is closely related to the spatial position of the detachment. In the eastern Himalaya the earthquake occurs at a depth range of 0-50 km and majority of them occur below the detachment plane by thrust faulting. In the central part of the Himalaya, including Nepal, seismic activity is due to transverse tectonic features and the earthquake depths are clustered around 10-20 km depth close to the detachment plane. In western Himalaya the microearthquake hypocenters (depth 0-20 km) are confined above the plane of detachment.
It can, therefore, be concluded that the crustal plane of detachment is an active tectonic feature closely
related to microearthquake activity recorded from western to eastern Himalaya and this detachment extends below the IGA onto the Indian Shield. It is expected that hidden faults and thrusts within this crustal zone (0-50 km) are sources of seismicity. The fault zone suggested at the inferface of Ganga Basin and Siwalik Basin should be tectonically related to hidden faults in the crust and now represent supra-crustal discontinuity separating the two basins.
5. discussion and conclusion
The Ganga Basin and Siwalik Basin straddle across a unique geotectonic scenario which is controlled by juxtaposition of orogenic and anorogenic terranes. The entire tectonic regime is ensialic. Although the Ganga Basin and the Siwalik Basin are in near proximity now, the initiation, development and characteristics of each Basin are contrasting. The Ganga Basin originated and developed on the rugged topography of the crustal basement in the Indian Shield. Its history of development commenced since the disintegration of the Gondwanaland and northward drift of the Indian Plate. In contrast the Siwalik Basin was initiated in a narrow and shallow trough at the foot of the rising Himalaya and this shallow basin extended for about 2500 km, part of which below the Ganga Basin. The tectonic situation at the junction region of the two Basins is expected to be influenced by the tensional regime of the northward moving Indian Plate and the compressional regime of the Himalayan orogen. It is to be remembered that the crucial probing zone is now covered by the blanket of Indo-Gangetic Alluvium (IGA).
The main conclusions drawn from the present observations are as follows:
a) The junction between the Ganga Basin and the Siwalik Basin is a steeply dipping fault zone, separating a northward compressional terrane from a southern dilational terrane.
b) The provenances of sedimentation in the two basins are not identical. The rising Himalaya provided eroded materials in the Siwalik Basin as molasses whereas the Vindhyan Shield
75
area provided terrigenous sediments and tuff-volcanogenic materials for the Ganga Basin intermixed with marine intercalations.
c) A continuity of sedimentation across the interface occurred in the late Palaeogene-Neogene times.
d) The plane of detachment in the crust (including foredeep of the shield) implies tectonic activity from HFT northward across the basin interface zone and onto the Himalayan orogen. Steep dipping faults at the interface could be influenced in its alignments due to this activity of the detachment plane.
e) Sedimentation and structural framework of the Ganga Basin should reflect control of drag effect of the plane of detachment which extends from the Indian Shield to the heart of the Himalayan orogen.
Some outstanding geological problems that need further reseach:
The Ganga Basin should be visualized as a multi-sequential basin with sequential events as it developed on the northern part of the drifting Indian Plate since 200 Ma and ultimately came in conjunction with Siwalik Basin (Himalayan Tectonic Regime) in Tertiary. In this background the geological problems which need further work for solution are as follows:
i) geotectonic situation
Geophysical data, so far available suggest an uneven configuration of ‘basement’ over which the rock sequences (including Tertiary rocks) of the Ganga Basin were deposited. The structural framework is characterized by depressions and intervening fault bound horsts. The arrangement of sediments, under the IGA, in the Ganga Basin suggests northward sloping ‘basement’ with greater depth in the northern part than in the southern part of the graben-like depressions.
A major unanswered question is: Is the northern part of the Indian shield a ‘foredeep’ or a ‘rift zone’? This question is still awaiting a logical answer since Oldham (1917) critically reviewed the situation.
A significant advance in the basement structure in the Indian Shield, particularly under the Himalaya and adjoining IGA, was made through the application of micro-earthquake studies (Kayal, 2001).
The conception of ‘plane of detachment’ in the basement crustal region and continuous gliding movement along this ‘detachment’ indicate that existing tectonic models inferred so far in the vicinity of the Indian Shield - Himalayan Orogen should be critically reviewed.If necessary, a new model should be attempted to build.
ii) Sedimentation and stratigraphy
Subsurface geology below the thick blanket of the IGA had been attempted to study from limited bore-hole data. In most of them the ‘basement’ had not been reached.
It is necessary to examine if any indication of marine sedimentation is available along with terrestrial deposits. Further the age of the episodes of sedimentation need to be determined. Facies changes along this extensive basin should be critically examined and recorded.The analysis of the existing data invites attention for further investigation in this Indo-Gangetic depression covered by the thick Cenozoic sediments for any hydrocarbon potentiality of this vast alluvial cover of the Gangetic alluvial plain.
acknowledgements
Infrastructural facilities provided by the Head, Department of Geology, University of Calcutta are gratefully acknowledged
references
Action, G.D., 1999. Apparent polar wander of India since the Cretaceous and Implication for regional tectonics and true polar wander. In: Radhakrishna, T. and Piper J.D.A. (Eds): The Indian sub-continent and Gondwana. Memoir 44, Geol. Soc. Ind., Bangalore, 129-175.

76
Aditya, S., Raju, A.T.R., and Shukla, S.M., 1976. Assessment of hydrocarbon prospects of the sub-Himalayan, Punjab and Ganga Basin, India. Geol. Surv. Ind., Misc. Pub. No. 41, Section III, Himalayan Geology Seminar, New Delhi. P. 127-140.
Agocs, W.B., 1957. Airborne Magnetometer Survey. 1. Indo-Gangetic plain. 2. Rajasthan. Report sumitted to Government of India.
Ahmad, A., 1976. Facies concept, correlation and classification of Palaeozoic (Pre-Blaini) Formations of Kumaun, Garhwal and Himachal Pradesh Lesser Himalaya, India, Section I, Himalayan Geology Seminar, New Delhi.
Ahmad, A., and Alam, J.M., 1978. The Ganga Basin, its subsurface sequences, their affinity, sedimentological and tectonic implications. Himalayan Geology, 8, 583-608.
Burrard, S.G., 1912. Origin of the Himalaya Mountains, Survey of India. Professional Paper No. 12, Calcutta.
Fisher, R.L., Sclater, J.G., and Mckenzie, D.P., 1971. The evolution of the Central Indian Ridge, Western Indian Ocean. Bull,Geoll. Soc. America, 82, 553-562.
Fuloria, R.C., 1969. Geological framework of Ganga Basin. Selected Lectures on Petroleum Exploration, Institute of Petroleum Exploration, Oil and Natural Gas Commission (1), 170-186.
Gangopadhyay, P.K. 1995. Intrafolial folds and associated structures in a progressive strain environment of Darjeeling-Sikkim Himalaya. Proc. Ind. Sci. (Earth Planet Sci.), 104 (3), 327-347.
Gansser, A., 1964. Geology of the Himalayas. Interscience Publication, London, 289 pp.
Gupta, H.K., Divakava, Rao, V., and Singh, J. 1982. Continental collision tectonics: evidence from the Himalaya and the neighbouring regions. Tectonophysics, 81, 213-238.
Holmes, A., 1965. Principles of physical geology. 2nd edition, ELBS and Nelson.
Holmes, A., 1992. Holmes’ Principles of Physical Geology (Ed: M. McL. D. Duff), 4th Edition, Chapman and Hall., London, 791p.
Jacobs, J.A., Russell, R.D. and Wilson, J.T., 1974. Physics and geology. 2nd Ed. McGraw Hill, N.Y.
Johnson, N.M., Stix,J., Tauxe, L., Cerveny, P.I., and Tahirkheli, R.A.K., 1985. Palaeomagnetic Chronology, fluvial processes, and tectonic implications of the Siwalik deposits near Chinji village, Pakistan. Journal of Geology, 93, 27-40.
Johnson, G.D., Opdyke, N.M., Tandon, S.K., and Nanda, A.C., 1983. The magnetic polarity stratigraphy of the Siwalik Group as Haritalyangar (India) and a newlast appearance datum for Ramapithecus and Sivapithecus in Asia. Palaeoecology, 37, 17-42.
Kayal, J.R., 2001. Microearthquake activity in some parts of the Himalaya and thetectonic model. Tectonophysics, 339, 331-351.
Kumar, R. and Nanda. A.C., 1989. Sedimentology of the Middle Siwalik Sub_group of Mohand area, Dehra-dun Valley, India. Journal of Geological Society of India. 34, 597-616.
Kumar, R., and Tandon, S.K., 1985. Sedimentology of Plio-Pleistocene late orogenic deposits associated with intraplate subduction – The Upper Siwalik Subgroup of a part of Panjab sub-Himalaya, India. Sedimentary Geology, 42, 105-158.
Le Fort, P., 1975. Himalayas: the collided range, present knowledge of the continental arc. Amer. Jour. Sci., 275-A, 1-44.
Le Pichon, X., Angelier, J., and Sibuet, Jean-Claude, 1982.Plate boundaries and extensional tectonics. Tectonophysics, 81, 239-256.
77
Le Pichon, X., Francheteau, J., and Bonin, J., 1973. Plate tectonics. Amsterdam, Elsevier, 300p.
Le Pichon, X., and Heirtzler, J.R., 1968. Magnetic anomalies in the Indian Ocean and seafloorspreading.Jour. Geophy. Research, 73, 2101-2117.
Mahadevan, T.M., 1994. Deep continental structure of India. Memoir 28, Geological Society of India, Bangalore.
McKenzie, D.P., andSclater, J. G., 1973. The evolution of the Indian Ocean since the late Cretaceous. Royal Astron. Soc. Geophy. Jour., 24, 437-528.
Molnar, P., 1988. Continental tectonics in the aftermath of plate tectonics. Nature, 335, 131-137.
Mool Chand, Datta, A.N., Chellam, R.S., Ghosh, A.P., Awasthi, A.M., Awasthi, D.N., and Garg, V.C., 1964. Seismic surveys in Western Uttar Pradesh, Proceeding section 2, Geological results of Applied Geophysics, 22nd International Geological Congress, New Delhi, 260- 276.
Ni, J., and Barazangi, M., 1984. Seismotectonics of the Himalayan collision, geometry of the underthrusting Indian plate beneath the Himalaya. Jour. Geophys. Res., 89, 1147-1163.
Oldham, R.D., 1917. The structure of Himalayas and the Gangetic Plain as elucidated by geodetic observations in India. Memoir Geological Survey of India. 42, 1-153.
Pilgrim, G.E., 1910. Preliminary note on a revised classification of the Tertiary freshwater deposits ofIndia. RecordsGeologicalSurvey of India. 40, 185-188.
Parkash, B., Bajpai, I.P., and Saxena, H.P., 1974. Sedimentary structures and palaeocurrents of the Siwaliks exposed between Yamuna and Gola rivers., U.P. (India). Geological Magazine., 111.
Raiverman, V., Kunte, S.V., and Mukherjee, A. 1983. Basin geometry, Cenozoic sedimentation and hydrocarbon prospects in northwestern Himalaya and Indo-Gangetic Plains. Petroleum Asia Journal, 67-92.
Raiverman, V., 2002. Foreland sedimentation in Himalayan Tectonic Region: a Relook at the OrogenicProcess. Bishen Singh Mahendra Pal Singh,Dehra Dun. India. 378 pp
Rangaraj, S., Stratigraphy and sedimentology of the Siwalik molasses in a part of Panjab Sub-Himalaya, Unpublished Ph.D Thesis, University of Delhi, 208p.
Ranga Rao, A., Agarwal, R.P., Sharma, U.N., Bhalla, M.S., and Nanda, A.C., 1988. Magnetic polarity stratigraphy and vertebrate paalaeontology of the Upper Siwalik Sub-group of Jammu Hills, India. Journal of Geological Society of India, 31, 361-385.
Ranga Rao, A., and Kunte. S.V., 1987. Lower Siwalik of Jammu Hills: Processes of sedimentation. Proceedings National Seminar on Tertiary Orogeny, Varanasi, 361-377.
Sastri, V.V., Bhandari L.L., Raju A.T.R. and Dutta, A.K., 1971. Tectonic framework and subsurface stratigraphy of the Ganga basin. Journal of Geological Society of India. 12(3), 222-233.
Seeber, L., and Armbruster, J. G., 1981. Some elements of continental subduction along the Himalayan Front. Tectonophysics, 105, 263-278.
Sengupta, S.N., 1962. Basement configuration of the Indo-Gangetic Plains, shown by aeromagnetic surveys. Proceedings on Seminar on Oil Prospects in Ganga Valley, Technical Publication, 1, Oil and Gas Commission, India, 52-54.
Sengupta, S.N., 1964. Posible subsurface structures below the Himalayas and the Gangetic Plains. Proc. Int. Geol. Cong., Session 22nd, 334-352
78
Suess, E., 1906. The face of the earth. Clarendon Press, Oxford.Shukla, A., 1984. Palaeopedology of the overbank intervals of the Lower Siwalik Sub-group (Kathgodam-Amritpur section of Kumaun Himalaya, India), Unpublished M.Sc. dissertation, University of Delhi, 57 pp.
Tandon, S.K., 1971. Pebble and grain fabric analysis of the Siwalik sediments around Ramnagar, Kumaun Himalaya. Himalayan Geology, 1, 59-74.
Tandon, S.K., 1991. The Himalayan Foreland: focus on Siwali Basin. In : Tandon, S.K., Pant, C.C., and Casshyap, S.M. (Eds), ‘Sedimentary Basins of India : Tectonic Context. Gyanodaya Prakashan, Nainital, India, pp. 171-201
Tandon, S.K., and Kumar, R., 1984. Discovery of tuffaceous mudstones in the Pinjor Formation of Panjab Sub-Himalaya, India. Current Science, 53, 82-984.
Tandon, S.K., Kumar, R., and Singh, P., 1985. Syntectonic controls of palaeoflow reversals and variability : Sediment - vector sequences in the late orogenic fluvial Siwalik basin, Panjab sub_Himalaya, India. Sedimentary Geology, 41, 97-112.
Visser, C.F, and Johnson, G.D., 1978. Tectonic control of the Late Pliocene Molasse sedimentation in aportion of the Jhelum re-entrant, akistan. Geol. Rund., 67 : 15-37.
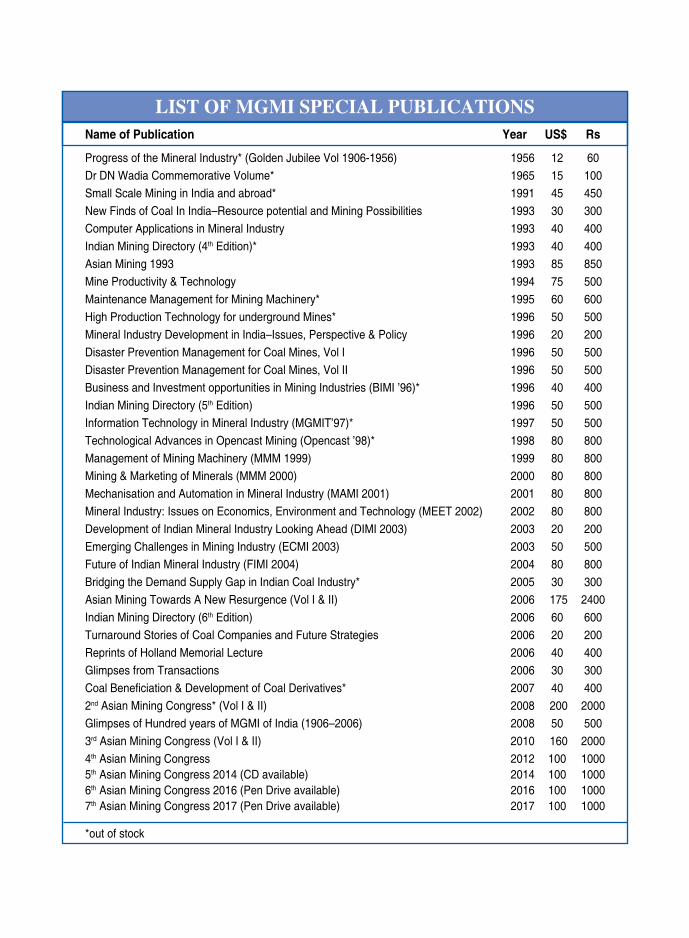
Name of Publication Year US$ Rs
Progress of the Mineral Industry* (golden Jubilee Vol 1906-1956) 1956 12 60Dr DN Wadia Commemorative Volume* 1965 15 100Small Scale Mining in India and abroad* 1991 45 450New Finds of Coal In India–Resource potential and Mining Possibilities 1993 30 300Computer Applications in Mineral Industry 1993 40 400Indian Mining Directory (4th Edition)* 1993 40 400Asian Mining 1993 1993 85 850Mine Productivity & Technology 1994 75 500Maintenance Management for Mining Machinery* 1995 60 600High Production Technology for underground Mines* 1996 50 500Mineral Industry Development in India–Issues, Perspective & Policy 1996 20 200Disaster Prevention Management for Coal Mines, Vol I 1996 50 500Disaster Prevention Management for Coal Mines, Vol II 1996 50 500Business and Investment opportunities in Mining Industries (BIMI ’96)* 1996 40 400Indian Mining Directory (5th Edition) 1996 50 500Information Technology in Mineral Industry (MgMIT’97)* 1997 50 500Technological Advances in Opencast Mining (Opencast ’98)* 1998 80 800Management of Mining Machinery (MMM 1999) 1999 80 800Mining & Marketing of Minerals (MMM 2000) 2000 80 800Mechanisation and Automation in Mineral Industry (MAMI 2001) 2001 80 800Mineral Industry: Issues on Economics, Environment and Technology (MEET 2002) 2002 80 800Development of Indian Mineral Industry Looking Ahead (DIMI 2003) 2003 20 200Emerging Challenges in Mining Industry (ECMI 2003) 2003 50 500Future of Indian Mineral Industry (FIMI 2004) 2004 80 800Bridging the Demand Supply gap in Indian Coal Industry* 2005 30 300Asian Mining Towards A New Resurgence (Vol I & II) 2006 175 2400Indian Mining Directory (6th Edition) 2006 60 600Turnaround Stories of Coal Companies and Future Strategies 2006 20 200Reprints of Holland Memorial Lecture 2006 40 400glimpses from Transactions 2006 30 300Coal Beneficiation & Development of Coal Derivatives* 2007 40 4002nd Asian Mining Congress* (Vol I & II) 2008 200 2000glimpses of Hundred years of MgMI of India (1906–2006) 2008 50 5003rd Asian Mining Congress (Vol I & II) 2010 160 20004th Asian Mining Congress 2012 100 1000 5th Asian Mining Congress 2014 (CD available) 2014 100 10006th Asian Mining Congress 2016 (Pen Drive available) 2016 100 1000 7th Asian Mining Congress 2017 (Pen Drive available) 2017 100 1000
*out of stock
LIST OF MGMI SPECIAL PUBLICATIONS
MGMI TrANSIT HOUSE
Published by : Honorary Secretary, The Mining, Geological and Metallurgical Institute of India GN-38/4, Sector V, Salt Lake, Kolkata 700 091 Phone : (033) 2357 3482 / 3987, Telefax : 2357 3482 E-mail : [email protected], [email protected], Web : www.mgmiindia.in
Printed at : Graphique International, Kolkata - 700 015, Phone : (033) 2251 1407