powerpoint presentationjura.wi.mit.edu/bio/education/big_meeting/big_meeting2016_oct.pdf · using...
TRANSCRIPT

ECCB 2016 (eccb2016.org)

• Workshops:
– Using existing datasets to gain novel scientific insights
– Computational challenges of 3rd generation DNA sequencing data analysis
• Keynote/Talks/Posters
2

Dumpster Diving (S.Mangul, UCLA)
• Primarily for RNASeq, can be extended to other seq • Unmapped reads go to trash
On average, ~10-15%
• Read Origin Protocol (ROP) of unmapped reads • ROP outline
QC (excl. low quality, low complexity and rRNA) using FastQC and SeqClean Identify: “lost” human reads based on mismatches and short gaps (MegaBlast) and categorize (eg. UTR,
CDS, etc.) repeat sequences (RepeatMasker lib, MegaBlast) non-co-linear (NCL) RNAs: circRNAs, gene fusions, trans-splicing (ncSplice, Bowtie2 and CIRI) for
distant elements V(D)J recombinations (IgBLAST) Profile microbial/viral reads (MegaBlast, MetaPhlAln)
• Test on RNASeq from 86 individuals (53 asthmatics and 33 control); ~84% mapped with TopHat2
• Run unmapped reads using ROP: 8.4% (low quality/complexity, reads mapping to rRNA), 6.1% ‘lost’ human reads (25% had <=2 edit distance), 0.1% NCL RNAs, 0.01% to B/T CR, 0.3% microbial 14.9% reads accounted
• Asthmatic individuals had decreased T/B – cell receptor diversity 3 https://sergheimangul.wordpress.com/rop/

Recycling gene expression data to better understand what genetic variants affect gene expression
(P.Deelen, UMC Groningen, NL)
• Using public RNASeq data to investigate eQTL and ASE • ~9000 samples downloaded from ENA(filters: human, RNASeq, transcriptome,
readcount >= 500k): – Geuvadis samples, cell lines, primary tissues,…
• STAR; correct for mapping bias using hg19 and mask SNPs with a MAF >= 1% in the Genome of The Netherlands (GoNL, nlgenome.nl); use only unique mapping; variable number of mismatches (> 90 bases: 4 mismatches; 60-90: 3 mismatches; < 60: 2 mismatches); excl small/miRNAs. Keep samples with at least 60% uniquely mapping reads
• HTSeq Count to quantify gene-expression and quantile normalize + log2, use PCA to identify possible outliers (~500 samples) ~1300 samples
• Batch effect “limited”, PCA showed same tissue from different sources • Genotyping using GATK, and imputation of genotype likelihoods using Beagle (exl
RNA-editing sites, variants near splice junctions and repeat regions) • Identify cis-eQTLs effect for ~8000 genes; and ASE for ~35 rare pathogenic variants
4
Workshop: Resources
• EBI
Expression Atlas (www.ebi.ac.uk/gxa/home)
European Nucleotide Archive (ENA) ~ SRA
European Genome-phenome Archive (EGA) ~ dbGaP
• Elexir (bio.tools)
Data resources infrastructure for life sciences
~BD2K
FAIR data
• Findable, Accessible, Interoperable, Reusable
5

What’s in a Squiggle? S.Reid (ONT)
6
What’s in a Squiggle? • MinION (2014), PromethION (2015), SmidgION (2016) => use with mobile devices • Data throughput = pores and speed • DNA movement ~250 b/s • Accuracy “adequate” (initial error rates ~35%; now ~5-10%) • No upper limit on read length
– 250k bases (internal record) – ~10-50kb routine, many users have reported ~100kb
• raw vs event, use events to infer bases • HMM basecalling (Metrichor) previously led to errors, moved to neural network to
improve basecalling – Properties of Squiggle: noise is meaningful to improve base calling
• Workflow: Signal => Read detect (raw Squiggle) => Event detect (event squiggle) => Segments => basecall (template strand) => 2D basecall (higher accuracy)
• Hairpin adapter ligated on opposite strand => template and complement strands to be sequenced consecutively => align the sequence to produce a high quality ‘consensus’ => 2D (two directional) sequence
• Improved error rate: 1D ~10-15%; 2D ~5-10% • Not just DNA: testing on modified bases and RNA
7 Poretools (poretools.readthedocs.org)

SMRT Seq D.Stucki (PacBio)
• Long read lengths (~10kb, ~50kb reported) and lower error rate • Error rate is not dependent on read length • Sequence single molecule in a “nanohole” - a zero-mode waveguide
(ZMW) to reduce background signal • Each SMRT cell contains thousands of ZMWs • Light is passed through each “chamber”, each nucl. Is labeled with a
different fluorophore used to detect • Current: SEQUEL system (contains 1M ZMWs, 7x before, improved
time and cost) • Application: Falcon (github.com/PacificBiosciences/FALCON)
– de novo assembly of (large) genomes (ha/di-ploid) – SV – transcriptome
8

3rd Generation Seq
• W.Kloosterman (UMC Utrecht) – Detect SVs (>50b)
• Manta for calling (using Illumina) => 6.6k • Sniffles and in-house (using ONT) => ~9k • ~3.4k common • Validation • Other tools: Lumpy, Parliament • Testing Blue Pippin (for enriching long reads)
• M.Loose (U Nottingham) – Use MinION to “select” specific region based on Squiggle pattern
• Individual molecules can be rejected on demand by reversing voltage across specific channel
– Recent use with Ebola outbreak – RT basecalling coming soon!
9
Epigenetic memory at single cell resolution A.Tanay (Weizmann Inst)
• Embryogensis
• Single-cell: RNA-Seq, RRBS-Seq, Hi-C Seq
• ESC add/remove vs somatic cells simply transmit epigenetic marks
• Somatic cells susceptible epimutations (gain/loss of methyl mark) which can add “noise”
10
Genome Wide Prediction of miRNA regulation of TFs (M.Ruffalo, CMU)
• Not much known about TFs regulate miRNAs
• Limited data to train
• Manually curated 266 ‘positive’ labels
• Semi-supervised ML algorithm
– Conservation, accessibility, motifs
11
http://cs.cmu.edu/mruffalo/tf-mirna/
Visualization of Large Macromolecular Structure
(R.Varekova, CEITEC) • PyMol, RasMol, tends to be ‘heavy’
• LiteMol easy to use HTML5 compatible
• Easily access data from PDBe
• Access cryo-EM data
12 http://webchemdev.ncbr.muni.cz/LiteMol/
XGSA: Cross-species gene set analysis (D.Djordjevic, UNSW Australia)
• Comparing gene sets across different organisms
• Simple 1-1 ortholog leads to FP, bias created by 1-to-many or no relationships
• XGSA takes into consideration all relationships
• Directly uses Ensembl/BioMart data
13 https://github.com/VCCRI/XGSA

TopAnat (F.Bastian, SIB)
• Discover which organs (ie. anatomy) genes from a set are preferentially expressed
• Enrichment analysis based on anatomical ontology (Uberon ontology)
• Bgee: normal expression from mulitple species
14
http://bgee.org/ http://bgee.org/?page=top_anat
Using SC transcriptomics to understand cellular heterogeneity
J.Marioni (EMBL-EBI, UK) • < 50 pg can lead to lower correlation between reps and
other technical issues • Model technical noise using spike-ins • Use BASiCS (cell-specific normalization, tech variability
is quantified based on spike-in genes, total variability is decomposed into tech/bio components)
• scRNA study: – spatial study of brain development in P.dumerilii
‘binarized’ in situ data • 83% of cells mapped back to < 150 voxels (very specific mapping!)
– Cell types E6.5 to E8.5 • Hierarchical clustering with dynamic tree cut revealed 10 robust
clusters
15
https://github.com/catavallejos/BASiCS CRAN: dynamicTreeCut

Tumor Genomes N.Lopez-Bigas (U Pompeu Fabra, Spain)
• Understanding mutation process finding drivers; precision med • Mutational rate correlates with chromatin features (eg. correlation
with accessibility ) • More mutation found in TFBS (melanomas) compared to flanking
region (TCGA data) • Nucleotide Excision Repair (NER) at TFBS, use excision-repair or XR-
Seq high mutation rate in TFBS caused by impaired accessibility • Finding drivers: signals of positive selection drivers?
Implemented in – OncodriverFM: identify bias towards accumulation of variants with
high functional impact – OncodriveCLUST: mutations accumulating in specific region
• In silico drug prescription – therapeutically actionable genomic alterations: Cancer Genome Interpreter (CGI)
16
bg.upf.edu/oncodrive-fm bg.upf.edu/oncodrive-cis cancergenomeinterpreter.org intogen.org (459 cancer driver genes)

Mutually Exclusive Mutations in Cancer
(M.Reyna, Brown U) • Hyper mutations cannot be used with Fisher’s
Exact test
• weighted exclusivity test (WExT): conditions on number of mutation/gene and per gene, per sample probabilities
17 https://github.com/raphael-group/wext/
Genomic HyperBrowser (U of Oslo, Norway)
• Built on Galaxy to integrate datasets
– Basic mode (pre-defined questions) vs Advanced
– Dataset collections: eg. spatial interaction and co-localization (Hi-C and ChIA-PET)
– Workflows
18 https://hyperbrowser.uio.no/gsuite

Chipster (E.Korpelainen, CSC Finland)
• GUI for analyzing NGS and microarray data
19 http://chipster.csc.fi/
PeakXus T.Hartonen
(U of Helsinki, Finland) • ChIP-exo or ChIP-nexus, use UMIs
• Better for allele-specific binding analysis, and SNP effect (esp in non-coding region)
• Calls peak based on UMIs
• IgG or input not possible to protocol; compare reads in peak vs outside peak
20 https://github.com/hartonen/PeakXus

Population Assisted Genome Inference B.Paten (UC Santa Cruz)
• Reference genome based on a single genome – not population!
• Each individual differs by ~4M SNVs
• Problems with ref: some genes are missing (eg.HLA); gives rise to ref allele bias
• Ref genome an impediment to personal genomics
• Goal: create a human ref to include known variation
• Existing variant annotation fragmented in many db
• Represent ref genome as a graph (genome graph) and not ‘phased chromosomes’
21

Human Genome Variation Map (HGVM) Pilot Project
22
• Create a reference that contains all known variants
• Genome Graph
http://news.ucsc.edu/2015/01/genome-variation.html

Genome Variation Graph • Each base is assigned a unique identifier
– Shifting assemblies are easier
• Each node represents a sequence
• Edges connect nodes on either side
• Paths: genomes, alignments, annotation (eg. transcripts)
• Testing using 1000 Genomes and Illumina Platinum Genomes – ~3% increase unique mapping
23 https://github.com/vgteam/vg http://www.illumina.com/platinumgenomes/
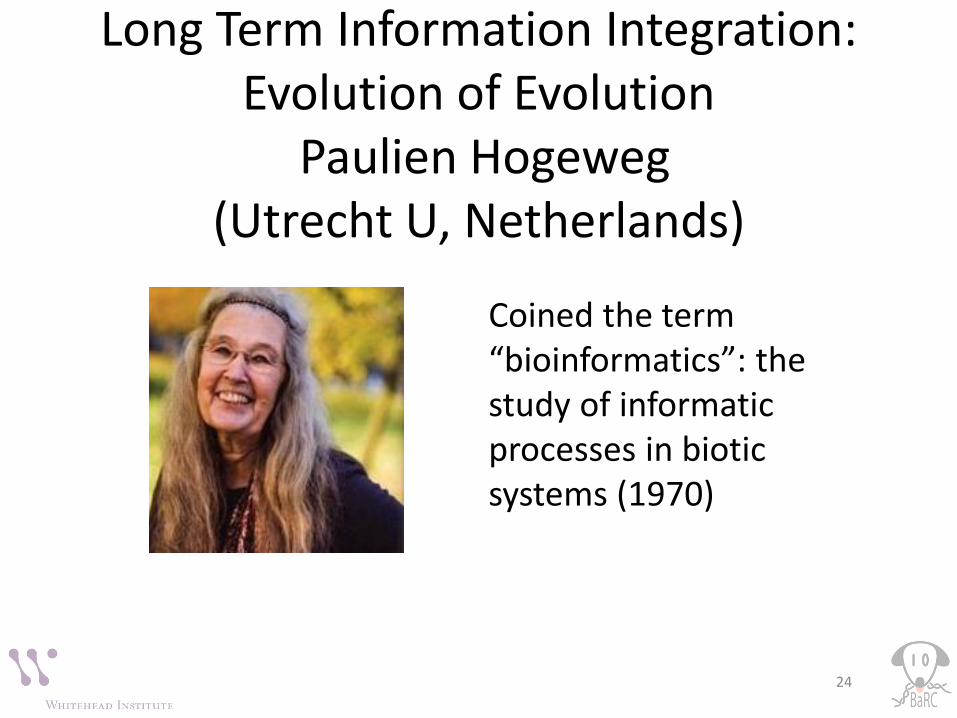
Long Term Information Integration: Evolution of Evolution
Paulien Hogeweg (Utrecht U, Netherlands)
24
Coined the term “bioinformatics”: the study of informatic processes in biotic systems (1970)

Evolution: Long Term Information Integration
• Living systems are information processing systems • Two pillars of bioinformatics: i) there’s revolution in
thought from (new) data, and ii) simple interactions can form complexity (counter-intuitive!)
• Evolutionary “gap” between mutations and phenotype • Few mutations are sufficient to gain fitness in a
population • Gene loss a major evolutionary process (eg. Metazoa
loss of homeobox genes) most often losses than gains – U-shaped mutational landscape: genome
expansion/inflation followed by gene loss in later evolving, more complex, species
25

Automated Filtering of MSA Worsens Phylogenetic Inference
C.Dessimoz (U College London, UK) • Automated methods: Gblocks, TrimA1,… (4
methods) • Rebuild tree for orthologs species tree
discordance test • Test in DNA/Protein in various families of fungi,
bacteria, eukaryotes similar results of poor agreement
• Automated filtering results in loss of resolution • Reported this to Ensembl (verified) • Modest amount of filtering will have little affect
26

Posters
• circRNA characterization from RNASeq: github.com/dieterich-lab/FUCHS
• Nucleosome dynamics for visualization and comparison of MNase-Seq mmb.irbbarcelona.org/NucleosomeDynamics/index.php
• ISB Cancer Genomics Cloud (CGC) isb-cgc.org
• DNA barcodes adapted to the Illumina platform, corrects for substitutions and phaseshifts (del of 1st base, or ins before 1st base) (BioC DNABarcodes) bioconductor.org/packages/release/bioc/html/DNABarcodes.html
• Identification of cancer cell lines (BioC Uniquorn) bioconductor.org/packages/devel/bioc/html/Uniquorn.html
• Disease enrichment analysis for gene sets based on literature cbdm-01.zdv.uni-mainz.de/~jfontain/cms/?page_id=605
27

Posters
• Correcting bias in epigenome- and transcriptome-wide association studies (EWAS/TWAS) bioconductor.org/packages/release/bioc/html/bacon.html
• Ribosome profiling to discover small ORFs (sORFs) sorfs.org
• Resources for alignment and analysis of ribo-seq data riboseq.org/
28