powerpoint presentation · • 400 speed humps • 25mph new speed limit • 50 speed cameras...
TRANSCRIPT

Safe Streets for Seniors
New York City
Ryan Russo, Deputy Commissioner, Transportation Planning and Management
New York City Department of Transportation – May 14, 2015
UCLA2015

• NYC population: 8.4 million (MSA 22.2 million)• Extensive 24/7 subway and bus networks • NYC traffic fatality rate: 3.0 per 100,000: Low among large US cities
• Over 50% are pedestrians: High among large US cities• Low car ownership; Everyone is a pedestrian; No Right Turn on Red
New York City: By the numbers

What is Vision Zero?
• Vision Zero goal: Protect the public, bring traffic fatalities to zero• Based on Swedish model• A shift in perception and values: Expect safe streets• Design facilities with zero fatalities as goal• Drive down fatalities and injuries, not necessarily crashes in total • Fatalities and injuries not “accidents”, “crashes” that are preventable
Shift to Safety Focus

Vision Zero in NYC• Led by City Hall• Prominent• Multi-Agency• Funded• Comprehensive
• Engineering• Enforcement• Education• Policy
• Year 1 Accomplishments: • Lowest year on record for pedestrian
fatalities
• 400 Speed Humps
• 25mph new speed limit
• 50 Speed Cameras Deployed
• 57 Safety Engineering Projects
• 126% increase in failure to yield summonses; 42% increase in speeding summonses
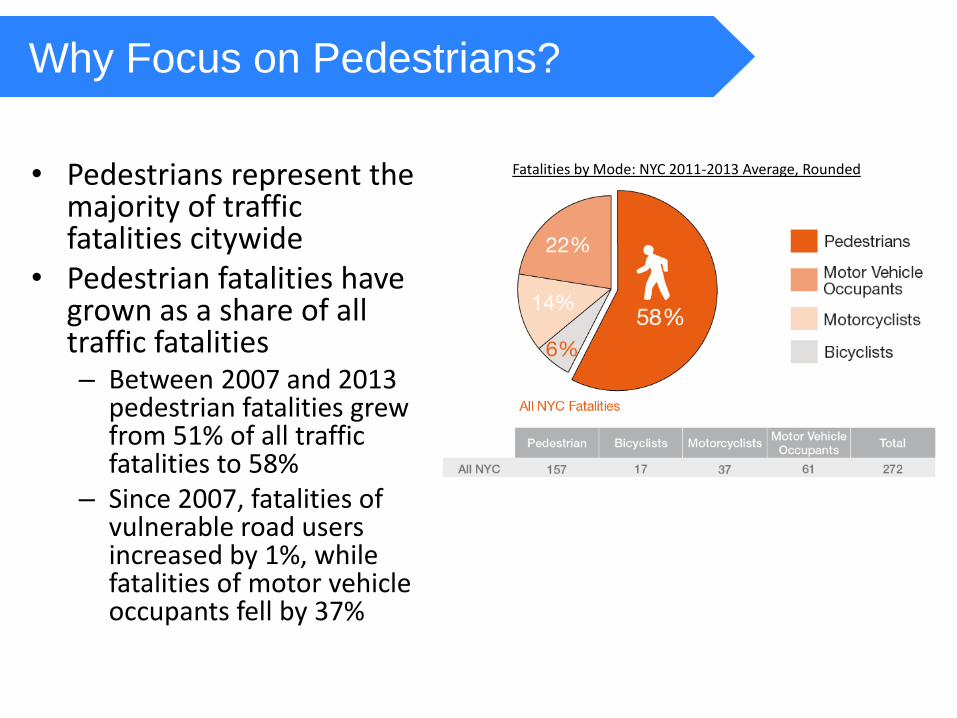
• Pedestrians represent the majority of traffic fatalities citywide
• Pedestrian fatalities have grown as a share of all traffic fatalities– Between 2007 and 2013
pedestrian fatalities grew from 51% of all traffic fatalities to 58%
– Since 2007, fatalities of vulnerable road users increased by 1%, while fatalities of motor vehicle occupants fell by 37%
Why Focus on Pedestrians?
Fatalities by Mode: NYC 2011-2013 Average, Rounded

• The challenge of an aging city– Baby boomers are
reaching retirement age
– Seniors in NYC walk much more than those elsewhere in the US
– Senior fatality rate 4X that of Younger New Yorkers
Why Focus on Pedestrians? (cont.)
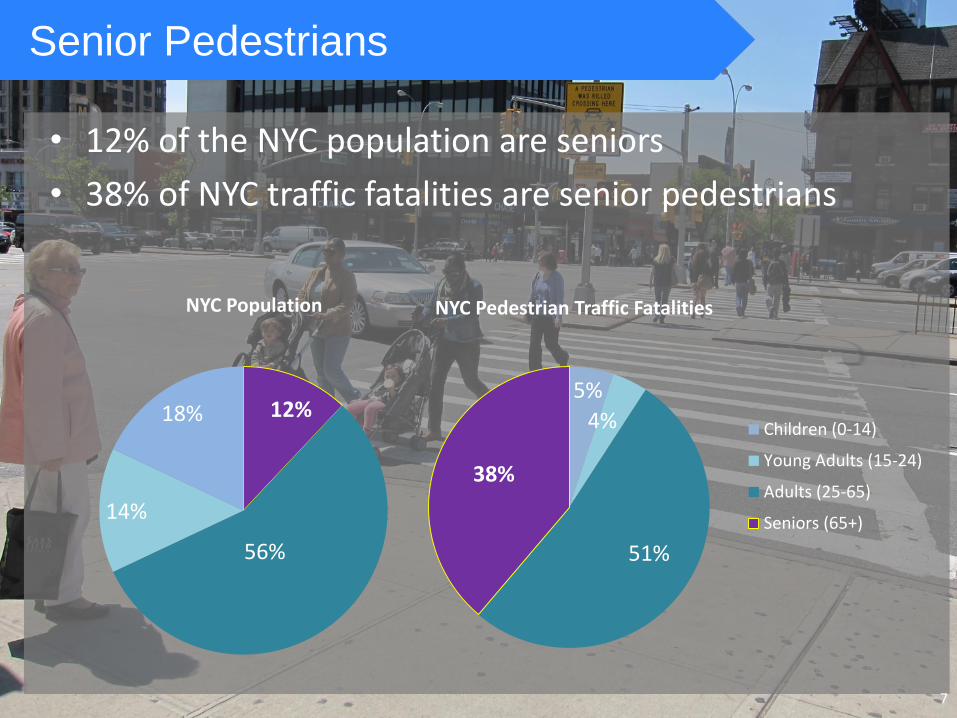
Senior Pedestrians
7
12%
56%
14%
18%
NYC Population
5%
4%
51%
38%
NYC Pedestrian Traffic Fatalities
Children (0-14)
Young Adults (15-24)
Adults (25-65)
Seniors (65+)
• 12% of the NYC population are seniors
• 38% of NYC traffic fatalities are senior pedestrians
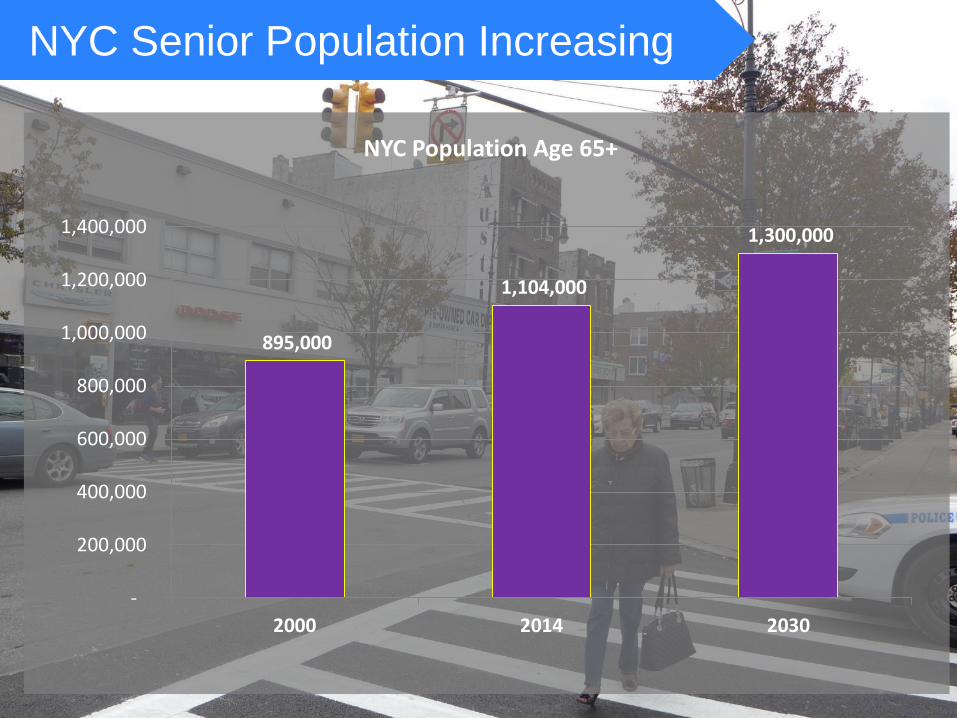
NYC Senior Population Increasing
895,000
1,104,000
1,300,000
-
200,000
400,000
600,000
800,000
1,000,000
1,200,000
1,400,000
2000 2014 2030
NYC Population Age 65+

NYC compared to US average
USA data excludes NYC; Average of last 3 years of available data
2.0
5.3
1.4
0
1
2
3
4
5
6
USA 65+ NYC 65+ NYC <65
Senior pedestrian fatalities per 100,000 population

Senior program
began in 2008
First 25 areas (2008)• Mapped pedestrians
age 65+ killed and severely injured (KSI)
• Circled clustering on heat map to identify first focus areas
12 new areas (2012)• Also studied and
included senior centers, housing, other spatial variables
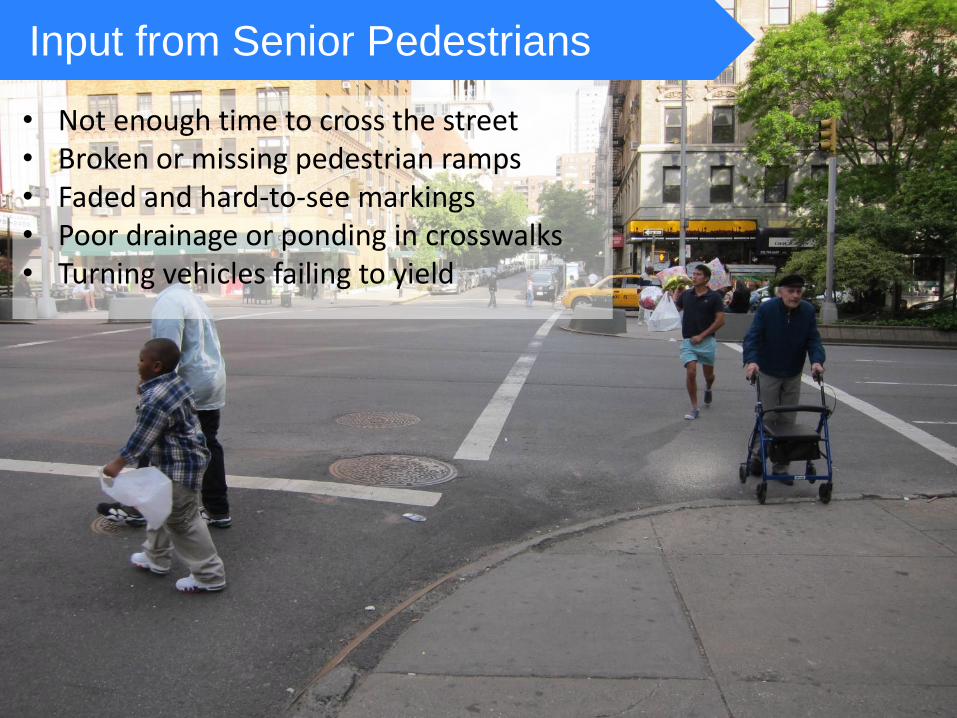
Input from Senior Pedestrians
• Not enough time to cross the street• Broken or missing pedestrian ramps• Faded and hard-to-see markings• Poor drainage or ponding in crosswalks• Turning vehicles failing to yield
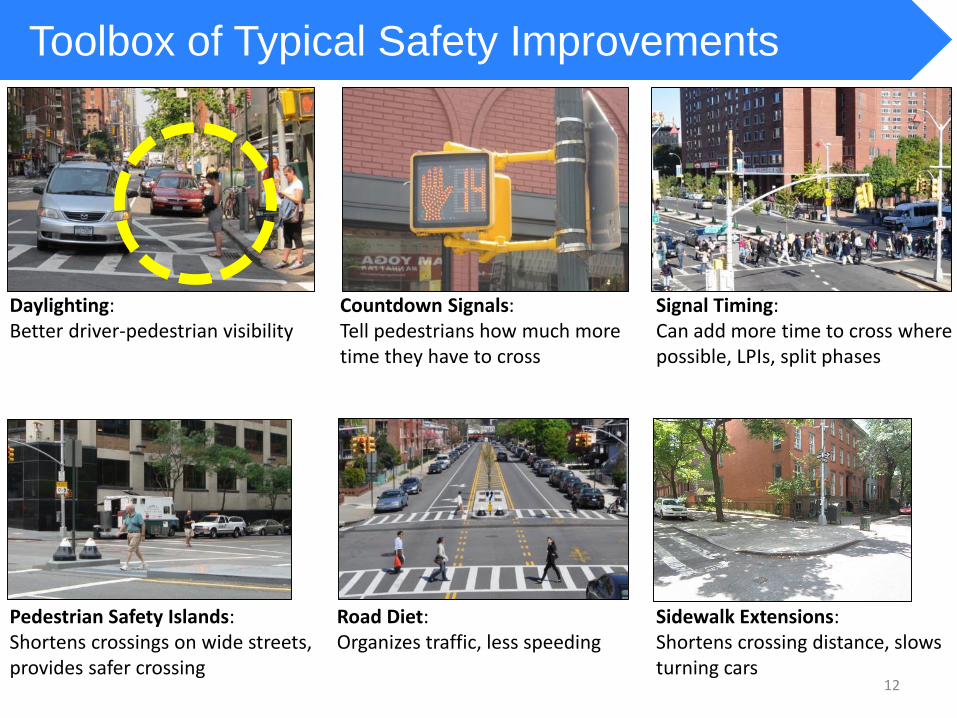
Toolbox of Typical Safety Improvements
Road Diet: Organizes traffic, less speeding
Daylighting: Better driver-pedestrian visibility
Pedestrian Safety Islands: Shortens crossings on wide streets, provides safer crossing
Signal Timing: Can add more time to cross where possible, LPIs, split phases
Countdown Signals: Tell pedestrians how much more time they have to cross
Sidewalk Extensions: Shortens crossing distance, slows turning cars
12
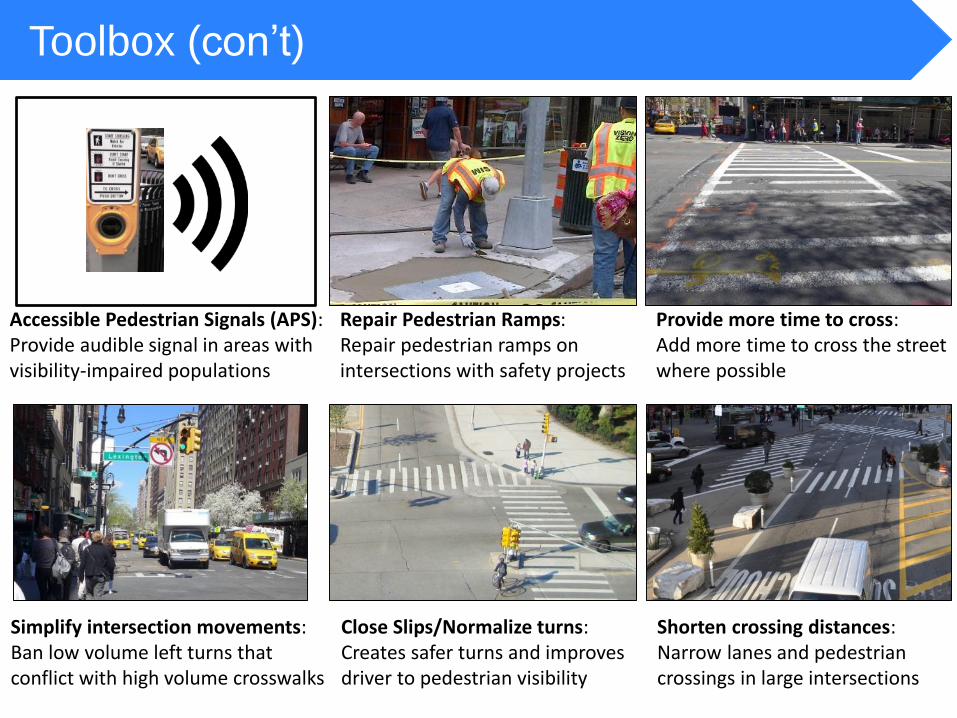
Toolbox (con’t)
Accessible Pedestrian Signals (APS): Provide audible signal in areas with visibility-impaired populations
Provide more time to cross: Add more time to cross the street where possible
Repair Pedestrian Ramps: Repair pedestrian ramps on intersections with safety projects
Simplify intersection movements: Ban low volume left turns that conflict with high volume crosswalks
Shorten crossing distances: Narrow lanes and pedestrian crossings in large intersections
Close Slips/Normalize turns: Creates safer turns and improves driver to pedestrian visibility

CapitalConcrete
In-HouseConcrete
Operational Projects
Build Time
5+ years 1-2 years 1-2 years
HighCost Low Very Low
Optional follow-up: Concrete Build Out
Street Design: 3 construction options
For safety projects, quicker build time saves lives

Reservoir Oval, The Bronx W 70th St & West End, Manhattan
• Partnership with advocates for the visually and hearing impaired has led to better informed policy and design decisions for using truffle paint and gravel curb extensions
• In 2013, NYC DOT installed over 400 Detectable Warning Strips in 14 of street improvement projects
• Testing new materials for durability and to achieve safety goals
Temporary Materials: Input from Visually-Impaired

• Federal funding from FHWA, FTA for Livability, Air Quality, Mobility • PIF lets NYCDOT use FHWA, FTA funds for in-house construction • Faster implementation and lower cost than capital construction• Allows NYCDOT to respond to street safety needs faster• Transforming dangerous streets into safe desirable places to walk
Funding: Public Interest Finding
http://www.fhwa.dot.gov/livability/case_studies/newyork/

W 23rd St/7th Ave (2010)
Location: • Chelsea, Manhattan• Truck Routes• Subway: 1-train • High pedestrian volumes • Near American
Foundation for the Blind• Near Penn South NORC
Safety Improvements at Key Intersections

Safety Improvements at Key Intersections
Modified signal timing to add protected pedestrian crossing
7th Ave and W 23rd St, Manhattan• Pedestrian injuries down by 68%
Installed two pedestrian safety
islands
Created separated left turns
Midtown West Senior Area
Accessible Pedestrian Signal (APS) installed
Before
After

Safety Improvements Near Housing
Bowery (2010)
Location: • Chinatown, Manhattan• Truck Routes• Heavy traffic on Canal
between Holland Tunnel and Manhattan Bridge
• Very high pedestrian volumes

Safety Improvements Near Housing
Chinatown/Lower East Side, Manhattan
Bowery and Division Rutgers and Madison
Bowery at Canal St (Manhattan Bridge entrance), looking south
Chinatown Senior AreaBowery, Manhattan• Pedestrian injuries
reduced by 39%
Added planted median between Canal and Division
Better organized and calmed Bowery traffic
Before
After

Context: Columbus Ave
Location: • Upper West Side, Manhattan• Truck Route, Bus Route• Near Subway: B/C trains• High pedestrian volumes • Goddard Riverside NORC and
Senior Center, Park West Village NORC
Safety Improvements on Arterials

Safety Improvements on Arterials
Columbus Ave, ManhattanPhase 1 (W 77th to W 97th St)• Pedestrian injuries down by 39%
Created separated left turn bays and
protected bike lanes
Upper West Side Senior Area
Before: Phase 2
After: Phase 2
Installed pedestrian safety islands

CityBench Program
• Working with DOT’s City Bench program
• Placing benches at strategic locations, such as:• Senior centers• Bus stops without shelters• Public libraries• Municipal facilities
Self Help Austin St Senior Center in Forest Hills, Queens2nd Avenue bus stop, Manhattan

Outreach with NYC Seniors
• Working with the NYC Department for the Aging• Coordinating with NYCDOT’s Safety Education Team• Going into Senior Centers to get feedback• Approaching Aging Committees on Community Boards for project ideas• Working in coordination with Age-Friendly NYC

Next Steps: Vision Zero and Senior Safety
Future of Senior program• Age-friendly NYC initiative unites senior population growth with DOT safety goals• Frequent overlaps between senior safety areas and Vision Zero priority geographies• Areas with senior pedestrian injuries will continue to be studied and redesigned,
even if they are outside the Vision Zero priority geographies
Overlaps near transit where many seniors
live and walk
Vision Zero highlights main streets with
subway, buses
Lower transit-use NORCs stand out in
the Senior map
Vision ZeroSenior Areas

More at nyc.gov/dotThank
You