powerpoint presentationmcb.berkeley.edu/courses/mcb130l/origin… · ppt file · web view ·...
TRANSCRIPT

Lab 6 - Cellular energetics
Objective:to examine respiration in yeast and rat mitochondria
Techniques:Measure effects of substrates and inhibitors on oxygen consumption in yeast and rat mitochondria using an oxygen polarograph

ATP Synthesis and glucose metabolism
C6H12O6 + 6 O2 + 36 Pi +36 ADP + 36 H+
6 CO2 + 36 ATP + 42 H2O
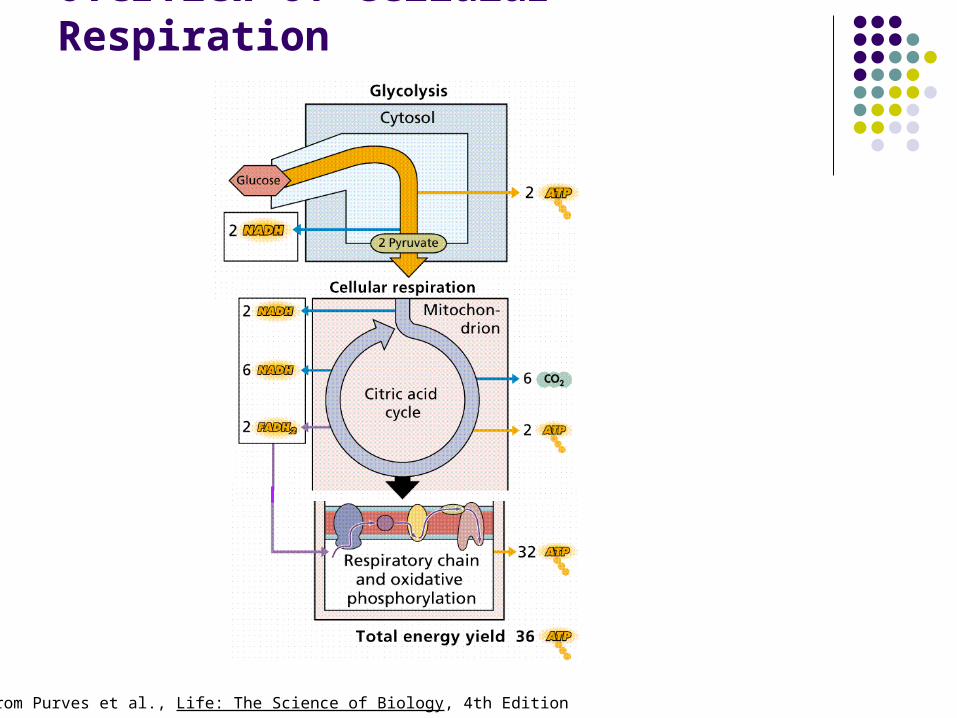
Overview of Cellular Respiration
Images from Purves et al., Life: The Science of Biology, 4th Edition

Step 1: Glycolysis
Glucose + 2ADP 2 pyruvate + 2ATP

Hi [ATP]
Fig. 16-3
Glycolysis• Occurs in the cytosol
• Glucose metabolized to 2 pyruvate + 2 ATP
• High [ATP] inhibits phosphofructokinase (PFK)
• High [ADP] stimulates PFK
• Pasteur Effect: Increase in the rate of carbohydrate breakdown that occurs when switched from aerobic to anaerobic conditions

Step 2: Citric Acid Cycle

Mitochondria

Citric Acid Cycle

Citric Acid Cycle a.k.a. Krebs Cycle, TCA Cycle
Occurs in mitochondrial matrix
Pyruvate reacts with CoA to form Acetyl CoA
NAD+, FAD+ reduced to NADH, FADH2,
NADH, FADH2 enter the electron transport chain
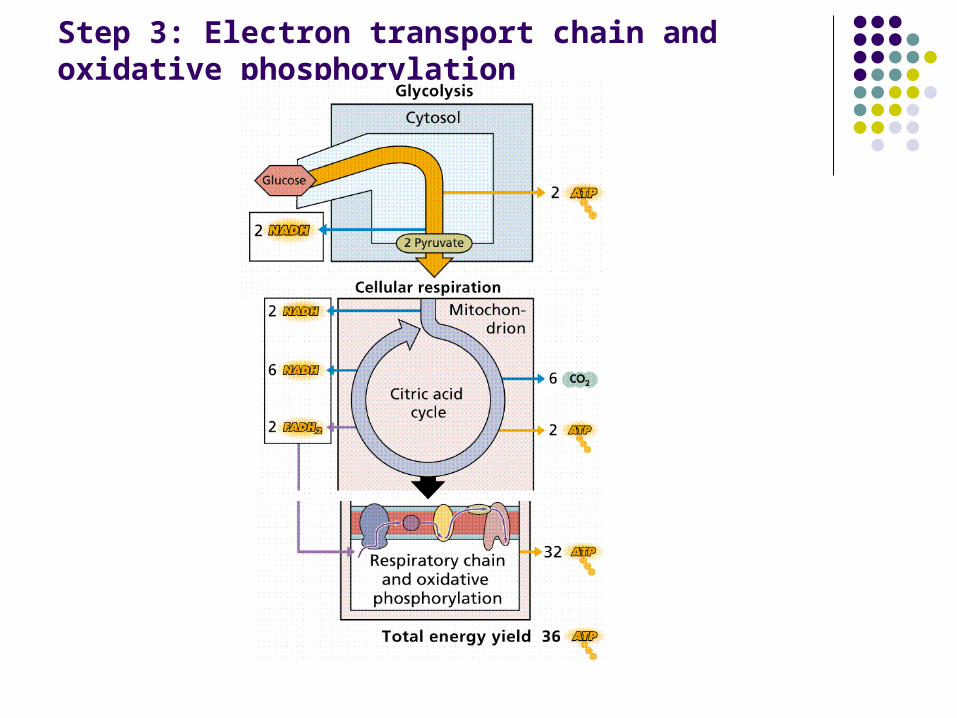
Step 3: Electron transport chain and oxidative phosphorylation

Oxidative PhosphorylationOxidative phosphorylation is the process by which the energy stored in NADH and FADH2 is used to produce ATP.
A. Oxidation step: electron transport chain
B. Phosphorylation step
NADH + H+ + O2 NAD+ + H2O12
FADH2 + O212 FAD + H2O
ADP + Pi ATP

Electron Transport Chain
Fig. 16-19 During electron transport, energy released is used to transport H+ across the inner mitochondrial membrane to create an electrochemical gradient

Fig. 16-32
• H+ transport results in an electrochemical gradient
• Proton motive force: energy released by flow of H+ down its gradient is used for ATP synthesis
• ATP synthase: H+ channel that couples energy from H+ flow with ATP synthesis
Oxidative Phosphorylation

Fig. 16-9
SummaryGlucose
ATP

This week’s lab
Day one: Yeast respiration• Goal: learn how to measure O2 consumption• Compare O2 consumption by normal and starved yeast
Day two: Mitochondria• Examine the effects of various inhibitors and substrates
on the rate of respiration• Determine the identity of your unknown (think what
substrates you need to add and in what order together with the unknown

Inhibitors of Glycolysis
Hi [ATP]
Fig. 16-3
N-ethylmaleimide
Applicable to yeast respiration, not purified mitochondria—why?

ADHacetaldehyde
EtOH
acetic acid CoA
Yeast ethanol metabolism
Glucose
ATP

Electron transport chaininhibitors and substrates
Fig. 16-19
rotenone Antimycin ASodium azide
Glutamate, malateAscorbate + TMPD
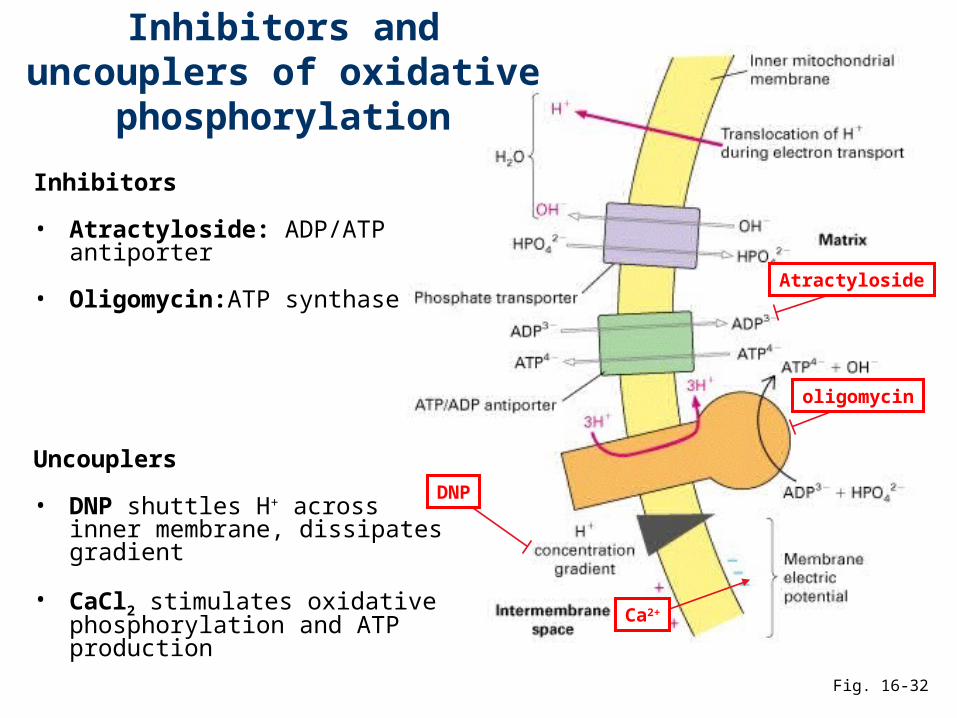
Fig. 16-32
Inhibitors
• Atractyloside: ADP/ATP antiporter
• Oligomycin:ATP synthase
Uncouplers
• DNP shuttles H+ across inner membrane, dissipates gradient
• CaCl2 stimulates oxidative phosphorylation and ATP production
Atractyloside
oligomycin
DNP
Ca2+
Inhibitors and uncouplers of oxidative phosphorylation

Summary of Cellular EnergeticsGlucose
Pyruvate
Acetyl CoA
NADH + FADH2
Electron transport chain
O2 H2OEnergy released used to pump H+ creating an elecrochemical gradient
Flow of protons down the gradient fuels ATP synthase
ADP + Pi ATP
Glycolysis
Citric Acid Cycle
Oxidative Phosphorylation
N-ethylmaleimide
EtOH
Succinate
MalateFADH2
NADH
Rotenone Antimycin A
Sodium Azide
UncouplersCa+2, DNP
Oligomycin
Atractyloside
Ascorbate + TMPD
High [ATP](Pasteur effect)
Fig. 16-2

Carbon Dioxide Emission Control Authority

Review:Characterization of Cellular Components
Who?
What?
Where?
When?
How?
Why?

Review Immunofluorescence microscopy
Microscope Cell staining
Vital staining Colocalization Filters
Transfection Eukaryotic expression vectors GFP