powerpoint presentation amway global entrepreneurship report #ager2015 2 survey design • edition...
TRANSCRIPT

DEFINING THE ENTREPRENEURIAL SPIRIT
AGER2015
Latvia

Amway Global Entrepreneurship Report
#AGER2015 2
SURVEY DESIGN
• Edition 6th edition
• Partner Chair of Strategy and Organization of the School of Management,
Technische Universität München in Munich, Germany.
• Fieldwork May to August 2015
• Sample 49.775 respondents – 25,814 women, and 23,961 men aged 14-99
• Countries 44
Australia, Austria, Belgium, Brazil, Bulgaria, Canada, China, Colombia, Croatia, Czech Republic, Denmark,
Estonia, Finland, France, Germany, Great Britain, Greece, Hungary, India, Ireland, Italy, Japan, Korea, Latvia,
Lithuania, Malaysia, Mexico, Netherlands, Norway, Poland, Portugal, Romania, Russia, Slovakia, Slovenia,
South Africa, Spain, Sweden, Switzerland, Thailand, Turkey, Ukraine, USA, Vietnam
In China, Colombia, India, Mexico, and South Africa, Thailand, and Vietnam only people in metropolitan
areas participated.
• Method Face-to-face / telephone interviews
• Institute GfK Nuremberg, Germany

Attitude and Potential QUESTION 1

Amway Global Entrepreneurship Report
#AGER2015 4
QUESTION 1: HOW DO YOU SEE ENTREPRENEURSHIP?
OF LATVIAN RESPONDENTS HAVE A
POSITIVE ATTITUDE TOWARDS
ENTREPRENEURSHIP
83 % • Entrepreneurial attitude: 83% of Latvian respondents have a positive
attitude towards entrepreneurship while only 15%
show a negative attitude.
Latvian respondents show a much more positive
attitude than the global (75%) and European
(72%) averages.
• Attitude by gender: Female respondents (85%) show a little more
positive attitude towards entrepreneurship than
male respondents (80%).
Global average: men 76%, women 74%.
• Attitude by age groups: Latvians are slightly less positive with increasing
age.
• Under 35 years: 87%
• 35 to 49 years: 83%
• Over 50 years: 80%

Amway Global Entrepreneurship Report
#AGER2015 5
QUESTION 1: HOW DO YOU SEE ENTREPRENEURSHIP?
OF LATVIAN RESPONDENTS CAN
IMAGINE STARTING A BUSINESS
51 % • Entrepreneurial potential: Entrepreneurial potential in Latvia is on a
high level: 51% of Latvian respondents can
imagine starting his or her own business.
Latvian respondents are much more likely to
start up their own business than the
international average (43%). European
respondents show a much lower
entrepreneurial potential than Latvian (38%).
• Potential by gender: Men (57%) are more willing to start a
business (female: 45%). Global average: men
47%, women 38%.
• Potential by age groups: Respondents under 35 years show highest
entrepreneurial potential (under 35 years:
62%; from 35 and 49 years: 57%; over 50
years: 37%).

Amway Global Entrepreneurship Report
#AGER2015 6
QUESTION 1: HOW DO YOU SEE ENTREPRENEURSHIP?
Entrepreneurial gap Entrepreneurial gap = Total of respondents
answering „I can imagine to start up my own
business“ minus total of respondents
answering „I am self-employed“
40% MY ATTITUDE TOWARDS ENTREPRENEURSHIP IS...
...POSITIVE
...NEGATIVE
83%
15%

Amway Global Entrepreneurship Report
#AGER2015 7
QUESTION 1: HOW DO YOU SEE ENTREPRENEURSHIP?
A SELECTION OF BALTIC AND CEE COUNTRIES
Positive
I can imagine
starting my own
business
Negative
I cannot imagine
starting my own
business
Don’t know Self-employed
Bulgaria 54% 24% 35% 65% 11% 8%
Croatia 61% 25% 30% 66% 9% 3%
Czech Republic 66% 37% 29% 58% 5% 7%
Estonia 91% 47% 8% 52% 1% 10%
Hungary 61% 35% 33% 59% 6% 2% Latvia 83% 51% 15% 47% 2% 11% Lithuania 83% 48% 15% 50% 2% 13% Poland 71% 38% 22% 55% 7% 5% Romania 54% 26% 33% 61% 13% 5% Slovakia 55% 33% 39% 61% 6% 6% Slovenia 83% 45% 16% 54% 1% 6%
Baltics & CEE 69% 37% 25% 57% 6% 7% Global 75% 43% 21% 53% 4% 10%

Amway Global Entrepreneurship Report
#AGER2015 8
QUESTION 1: HOW DO YOU SEE ENTREPRENEURSHIP?
Positive
I can imagine
starting my own
business
Negative
I cannot imagine
starting my own
business
Don’t know Self-employed
Australia 85% 44% 11% 52% 4% 12%
Austria 51% 29% 44% 66% 5% 5%
Belgium 73% 33% 24% 64% 3% 5%
Brazil 85% 58% 14% 41% 1% 24%
Bulgaria 54% 24% 35% 65% 11% 8%
Canada 86% 43% 12% 55% 2% 14%
China 91% 62% 9% 38% 0% 4%
Colombia 90% 77% 9% 22% 1% 27%
Croatia 61% 25% 30% 66% 9% 3%
Czech Republic 66% 37% 29% 58% 5% 7%
Denmark 96% 45% 2% 53% 2% 7%
Estonia 91% 47% 8% 52% 1% 10%
Finland 89% 43% 10% 56% 1% 6%
France 77% 36% 20% 61% 3% 8%
Germany 60% 25% 37% 72% 3% 5%
Global 75% 43% 21% 53% 4% 10%

Amway Global Entrepreneurship Report
#AGER2015 9
QUESTION 1: HOW DO YOU SEE ENTREPRENEURSHIP?
Positive
I can imagine
starting my own
business
Negative
I cannot imagine
starting my own
business
Don’t know Self-employed
Great Britain 84% 41% 13% 56% 3% 8%
Greece 69% 52% 30% 47% 1% 29%
Hungary 61% 35% 33% 59% 6% 2%
India 70% 52% 28% 46% 2% 17%
Ireland 68% 37% 18% 49% 14% 7%
Italy 73% 42% 27% 58% 0% 12%
Japan 63% 13% 35% 85% 2% 14%
Korea 66% 48% 22% 40% 12% 14%
Latvia 83% 51% 15% 47% 2% 11%
Lithuania 83% 48% 15% 50% 2% 13%
Malaysia 76% 48% 22% 50% 2% 4%
Mexico 90% 81% 8% 17% 2% 15%
Netherlands 84% 40% 15% 59% 1% 8%
Norway 94% 33% 3% 64% 3% 7%
Poland 71% 38% 22% 55% 7% 5%
Global 75% 43% 21% 53% 4% 10%

Amway Global Entrepreneurship Report
#AGER2015 10
QUESTION 1: HOW DO YOU SEE ENTREPRENEURSHIP?
Positive
I can imagine
starting my own
business
Negative
I cannot imagine
starting my own
business
Don’t know Self-employed
Portugal 57% 39% 43% 61% 0% 8%
Romania 54% 26% 33% 61% 13% 5%
Russia 71% 37% 18% 52% 11% 5%
Slovakia 55% 33% 39% 61% 6% 6%
Slovenia 83% 45% 16% 54% 1% 6%
South Africa 79% 53% 14% 40% 7% 9%
Spain 69% 37% 31% 63% 0% 11%
Sweden 90% 38% 9% 61% 1% 3%
Switzerland 88% 42% 9% 55% 3% 11%
Thailand 72% 60% 28% 40% 0% 10%
Turkey 58% 39% 25% 44% 17% 11%
Ukraine 63% 29% 20% 54% 17% 4%
USA 86% 51% 13% 48% 1% 11%
Vietnam 88% 71% 11% 28% 1% 26%
Global 75% 43% 21% 53% 4% 10%

Appealing Aspects QUESTION 2

Amway Global Entrepreneurship Report
#AGER2015 12
26%
BETTER COMPATIBILITY
OF FAMILY, LEISURE
TIME, AND CAREER
QUESTION 2: WHICH OF THE FOLLOWING ASPECTS APPEAL TO YOU?
37%
SELF-
FULFILLMENT
16%
RETURN TO JOB
MARKET
45%
INDEPENDENCE
FROM AN
EMPLOYER
39%
SECOND INCOME
PROSPECTS

Amway Global Entrepreneurship Report
#AGER2015 13
QUESTION 2: WHICH OF THE FOLLOWING ASPECTS APPEAL TO YOU?
„INDEPENDENCE“ AND
„SELF-FULFILLMENT“
STAY MOST IMPORTANT
REASONS FOR ENTRE-
PRENEURSHIP
• Aspects by age groups: All age groups agree on:
• “independence” is the most appealing aspect to
start an own business throughout all age groups
(under 35 years: 49%; from 35 to 49 years: 44%;
over 50 years: 43%)
• “better compatibility of family, leisure time and
career” declines with rising age (under 35 years:
31%; from 35 to 49 years: 27%; over 50 years:
20%),
as the most appealing factors to start an own
business.
• Aspects by gender: Men and women agree on “independence from an
employer” (male: 47%; female: 44%), however
women strive more for “second income propects”
than women (male: 34%; female: 43%).
Amway Global Entrepreneurship Report
#AGER2015 14
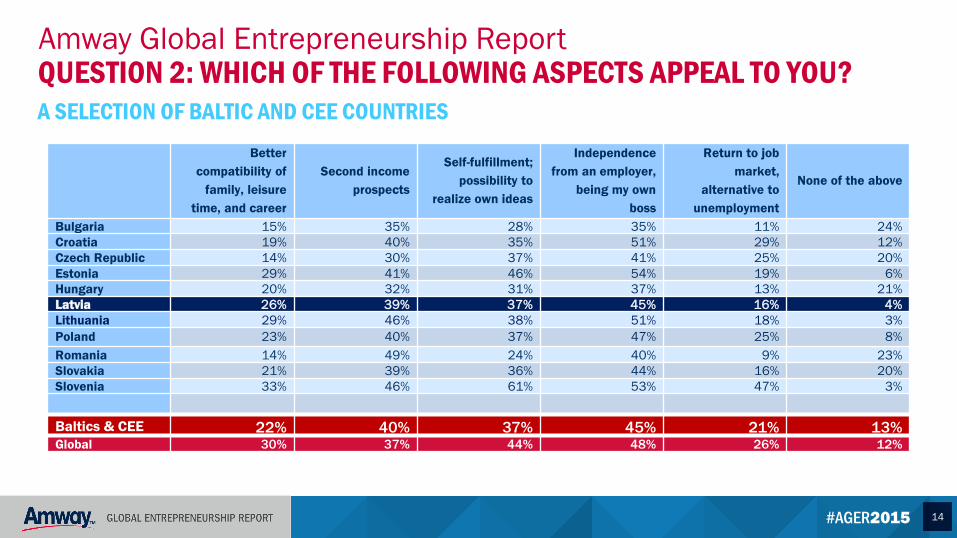
QUESTION 2: WHICH OF THE FOLLOWING ASPECTS APPEAL TO YOU?
A SELECTION OF BALTIC AND CEE COUNTRIES
Better
compatibility of
family, leisure
time, and career
Second income
prospects
Self-fulfillment;
possibility to
realize own ideas
Independence
from an employer,
being my own
boss
Return to job
market,
alternative to
unemployment
None of the above
Bulgaria 15% 35% 28% 35% 11% 24% Croatia 19% 40% 35% 51% 29% 12% Czech Republic 14% 30% 37% 41% 25% 20% Estonia 29% 41% 46% 54% 19% 6%
Hungary 20% 32% 31% 37% 13% 21% Latvia 26% 39% 37% 45% 16% 4% Lithuania 29% 46% 38% 51% 18% 3%
Poland 23% 40% 37% 47% 25% 8%
Romania 14% 49% 24% 40% 9% 23% Slovakia 21% 39% 36% 44% 16% 20% Slovenia 33% 46% 61% 53% 47% 3%
Baltics & CEE 22% 40% 37% 45% 21% 13% Global 30% 37% 44% 48% 26% 12%

Amway Global Entrepreneurship Report
#AGER2015 15
QUESTION 2: WHICH OF THE FOLLOWING ASPECTS APPEAL TO YOU?
Better
compatibility of
family, leisure
time, and career
Second income
prospects
Self-fulfillment;
possibility to
realize own ideas
Independence
from an employer,
being my own
boss
Return to job
market,
alternative to
unemployment
None of the above
Australia 44% 44% 64% 66% 38% 7%
Austria 25% 25% 33% 43% 17% 23%
Belgium 41% 44% 70% 63% 44% 13%
Brazil 19% 30% 33% 47% 14% 3%
Bulgaria 15% 35% 28% 35% 11% 24%
Canada 67% 73% 86% 84% 69% 4%
China 84% 84% 82% 78% 56% 1%
Colombia 33% 29% 33% 35% 15% 14%
Croatia 19% 40% 35% 51% 29% 12%
Czech Republic 14% 30% 37% 41% 25% 20%
Denmark 35% 41% 74% 67% 36% 3%
Estonia 29% 41% 46% 54% 19% 6%
Finland 13% 22% 52% 36% 13% 12%
France 16% 11% 43% 47% 15% 19%
Germany 26% 34% 42% 54% 18% 21%
Global 30% 37% 44% 48% 26% 12%

Amway Global Entrepreneurship Report
#AGER2015 16
QUESTION 2: WHICH OF THE FOLLOWING ASPECTS APPEAL TO YOU?
Better
compatibility of
family, leisure
time, and career
Second income
prospects
Self-fulfillment;
possibility to
realize own ideas
Independence
from an employer,
being my own
boss
Return to job
market,
alternative to
unemployment
None of the above
Great Britain 30% 16% 39% 50% 12% 13%
Greece 16% 24% 34% 39% 29% 6%
Hungary 20% 32% 31% 37% 13% 21%
India 31% 53% 42% 49% 21% 2%
Ireland 17% 16% 31% 36% 14% 27%
Italy 21% 23% 41% 46% 18% 1%
Japan 20% 25% 28% 15% 4% 36%
Korea 26% 17% 40% 27% 21% 12%
Latvia 26% 39% 37% 45% 16% 4%
Lithuania 29% 46% 38% 51% 18% 3%
Malaysia 62% 52% 56% 57% 38% 2%
Mexico 30% 30% 32% 43% 19% 4%
Netherlands 22% 26% 54% 64% 36% 5%
Norway 37% 41% 55% 43% 30% 10%
Poland 23% 40% 37% 47% 25% 8%
Global 30% 37% 44% 48% 26% 12%

Amway Global Entrepreneurship Report
#AGER2015 17
QUESTION 2: WHICH OF THE FOLLOWING ASPECTS APPEAL TO YOU?
Better
compatibility of
family, leisure
time, and career
Second income
prospects
Self-fulfillment;
possibility to
realize own ideas
Independence
from an employer,
being my own
boss
Return to job
market,
alternative to
unemployment
None of the above
Portugal 13% 15% 30% 45% 30% 19%
Romania 14% 49% 24% 40% 9% 23%
Russia 19% 33% 26% 26% 11% 28%
Slovakia 21% 39% 36% 44% 16% 20%
Slovenia 33% 46% 61% 53% 47% 3%
South Africa 31% 31% 39% 45% 26% 11%
Spain 17% 18% 35% 51% 25% 11%
Sweden 46% 69% 83% 72% 69% 3%
Switzerland 35% 28% 57% 49% 23% 10%
Thailand 34% 45% 31% 43% 11% 1%
Turkey 22% 33% 32% 40% 19% 17%
Ukraine 10% 31% 22% 13% 10% 39%
USA 62% 62% 72% 75% 50% 7%
Vietnam 52% 51% 50% 68% 45% 2%
Global 30% 37% 44% 48% 26% 12%

AESI QUESTION 3

Amway Global Entrepreneurship Report
#AGER2015 19
QUESTION 3: THE AMWAY ENTREPRENEURIAL SPIRIT INDEX (AESI)
• The 2015 AGER introduces the Amway Entrepreneurial Spirit Index (AESI). The AESI builds on the theory of planned behavior
• The AESI builds on the theory of planned behavior. It incorporates three dimensions:
1. Desirability
2. Feasibility
3. Stability against social pressure
• The AESI score may range from 0 to 100. The score is calculated as the mean of its three sub dimensions.
• The AESI indicates how inclined individuals are to start a business. Measuring results by country allows for comparisons with
neighboring countries and by geographic or economic regions. To ensure relevant comparison, countries must be comparable
culturally or economically.

Amway Global Entrepreneurship Report
#AGER2015 20
QUESTION 3: THE AMWAY ENTREPRENEURIAL SPIRIT INDEX (AESI)
45 Social Control
Feasability
Desire
44% 54%
AESI SCORE
38%
• Overall score: The AESI score of Latvia is at 45. The international average (51) reaches a higher score. With its
AESI score, Latvia is on a similar level to the European average (45).
• Score by gender: In Latvian male respondents reach a higher AESI score (50) than female respondents (41). Global
average: male (54), female (47)
• Score by age groups: Comparing the age groups, the Latvian respondents under 35 years have the highest AESI score
with (54), followed by those aged between 35 and 49 years (46) and over 50 years (38).
Global average: under 35 years: 56; from 35 to 49 years: 54; over 50 years: 44).

Amway Global Entrepreneurship Report
#AGER2015 21
QUESTION 3: THE AMWAY ENTREPRENEURIAL SPIRIT INDEX (AESI)
• Overall dimensions: Latvian respondents rank the desire to become an entrepreneur (Europe: 47%) first, followed by
the confidence in their own abilities (Europe: 41%). The stability against social pressure ranks
third for Latvian respondents (Europe: 48%). The international average ranks the desire to
become an entrepreneur first (world: 55%). Almost equally important follow stability against
social pressure (world: 49%) and feasibility (world: 47%).
• Dimensions by gender: Men have a bigger desire (female: 49%; male: 60%) and are more confident of their own
capabilities (female: 40%; male: 48%). Further, men are also more stable against social
pressure (female: 35%; male: 42%)
• Dimensions by age groups: Respondents under 35 years have a much bigger desire to start a business (under 35 years:
71%; from 35 to 49 years: 56%; over 50 years: 39%). Furthermore, respondents under 35 years
are more confident of their own abilities (under 35 years: 50%; from 35 to 49 years: 41%; over
50 years: 40%). Additionally, respondents under 50 years are more stable against social
pressure (under 35 years: 40%; from 35 to 49 years: 41%; over 50 years: 35%).

Amway Global Entrepreneurship Report
#AGER2015 22
QUESTION 3: THE AMWAY ENTREPRENEURIAL SPIRIT INDEX (AESI)
47% 41% 48%
45
EUROPE
55% 47% 49%
51
GLOBAL
52% 60% 43%
52
NORTH AMERICA
82% 66% 53%
67
LATIN AMERICA
76% 58% 59%
64
ASIA
DESIRE
FEASIBILITY
SOCIAL CONTROL

Amway Global Entrepreneurship Report
#AGER2015 23
QUESTION 3: THE AMWAY ENTREPRENEURIAL SPIRIT INDEX (AESI)
A SELECTION OF BALTIC AND CEE COUNTRIES
Desirability Feasibility Social control Index
Bulgaria 42% 27% 36% 35 Croatia 18% 28% 38% 28 Czech Republic 62% 38% 56% 52 Estonia 46% 37% 49% 44
Hungary 38% 22% 52% 37 Latvia 54% 44% 38% 45 Lithuania 82% 41% 56% 60 Poland 24% 34% 28% 29 Romania 39% 24% 51% 38 Slovakia 53% 37% 49% 46 Slovenia 71% 63% 77% 70
Baltics & CEE 48% 36% 48% 44 Global 55% 47% 49% 51

Amway Global Entrepreneurship Report
#AGER2015 24
QUESTION 3: THE AMWAY ENTREPRENEURIAL SPIRIT INDEX (AESI)
Desirability Feasibility Social control Index
Australia 54% 56% 44% 51
Austria 27% 37% 40% 35
Belgium 41% 40% 42% 41
Brazil 77% 63% 67% 69
Bulgaria 42% 27% 36% 35
Canada 47% 59% 43% 50
China 85% 81% 71% 79
Colombia 85% 60% 33% 59
Croatia 18% 28% 38% 28
Czech Republic 62% 38% 56% 52
Denmark 64% 53% 41% 53
Estonia 46% 37% 49% 44
Finland 57% 43% 62% 54
France 29% 42% 45% 39
Germany 26% 29% 38% 31
Global 55% 47% 49% 51

Amway Global Entrepreneurship Report
#AGER2015 25
QUESTION 3: THE AMWAY ENTREPRENEURIAL SPIRIT INDEX (AESI)
Desirability Feasibility Social control Index
Great Britain 44% 55% 45% 48
Greece 65% 39% 51% 52
Hungary 38% 22% 52% 37
India 94% 68% 76% 79
Ireland 47% 55% 53% 52
Italy 54% 44% 51% 50
Japan 29% 8% 19% 19
Korea 62% 34% 37% 44
Latvia 54% 44% 38% 45
Lithuania 82% 41% 56% 60
Malaysia 82% 69% 67% 73
Mexico 85% 76% 60% 74
Netherlands 48% 51% 59% 53
Norway 40% 54% 39% 44
Poland 24% 34% 28% 29
Global 55% 49% 47% 51

Amway Global Entrepreneurship Report
#AGER2015 26
QUESTION 3: THE AMWAY ENTREPRENEURIAL SPIRIT INDEX (AESI)
Desirability Feasibility Social control Index
Portugal 45% 42% 45% 44
Romania 39% 24% 51% 38
Russia 43% 23% 30% 32
Slovakia 53% 37% 49% 46
Slovenia 71% 63% 77% 70
South Africa 76% 73% 73% 74
Spain 46% 42% 45% 44
Sweden 50% 52% 44% 49
Switzerland 46% 50% 44% 47
Thailand 89% 72% 76% 79
Turkey 66% 55% 64% 62
Ukraine 42% 28% 32% 34
USA 57% 60% 43% 53
Vietnam 89% 75% 67% 77
Global 55% 47% 49% 51

Fear of Failure QUESTION 4

Amway Global Entrepreneurship Report
#AGER2015 28
QUESTION 4: THE FEAR OF FAILURE
OF LATVIAN RESPONDENTS
PERCEIVE THE FEAR TO FAIL
AS OBSTACLE TO STARTING
A BUSINESS
58 % • Overall fear: For more than every second respondent in Latvia (58%) fear
of failing is an obstacle to starting a business.
Even if this is more than every second respondent, the
averages of international (70%) and European (69%)
respondents perceive the fear to fail as a much stronger
obstacle to starting a business.
• Overall factors: The fear of failure is composed by different factors.
The outstanding main burden, Latvians fear most, are
“financial burdens up to bankruptcy” (41%). Far behind
follow “threat of the economic crisis” (25%), and “legal
consequences such as law-suits” (20%).
The international average of respondents agrees “financial
burdens up to bankruptcy” (41%), and the “threat of the
economic crisis” (29%) as most crucial aspects of the fear to
fail.

Amway Global Entrepreneurship Report
#AGER2015 29
QUESTION 4: THE FEAR OF FAILURE
• Factors by gender: Latvian female respondents see the ”fear of failing” as a bigger obstacle to starting a business
(female: 65%; male: 49%). Women especially fear ”financial burdens” (female: 47%; male: 34%) and
an “economical crisis” (female: 30%; male: 20%) more than their male counterparts.
Globaly: men and women fear “financial burdens” (female: 43%; male: 40%), and the “threat of the
economic crisis” (female: 31%; male: 28%) most.
• Factors by age groups: Age does not seem to have an influence on the perception of fear of failure as an obstacle to starting
a business (under 35 years: 58%; from 35 to 49 years: 58%; over 50 years: 57%). Approval rates for
single factors are on a similar level across all age groups.

Amway Global Entrepreneurship Report
#AGER2015 30
QUESTION 4: THE FEAR OF FAILURE IN LATVIA
IN YOUR OPINION, IS THE FEAR
TO FAIL AN OBSTACLE TO
STARTING A BUSINESS?
RESPONDENTS FEAR MOST... 58%
YES NO
… FINANCIAL
BURDENS UP TO
BANKRUPTCY
… THREAT OF THE
ECONOMIC CRISIS
…LEGAL
CONSEQUENCES
…THREAT OF
UNEMPLOYMENT
41%
25%
20%
12%
41%
… PERSONAL AND FAMILY
DISAPPOINTMENT 8%

Amway Global Entrepreneurship Report
#AGER2015 31
QUESTION 4: THE FEAR OF FAILURE
A SELECTION OF BALTIC AND CEE COUNTRIES
Yes No No Answer Financial
burdens
Disappointing
my family
Reputation
loss
Personal
disappointment
Take over the
responsibility
Legal
consequences
Not to be
given a second
chance
Threat of the
economic
crisis
Threat of
unemployment Others
Bulgaria 78% 11% 11% 51% 14% 8% 24% 16% 20% 6% 36% 14% 3% Croatia 85% 7% 8% 56% 7% 7% 17% 16% 17% 7% 43% 15% 4%
Czech
Republic 88% 8% 4% 50% 14% 13% 25% 24% 23% 10% 17% 14% 7%
Estonia 53% 46% 1% 36% 9% 7% 12% 6% 15% 2% 23% 12% 1%
Hungary 86% 6% 8% 57% 13% 7% 20% 19% 22% 6% 42% 24% 8% Latvia 58% 41% 1% 41% 8% 5% 8% 6% 20% 3% 25% 12% 0%
Lithuania 64% 34% 2% 40% 10% 5% 11% 8% 18% 5% 20% 12% 2%
Poland 71% 22% 7% 33% 9% 8% 16% 17% 19% 10% 26% 21% 0% Romania 85% 4% 11% 65% 14% 8% 23% 24% 21% 9% 36% 6% 4% Slovakia 82% 11% 7% 47% 11% 5% 11% 25% 17% 6% 47% 14% 4% Slovenia 54% 45% 1% 34% 5% 4% 11% 11% 18% 5% 20% 11% 3%
Baltics & CEE 73% 21% 6% 46% 10% 7% 16% 16% 19% 6% 30% 14% 3% Global 70% 26% 4% 41% 12% 8% 15% 13% 16% 8% 29% 16% 3%

Amway Global Entrepreneurship Report
#AGER2015 32
QUESTION 4: THE FEAR OF FAILURE
Yes No No
Answer
Financial
burdens
Disappointing
my family
Reputation
loss
Personal
disappointment
Take over the
responsibility
Legal
consequences
Not to be given
a second
chance
Threat of the
economic
crisis
Threat of
unemployment Others
Australia 55% 41% 4% 38% 10% 10% 17% 7% 14% 3% 16% 15% 2%
Austria 80% 15% 5% 49% 14% 10% 25% 11% 22% 11% 29% 19% 3%
Belgium 70% 28% 2% 45% 11% 8% 17% 10% 17% 9% 34% 20% 4%
Brazil 51% 49% 0% 28% 6% 4% 7% 4% 8% 5% 25% 8% 1%
Bulgaria 78% 11% 11% 51% 14% 8% 24% 16% 20% 6% 36% 14% 3%
Canada 69% 29% 2% 45% 12% 12% 17% 10% 15% 6% 22% 18% 3%
China 60% 39% 1% 30% 22% 12% 10% 12% 13% 14% 19% 21% 0%
Colombia 42% 58% 0% 24% 7% 5% 10% 11% 7% 9% 24% 11% 2%
Croatia 85% 7% 8% 56% 7% 7% 17% 16% 17% 7% 43% 15% 4% Czech Republic 88% 8% 4% 50% 14% 13% 25% 24% 23% 10% 17% 14% 7%
Denmark 43% 53% 4% 30% 8% 5% 11% 4% 8% 3% 17% 9% 2%
Estonia 53% 46% 1% 36% 9% 7% 12% 6% 15% 2% 23% 12% 1%
Finland 67% 30% 3% 42% 7% 4% 8% 12% 8% 3% 30% 11% 8%
France 74% 23% 3% 53% 5% 2% 8% 11% 13% 5% 40% 18% 6%
Germany 78% 19% 3% 62% 11% 8% 29% 10% 20% 6% 26% 20% 5%
Global 70% 26% 4% 41% 12% 8% 15% 13% 16% 8% 29% 16% 3%

Amway Global Entrepreneurship Report
#AGER2015 33
QUESTION 4: THE FEAR OF FAILURE
Yes No No
Answer
Financial
burdens
Disappointing
my family
Reputation
loss
Personal
disappointment
Take over the
responsibility
Legal
consequences
Not to be given
a second
chance
Threat of the
economic
crisis
Threat of
unemployment Others
Great Britain 57% 41% 2% 34% 6% 5% 15% 6% 11% 3% 16% 18% 3%
Greece 84% 15% 1% 39% 5% 3% 10% 6% 14% 3% 49% 14% 2%
Hungary 86% 6% 8% 57% 13% 7% 20% 19% 22% 6% 42% 24% 8%
India 90% 7% 3% 46% 30% 30% 28% 25% 26% 20% 42% 22% 3%
Ireland 70% 20% 10% 28% 6% 8% 14% 12% 13% 7% 24% 17% 3%
Italy 90% 7% 3% 39% 15% 7% 19% 14% 14% 8% 46% 18% 3%
Japan 94% 5% 1% 67% 13% 4% 8% 44% 19% 4% 28% 28% 5%
Korea 88% 1% 11% 59% 35% 12% 26% 13% 13% 22% 48% 16% 0%
Latvia 58% 41% 1% 41% 8% 5% 8% 6% 20% 3% 25% 12% 0%
Lithuania 64% 34% 2% 40% 10% 5% 11% 8% 18% 5% 20% 12% 2%
Malaysia 76% 21% 3% 34% 16% 16% 13% 11% 14% 16% 33% 16% 10%
Mexico 87% 12% 1% 32% 16% 13% 18% 14% 19% 15% 32% 20% 1%
Netherlands 32% 65% 3% 17% 2% 1% 5% 6% 4% 3% 13% 9% 1%
Norway 49% 48% 3% 28% 7% 4% 9% 4% 9% 2% 25% 8% 3%
Poland 71% 22% 7% 33% 9% 8% 16% 17% 19% 10% 26% 21% 0%
Global 70% 26% 4% 41% 12% 8% 15% 13% 16% 8% 29% 16% 3%

Amway Global Entrepreneurship Report
#AGER2015 34
QUESTION 4: THE FEAR OF FAILURE
Yes No No
Answer
Financial
burdens
Disappointing
my family
Reputation
loss
Personal
disappointment
Take over the
responsibility
Legal
consequences
Not to be given
a second
chance
Threat of the
economic
crisis
Threat of
unemployment Others
Portugal 70% 23% 7% 38% 6% 4% 8% 9% 14% 6% 46% 25% 3%
Romania 85% 4% 11% 65% 14% 8% 23% 24% 21% 9% 36% 6% 4%
Russia 76% 10% 14% 50% 18% 6% 11% 15% 19% 5% 21% 6% 8%
Slovakia 82% 11% 7% 47% 11% 5% 11% 25% 17% 6% 47% 14% 4%
Slovenia 54% 45% 1% 34% 5% 4% 11% 11% 18% 5% 20% 11% 3%
South Africa 85% 9% 6% 33% 15% 15% 18% 18% 18% 13% 34% 24% 3%
Spain 78% 21% 1% 52% 5% 3% 14% 16% 14% 14% 49% 19% 9%
Sweden 40% 60% 0% 29% 7% 4% 12% 6% 8% 3% 10% 12% 1%
Switzerland 74% 24% 2% 51% 14% 6% 16% 9% 18% 5% 24% 20% 4%
Thailand 83% 15% 2% 41% 18% 21% 20% 20% 16% 20% 47% 19% 4%
Turkey 45% 54% 1% 19% 13% 7% 15% 10% 7% 6% 15% 11% 0%
Ukraine 69% 12% 19% 41% 10% 4% 8% 11% 19% 5% 26% 9% 4%
USA 62% 37% 1% 37% 14% 8% 16% 9% 21% 7% 22% 16% 2%
Vietnam 86% 13% 1% 39% 27% 31% 19% 23% 18% 16% 27% 23% 0%
Global 70% 26% 4% 41% 12% 8% 15% 13% 16% 8% 29% 16% 3%

Friendliness QUESTION 5

Amway Global Entrepreneurship Report
#AGER2015 36
QUESTION 5: ENTREPRENEURSHIP-FRIENDLINESS OF SOCIETY
OF LATVIAN RESPONDENTS RATE
THEIR SOCIETY
ENTREPRENEURSHIP-FRIENDLY
49 %
• Overall friendliness: Almost half of the respondents state their country to be
entrepreneurship-friendly (49%). Globaly: 50%, Europe:
46%.
• Friendliness by gender: Male respondents rate the Latvian society as friendly
as their female counterparts
• female: 49% entrepreneurship-friendly;
• male: 51% entrepreneurship-friendly.
• Friendliness by age groups: The age groups have a similar opinion concerning
the entrepreneurship-friendliness of their country.
• Under 35 years: (50% entrepreneurship-friendly)
• 35 to 49 years: (49% entrepreneurship-friendly)
• Over 50 years: (50% entrepreneurship-friendly)

Amway Global Entrepreneurship Report
#AGER2015 37
55%
61%
47%
34%
QUESTION 5: ENTREPRENEURSHIP-FRIENDLINESS OF SOCIETY
46%
43%
37%
EUROPE
NORTH AMERICA
LATIN AMERICA
63%
ASIA
49% 45%
LATVIA
50% 43%
GLOBAL

Amway Global Entrepreneurship Report
#AGER2015 38
QUESTION 5: ENTREPRENEURSHIP-FRIENDLINESS OF SOCIETY
A SELECTION OF BALTIC AND CEE COUNTRIES
Very friendly Friendly Unfriendly Very unfriendly Sum (friendly) Sum
(unfriendly) No Answer
Bulgaria 1% 7% 38% 42% 8% 80% 12% Croatia 3% 34% 33% 23% 37% 56% 7% Czech Republic 7% 43% 35% 8% 50% 43% 7% Estonia 8% 50% 26% 11% 58% 37% 5%
Hungary 3% 17% 43% 32% 20% 75% 5% Latvia 5% 44% 37% 8% 49% 45% 6% Lithuania 2% 42% 44% 8% 44% 52% 4% Poland 5% 49% 30% 9% 54% 39% 7% Romania 2% 17% 34% 26% 19% 60% 21% Slovakia 5% 29% 38% 18% 34% 56% 10% Slovenia 1% 23% 53% 22% 24% 75% 1%
Baltics & CEE 4% 32% 37% 19% 36% 56% 8% Global 11% 39% 30% 13% 50% 43% 7%

Amway Global Entrepreneurship Report
#AGER2015 39
QUESTION 5: ENTREPRENEURSHIP-FRIENDLINESS OF SOCIETY
Very friendly Friendly Unfriendly Very unfriendly Sum (friendly) Sum (unfriendly) No Answer
Australia 16% 49% 21% 4% 65% 25% 10%
Austria 8% 41% 27% 12% 49% 39% 12%
Belgium 7% 51% 27% 10% 58% 37% 5%
Brazil 5% 28% 48% 17% 33% 65% 2%
Bulgaria 1% 7% 38% 42% 8% 80% 12%
Canada 4% 14% 56% 22% 18% 78% 4%
China 7% 66% 23% 3% 73% 26% 1%
Colombia 4% 24% 32% 38% 28% 70% 2%
Croatia 3% 34% 33% 23% 37% 56% 7%
Czech Republic 7% 43% 35% 8% 50% 43% 7%
Denmark 25% 59% 11% 2% 84% 13% 3%
Estonia 8% 50% 26% 11% 58% 37% 5%
Finland 4% 46% 41% 7% 50% 48% 2%
France 5% 38% 32% 17% 43% 49% 8%
Germany 7% 37% 37% 8% 44% 45% 11%
Global 11% 39% 30% 13% 50% 43% 7%

Amway Global Entrepreneurship Report
#AGER2015 40
QUESTION 4: THE FEAR OF FAILURE
Yes No No
Answer
Financial
burdens
Disappointing
my family
Reputation
loss
Personal
disappointment
Take over the
responsibility
Legal
consequences
Not to be given
a second
chance
Threat of the
economic
crisis
Threat of
unemployment Others
Great Britain 57% 41% 2% 34% 6% 5% 15% 6% 11% 3% 16% 18% 3%
Greece 84% 15% 1% 39% 5% 3% 10% 6% 14% 3% 49% 14% 2%
Hungary 86% 6% 8% 57% 13% 7% 20% 19% 22% 6% 42% 24% 8%
India 90% 7% 3% 46% 30% 30% 28% 25% 26% 20% 42% 22% 3%
Ireland 70% 20% 10% 28% 6% 8% 14% 12% 13% 7% 24% 17% 3%
Italy 90% 7% 3% 39% 15% 7% 19% 14% 14% 8% 46% 18% 3%
Japan 94% 5% 1% 67% 13% 4% 8% 44% 19% 4% 28% 28% 5%
Korea 88% 1% 11% 59% 35% 12% 26% 13% 13% 22% 48% 16% 0%
Latvia 58% 41% 1% 41% 8% 5% 8% 6% 20% 3% 25% 12% 0%
Lithuania 64% 34% 2% 40% 10% 5% 11% 8% 18% 5% 20% 12% 2%
Malaysia 76% 21% 3% 34% 16% 16% 13% 11% 14% 16% 33% 16% 10%
Mexico 87% 12% 1% 32% 16% 13% 18% 14% 19% 15% 32% 20% 1%
Netherlands 32% 65% 3% 17% 2% 1% 5% 6% 4% 3% 13% 9% 1%
Norway 49% 48% 3% 28% 7% 4% 9% 4% 9% 2% 25% 8% 3%
Poland 71% 22% 7% 33% 9% 8% 16% 17% 19% 10% 26% 21% 0%
Global 70% 26% 4% 41% 12% 8% 15% 13% 16% 8% 29% 16% 3%

Amway Global Entrepreneurship Report
#AGER2015 41
QUESTION 5: ENTREPRENEURSHIP-FRIENDLINESS OF SOCIETY
Very friendly Friendly Unfriendly Very unfriendly Sum (friendly) Sum (unfriendly) No Answer
Portugal 2% 14% 42% 31% 16% 73% 11%
Romania 2% 17% 34% 26% 19% 60% 21%
Russia 9% 47% 24% 4% 56% 28% 16%
Slovakia 5% 29% 38% 18% 34% 56% 10%
Slovenia 1% 23% 53% 22% 24% 75% 1%
South Africa 44% 34% 10% 4% 78% 14% 8%
Spain 7% 26% 43% 23% 33% 66% 1%
Sweden 8% 62% 23% 5% 70% 28% 2%
Switzerland 11% 55% 22% 4% 66% 26% 8%
Thailand 30% 48% 17% 4% 78% 21% 1%
Turkey 15% 38% 26% 7% 53% 33% 14%
Ukraine 10% 33% 28% 8% 43% 36% 21%
USA 28% 39% 18% 13% 67% 31% 2%
Vietnam 22% 51% 21% 4% 73% 25% 2%
Global 11% 39% 30% 13% 50% 43% 7%

Characteristics QUESTION 6

Amway Global Entrepreneurship Report
#AGER2015 43
QUESTION 6: CHARACTERISTICS OF ENTREPRENEURS
ENTREPRENEURS...
„... LIKE TO LEARN
THINGS.“
90%/82%/84%
LATVIA/EUROPE/GLOBAL
„... WANT TO ENJOY
LIFE.“
„... LIKE TO BE IN
CHARGE, AND TELL
OTHERS WHAT TO
DO.“
90%/80%/78%
LATVIA/EUROPE/GLOBAL
83%/74%/75%
LATVIA/EUROPE/GLOBAL

Amway Global Entrepreneurship Report
#AGER2015 44
QUESTION 6: CHARACTERISTICS OF ENTREPRENEURS
A SELECTION OF BALTIC AND CEE COUNTRIES
“…like to be in
charge”
“…like to
impress”
“…want to enjoy
life”
“…like to take
risks”
“…like to learn
things”
“…want justice
for everybody”
“…want to help
people”
“… are
traditional”
“…think people
should follow
rules”
“…think safety is
very important”
Bulgaria 89% 81% 84% 74% 75% 40% 40% 40% 44% 56% Croatia 70% 82% 86% 64% 71% 32% 40% 46% 47% 62% Czech Republic 84% 82% 85% 73% 70% 41% 49% 45% 57% 73% Estonia 77% 71% 85% 62% 91% 46% 66% 51% 61% 77%
Hungary 59% 77% 88% 73% 72% 55% 35% 28% 38% 41% Latvia 83% 72% 90% 60% 90% 53% 60% 64% 53% 79% Lithuania 79% 62% 92% 70% 89% 70% 54% 57% 65% 75% Poland 72% 73% 78% 65% 71% 47% 49% 53% 64% 59% Romania 79% 73% 79% 62% 79% 48% 49% 45% 69% 61% Slovakia 81% 82% 84% 74% 65% 40% 46% 41% 55% 64% Slovenia 84% 71% 84% 71% 93% 50% 65% 57% 59% 75%
Baltics & CEE 78% 75% 85% 68% 79% 47% 50% 48% 56% 66% Global 75% 68% 78% 70% 84% 54% 62% 48% 60% 70%

Amway Global Entrepreneurship Report
#AGER2015 45
QUESTION 6: CHARACTERISTICS OF ENTREPRENEURS
“…like to be in
charge”
“…like to
impress”
“…want to enjoy
life”
“…like to take
risks”
“…like to learn
things”
“…want justice
for everybody”
“…want to help
people”
“… are
traditional”
“…think people
should follow
rules”
“…think safety is
very important”
Australia 72% 71% 89% 82% 87% 47% 61% 35% 41% 65%
Austria 71% 57% 63% 61% 66% 44% 53% 55% 51% 57%
Belgium 77% 68% 77% 66% 88% 49% 64% 47% 56% 70%
Brazil 72% 68% 68% 63% 95% 64% 69% 53% 80% 87%
Bulgaria 89% 81% 84% 74% 75% 40% 40% 40% 44% 56%
Canada 73% 76% 91% 86% 95% 57% 77% 39% 54% 71%
China 82% 82% 81% 84% 93% 64% 75% 36% 80% 83%
Colombia 64% 62% 95% 76% 98% 81% 88% 52% 70% 92%
Croatia 70% 82% 86% 64% 71% 32% 40% 46% 47% 62%
Czech Republic 84% 82% 85% 73% 70% 41% 49% 45% 57% 73%
Denmark 64% 63% 74% 92% 97% 59% 72% 22% 49% 61%
Estonia 77% 71% 85% 62% 91% 46% 66% 51% 61% 77%
Finland 72% 57% 79% 57% 91% 47% 69% 56% 57% 79%
France 76% 61% 75% 68% 83% 40% 53% 53% 63% 68%
Germany 86% 56% 60% 61% 73% 31% 39% 51% 49% 55%
Global 75% 68% 78% 70% 84% 54% 62% 48% 60% 70%

Amway Global Entrepreneurship Report
#AGER2015 46
QUESTION 6: CHARACTERISTICS OF ENTREPRENEURS
“…like to be in
charge”
“…like to
impress”
“…want to enjoy
life”
“…like to take
risks”
“…like to learn
things”
“…want justice
for everybody”
“…want to help
people”
“… are
traditional”
“…think people
should follow
rules”
“…think safety is
very important”
Great Britain 69% 73% 87% 82% 85% 42% 62% 40% 45% 58%
Greece 77% 65% 87% 70% 88% 56% 62% 57% 76% 64%
Hungary 59% 77% 88% 73% 72% 55% 35% 28% 38% 41%
India 94% 82% 91% 68% 89% 84% 90% 85% 90% 91%
Ireland 66% 70% 84% 75% 87% 70% 76% 58% 70% 74%
Italy 78% 73% 76% 76% 83% 53% 46% 44% 63% 67%
Japan 68% 40% 51% 41% 69% 21% 29% 15% 30% 24%
Korea 70% 62% 54% 60% 73% 47% 50% 41% 56% 62%
Latvia 83% 72% 90% 60% 90% 53% 60% 64% 53% 79%
Lithuania 79% 62% 92% 70% 89% 70% 54% 57% 65% 75%
Malaysia 72% 66% 91% 77% 93% 77% 87% 54% 76% 88%
Mexico 72% 69% 80% 71% 80% 74% 74% 68% 70% 76%
Netherlands 74% 71% 78% 82% 85% 47% 64% 37% 67% 64%
Norway 73% 54% 57% 69% 94% 52% 67% 20% 57% 70%
Poland 72% 73% 78% 65% 71% 47% 49% 53% 64% 59%
Global 75% 68% 78% 70% 84% 54% 62% 48% 60% 70%

Amway Global Entrepreneurship Report
#AGER2015 47
QUESTION 6: CHARACTERISTICS OF ENTREPRENEURS
“…like to be in
charge”
“…like to
impress”
“…want to enjoy
life”
“…like to take
risks”
“…like to learn
things”
“…want justice
for everybody”
“…want to help
people”
“… are
traditional”
“…think people
should follow
rules”
“…think safety is
very important”
Portugal 79% 64% 76% 79% 88% 61% 67% 61% 79% 79%
Romania 79% 73% 79% 62% 79% 48% 49% 45% 69% 61%
Russia 80% 71% 80% 63% 75% 41% 47% 46% 39% 62%
Slovakia 81% 82% 84% 74% 65% 40% 46% 41% 55% 64%
Slovenia 84% 71% 84% 71% 93% 50% 65% 57% 59% 75%
South Africa 82% 83% 88% 86% 91% 82% 85% 67% 83% 86%
Spain 62% 55% 82% 60% 87% 67% 72% 47% 58% 77%
Sweden 52% 61% 78% 77% 93% 43% 68% 32% 47% 62%
Switzerland 84% 48% 54% 64% 85% 38% 50% 45% 55% 76%
Thailand 82% 78% 68% 61% 82% 78% 81% 61% 82% 85%
Turkey 73% 66% 61% 58% 63% 57% 59% 53% 59% 62%
Ukraine 78% 72% 77% 58% 65% 47% 48% 49% 46% 62%
USA 64% 70% 96% 89% 95% 66% 80% 40% 61% 80%
Vietnam 67% 55% 67% 67% 94% 72% 82% 48% 85% 82%
Global 75% 68% 78% 70% 84% 54% 62% 48% 60% 70%
