powerpoint presentation cement... · kiln & cooler cement mill packing plant mines muddapur...
TRANSCRIPT

© Confederation of Indian Industry
Umashankar Choudhary Sr. GM ProductionAnil Gupta Sr. GM MechanicalGopal Gupta Dy. Manager Process
19th National Award for Excellence in Energy Management 2018
1
© Confederation of Indian Industry2
J.K. Cement Ltd. is part of the conglomerate of JK Organization the Companyis promoted by Mr. Yadupati Singhania and (Late) Dr. Gaur Hari Singhania. Thegroup entered the cement manufacturing business in 1975.
One of the largest white cement manufacturer in the World with 1.20MTPA capacity including 0.60 MTPA White Cement Plant at Fujairahcommissioned in Mar. 2014. Also 2nd largest producer of wall putty inIndia with installed capacity of 0.50 MTPA.
Highly reputed brand with extensive nation-wide distribution,expanded domestic grey cement capacity to 10.50 MTPA
JK Cement Muddapur is one of the integrated Grey Cement plant of JKGroup. Plant is situated at Karnataka state in India, having Capacity of2.20 MTPA Clinkerisation & 3.50 MTPA Finished Cement Grinding.
J K Cement Muddapur is certified with ISO 14001, ISO 9001 OHSAS 18001 &ISO 50001:2011
Brief introduction

© Confederation of Indian Industry
Process Flow & Major Equipment Specification
Mining & Crushing
Raw Mill & Coal Mill
Kiln & Cooler
Cement Mill
Packing Plant
MinesMuddapur161.87HectareHalki124.24HectareCrusherMake- L&T 900 TPHLS StackerMake-FLS1000 TPH LS ReclaimerMake FLS700 TPH
Raw MillVRM- FLSATOX- 52.5540 TPHCoal MillVRM- FLSATOX- 25.050 TPH SA CoalCoal Stacker Make- FLS130 TPHCoal ReclaimerMake FLS100 TPH
KilnFLSmidthILC- 4.75ǾX745500 TPDCalcinerLow NOxILC- 8.5ǾX52 Mtr.Cooler- FLSCross bar 4X6138.8 M2AFRSchenck Process20 TPH
Mill-01FLSmidthBall Mill 4.6 Ǿ140 TPH OPCMill-02FLSmidthBall Mill 4.6 Ǿ140 TPH OPCMill-03Gebr. PfeifferVRM- MPS 5600160 TPH Slag
PKR 1-4EEL India Ltd.12 Spout Double Discharge180 TPH
3
© Confederation of Indian Industry
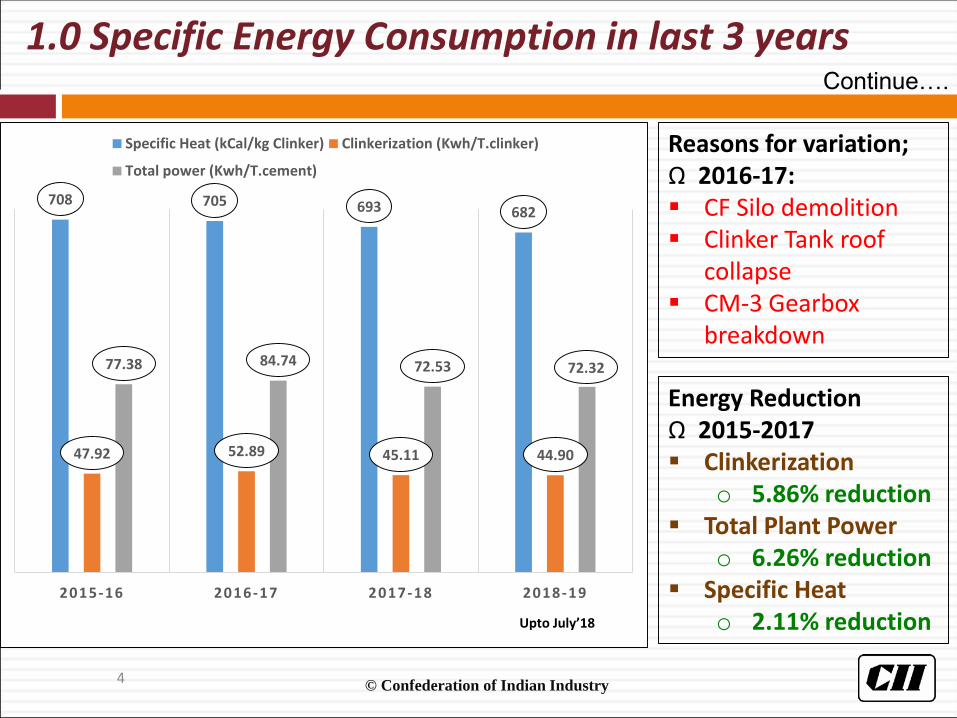
1.0 Specific Energy Consumption in last 3 years
Reasons for variation;Ω 2016-17: CF Silo demolition Clinker Tank roof
collapse CM-3 Gearbox
breakdown
708 705 693 682
47.92 52.89 45.11 44.90
77.38 84.74 72.53 72.32
2015-16 2016-17 2017-18 2018-19
Specific Heat (kCal/kg Clinker) Clinkerization (Kwh/T.clinker)
Total power (Kwh/T.cement)
Upto July’18
Energy ReductionΩ 2015-2017 Clinkerization
o 5.86% reduction Total Plant Power
o 6.26% reduction Specific Heat
o 2.11% reduction
Continue….
4

© Confederation of Indian Industry5
33.60
38.36
34.34
35.46
33.00
34.00
35.00
36.00
37.00
38.00
39.00
2015-16 2016-17 2017-18 2018-19
Cement grinding (Kwh/T.cem)
1.0 Specific Energy Consumption in last 3 years
Reasons for variation;Ω 2016-17: CM-3 G.box break down Mill load restricted to run
below 65% for 05 MonthΩ 2017-18: PSC grinding increased from 17
% ( 3.08 Lac. MT) to 24 % ( 3.95 Lac. MT)
During monthly Kiln stoppage PSC grinding in Ball Mill.
HAG( Oil based) restriction for continuous running to save liquid fuel
Cement Grinding Performance
© Confederation of Indian Industry6
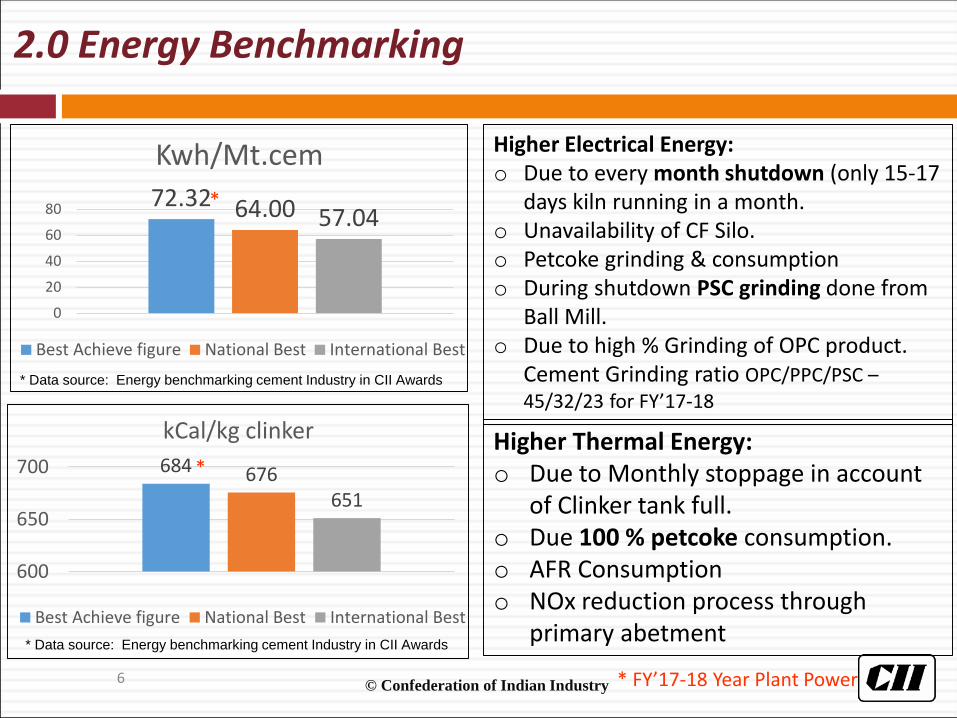
Higher Electrical Energy:o Due to every month shutdown (only 15-17
days kiln running in a month.o Unavailability of CF Silo.o Petcoke grinding & consumptiono During shutdown PSC grinding done from
Ball Mill.o Due to high % Grinding of OPC product.
Cement Grinding ratio OPC/PPC/PSC –45/32/23 for FY’17-18
Higher Thermal Energy:o Due to Monthly stoppage in account
of Clinker tank full.o Due 100 % petcoke consumption.o AFR Consumptiono NOx reduction process through
primary abetment
72.32 64.00 57.04
0
20
40
60
80
Kwh/Mt.cem
Best Achieve figure National Best International Best
684 676651
600
650
700
kCal/kg clinker
Best Achieve figure National Best International Best
2.0 Energy Benchmarking
* Data source: Energy benchmarking cement Industry in CII Awards
* Data source: Energy benchmarking cement Industry in CII Awards
* FY’17-18 Year Plant Power
*
*

© Confederation of Indian Industry
2.1 Road Map to achieve benchmark-National/Global (FY’2018-2020)
Internal Benchmark
• Goal set by Management
• KPI
Kaizen
• Tool for Improvement
• Employee Motivation
Innovative Projects
• For cost reduction
• MTBF improvement
Brainstorming
• Involvement of Employee
• Development of ideas
Process Audit
• Third party audits
• Internal Audit
Technology Upgradation
• For plant improvement
• Sustainability
Continue….
7
Road Map

© Confederation of Indian Industry8
26 13 21 22 14 13 20
0
50
Total ideas implemented (2017-18)
KPI’s in Clinkerization
Sp. Power up to Clinkerization Sp. Thermal Energy (NCV)Kiln MTBF AFR (Phase-1)C3S Clinker 1D strengthRaw mill MTBF
16 11 208 11
0
50
Total ideas implemented (2017-18)
KPI’s in Grinding
Sp. Power of CM2 Sp. Power of CM3 CM-3 MTBF
PPC Clinker Factor PSC Clinker Factor
8 89
789
10
Total ideas implemented (2017-18)
KPI’s in CPP
Station Heat Rate Plant Load factor
Auxiliary Power consumption
14 14
-5
5
15
25
Total ideas implemented (2017-18)
KPI’s in Packing Plant
Sp. Power Packing Plant Bag Burstage Packing plant
2.1 Involvement of Employees in Plant Performance
© Confederation of Indian Industry
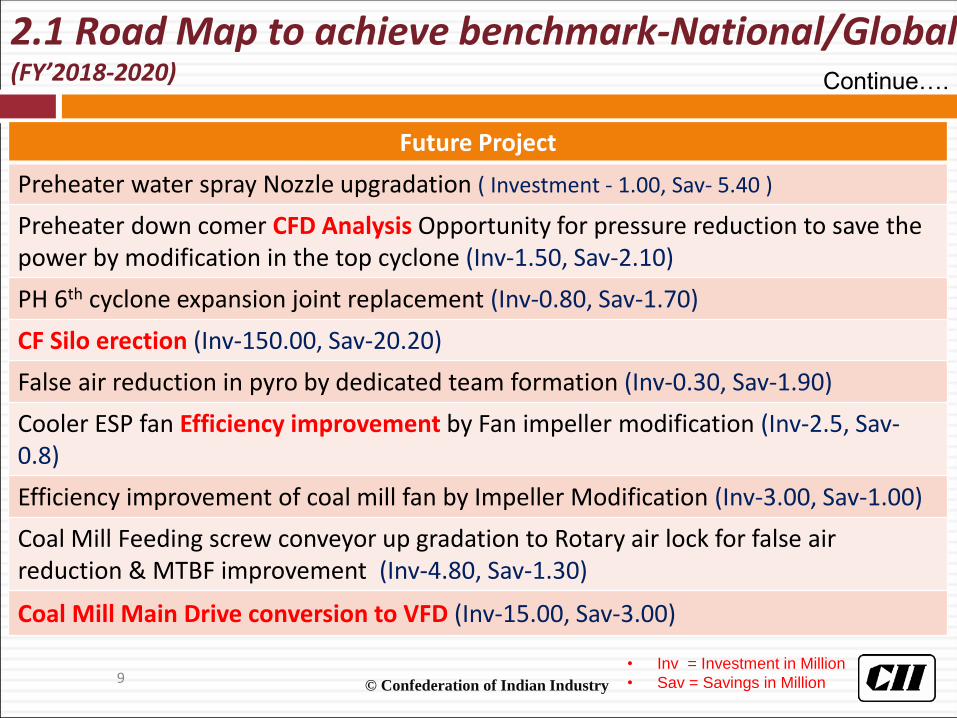
2.1 Road Map to achieve benchmark-National/Global (FY’2018-2020)
Future Project
Preheater water spray Nozzle upgradation ( Investment - 1.00, Sav- 5.40 )
Preheater down comer CFD Analysis Opportunity for pressure reduction to save the power by modification in the top cyclone (Inv-1.50, Sav-2.10)
PH 6th cyclone expansion joint replacement (Inv-0.80, Sav-1.70)
CF Silo erection (Inv-150.00, Sav-20.20)
False air reduction in pyro by dedicated team formation (Inv-0.30, Sav-1.90)
Cooler ESP fan Efficiency improvement by Fan impeller modification (Inv-2.5, Sav-0.8)
Efficiency improvement of coal mill fan by Impeller Modification (Inv-3.00, Sav-1.00)
Coal Mill Feeding screw conveyor up gradation to Rotary air lock for false air reduction & MTBF improvement (Inv-4.80, Sav-1.30)
Coal Mill Main Drive conversion to VFD (Inv-15.00, Sav-3.00)
• Inv = Investment in Million
• Sav = Savings in Million
Continue….
9
© Confederation of Indian Industry
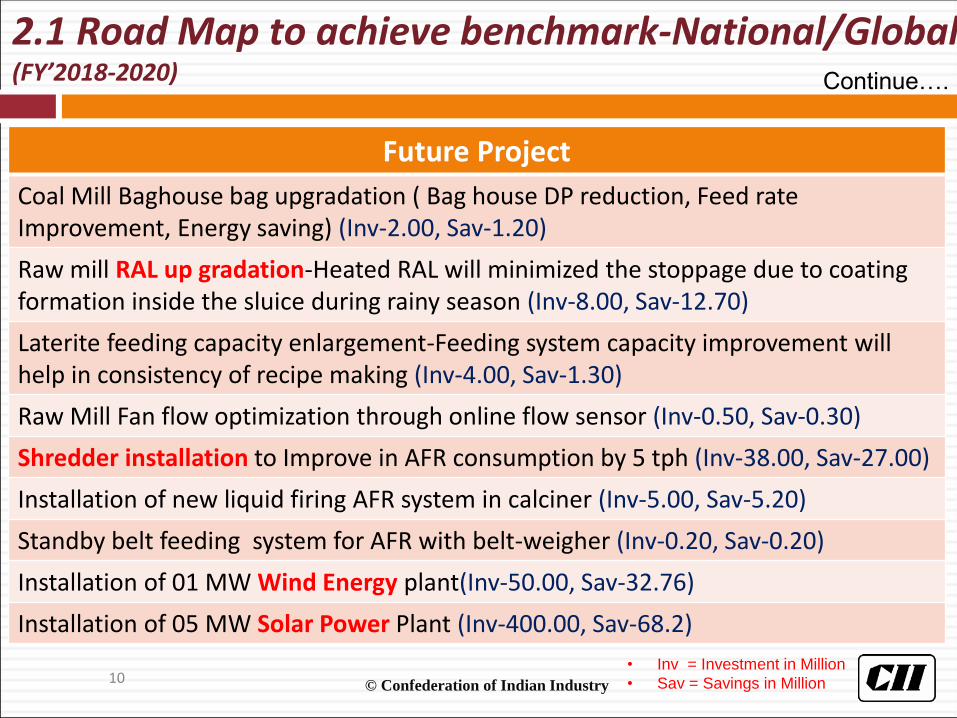
Future Project
Coal Mill Baghouse bag upgradation ( Bag house DP reduction, Feed rate Improvement, Energy saving) (Inv-2.00, Sav-1.20)
Raw mill RAL up gradation-Heated RAL will minimized the stoppage due to coating formation inside the sluice during rainy season (Inv-8.00, Sav-12.70)
Laterite feeding capacity enlargement-Feeding system capacity improvement will help in consistency of recipe making (Inv-4.00, Sav-1.30)
Raw Mill Fan flow optimization through online flow sensor (Inv-0.50, Sav-0.30)
Shredder installation to Improve in AFR consumption by 5 tph (Inv-38.00, Sav-27.00)
Installation of new liquid firing AFR system in calciner (Inv-5.00, Sav-5.20)
Standby belt feeding system for AFR with belt-weigher (Inv-0.20, Sav-0.20)
Installation of 01 MW Wind Energy plant(Inv-50.00, Sav-32.76)
Installation of 05 MW Solar Power Plant (Inv-400.00, Sav-68.2)
2.1 Road Map to achieve benchmark-National/Global (FY’2018-2020) Continue….
• Inv = Investment in Million
• Sav = Savings in Million10

© Confederation of Indian Industry
Future Project
Pre-grinder/ Crusher installation for Ball Mill productivity improvement & power reduction. (Inv-20.00, Sav-10.00)
CM-1 & CM-2( ball Mills), CFD analysis for separator circuit in account of pressure drop & dust circulation reduction. (Inv-1.20, Sav-0.90)
Installation of 4th hopper in CM-3 for addition Pond-ash/Slag for improving the clinker factor & consistency of Mill operation. (Inv-16.50, Sav-9.50)
CM-3( VRM) Hot air booster fan efficiency improvement (Inv-4.00, Sav-2.20)
Cement Silo-01 Elevator capacity upgradation (Inv-3.50, Sav-4.20)
Coal based HAG installation (Inv-60.00, Sav-20.50)
Procuring of bobcat machine for cleaning /de-breaking. (Inv-2.50, Sav-2.20)
Roof top solar power installation in Plant & Colony (Inv-1.00, Sav-2.80)
Approx. Total Investment Rs = 800.70 Million, Saving Rs= 300.40 Million
2.1 Road Map to achieve benchmark-National/Global (FY’2018-2020)
• Inv = Investment in Million
• Sav = Savings in Million11

© Confederation of Indian Industry12
2.1 Brainstorming sessions on “Energy Reduction”

© Confederation of Indian Industry
3.0 Encon Last 3 yrs Projects Summary (FY’2015-2017*)
Particular Units
Investment Category
Without Investment
Marginal**Investment
Medium Investment
Total
No of Project Implemented
Nos. 34.00 40.00 35.00 109.00
Electrical Energy saved
Million kWh
1.53 1.27 8.71 11.51
Thermal Energy saved
MillionKcal
3069.00 4324.00 8274.00 15667.00
** Marginal investment ≤ 1.00 Lacs
13
*FY’(2015-2016-2017)

© Confederation of Indian Industry14
Title of projectElectrical
Million KwhThermal MKcal
Saving (Million Rs.)
CM-1&2 transport bag filter stopped during Slag/ Pond ash feeding.
0.04 - 0.24
CM1&2 Mill vent fan damper removed & resulted reduction in pressure drop.
0.02 - 0.08
CM3, modification done in water injection nozzle and achieved reduction in Mill vibration stoppage as well as improvement in Mill stability.
0.02-
0.08
CM2, compressor air pressure optimizedfrom 6.5 to 5.5 bar.
0.05-
0.25
CM3, MD GRR cooling blowers run time reduced for energy conservation.
0.001 0.01
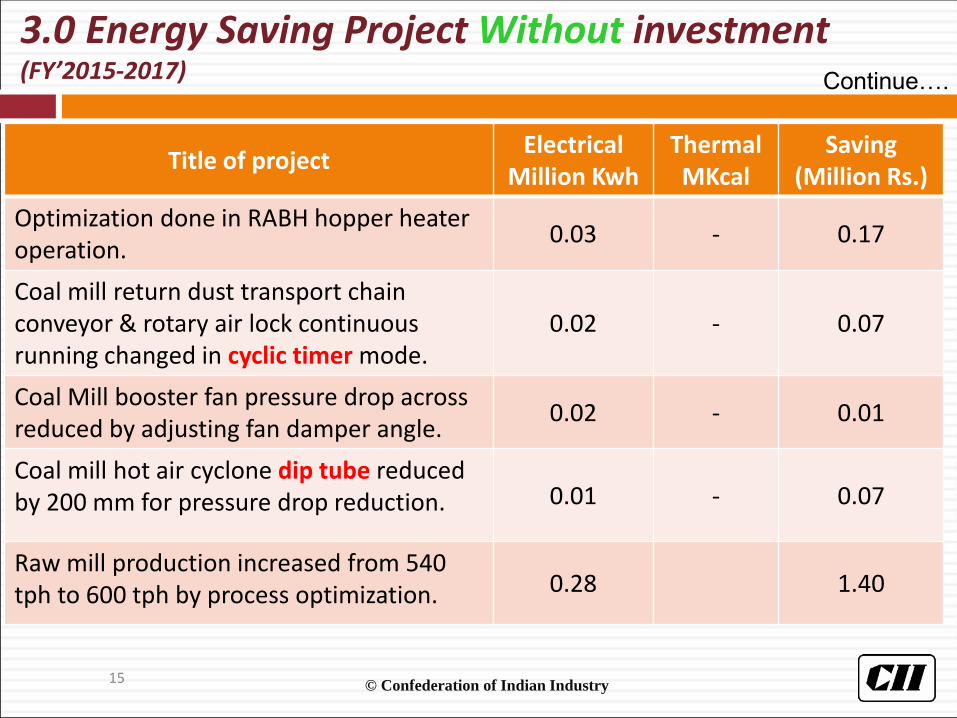
3.0 Energy Saving Project Without investment (FY’2015-2017)
© Confederation of Indian Industry15
Title of projectElectrical
Million KwhThermal MKcal
Saving (Million Rs.)
Optimization done in RABH hopper heater operation.
0.03 - 0.17
Coal mill return dust transport chain conveyor & rotary air lock continuous running changed in cyclic timer mode.
0.02 - 0.07
Coal Mill booster fan pressure drop across reduced by adjusting fan damper angle.
0.02 - 0.01
Coal mill hot air cyclone dip tube reduced by 200 mm for pressure drop reduction. 0.01 - 0.07
Raw mill production increased from 540 tph to 600 tph by process optimization. 0.28 1.40
3.0 Energy Saving Project Without investment (FY’2015-2017) Continue….

© Confederation of Indian Industry16
Title of projectElectrical
Million KwhThermal MKcal
Saving (Million Rs.)
RABH fan Auto PID operation to control PH fan outlet pressure.
0.22 1.19
RABH reverse air fan operation optimization.
0.04 0.21
Optimization of Raw Mill residue on 90 micron as well 212 micron.
0.02 0.13
Reduction of Raw Mill cyclone dip tube height by 200 mm.
0.05 0.29
Preheater False air reduction. 0.12 1530.00 2.50
Kiln optimization, Maintaining Oxygen % Max 3.0 % at PH outlet.
1.50 3069.00 4.19
3.0 Energy Saving Project Without investment (FY’2015-2017) Continue….
© Confederation of Indian Industry17
Title of projectElectrical
Million KwhThermal MKcal
Saving (Million Rs.)
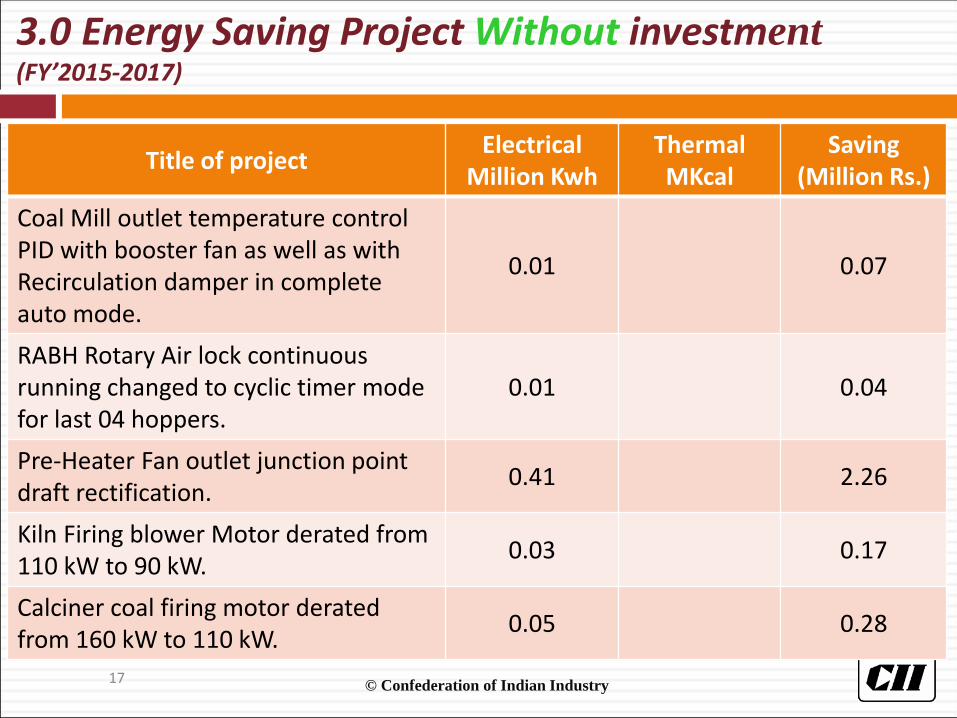
Coal Mill outlet temperature control PID with booster fan as well as with Recirculation damper in complete auto mode.
0.01 0.07
RABH Rotary Air lock continuousrunning changed to cyclic timer mode for last 04 hoppers.
0.01 0.04
Pre-Heater Fan outlet junction point draft rectification.
0.41 2.26
Kiln Firing blower Motor derated from 110 kW to 90 kW.
0.03 0.17
Calciner coal firing motor derated from 160 kW to 110 kW.
0.05 0.28
3.0 Energy Saving Project Without investment (FY’2015-2017)
© Confederation of Indian Industry18
Title of projectElectrical
Million KwhThermal MKcal
Saving(Million
Rs)
Investment (Million Rs.)
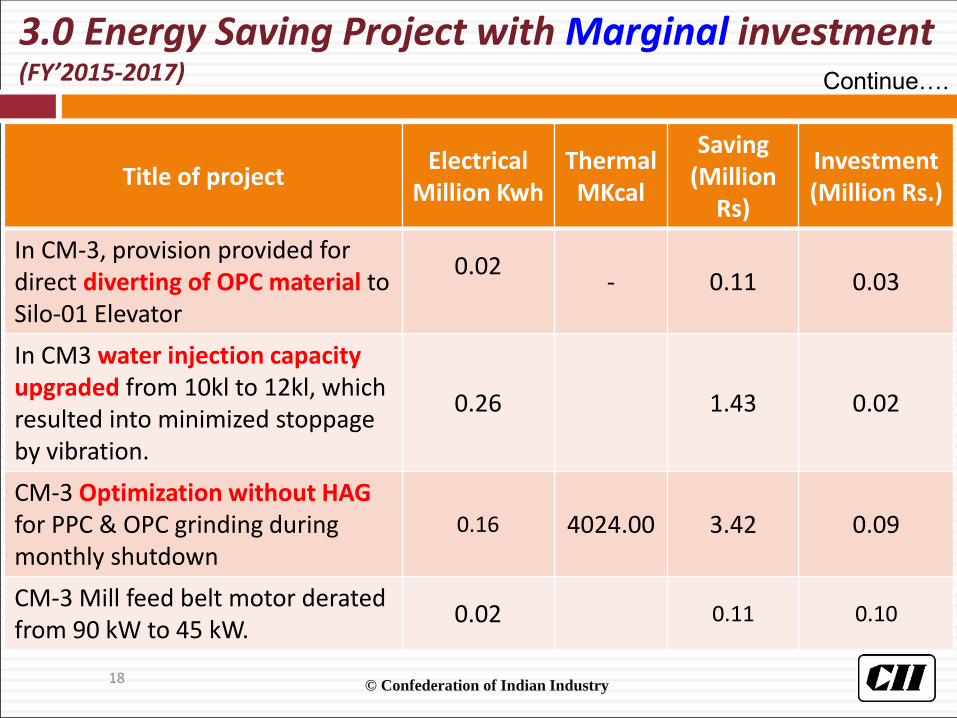
In CM-3, provision provided for direct diverting of OPC material to Silo-01 Elevator
0.02- 0.11 0.03
In CM3 water injection capacity upgraded from 10kl to 12kl, which resulted into minimized stoppage by vibration.
0.26 1.43 0.02
CM-3 Optimization without HAG for PPC & OPC grinding during monthly shutdown
0.16 4024.00 3.42 0.09
CM-3 Mill feed belt motor derated from 90 kW to 45 kW.
0.02 0.11 0.10
3.0 Energy Saving Project with Marginal investment (FY’2015-2017) Continue….
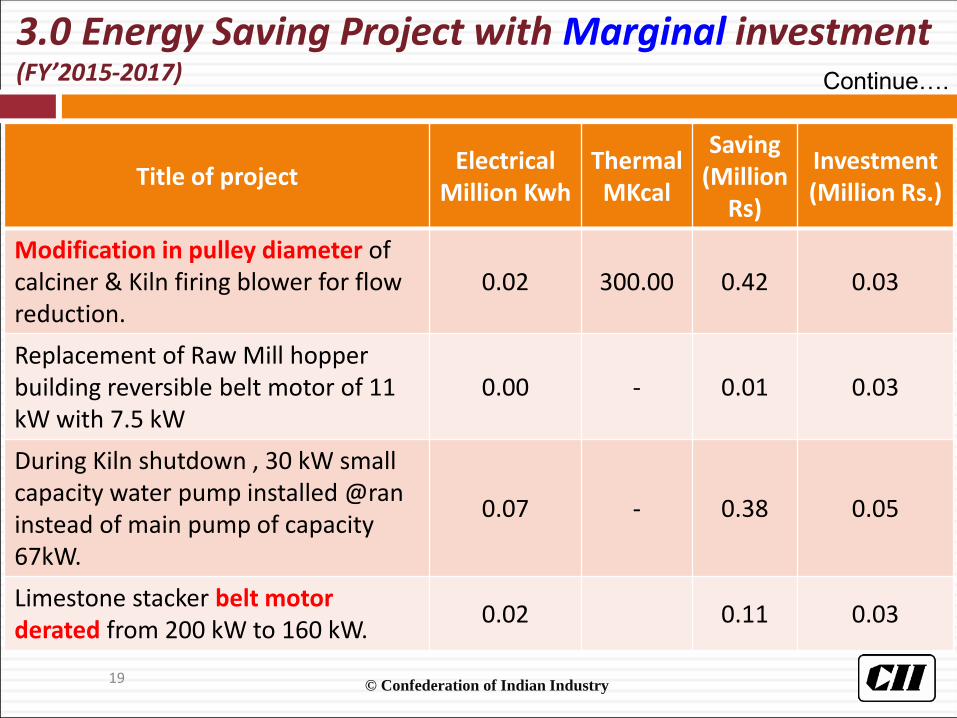
© Confederation of Indian Industry19
Title of projectElectrical
Million KwhThermal MKcal
Saving(Million
Rs)
Investment (Million Rs.)
Modification in pulley diameter of calciner & Kiln firing blower for flow reduction.
0.02 300.00 0.42 0.03
Replacement of Raw Mill hopper building reversible belt motor of 11 kW with 7.5 kW
0.00 - 0.01 0.03
During Kiln shutdown , 30 kW small capacity water pump installed @ran instead of main pump of capacity 67kW.
0.07 - 0.38 0.05
Limestone stacker belt motor derated from 200 kW to 160 kW.
0.02 0.11 0.03
3.0 Energy Saving Project with Marginal investment(FY’2015-2017) Continue….

© Confederation of Indian Industry20
Title of projectElectrical
Million KwhThermal MKcal
Saving(Million
Rs)
Investment (Million Rs.)
Raw Mill & Coal Mill False airreduction 0.03 0.16 0.08
Kiln feed Circuit Bag filter Optimization, suction line interconnected ( 01 Bag filter completely stopped)
0.02 0.08 0.02
Transport circuit Bag filter ( 535FN642) Motor replaced with low RPM motor.
0.02 0.09 0.04
Installed 67 kW water pump in place of 02 pump ( 55 kW & 33.5 kW)
0.16 0.88 0.10
3.0 Energy Saving Project with Marginal investment(FY’2015-2017)
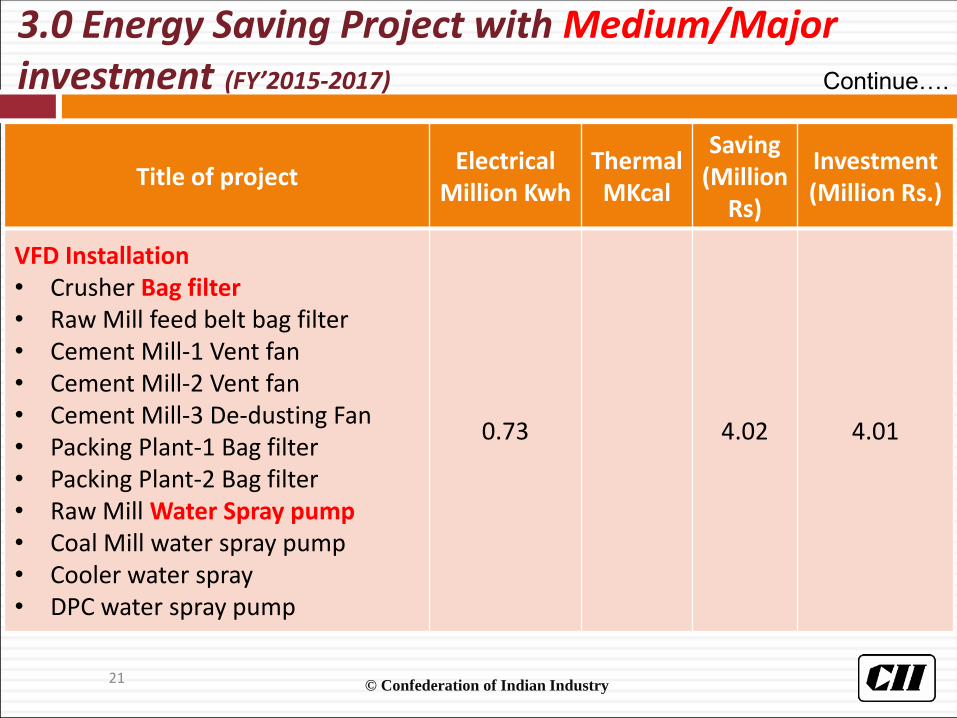
© Confederation of Indian Industry21
Title of projectElectrical
Million KwhThermal MKcal
Saving(Million
Rs)
Investment (Million Rs.)
VFD Installation• Crusher Bag filter• Raw Mill feed belt bag filter• Cement Mill-1 Vent fan• Cement Mill-2 Vent fan• Cement Mill-3 De-dusting Fan• Packing Plant-1 Bag filter• Packing Plant-2 Bag filter• Raw Mill Water Spray pump• Coal Mill water spray pump• Cooler water spray• DPC water spray pump
0.73 4.02 4.01
3.0 Energy Saving Project with Medium/Majorinvestment (FY’2015-2017) Continue….

© Confederation of Indian Industry22
Title of projectElectrical
Million KwhThermal MKcal
Saving(Million
Rs)
Investment (Million Rs.)
VFD Installation• CM-3 Feed Belt water Spray pump• Kiln Inlet seal Air Fan• Cement Silo-04 top Elevator• Cement Silo-01 Elevator• Dry Flyash Elevator
18.45 53.09 101.47 2.05
Application of Shell cooling fan at Kiln smoke chamber during shutdown instead of RABH fan
0.33 1.81 0.12
Coal Mill booster fan motor derated 0.02 0.11 0.22
Cooler Inlet CIS upgraded to ABC inlet
4.44 8274.00 32.63 20.00
3.0 Energy Saving Project with Medium/Majorinvestment (FY’2015-2017)
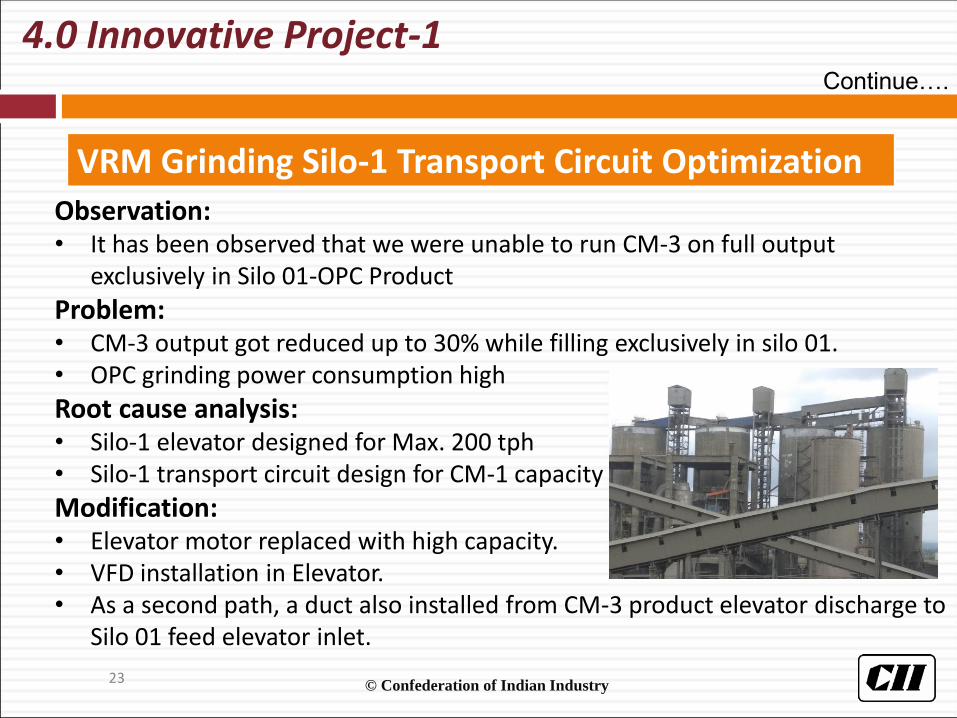
© Confederation of Indian Industry23
Observation:• It has been observed that we were unable to run CM-3 on full output
exclusively in Silo 01-OPC Product
Problem:• CM-3 output got reduced up to 30% while filling exclusively in silo 01.• OPC grinding power consumption high
Root cause analysis:
• Silo-1 elevator designed for Max. 200 tph • Silo-1 transport circuit design for CM-1 capacity
Modification:• Elevator motor replaced with high capacity.• VFD installation in Elevator.• As a second path, a duct also installed from CM-3 product elevator discharge to
Silo 01 feed elevator inlet.
4.0 Innovative Project-1
VRM Grinding Silo-1 Transport Circuit Optimization
Continue….

© Confederation of Indian Industry
Silo Model
OPC 2500 MT
OPC/ Composite 3750 MT
PSC3500 MT
PPC2500 MT
CM-1 CM-2 CM-3
Silo-1 Silo-2 Silo-3 Silo-4
Continue….
24
4.0 Innovative Project-1
Splitter

© Confederation of Indian Industry25
Original silo storage combination was OPC = Silo 1&2; PPC = Silo 3; PSC = Silo 4.
In earlier days maximum OPC requirement was fulfilled by CM-3 due to its lower
specific power(30-31 kWh/MT CMT) and high throughput(220-230 tph in Silo-02).
Due to load restriction in silo-1 feed elevator we used to spilt path of CM-3 OPC
product in 50-50 ratio to fill both silo 1 & silo 2.
During Silo inspection we found higher vibration level on the Silo-04 top, filling
stopped planned for its strengthening work.
Again silo filling scenario changed to OPC = Silo-1; PPC = Silo-2; PSC = Silo-3. as
despatch requirement is only 5000 MT/day.
Brainstorming done to overcome the situation. Finally we got the solution and we
implemented successfully
Found solution to increase throughput by increasing the motor capacity & RPM
through VFD
Summary:
Continue….
4.0 Innovative Project-1

© Confederation of Indian Industry
To increase throughput we have upgraded Elevator motor and installed VFD to
increase RPM by 13 %.
Saving calculation
Mill Output restriction eliminated. Mill feed increased by 30-40 tph.
Mill Power consumption reduction by 6-7 kWh/MT CMT.
Cost saving= 39483.00 X 0.80 X 12.00 X 6.50X 7.00 = Rs. 17.20 Millions
Elevator Parameter OLD Motor New Motor
Load 45.00 55.00
RPM 1500.00 1500.00
VFD - 1700 (RPM Increased)
G. Box Elecon KCH280, 45:1
Saving Calculation
26
4.0 Innovative Project-1

© Confederation of Indian Industry
Cement Mill-3, VRM Operation Optimization without HAG/Shutdown for Production of OPC & PPC
Observation:• During grinding of OPC/ PPC product without HAG we have faced the
problem of Mill tripping by High load or High vibration.• Grinding of OPC/PPC in CM-1/CM-2 Ball Mill is not economical as compare
to CM-3.• During process stoppages of Mill required HAG firing for startup.• Some times smell observed in Cement sample.• Due to operational issue Mill Stopped & Product grinding start in Ball Mill.
Continue….
4.1 Innovative Project-2
Root cause Analysis:• Low Nozzle Ring Velocity.
o Nozzle ring area measurement taken and calculated the velocity. Thevelocity found <38.05 M/Sec.
27
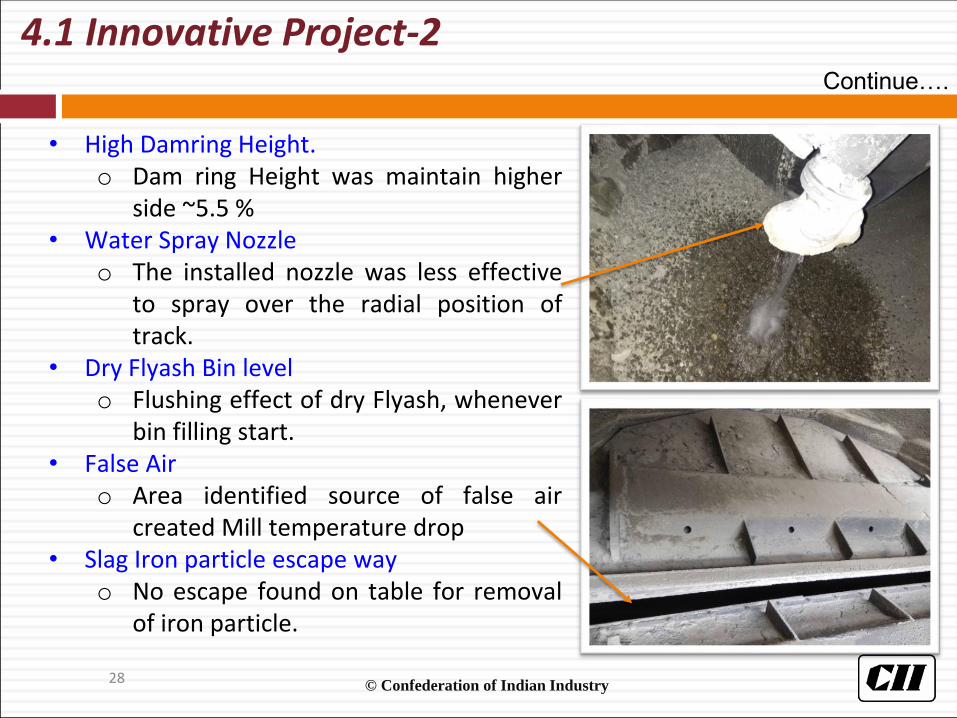
© Confederation of Indian Industry
• High Damring Height.o Dam ring Height was maintain higher
side ~5.5 %• Water Spray Nozzle
o The installed nozzle was less effectiveto spray over the radial position oftrack.
• Dry Flyash Bin levelo Flushing effect of dry Flyash, whenever
bin filling start.• False Air
o Area identified source of false aircreated Mill temperature drop
• Slag Iron particle escape wayo No escape found on table for removal
of iron particle.
Continue….
4.1 Innovative Project-2
28

© Confederation of Indian Industry
Modification:• Nozzle ring area reduced to get velocity ~43.2 M/Sec.• Dam ring height reduced to ~4.8 %• New water spray nozzle installed and spray patternimproved• Dry flyash bin level ON/OFF filling optimize to getminimum surging effect.• False air minimized by change of sealing, patchingwork etc.• Accumulation of Slag iron particle on table due tohigh density. Several slots were cut at the bottom ofdam ring to escape iron particle.• Auto action logic prepared to control vibrationtripping -H1 alarm login- Reduction of grinding pressurefor 10 sec. with change of pressure setpoint & parallelseparator speed reduction by 10%. Same operation willresume with auto step command for separator.
Continue….
4.1 Innovative Project-2
29

© Confederation of Indian Industry
Reduction in Shutdown grinding power consumption
Improvement in productivity as compare to Ball Mill( CM-1/CM-2)
HSD saving
Grinding performance during Kiln shutdown for 13 days
CM-1/2
OPC Grinding
PPC Grinding
Total Monthly Saving
Yearly saving
MT MT MT Million Millions
Before Modification 13200.00 16000.00 29200.00
0.10 1.26After Modification 11280.00 11293.00 22573.00
Difference 1920.00 4707.00 6627.00
Unit Saving, kWh 8832.00 10355.00 19187.00
Savings
4.1 Innovative Project-2
30

© Confederation of Indian Industry31
Observation:• It is been observed continuous formation of snowman at Cooler fixed inlet &
High Clinker temperature.
Problem:• Stoppages of kiln due to snowman formation.• Kiln output restricted to 5500 TPD, where potential of 6500TPD.• Low heat recovery which is leading to cooler in-efficiency.• High Clinker temperature• Red river formation
Root cause analysis/Study:
• High alkali and sulphur in Raw mix. & Petcoke respectively• High liquid, Mgo & low LSF in Raw mix.• Low heat recovery due to snowman formation.
Cooler Optimization with Help of Technology upgradation-Installation of ABC Inlet by FLSmidth
Continue….
4.2 Innovative Project-3
© Confederation of Indian Industry
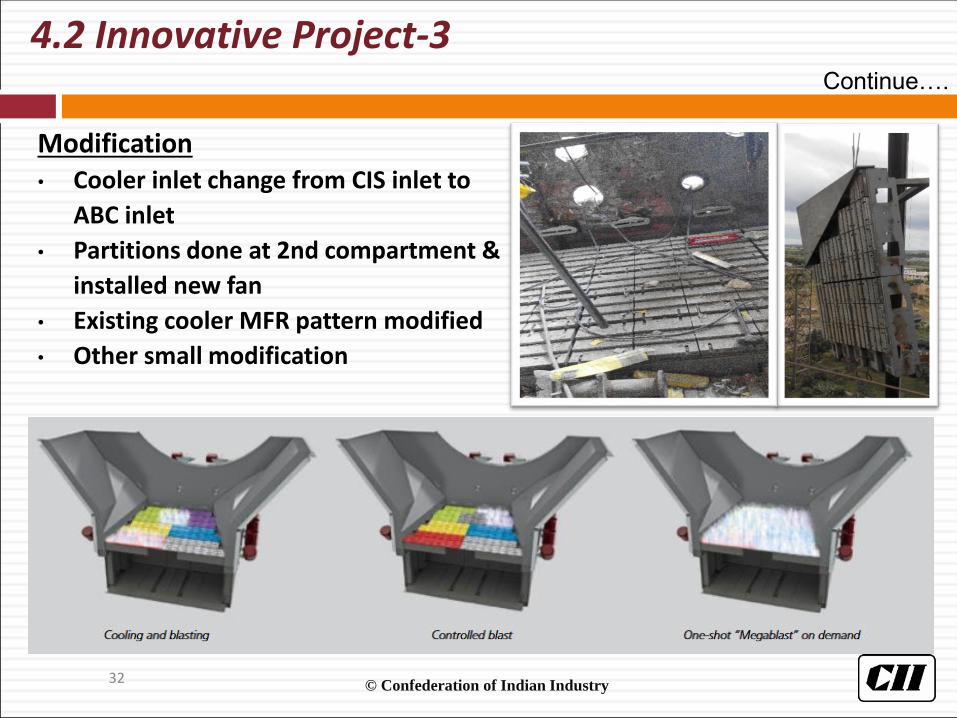
Modification• Cooler inlet change from CIS inlet to
ABC inlet
• Partitions done at 2nd compartment &
installed new fan
• Existing cooler MFR pattern modified
• Other small modification
Continue….
4.2 Innovative Project-3
32

© Confederation of Indian Industry33
Continue….
Comparison before and after cooler modification
Parameter UnitBefore cooler modification
After cooler modification
Production tpd 6538.00 6539.00Snowman formation # Frequent NilCooler fan power consumption Kwh/T of Clk 5.98 4.81Clinker temperature (DBC) Deg C 169.00 143.00Sec. air temp Deg C 1086.00 1106.00Ter. Air temp Deg C 936.00 1011.00Cooler vent loss Kcal/Kg Ck 105.00 91.40Cooler efficiency % 67.50 73.10Cooler vent temperature Deg C 376.00 360.02Cooler vent mass flow kg/kg Clk 1.11 1.02P.H exit temp Deg C 288.00 280.00P.H fan-1 power Kwh 985.00 851.00P.H fan-1 power Kwh 990.00 853.00Sp. Power consumption of P.H fan Kwh/T of Clk 7.25 6.26
4.2 Innovative Project-3
© Confederation of Indian Industry
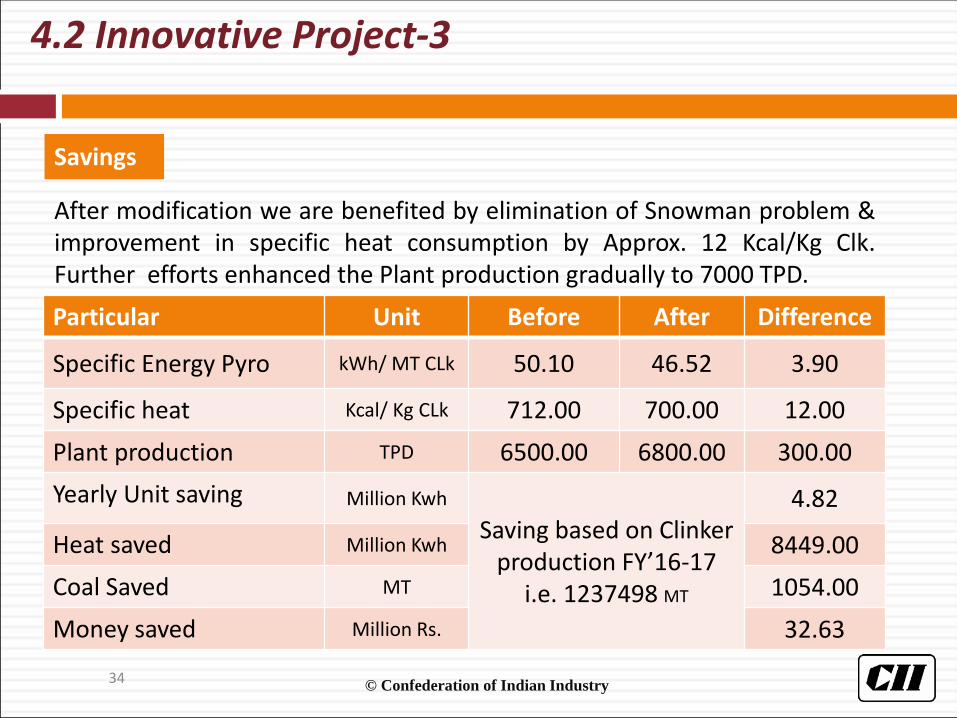
Particular Unit Before After Difference
Specific Energy Pyro kWh/ MT CLk 50.10 46.52 3.90
Specific heat Kcal/ Kg CLk 712.00 700.00 12.00
Plant production TPD 6500.00 6800.00 300.00
Yearly Unit saving Million Kwh
Saving based on Clinker production FY’16-17
i.e. 1237498 MT
4.82
Heat saved Million Kwh 8449.00
Coal Saved MT 1054.00
Money saved Million Rs. 32.63
After modification we are benefited by elimination of Snowman problem &improvement in specific heat consumption by Approx. 12 Kcal/Kg Clk.Further efforts enhanced the Plant production gradually to 7000 TPD.
Savings
4.2 Innovative Project-3
34

© Confederation of Indian Industry
5.0 Utilisation of renewable energy sources
2505.6 2509.63081
0
1000
2000
3000
4000
FY'2015-2016 FY'2016-2017 FY'2017-2018
Renewable Energy Used, kWh
Renewable Energy
UOM FY’17-18 FY’18-19July
RPO Non Solar Million Rs. 55.70 58.70
RPO Solar Million Rs. 3.70 7.60
New Installation Million Rs. 0.18 1.43
35

© Confederation of Indian Industry36
6.0 Utilization of waste for replacing the Conventional Fuel (FY’2015-2017)
2015-162016-17
2017-182018-19 (Upto July'18)
0
1000
2000
3000
4000
5000
6000
7000
8000
9000
10000
Mt % TSR
1,967.5
0.7
727.0
0.3
3,995.1
1.8
9,596.2
8.0
AFR Consumption
1497
1819
2662
0
500
1000
1500
2000
2500
3000
2015-16 2016-172017-18
Coal saved
MT
© Confederation of Indian Industry
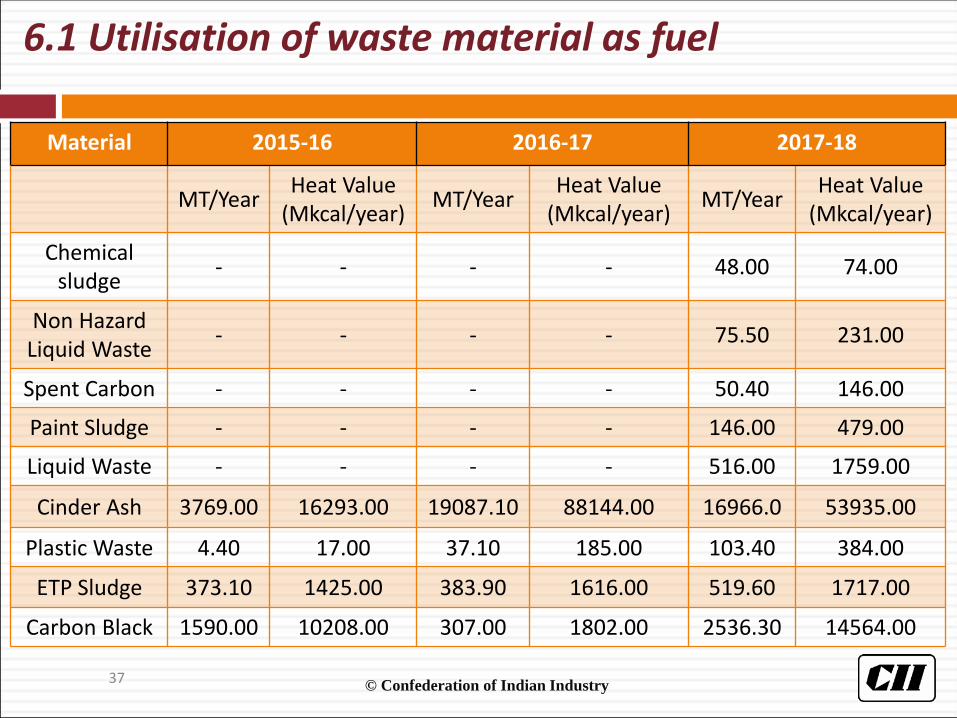
6.1 Utilisation of waste material as fuel
Material 2015-16 2016-17 2017-18
MT/YearHeat Value
(Mkcal/year)MT/Year
Heat Value (Mkcal/year)
MT/YearHeat Value
(Mkcal/year)
Chemicalsludge
- - - - 48.00 74.00
Non Hazard Liquid Waste
- - - - 75.50 231.00
Spent Carbon - - - - 50.40 146.00
Paint Sludge - - - - 146.00 479.00
Liquid Waste - - - - 516.00 1759.00
Cinder Ash 3769.00 16293.00 19087.10 88144.00 16966.0 53935.00
Plastic Waste 4.40 17.00 37.10 185.00 103.40 384.00
ETP Sludge 373.10 1425.00 383.90 1616.00 519.60 1717.00
Carbon Black 1590.00 10208.00 307.00 1802.00 2536.30 14564.00
37

© Confederation of Indian Industry
7.0 GHG Inventorisation
Environmental Projects FY’15-17
Replacement of conventional lightening with LED lights( Permanent stopped=121 Nos, Replaced with LED = 2512)
By 847272 Units
Reduction of Specific heat requirement(FY’15-16 = 708.00 Kcal/Kg Clk & FY’17-18 = 693.00 Kcal/Kg Clk)
By 2.11%
Reduction of Specific Electrical Energy requirement(FY’15-16 = 77.38 kWh/MT CMT & FY’17-18 = 72.53 kWh/MT CMT)
By 6.26 %
Improvement in Clinker Factor (FY’15-16 = 80.54% & FY’17-18 = 75.21 % )
By 6.61 %
Minimization of liquid fuel firing in HAG during Kiln shutdown(Before = 2.76 Ltr./MT CMT, After 0.24 Ltr./MT CMT )
By 96.37%
Consumption of AFR Increased(FY’15-16 = 1967.00 MT & FY’17-18 = 3995.00 MT)
By 103.10 %
Massive Plantation(FY’15-17)
Area covered 9.1Acre by 23237 trees
38
© Confederation of Indian Industry
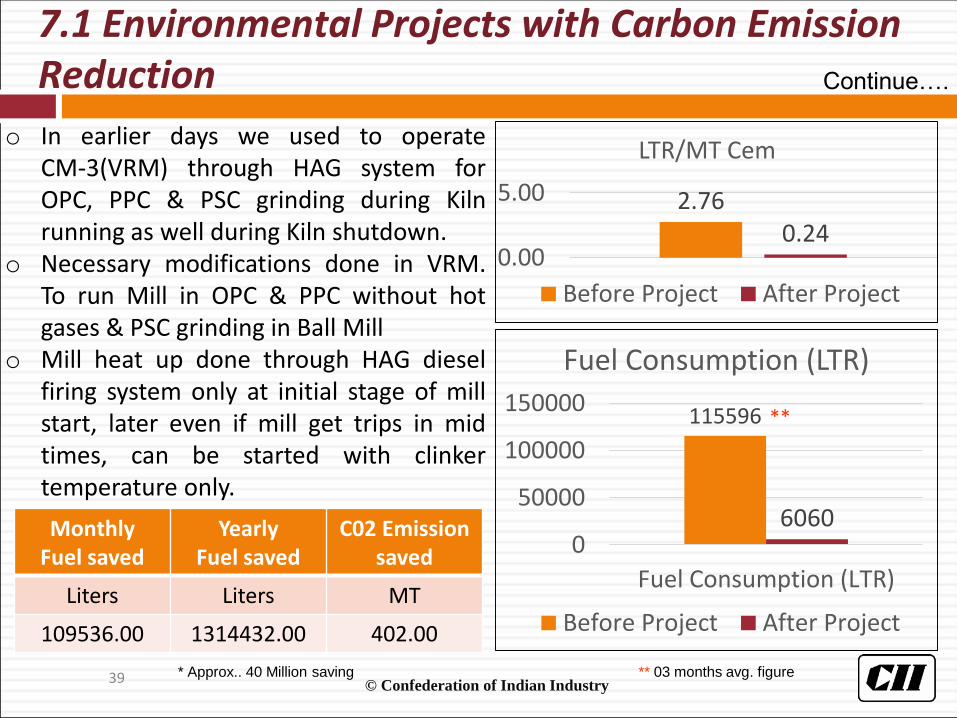
7.1 Environmental Projects with Carbon Emission Reduction
39
o In earlier days we used to operateCM-3(VRM) through HAG system forOPC, PPC & PSC grinding during Kilnrunning as well during Kiln shutdown.
o Necessary modifications done in VRM.To run Mill in OPC & PPC without hotgases & PSC grinding in Ball Mill
o Mill heat up done through HAG dieselfiring system only at initial stage of millstart, later even if mill get trips in midtimes, can be started with clinkertemperature only.
115596
60600
50000
100000
150000
Fuel Consumption (LTR)
Fuel Consumption (LTR)
Before Project After Project
Monthly Fuel saved
YearlyFuel saved
C02 Emission saved
Liters Liters MT
109536.00 1314432.00 402.00
* Approx.. 40 Million saving
2.760.24
0.00
5.00
LTR/MT Cem
Before Project After Project
Continue….
** 03 months avg. figure
**

40
878865
799
750
800
850
900
CO2 Emission: Kg of CO2/MT Clk
2015-16 2016-17 2017-18
• C02 Emission reduction by reduction of Specific heat consumption as well as power consumption
• AFR Consumption• Reduction of diesel consumption
• Clinker Factor improvement by improving Clinker quality, Flyash quality, Utilization of Imported Gypsum.
• Improvement in PPC/PSC dispatch quantity
7.2 Environmental Projects with Carbon Emission Reduction
0.81
0.78
0.75
0.72
0.74
0.76
0.78
0.80
0.82
2015-16 2016-17 2017-18
Clinker factor

© Confederation of Indian Industry41
Plantation:Massive Plantationactivities inside &Outside of theplant
7.3 Environmental Projects with Carbon Emission Reduction
© Confederation of Indian Industry
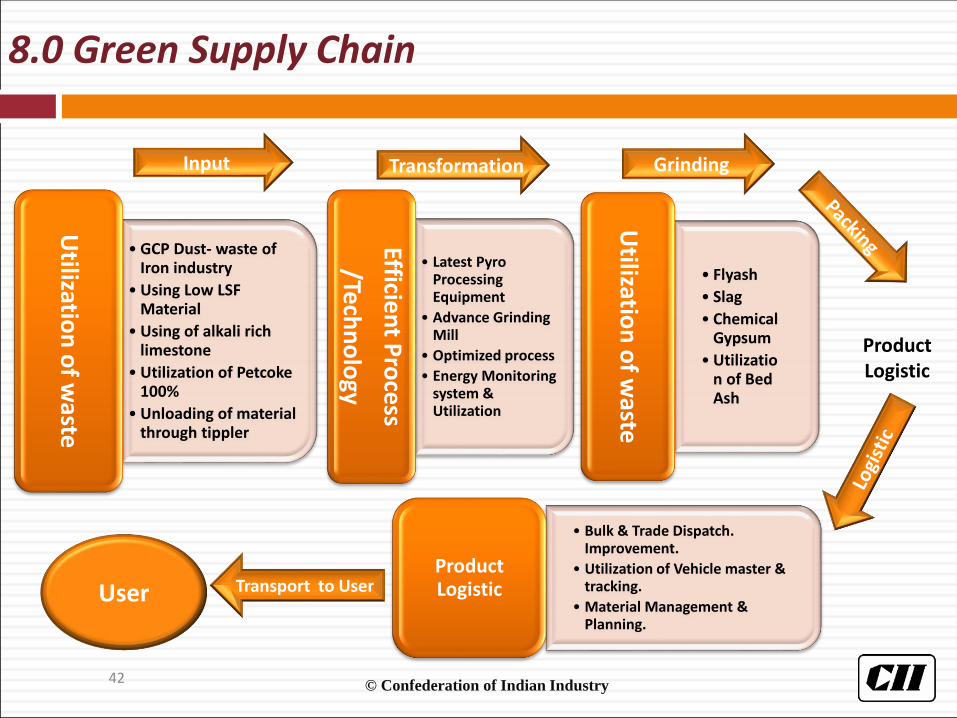
8.0 Green Supply Chain
Input Transformation Grinding
• Flyash
• Slag
• Chemical Gypsum
• Utilization of Bed Ash
Utilizatio
n o
f waste
• Latest Pyro Processing Equipment
• Advance Grinding Mill
• Optimized process
• Energy Monitoring system & Utilization
Efficien
t Pro
cess
/Tech
no
logy
• GCP Dust- waste of Iron industry
• Using Low LSF Material
• Using of alkali rich limestone
• Utilization of Petcoke 100%
• Unloading of material through tippler
Utilizatio
n o
f waste
• Bulk & Trade Dispatch. Improvement.
• Utilization of Vehicle master & tracking.
• Material Management & Planning.
Product Logistic
ProductLogistic
User Transport to User
42
© Confederation of Indian Industry43
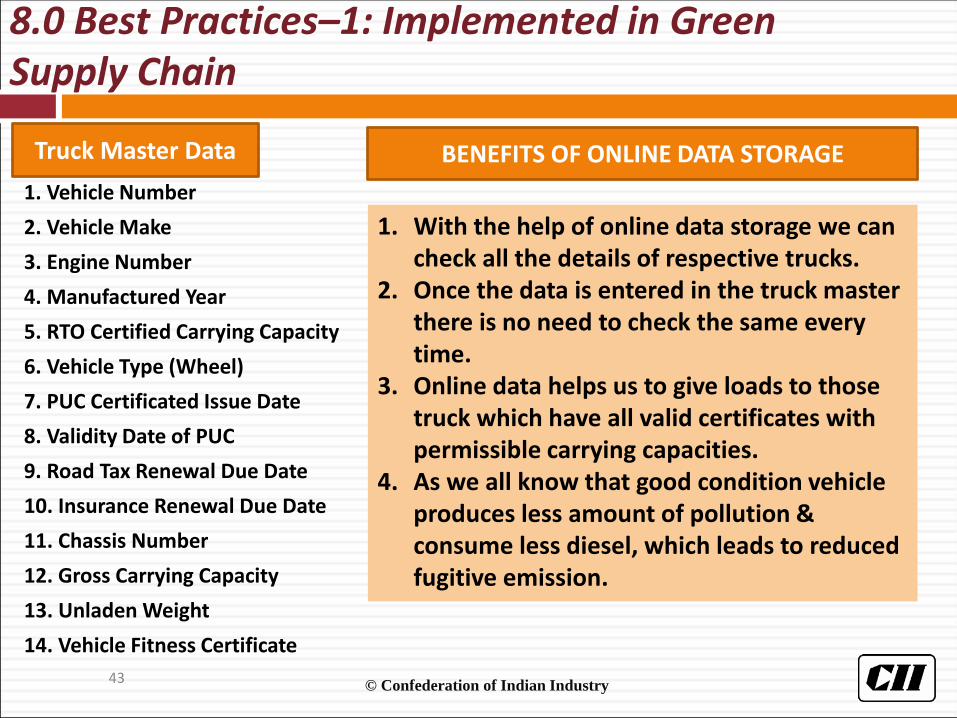
8.0 Best Practices–1: Implemented in Green Supply Chain
1. Vehicle Number
2. Vehicle Make
3. Engine Number
4. Manufactured Year
5. RTO Certified Carrying Capacity
6. Vehicle Type (Wheel)
7. PUC Certificated Issue Date
8. Validity Date of PUC
9. Road Tax Renewal Due Date
10. Insurance Renewal Due Date
11. Chassis Number
12. Gross Carrying Capacity
13. Unladen Weight
14. Vehicle Fitness Certificate
1. With the help of online data storage we can check all the details of respective trucks.
2. Once the data is entered in the truck master there is no need to check the same every time.
3. Online data helps us to give loads to those truck which have all valid certificates with permissible carrying capacities.
4. As we all know that good condition vehicle produces less amount of pollution & consume less diesel, which leads to reduced fugitive emission.
BENEFITS OF ONLINE DATA STORAGETruck Master Data
© Confederation of Indian Industry44
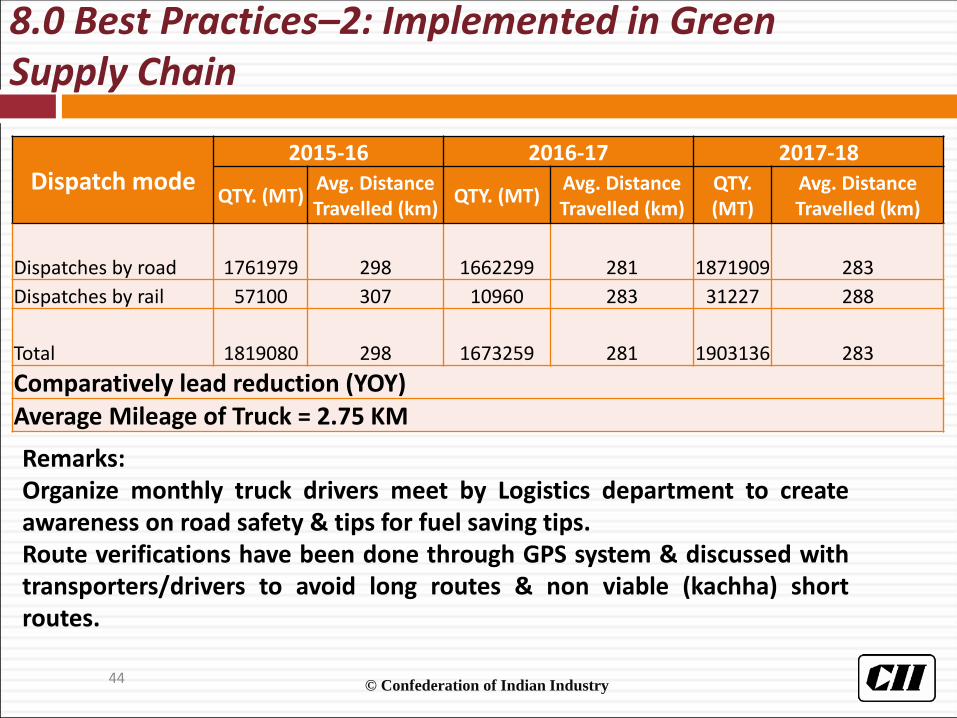
8.0 Best Practices–2: Implemented in Green Supply Chain
Dispatch mode2015-16 2016-17 2017-18
QTY. (MT)Avg. Distance Travelled (km)
QTY. (MT)Avg. Distance Travelled (km)
QTY. (MT)
Avg. Distance Travelled (km)
Dispatches by road 1761979 298 1662299 281 1871909 283
Dispatches by rail 57100 307 10960 283 31227 288
Total 1819080 298 1673259 281 1903136 283
Comparatively lead reduction (YOY)Average Mileage of Truck = 2.75 KM
Remarks:Organize monthly truck drivers meet by Logistics department to createawareness on road safety & tips for fuel saving tips.Route verifications have been done through GPS system & discussed withtransporters/drivers to avoid long routes & non viable (kachha) shortroutes.

© Confederation of Indian Industry45
9.1 Plant Production & Power consumption Report
PRODUCTION REPORT DATED ON 7/22/2018 DATE
7/23/2018
Section R.Hrs DAILY PRODUCTION REPORT Kwh/T. Mat.kwh/T.Cem.
HRS Today STD. TPH TPH MTD YTD REASONS TODAY MTD YTD
CRUSHER 13.00 10,570 900 813.10156350.9
5 498091.40.74 1.13 1.04 0.99 0.86
RAW MILL 24.00 11506 450 479.42 181520 526312.00 13.17 20.48 20.84 20.97 15.66COAL MILL 24.00 634.70 28 26.45 9734.86129725.911 34.87 2.99 3.00 3.05 2.29KILN 24.00 7,398 290 308.25 116851 341042.00 19.24 19.27 19.89 20.11 14.71Total CLINKER PRODUCTION 7,398
CLINKER FACTOR 0.76 43.86 44.77 45.12 33.52
Cement GRINDING TODAY MTD YTD
CM-1OPC 0 0 135 0 16640 51873.00
0.00 35.82 34.56PPC 0 0 125 0 7729 33138COMP 0 0 0 0 0
CM-2
OPC 0 0 135 0 0 0
0.00 43.58 44.42PPC 0 0 150 0 10359 32898PSC 0 0 82 0 12448 63022
COMP 0 0 0 0 0
CM-3
OPC 6.17 1360 220 220 33037 102411
30.51 33.23 32.61PPC 4.83 1283 270 266 27601 70235PSC 1.50 269 180 179 0 0
COMP 65 0 0 0 587Total Cement prod. 77.5 2912 38 107814 354164
30.51 35.41 35.62SUPERGRIP PRODUCTION 7.75 23.00 2.97 138.00 352.00Cement GRD POWER
AVG. GRD POWER
Cement Dispatch
OPC 1722.92 51956.64157104.33
Plant Specific power consumption( kwh/T.Cem.)TODAY MTD YTD
PPC 1447.00 46106.72135348.1768.87 71.82 72.84
PSC 1326.50 43580.28133791.12COMP 2912 0 0
PLANT CLINKER 71,270 7,398 116851 341042 2227 95551 30108476,410.
315THERMAL ENERGY
Clinker stock 76,410 TODAY MTD YTD
679 683 685

© Confederation of Indian Industry46
9.1.1 Daily Energy Monitoring Detail Analysis
Date
CRUSHER RAW MILL
MD AuxKwh/Clk
MD Fan Aux VVFKwh/Clk
Kwh/Mat Kwh/Mat
22-Jul-18 0.40 0.31 1.13 7.49 4.39 1.08 0.22 20.48
23-Jul-18 0.39 0.28 1.01 7.65 4.38 1.09 0.22 20.53
KILN
MD PHF1 PHF2 BHF ESPF AUXkWh/Clk
Kwh/Clk
1.60 3.05 3.02 2.39 0.76 8.45 19.27
1.58 3.04 3.06 2.42 0.77 8.49 19.36
Date
Coal Mill
MD Fan Aux VVF TransportKwh/Clk
Kwh/Mat
22-Jul-18 15.39 11.10 4.10 3.43 0.86 2.99
23-Jul-18 15.40 11.05 4.07 3.53 0.89 3.10
CM-1MD Fan Aux Compressor Units
kWh/CMTKwh/Mat
CM-3MD Fan Aux Compressor Units
kWh/CMTKwh/Mat
19.23 8.19 2.62 0.51 30.5
19.23 8.03 3.02 0.75 31.0
Date
CM-2
MD Fan Aux Compressor Units
kWh/CMTKwh/Mat
22-Jul-18
23-Jul-18
Date Pre Clinkerization
kWh/t Clk
22-Jul-18 43.8623-Jul-18 43.99
(kWh/t cem.) Total Power
Clinker Factor Plant Lighting Packing Colony Misc. Idle Unit kWh/t Cem.
0.79 0.86 1.51 0.42 0.41 0.52 68.87
0.79 0.90 1.47 0.52 0.43 0.72 69.79

© Confederation of Indian Industry47
9.2 Energy Review Meeting
•Packing Plant-Head
• CPP- Head
•AFR- Manager
•Commercial
•Section Head Kiln
•Section head Cement Mill
•EMR
• IMS Cell
•Process Manager
•Section head Kiln
•Section Head Cement Mill
• QC-Manager
•Section Head Kiln
•Section Head Cement Mill
•PM cell
HOD (Mechanical)
HOD (Production
& QC)
Misc. HOD
(E & I)
Technical Head
Engineer- Site CCR Process Sr.
Chemist General
Chemist
Engineer- Shift Maintenance PLC
Energy Manager
Engineer-• Shift• Maintenance• Monitoring
Cell
Engineer- Site Process AFR CA

© Confederation of Indian Industry
Identified Energy Saving proposal is scrutiny by Plant/ Technical Head. If payback
period is less then 02 years immediate approval awarded by Plant Head.
Energy saving proposal which having without/Marginal investment is approved by
plant head after screening through Energy Cell/ Capex committee
recommendation on monthly basis.
Energy saving proposal which involve high capex, require approval of Business
Head through Plant head recommendation.
The fund allocation for the Energy saving project For FY’17-18 was around 0.52%
of total allotment. However 8.68% is reserved for the current year.
Proposed fund allocation for Energy Saving Projects FY’18-19
9.3 %age Investment for Energy conservation Projects
Energy saving project ( In Lacs) 5007.00
Total Fund Allocation (In Lacs) 57670.00
Fund Allotted to Energy saving Project (In Lacs) 8.68%
48
© Confederation of Indian Industry
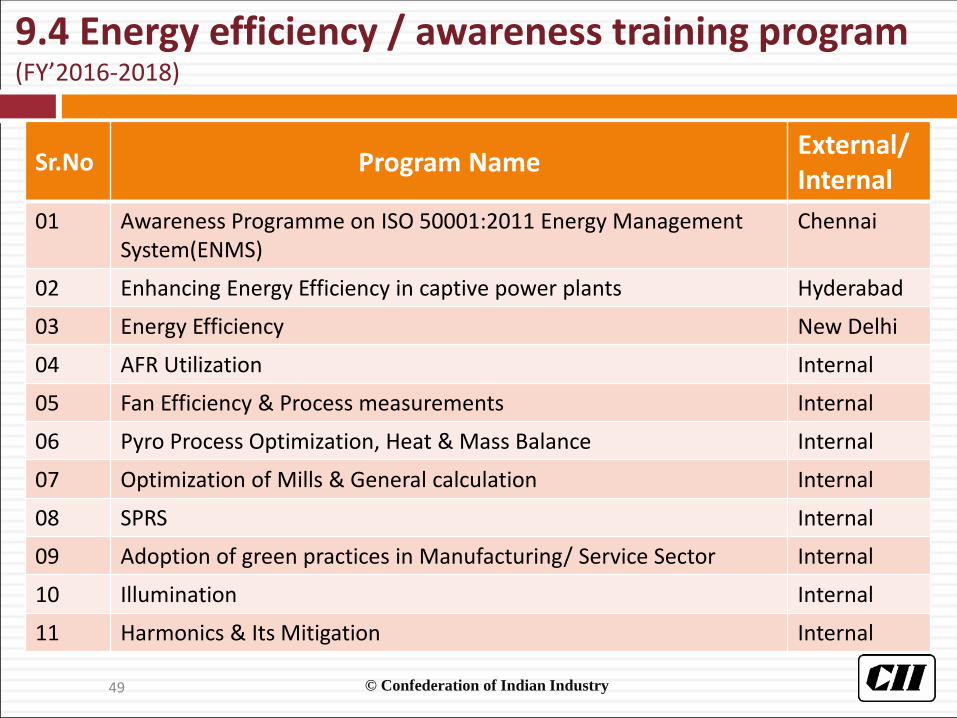
9.4 Energy efficiency / awareness training program (FY’2016-2018)
Sr.No Program NameExternal/ Internal
01 Awareness Programme on ISO 50001:2011 Energy Management System(ENMS)
Chennai
02 Enhancing Energy Efficiency in captive power plants Hyderabad
03 Energy Efficiency New Delhi
04 AFR Utilization Internal
05 Fan Efficiency & Process measurements Internal
06 Pyro Process Optimization, Heat & Mass Balance Internal
07 Optimization of Mills & General calculation Internal
08 SPRS Internal
09 Adoption of green practices in Manufacturing/ Service Sector Internal
10 Illumination Internal
11 Harmonics & Its Mitigation Internal
49
© Confederation of Indian Industry50
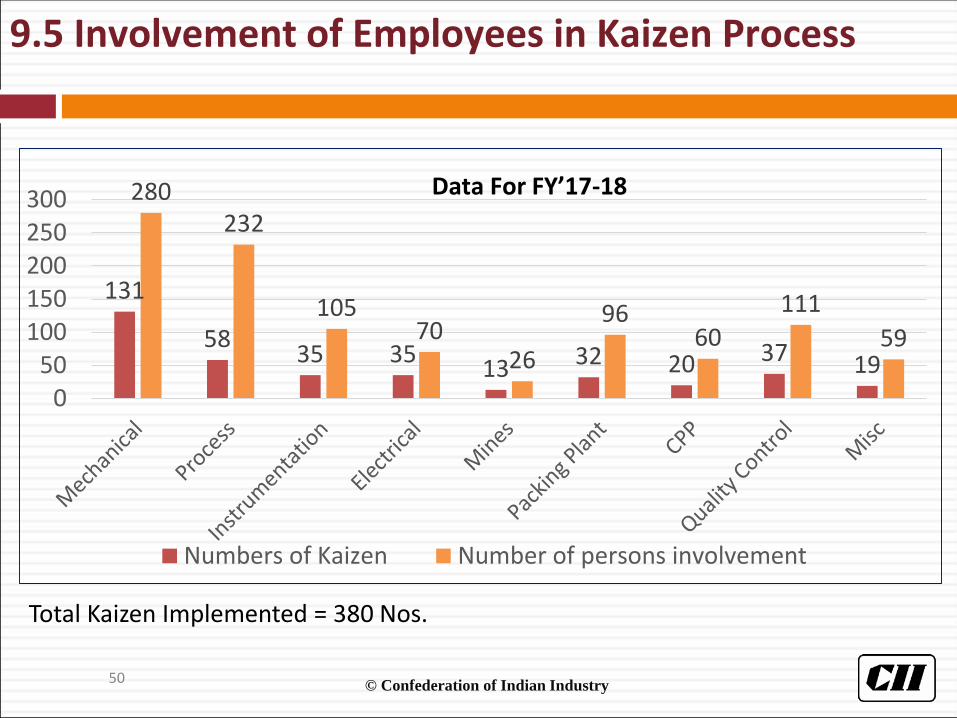
9.5 Involvement of Employees in Kaizen Process
131
5835 35
13 32 20 37 19
280232
10570
26
9660
111
59
050
100150200250300
Numbers of Kaizen Number of persons involvement
Data For FY’17-18
Total Kaizen Implemented = 380 Nos.
© Confederation of Indian Industry
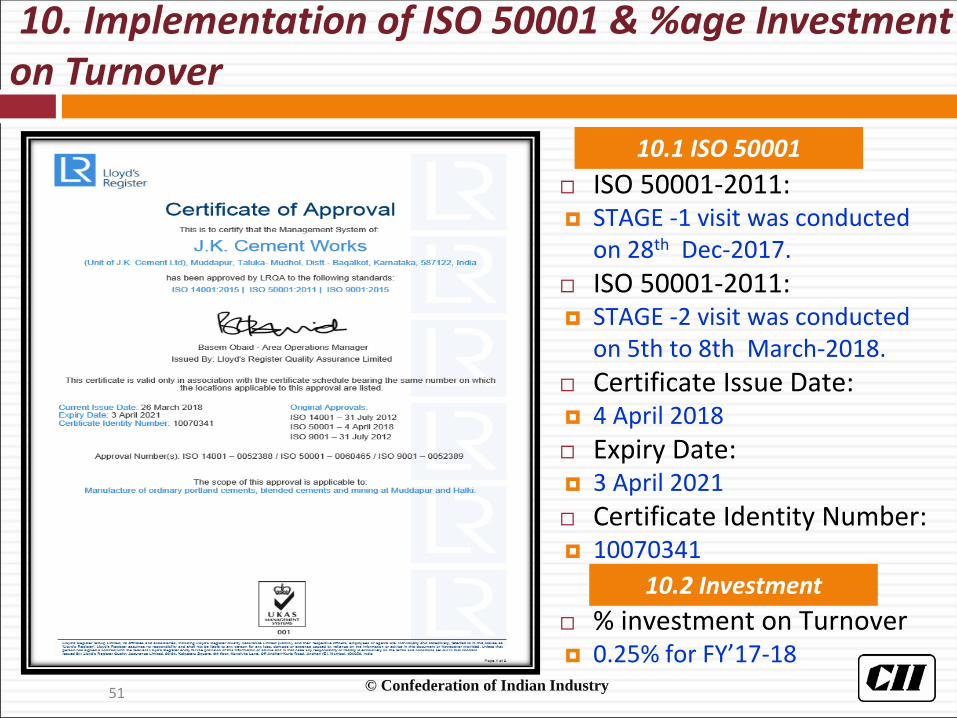
10. Implementation of ISO 50001 & %age Investment on Turnover
ISO 50001-2011: STAGE -1 visit was conducted
on 28th Dec-2017.
ISO 50001-2011: STAGE -2 visit was conducted
on 5th to 8th March-2018.
Certificate Issue Date: 4 April 2018
Expiry Date: 3 April 2021
Certificate Identity Number: 10070341
% investment on Turnover 0.25% for FY’17-18
10.1 ISO 50001
10.2 Investment
51
© Confederation of Indian Industry52
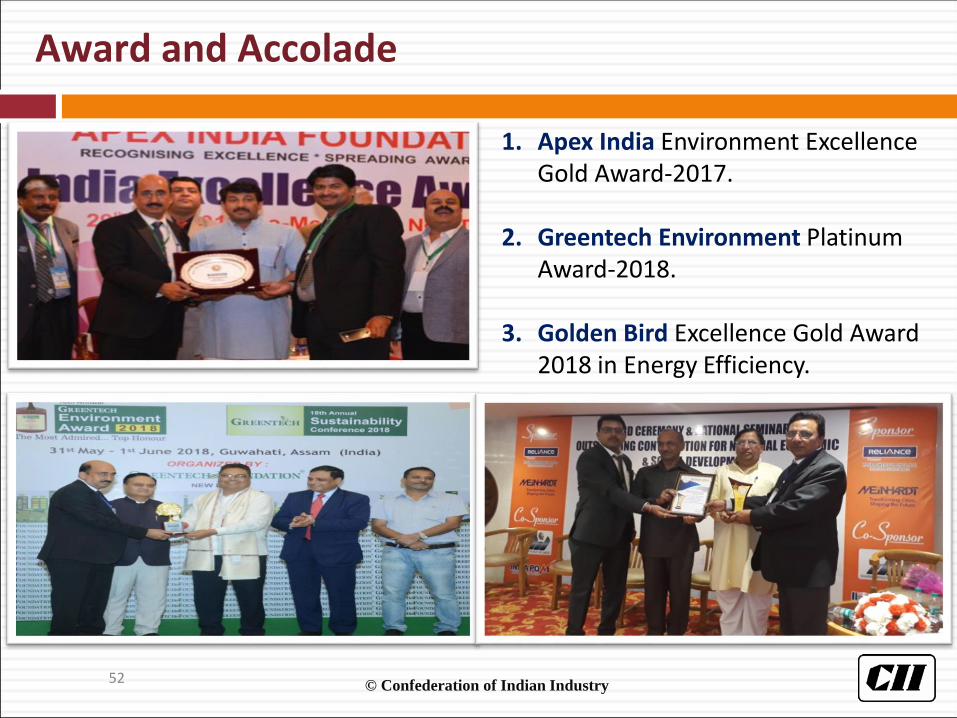
1. Apex India Environment Excellence Gold Award-2017.
2. Greentech Environment Platinum Award-2018.
3. Golden Bird Excellence Gold Award 2018 in Energy Efficiency.
Award and Accolade

© Confederation of Indian Industry53
4. Mission Energy Foundation “2017 SOx-NOx Award in Technology Excellence Operation & Maintenance.
5. Mission Energy Foundation “2018 Award in Flyash Utilization.
6. Mines Environment & Mineral Conservation Week 2017- Award Halki Limestone Mine- Publicity &
Propaganda -1st prize Muddapur Limestone Mine-
Sustainable Development-1st prize
7. Mines Safety Week 2017- Award Halki Limestone Mine Swatch Bharat Abhiyan-1st prize Electrical Installations- 1st prize
Award and Accolade

© Confederation of Indian Industry
Thank you