powerpoint 簡報 - ttyeng.tty.com.tw/rwd1181/store/f3/tty company profile_201905en.pdf ·...
TRANSCRIPT

May, 2019


TTY Biopharm consolidated sales as of
2018- NTD 4.06B (USD 132M) Unaudited
2017- NTD 4.08B (USD 134M)
Headquarter: Taipei, Taiwan
Number of employees: 530
Founded in 1960, restructured in 1996
Traded in the Taiwan TPEx
(2001, Code: 4105);
Shares outstanding: 248.65 Million Shares
(December, 2018)

(4105 TT)
TTY Biopharm
台灣東洋
Oncology
癌症Infection
重症醫療Healthcare
醫療保健CDMO
委託研發暨生產服務
Local Segments
EnhanX
殷漢 (67%)
(8432 TT)
TSH
東生華 (56.48%)
Thailand (40%) Philippines (87%)
Vietnam (100%) Mexico (100%)
Korea (100%)
Major Investments
(6566 TT)
CY Biotech
創益 (27.54%)
(4162 TT)
PharmaEngine
智擎 (15.54%)
Equity Method
ROE 2014-2016: 21.23%.
ROE 2017: 22.6% (above industry average 11.13%).

9

12

Products
Caelyx/Doxil600 Pegylated Liposome Technology
Worldwide Manufacturing
PatentPegylipo
Lipo-AB 440 Liposome TechnologyWorldwide Manufacturing
Patent
Octreotide 1,500 Microsphere FormulationPLGA, Star Polymers
Synthesized by TTY.
Colimycin 150 FormulationFirst Choice
Irreplaceable Options, TWNIH
ENX-201 1,700 Liposome TechnologyPenetrating Blood-Brain-
Barrier (BBB) capability
Leuprolide
Acetate Injection1,240
Lupron Depot Microsphere
Formulation
Worldwide Manufacturing
Patent
Risperidone
Injection960 Microsphere Formulation
Worldwide Manufacturing
Patent
LGIA10 910 Microsphere Formulation
Worldwide Manufacturing
Patent
Microsphere Deport Platform
13
World Market USD/M Core Technology Advantages

Introduction of MS
14
MS: a chronic, autoimmune & neurodegenerative disorder
Body’s own defensive system attacks myelin Inflammatory damage in the brain and spinal cord
Loss of myelin and axons (scars at multiple sites)
Neurologic disability

Introduction of MS
16
Four Classifications of MS
Either one of the four classifications occurs in acute is the target patient pool of ENX-201.
不管屬於哪一個發病類型,只要是急性復發,就是ENX-201的target 病患。
85%~90% patients

Introduction of MS
17
Around
2.5 millionsFemales:Males=4:1

Copaxone,20.84%
Tecfidera,20%
Gilenya, 15%
Avonex,11%
Tysabri,10%
Rebif,10%
Aubagio,7.52%
Acthar, 5%
Lemtrada, 2.50%Plegridy, 0.63%
Copaxone
Tecfidera
Gilenya
Avonex
Tysabri
Rebif
Aubagio
Acthar
Lemtrada
Plegridy
Introduction of MS
18
Major existing choices for MS treatments (2016 Sales & Market Share in Value)
Unit: USD
4.16B
4B
3.1B
2.2B
2B
2B
1.4B
1.1B
500M
126M
https://www.fool.com/investing/2016/07/26/an-investing-overview-of-the-multiple-sclerosis-ma.aspx
Total US$ 20.59 Billion

Introduction of the Product
19
120nm
ENX-201

Introduction of BBB
20

ENX-201 Introduction
21
Effective drug delivery to across the blood-brain barrier (BBB)

Phase I Study (Solution)
22
Long circulation half-life of ENX-201

Potential Market Size
23
$348.3M
$776.1M$928.8M
$97.5M
$218.3M
$259.9M
$95.3M
$213.6M
$254.2M
$52.6M
$117.9M
$140.3M
$0M
$200M
$400M
$600M
$800M
$1,000M
$1,200M
$1,400M
$1,600M
Second-Line, TargetPenetration, $3,000
Price floor
First-Line, ExpandedPenetration, $3,000Second-Line Price
Second-Line, TargetPenetration, $8,000
High Price
Re
ve
nu
e
ENX-201 US Peak Year Revenue – MS & Other Inflammatory Indications
MS relapse Optic neuritis Uveitis CNS Lupus Neurosarcoidosis NMO Behcet ADEM
$601.5M
$1343.2M
$1603.9M

ENX-201 Development Strategies
24
ENX-201’s strengths
• ENX-201 is a pegylated liposome which glutathione is attached on its lipid, while methylprednisolone as the main substance is encapsulated inside.
• Compared with the standard of care, i.e., a free methylprednisolone, ENX-201 is an one-shotintravenous injection which brings home-care convenience and better tolerance to patients suffering acute multiple sclerosis relapses.

2014-
20162017 2018 2019 2020 2021 2022 2023 2024
Phase I
Phase IIa
Scientific advice from
FDA & EMA
Phase II/III in MS
relapses (vs placebo)
Phase II/III in MS
relapses (vs MP)
US NDA indication #1
EU MAA indication #1
ENX-201 Pipeline
25
ENX-201:Liposomal Methylprednisolone Injection
(glutathione PEGylated liposomal methylprednisolone)

Multiple Indications to Go (Pipeline)
26
Indications to Develop Market Potential Size Competitors
1 Multiple Sclerosis (多發性硬化症) >21.5B
Teva (2014)
BiogenEMDSeronoNovartis
2 Uveitis (葡萄膜炎) (眼睛發炎) >0.531B Humira (2016)
3 Neuropathic Pain (神經性疼痛) >5.7B Pfizer (2011)
4 Osteoarthritis (骨關節炎) >5.335B Anika (2014)
5 ALS (漸凍人─肌萎縮性脊髓側索硬化症) >25M (a negative CAGR of 16.10%)
Biogen Idec Inc.
Avanir Pharmaceuticals Inc.
Isis Pharmaceuticals Inc.
Sanofi
Bristol-Meyers Squibb Co.
6 Mucopolysaccharidoses (MPS, 黏多醣症) >300M Vimizim
7Metachromatic leukodystrophy
(MLD, 異染性腦白質失養症)1B
Shire Plc
Nuo Therapeutics
GlaxoSmithKline Plc
Zymenex A/S
RegenxBio Inc.
Novartis AG
Unit: USD/Billion

ENX-201 Management Team
27
Pieter J. Gaillard Yuan-Yi Chou Yu-Fang Hu

ENX-201 Scientific Advisory Board
28
Ralf Linker
(Erlangen, Germany)
蔡清標Taipei,Taiwan
Frederik Barkhof
(Amsterdam, Netherlands)
Olaf Stuve
(Texas, USA)

29

The only PIC/S GMP certified manufacture sites for high potency oncology, we passed the following official inspections such as
EMEA by Hungary, Arabian, Jordan, Germany, Brazil, Japan.
USA FDA, Japan, EMA by Belgium, Turkey, Korea and Kazakhstan.
High standard Validation of Equipment qualification/ Laboratory instruments qualification/ HVAC system/ Water system/
Compressed air system/ Nitrogen system/ Cleaning/ Analytical method/ Process/ Computer/Logistic
Individual flow management Air flow/ Man flow/ Material flow/ Product flow/ Waste flow
To prevent cross contamination and environmental pollution
Environmental ProtectionWork SafetyHVAC System
Manufacture Facilities
30

31
Chungli Factory
2008EMEA
Arabian Official
2009EMEA
Official
2010 Jordan Official
2011 Germany OfficialBrazil
Official
2012 Japan Official
2013 US FDA JapanOfficial
2014 EMA
Turkey
2015Korea
KazakhstanEMEA
2016US FDA
2017Belarus
Indonesia
2018 Kanya
US FDAEMEA OfficialKorea
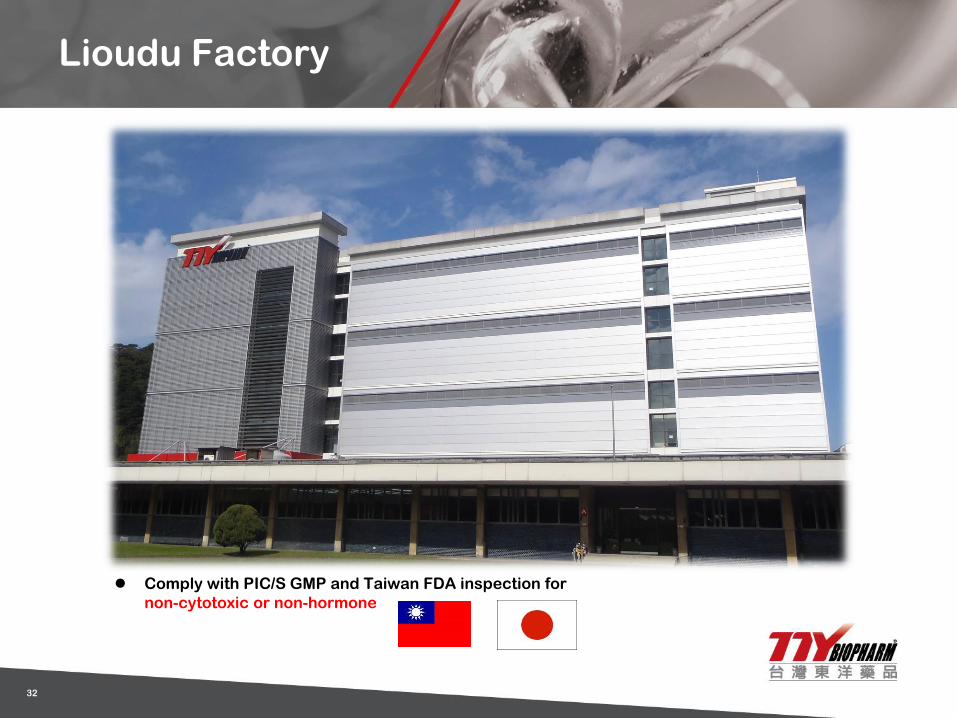
Lioudu Factory
Comply with PIC/S GMP and Taiwan FDA inspection for
non-cytotoxic or non-hormone
32

33

TTY has successfully registered 47 oncology product licenses in 10 countries.
34
Country UFur Oxalip Lipo-Dox Irino Asadin Gemmis Tynen Epicin Thado Anazo Folina Sulfin Algycon Colimycin Maxtam Total
Thailand 1 1 1 1 1 1 1 1 1 1 1 11
Philippines 1 1 1 1 1 1 1 7
Vietnam 1 1 1 1 2 2 1 9
Hong Kong 1 1 1 2 2 3 10
Malaysia 1 1 1 1 1 1 6
Singapore 1 1
India 1 1
Sri Lanka 1 1
Guatemala 1 1
Colombia 1 1
Total 5 3 6 4 4 4 5 4 3 2 2 2 2 1 1 48
TTY’s CMO partner holds the licenses of TTY brand drug- Doxil in US and Caelyx in EU.
國際代工合作廠商擁有Lipo-Dox在美國(Doxil)及歐洲(Caelyx)之藥證。

Asadin
(伸定注射劑)
TS-1
(愛斯萬膠囊)
Epicin
(益彼欣注射液)
Tynen
(汰能注射劑)
Anazo
(安納柔膜衣錠)
Gemmis
(建仕注射液)
Zobonic
(抑骨凍晶靜脈注射劑)
Ivic
(癌微可膜衣錠)
UFUR
(友復膠囊)
Pexeda Inj.
(派癌休注射劑)
Lipo-Dox
(力得微脂體注射劑)
Painkyl
(平舒疼口頰溶片)
Oxalip
(歐力普注射劑)
Thado
(賽得膠囊)
Irino
(益立諾)
Lonsurf
(朗斯弗膜衣錠)
Megest
(麥格斯口服懸液劑)
Otril
(嘔速停靜脈注射劑)
Folina
(芙琳亞錠)
35
Successful Oncology Products

36
Brosym C+S
(博益欣)
Lipo-AB
(立博黴)
Colimycin
(克痢黴素注射劑)
Cubicin
(救必辛注射劑)
Flusine
(弗路欣錠)
Exacin
(依克沙)
Maxtam
(抑酉每靈注射劑)
Agrippal
(安爾保流感疫苗)
Successful Products of Intensive Care

37
Successful Healthcare Products
Algitab
(艾胃逆服)
Cepiro
(希比洛靜脈乾粉注射劑)
Alginos
(胃逆舒)
METACIN
(西腹黴素注射劑)
BIO-CAL PLUS
(滋骨咀嚼錠)
Sulfin
(速復利錠)

38
Year
Subject
2013 2014 2015 2016 2017 2018
Revenue
(NTD,000)2,307,540 2,384,220 2,738,956 3,344,262 3,672,040 3,555,620
R&D Expense
(NTD,000)289,530 283,470 236,398 230,192 219,126 230,595
Total Staff 484 494 450 508 520 530
R&D
Manpower111 105 97 105 98 98
R&D Expense/
Revenue12.55% 11.89% 8.63% 6.88% 5.97% 6.49%
R&D
Total Staff22.93% 21.26% 21.56% 20.67% 18.85% 18.49%

39
Financial Disclosure

Financial Performance (Parent Company Only)
Item2013 2014 2015 2016 2017 2018
Amount % Amount % Amount % Amount % Amount % Amount %
Net Sales 2,292,163 100% 2,384,207 100% 2,738,956 100% 3,344,262 100% 3,672,040 100% 3,555,620 100%
Gross Profit 1,404,003 61% 1,411,875 59% 1,777,941 65% 2,217,286 66% 2,347,809 64% 2,308,242 65%
Operating Expenses -1,121,548 -49% -1,144,400 -48% -1,035,412 -38% -1,063,104 -32% -1,135,595 -31% -1,251,591 -34%
Operating Profit 282,455 12% 267,475 11% 742,529 27% 1,154,182 34% 1,212,214 33% 1,056,651 31%
Non-Operating Income
and Expenses413,685 18% 596,585 25% 705,211 26% 277,855 9% 351,484 10% 611,161 17%
Income before Tax 696,140 30% 864,060 36% 1,447,740 53% 1,432,037 43% 1,563,698 43% 1,667,812 48%
Net Income 587,440 26% 779,645 33% 1,211,018 44% 1,193,324 36% 1,344,731 37% 1,461,381 42%
EPS 2.52 3.14 4.87 4.80 5.41 5.88
40
NTD in Thousands

Financial Performance (Consolidated)
41
NTD in Thousands
Item2015 2016 2017 2018 Q1/2019
Amount % Amount % Amount % Amount % Amount %
Net Sales 3,195,218 100% 3,760,717 100% 4,078,760 100% 4,036,196 100% 1,114,608 100%
Gross Profit 2,183,144 68% 2,559,220 68% 2,668,845 65% 2,663,179 65% 737,639 66%
Operating Expenses -1,393,357 -44% -1,379,533 -36% -1,411,855 34% -1,603,502 40% -394,655 36%
Operating Profit 789,787 24% 1,179,687 32% 1,256,990 31% 1,059,677 25% 342,984 30%
Non-Operating Income
and Expenses735,808 23% 332,372 8% 338,077 8% 608,391 15% 33,042 4%
Income before Tax 1,525,595 47% 1,512,059 40% 1,595,067 39% 1,668,068 40% 376,026 34%
Net Income
(Consolidated)1,246,592 38% 1,254,724 33% 1,368,314 33% 1,462,299 35% 301,379 27%
Net Income (TTY) 1,211,018 37% 1,193,324 31% 1,344,731 32% 1,461,381 35% 293,779 26%
EPS 4.87 4.80 5.41 5.88 1.18

Dividend Payout
42
Year
Item
2013 2014 2015 2016 2017 2018
Cash Payout Ratio 79.4% 79.6% 71.9% 79.2% 83.2% 76.5%
Total Dividend 2.67 2.50 3.50 3.80 4.50 4.50
3.03
2.51 2.52
3.14
4.870 4.8
5.41
5.88
0.3
1.4
2.0
2.5
3.503.80
4.50 4.50
0%
20%
40%
60%
80%
100%
0.0
2.0
4.0
6.0
8.0
2011 2012 2013 2014 2015 2016 2017 2018 E
EPS cash dividend cash payout ratio
Wait for approval by Annual General Meeting on 6/25/2019.

Gov’t Funds & Ins. Co.’s Holdings
Holdings
Institution
April/2015 April/2016 April/2017 April/2018 April/2019
SharesHoldings
(%)Shares
Holdings
(%)Shares
Holdings
(%)Shares
Holdings
(%)Shares
Holdings
(%)
Insurance Company 4,880,800 1.96% 11,339,000 4.56% 18,169,000 7.31% 33,474,000 13.46% 38,416,000 15.45%
Government Funds 817,021 0.33% 21,177,843 8.52% 14,904,000 5.99% 10,088,843 4.07% 5,598,843 2.26%
Total 5,697,821 2.29% 32,516,843 13.08% 33,073,000 13.30% 43,562,843 17.53% 44,014,843 17.71%
43
- 6,000,000 12,000,000 18,000,000 24,000,000 30,000,000 36,000,000
Insurance
Government
Insurance Company & Government Funds Holdings
2015/4月 2016/4月 2017/4月 2018/4月 2019/4月

44