powerpoint presentation · 10/25/2016 1 prevention [s debates about marijuana legalization –...
TRANSCRIPT
10/25/2016
1
Prevention’s Debates about Marijuana Legalization –“Reefer Madness” or Thoughtful Science?
“Real World” Considerations, Implications from Research, and What it Means for the Prevention Community
•
Jason R. Kilmer, Ph.D. University of WashingtonAssociate Professor
Psychiatry & Behavioral Sciences
Asst. Director of Health & Wellness for AOD EducationDivision of Student Life
Let’s start with some discussion…
• As a prevention community, what concerns do you have about medical marijuana or outright legalization for personal use?
• What are the main things you hear from those for legalization?
• What is missing, or what do you wish you had, in your prevention tool box?
Washington State Impact Report (mfiles.org)

10/25/2016
2
Average potency (nation) = 11.16%Average potency (Seattle) = 21.24%
Concentrates average potency (nation) = 55.45%Concentrates average potency (Seattle) = 72.76%
From the date of legalization to the date of commercial sales starting, poison center calls increased 54.26%; for those under 20, calls increased 80%
Opportunities and lessons learned:
How you talk about marijuana matters…a lot!

10/25/2016
3
Discussing marijuana…word choice matters
• “Do you smoke marijuana?”
– A person who uses edibles daily can honestly say “no”
– If screening with a yes/no, consider “do you use marijuana?”
• “Do you use marijuana?” or “have you used marijuana?” followed by, “What does your marijuana use look like?”
Finding potential hooks: An Example
– “What are the good things about ___________ use for you?”
– “What are the ‘not-so-good’ things about ___________ use?”
– “What would it be like if some of those not-so-good things happened less often?”
– “What might make some of those not-so-good things happen less often?”
Volkow, N.D., Baler, R.D., Compton, W.M., & Weiss, S.R.B. (2014). Adverse health effects of marijuana use. The New England Journal of Medicine, 370 (23), 2219-2227.

10/25/2016
4
Volkow, N.D., Baler, R.D., Compton, W.M., & Weiss, S.R.B. (2014). Adverse health effects of marijuana use. The New England Journal of Medicine, 370 (23), 2219-2227.
Documented solidly in the science with “high” confidence
• Addiction
– 9% who experiment become addicted
– 17% who begin in adolescence
– 25-50% of those with daily use• Compared to those who begin using in adulthood, those who begin
in adolescence are 2-4 times as likely to develop cannabis dependence within 2 years
Documented solidly in the science with “high” confidence
• School performance and achievement
– Early marijuana use associated with…
• Impaired school performance
• Increased risk of dropping out of school
– Heavy marijuana use linked to…
• Lower income
• Greater need for socioeconomic assistance
• Unemployment
• Criminal behavior
• Lower satisfaction with life

10/25/2016
5
Documented solidly in the science with “high” confidence
• Motor vehicle accidents
– In accident culpability analysis, people testing positive for THC (minimum detection level of 1 ng per milliliter) were 3 to 7 times as likely to be responsible for a motor vehicle accident as those with no substance use.
– Overall risk of involvement in an accident:• Increases by factor of about 2 after marijuana
• Increases by a factor of almost 5 for those above a .08% for alcohol
Documented solidly in the science with “high” confidence
• Symptoms of chronic bronchitis
• Effect on Brain Development
– Adults with regular marijuana use during adolescence have impaired neural connectivity in precuneus and the fimbria (in the hippocampus)
– Reduced functional connectivity in prefrontal networks responsible for executive function and subcortical networks
– Decreased activity in prefrontal regions and reduced volumes in hippocampus.
Documented in the science with “medium” confidence
10/25/2016
6
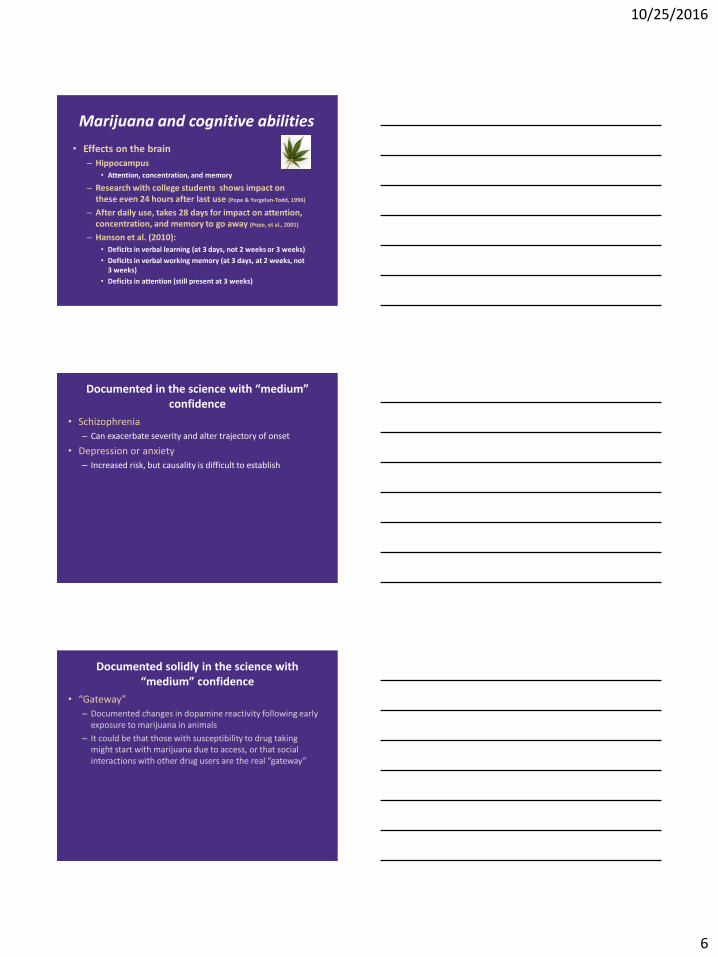
Marijuana and cognitive abilities
• Effects on the brain
– Hippocampus• Attention, concentration, and memory
– Research with college students shows impact on these even 24 hours after last use (Pope & Yurgelun-Todd, 1996)
– After daily use, takes 28 days for impact on attention, concentration, and memory to go away (Pope, et al., 2001)
– Hanson et al. (2010):• Deficits in verbal learning (at 3 days, not 2 weeks or 3 weeks)
• Deficits in verbal working memory (at 3 days, at 2 weeks, not 3 weeks)
• Deficits in attention (still present at 3 weeks)
• Schizophrenia
– Can exacerbate severity and alter trajectory of onset
• Depression or anxiety
– Increased risk, but causality is difficult to establish
Documented in the science with “medium” confidence
• “Gateway”
– Documented changes in dopamine reactivity following early exposure to marijuana in animals
– It could be that those with susceptibility to drug taking might start with marijuana due to access, or that social interactions with other drug users are the real “gateway”
Documented solidly in the science with “medium” confidence

10/25/2016
7
Documented solidly in the science with “low” confidence
• Lung cancer– Confounds with tobacco use are far too pronounced
Washington’s Young Adult Health Survey
Young Adult Health Survey Method and Procedures
• UW Center for the Study of Health and Risk Behaviors (CSHRB) partnered with DBHR to conduct internet survey
• Survey developed using existing validated measures when possible, with input from multiple experts, stakeholder groups, and state offices
• Cohort 1: Internet based survey conducted May through early July 2014 (N=2101)
• Cohort 2: Internet based survey conducted late May through October 2015 (N=1677 new participants, N = 1203 cohort 1 one-year follow up)
• Participants recruited using a combination of direct mail advertising to a random sample from DOL, as well as online advertising (Facebook, Craigslist, Amazon Mechanical Turk, study website, Facebook fan page)

10/25/2016
8
• Assessed demographics on an ongoing basis and modified strategies to recruit under-represented groups
• Convenience sample, not a random sample
• To improve generalizability, used state census data to conduct post-stratification weighting to more accurately reflect the demographic and geographic diversity of Washington
• Weighted results closely mirror the unweightedresults
YAHS Method (Continued)
Wahkiakum
% of sample by county
Cohort-sequential design allows for multiple comparisons:
• Comparisons of the first cohort’s data from 2014 (n=2,101) to the second cohort’s data from 2015 (n=1677).
– These analyses compare changes over one year in two separate cross-sectional samples.
• Comparisons of the first cohort’s data from 2014 to 2015 (n = 1203 participants).
– These findings describe changes over one year within the same cohort of individuals.

10/25/2016
9
Cohort One (year one, 2014) to Cohort Two (year one, 2015)
*
*
*
* p < .05
Comparing Cohort 1 and 2 data from YAHS: Wherepeople got marijuana in the past 30 days
Comparing Cohort 1 and 2 on perceived physical risk of regular marijuana use
* χ2 p = .034
32.9% 40.1% 18.8% 8.3%
33.0% 44.3% 16.4% 6.3%

10/25/2016
10
Cohort 1 vs. Cohort 2 Perceived psychological/emotional/cognitive risk of regular
marijuana use*
* χ2 p = .005
25.4% 37.4% 24.9% 12.4%
27.2% 41.7% 21.2% 9.8%
Cohort 1 vs. Cohort 2 WYAHSPast year recreational marijuana use
46.3%43.5%
Comparing Cohort 1 and 2 data from YAHS: Past year recreational marijuana use

10/25/2016
11
Cohort 1 vs. Cohort 2 driving within 3 hours of marijuana use
50.6 14.1 13.3 6.4 15.6
55.3 13.1 12.3 4.4 14.9
Cohort One (one-year follow-up)
Cohort 1 12-month follow-up Changes in Perceived Physical Risk of Marijuana Use
31.3 43.0 17.8 7.8
31.5 42.8 19.2 6.6

10/25/2016
12
Cohort 1 12-month follow-up Changes in Perceived Psychological Risk of Marijuana
Use
23.3 38.5 26.5 11.7
25.5 39.1 25.7 9.7
Changes in medical marijuana use cohort 1 baseline to 12-month follow-up YAHS
11.7 13.7
* p< .05
Changes in recreational marijuana use cohort 1 baseline to 12-month follow-up
YAHS
42.840.2
* p< .05

10/25/2016
13
Cohort 1, baseline to 12-month follow-up, driving within 3 hours after using marijuana
Among those with past 30-day use (p<.05)
2014 2015
(n=295) (n=316)
0 times 53.99% 61.00%
1 time 15.95% 13.60%
2-3 times 11.19% 13.00%
4-5 times 5.12% 3.17%
6 or more times 13.75% 9.24%
54.0 16.0 11.2 5.1 13.8
61.0 13.6 13.0 3.2 9.2
Cohort 1, 12-month follow-up driving within 3 hours after simultaneous alcohol & marijuana use (so effects
overlap) past 30 days
Among those with past year marijuana use:
2015
(n=487)
0 times 89.51%
1 time 5.76%
2-3 times 3.23%
4-5 times 0.73%
6 or more times 0.78%
89.5 5.8 3.2
Findings from Colorado

10/25/2016
14

10/25/2016
15

10/25/2016
16
A quick look at other current events and emerging issues
Impact of driving under the influence

10/25/2016
17
Emergence of more visible “open-air drug market”
On 4/21/15 from Seattle Times:
“City officials and business leaders say they are embarking on an ambitious effort to shut down open-air drug dealing and associated crime in Seattle’s downtown core with its new ‘9½ Block Strategy.’”

10/25/2016
18
“Seattle residents and visitors should not be forced to navigate a dangerous open-air drug market between the downtown retail core and Pike Place Market,” Murray said.
From Seattle Times, April 23, 2015
The arrests, dubbed “Operation Crosstown Traffic,” involved undercover officers who made 177 purchases of heroin, meth, marijuana, crack cocaine and other drugs from 186 street dealers.”
Impact of advertisements needs to be assessed
10/25/2016
19
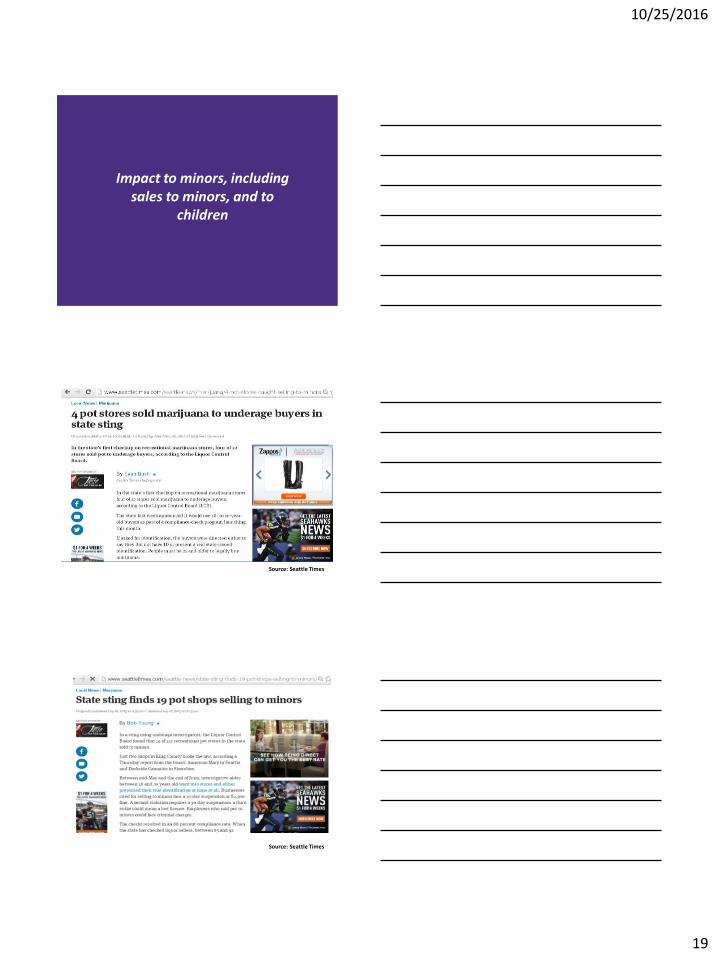
Impact to minors, including sales to minors, and to
children
Source: Seattle Times
Source: Seattle Times

10/25/2016
20
Source: Seattle Magazine
Implications and Opportunities for Prevention
How Can We Use This Information to Prevent & Reduce Harm from Marijuana?
• Correct Normative Misperceptions
– Most people are not using
– Most people are not driving under the influence• Varies by frequency of use, such that higher frequency of use is associated
with higher frequency of driving within 3 hours of use– Those using 2-3 times per month or less: 18.7%
– Those using weekly or more: 51.0%
– The more people use, the more they think others are using:• Perceived percentage of people your age using marijuana:
– Those who never use: 59.0%
– Those who use less than 2-3 times per month: 63.8%
– Those who use weekly or more: 69.3%
– Opportunity for positive community norms (e.g., Jeff Linkenbach)

10/25/2016
21
How Can We Use This Information to Prevent & Reduce Harm from Marijuana?
• Increase Risk Perception
– Target consequences young people report they do not like
• “The Munchies”– Those using 2-3 times per month or less: 77.2%
– Those using weekly or more: 95.1%
• Low motivation– Those using 2-3 times per month or less: 38.2%
– Those using weekly or more: 61.6%
• Trouble remembering– Those using 2-3 times per month or less: 40.2%
– Those using weekly or more: 64.9%
– Provide information relevant to their individual concerns
How Can We Use This Information to Prevent & Reduce Harm from Marijuana?
• Reduce Motivation to Use/Misuse
– Already signs of some efforts of wanting to change:
• Tried to set limits on use– Those using 2-3 times per month or less: 34.1%
– Those using weekly or more: 54.0%
• Tried to cut down– Those using 2-3 times per month or less: 27.0%
– Those using weekly or more: 39.5%
– Effective coping; healthy alternatives
How Can We Use This Information to Prevent & Reduce Harm from Marijuana?
• Increase Motivation to Change for Heavier Users
– Brief Motivational Interventions show promise
– Chance to provide education about addiction and withdrawal

10/25/2016
22
How Can We Use This Information to Prevent & Reduce Harm from Marijuana?
• Enforce Policy Restrictions on Access, Public Use
– NIAAA’s College Alcohol Intervention Matrix (CollegeAIM) emphasizes importance of environmental approaches, including enforcement
• Provide resources for prevention, treatment, & research
Thank You! • Al Fredrickson
• DBHR for their funding and leadership, with special thanks to:
– Can Du, Grace Hong, Sarah Mariani, Michael Langer
• Washington Young Adult Health Survey Team Members
– Jason Kilmer (PI), Mary Larimer, Jessica Cronce, Isaac Rhew, Theresa Walter, Tim Pace