powering the planet - california institute of...
TRANSCRIPT
Powering the PlanetNathan S. Lewis, California Institute of Technology

Global Energy Perspective
• Present Energy Perspective• Future Constraints Imposed by Sustainability• Challenges in Exploiting Carbon-Neutral Energy Sources Economically on the Needed Scale
Nathan S. Lewis, California Institute of TechnologyDivision of Chemistry and Chemical Engineering
Pasadena, CA 91125http://nsl.caltech.edu

“Energy is the single most important challenge facing humanity today.”Nobel Laureate Rick Smalley, April 2004, Testimony to U.S. Senate
”..energy is the single most important scientific and technological challengefacing humanity in the 21st century..”: Chemical and Engineering News,August 22, 2005.
“What should be the centerpiece of a policy of American renewal isblindingly obvious: making a quest for energy independence the moon shotof our generation“, Thomas L. Friedman, New York Times, Sept. 23, 2005.
“The time for progress is now. .. it is our responsibility to lead in thismission”, Susan Hockfield, on energy, in her MIT Inauguration speech.
Perspective
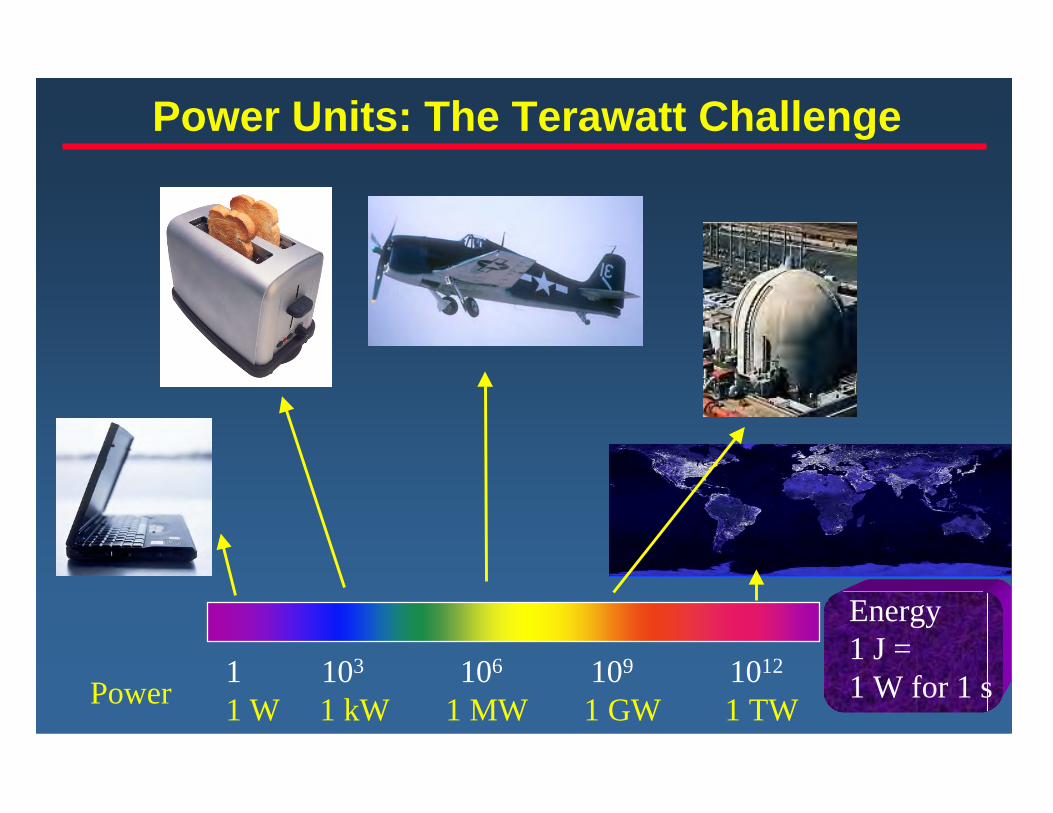
Power Units: The Terawatt Challenge
Power1 103 106 109 1012
1 W 1 kW 1 MW 1 GW 1 TW
Energy1 J = 1 W for 1 s
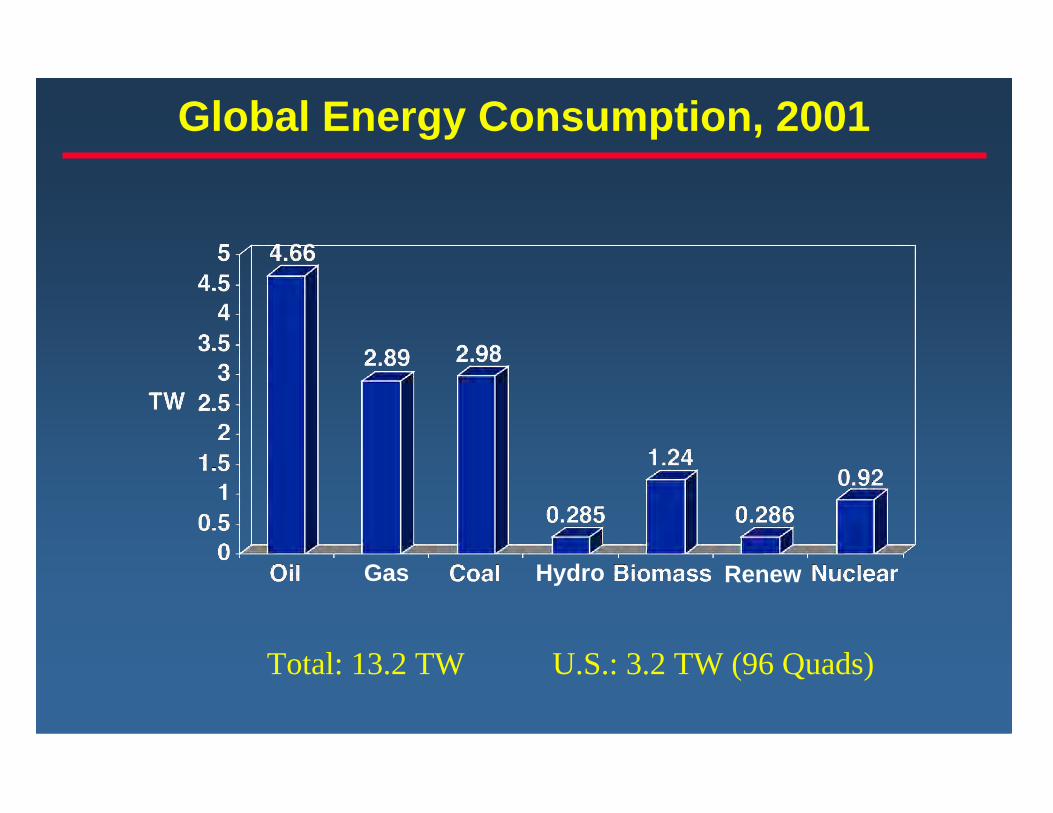
Global Energy Consumption, 2001
Gas Hydro Renew
Total: 13.2 TW U.S.: 3.2 TW (96 Quads)
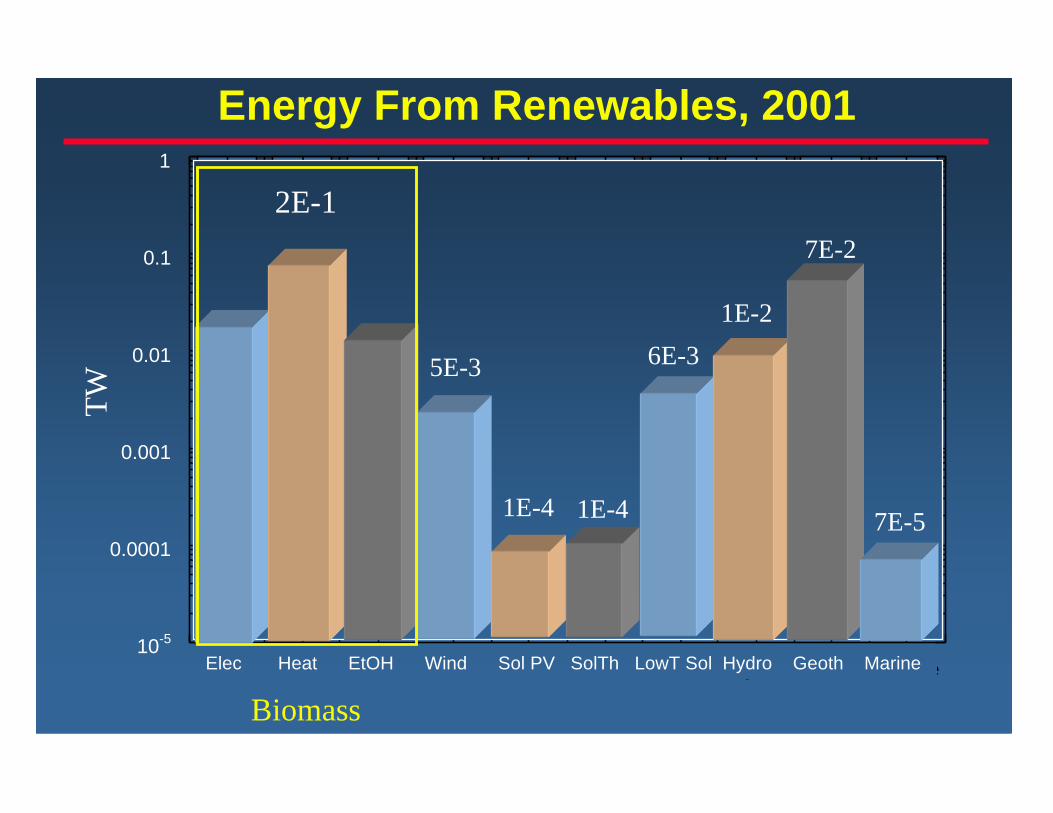
Energy From Renewables, 2001
10-5
0.0001
0.001
0.01
0.1
1
Elect Heat EtOH Wind Solar PVSolar Th.Low T Sol HtHydro Geoth MarineElec Heat EtOH Wind Sol PV SolTh LowT Sol Hydro Geoth Marine
TW
Biomass
1E-4
2E-1
5E-3
1E-4
6E-31E-2
7E-2
7E-5
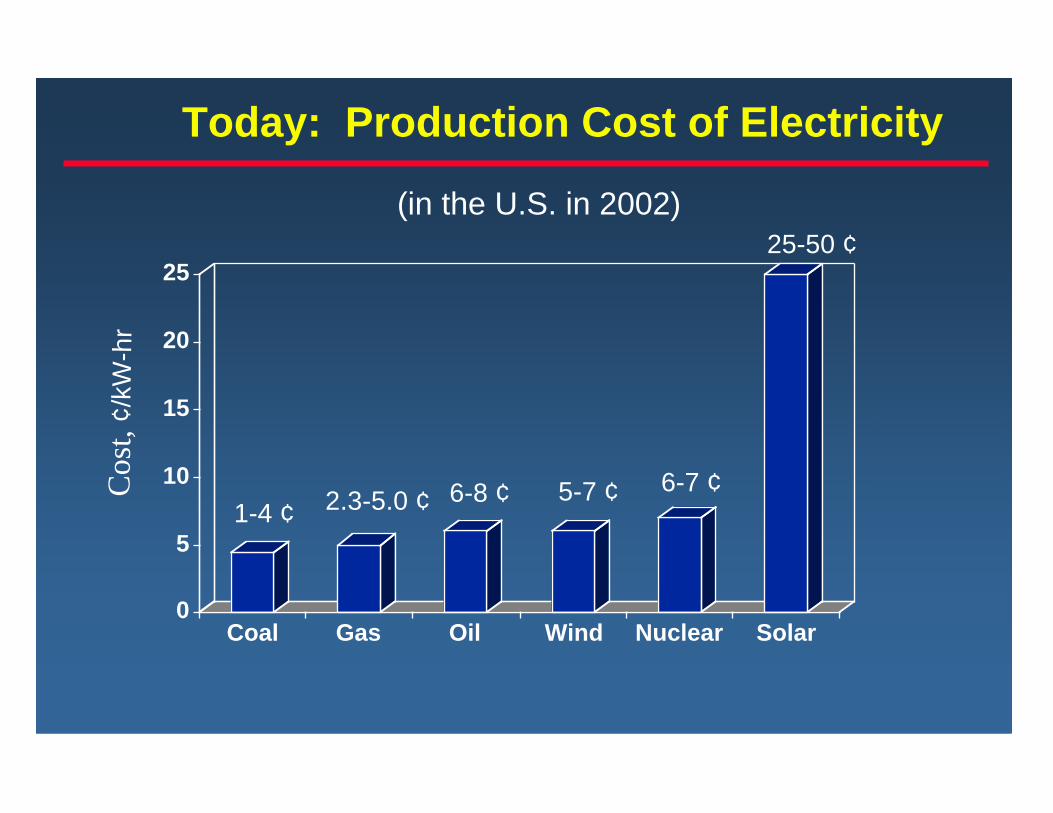
(in the U.S. in 2002)
1-4 ¢ 2.3-5.0 ¢ 6-8 ¢ 5-7 ¢
Today: Production Cost of Electricity
0
5
10
15
20
25
Coal Gas Oil Wind Nuclear Solar
Cost6-7 ¢
25-50 ¢
Cos
t, ¢/
kW-h
r
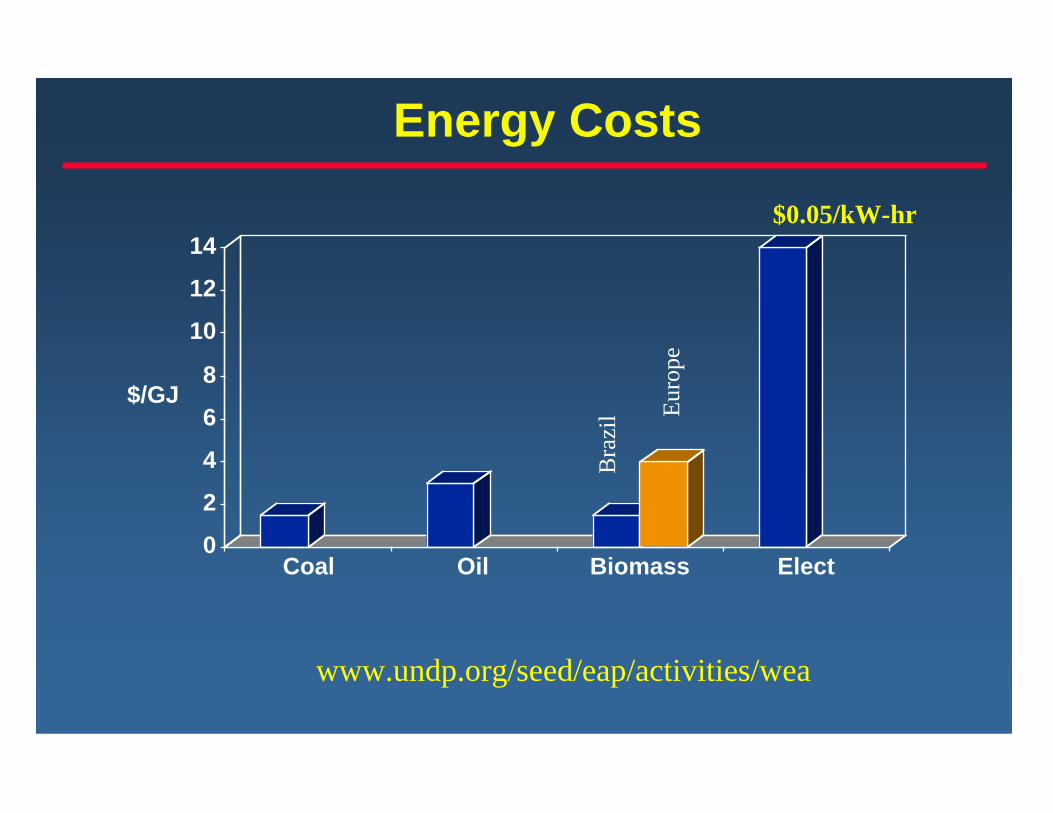
Energy Costs
02468
101214
$/GJ
Coal Oil Biomass ElectB
razi
l Euro
pe
$0.05/kW-hr
www.undp.org/seed/eap/activities/wea

Energy Reserves and Resources
020000400006000080000
100000120000140000160000180000
(Exa)J
OilRsv
OilRes
GasRsv
GasRes
CoalRsv
CoalRes
UnconvConv
Reserves/(1998 Consumption/yr) Resource Base/(1998 Consumption/yr)
Oil 40-78 51-151Gas 68-176 207-590Coal 224 2160
Rsv=ReservesRes=Resources

Oil Supply Curves
WEO est.required totalneed to 2030

• Abundant, Inexpensive Resource Base of Fossil Fuels
• Renewables will not play a large role in primary power generation unless/until:
–technological/cost breakthroughs are achieved, or–unpriced externalities are introduced (e.g., environmentally-driven carbon taxes)
Conclusions

• “It’s hard to make predictions, especially about the future”
• M. I. Hoffert et. al., Nature, 1998, 395, 881, “Energy Implications of Future Atmospheric Stabilization of CO2 Content
adapted from IPCC 92 Report: Leggett, J. et. al. in Climate Change, The Supplementary Report to theScientific IPCC Assessment, 69-95, Cambridge Univ. Press, 1992
Energy and Sustainability
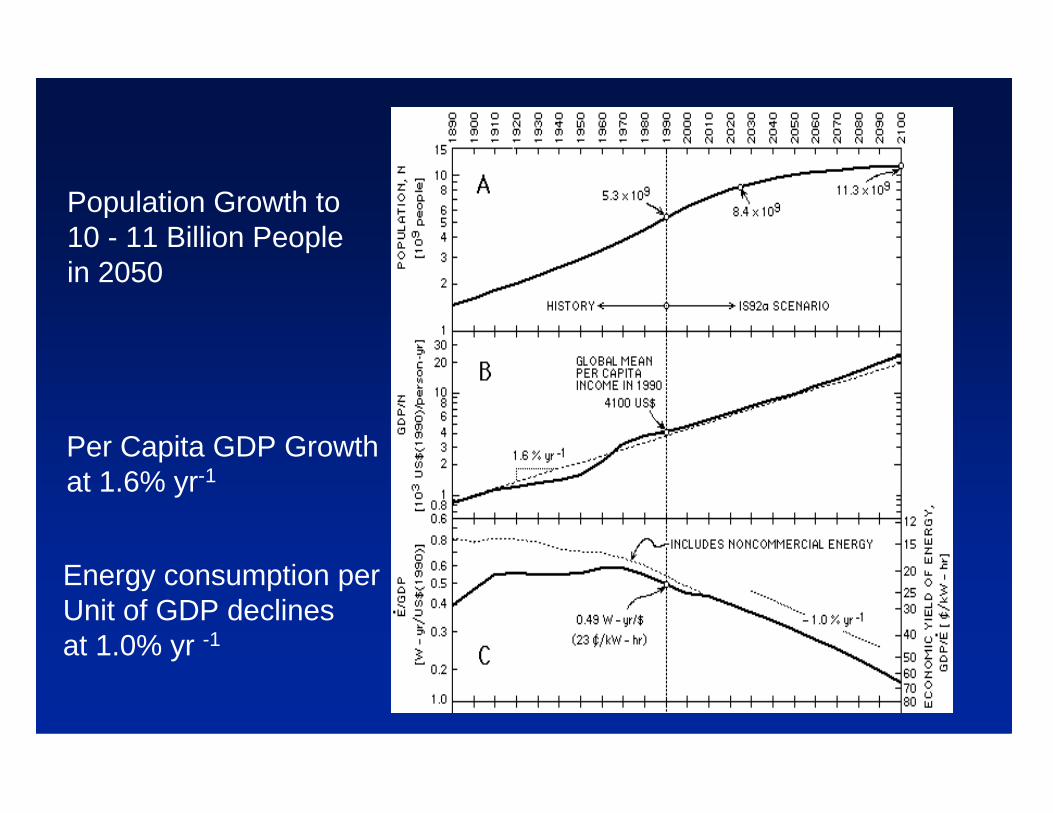
Population Growth to10 - 11 Billion Peoplein 2050
Per Capita GDP Growthat 1.6% yr-1
Energy consumption perUnit of GDP declinesat 1.0% yr -1
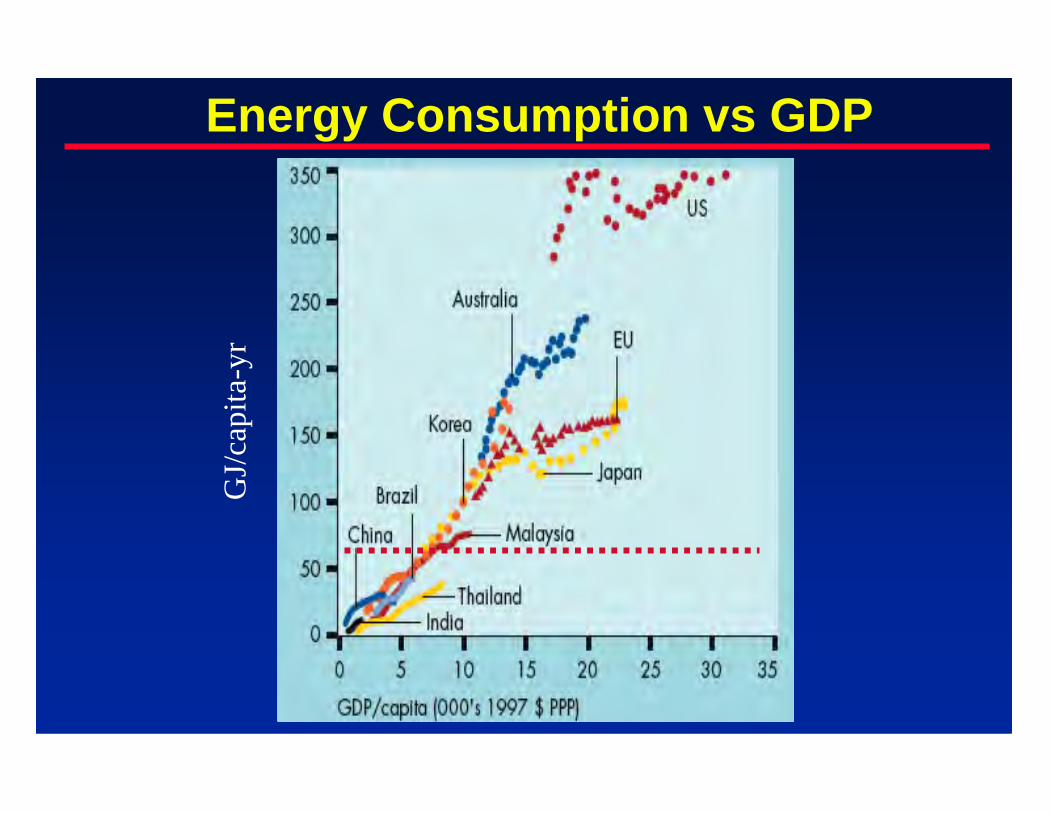
Energy Consumption vs GDP
GJ/
capi
ta-y
r

1990: 12 TW 2050: 28 TW
Total Primary Power vs Year

M. I. Hoffert et. al., Nature, 1998, 395, 881
Carbon Intensity of Energy Mix
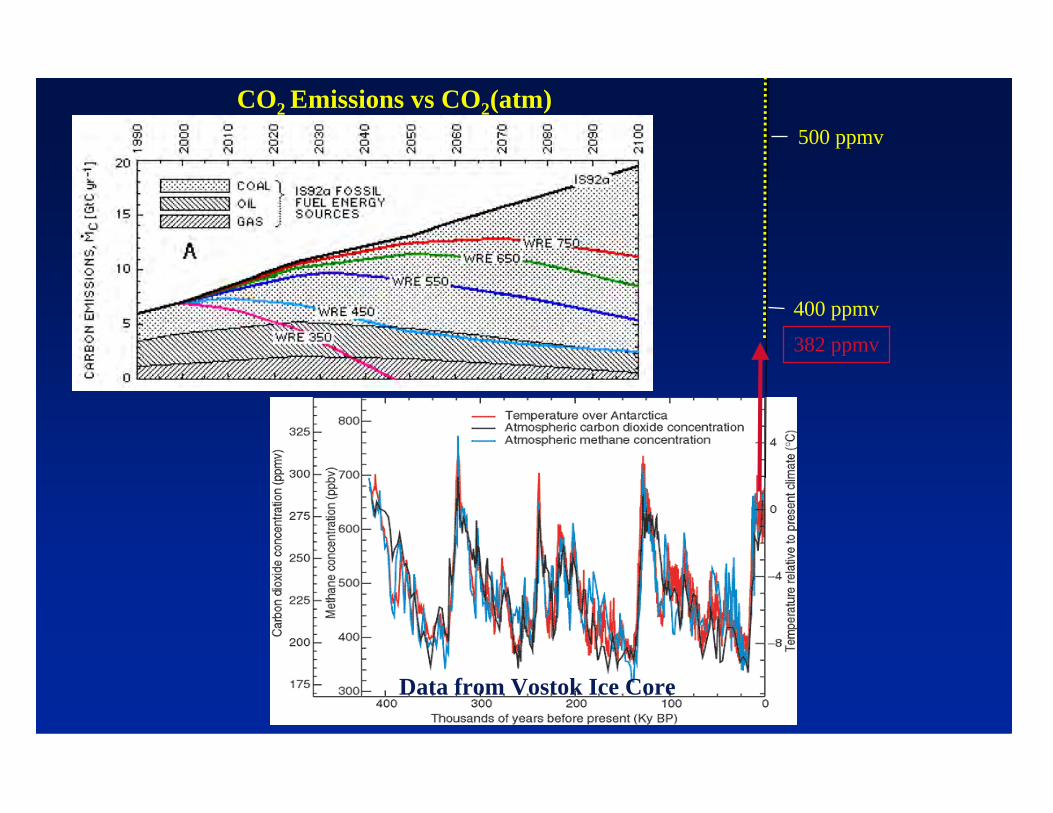
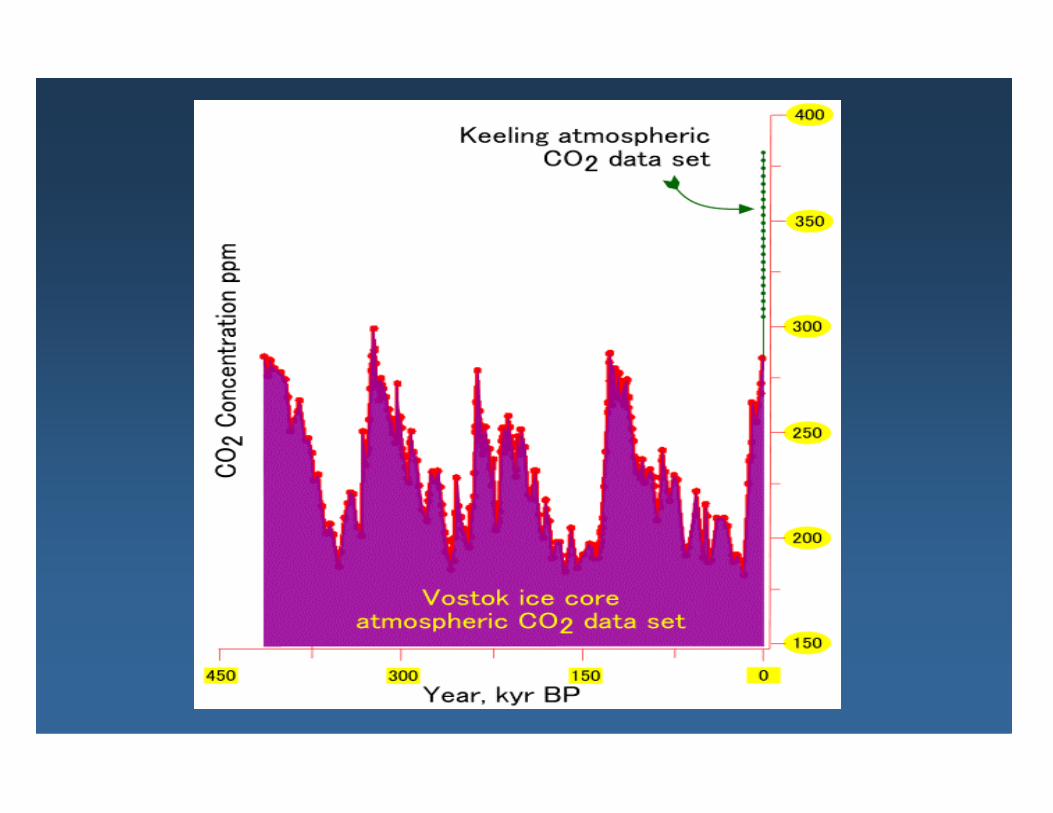
CO2 Emissions vs CO2(atm)
Data from Vostok Ice Core
400 ppmv
500 ppmv
382 ppmv
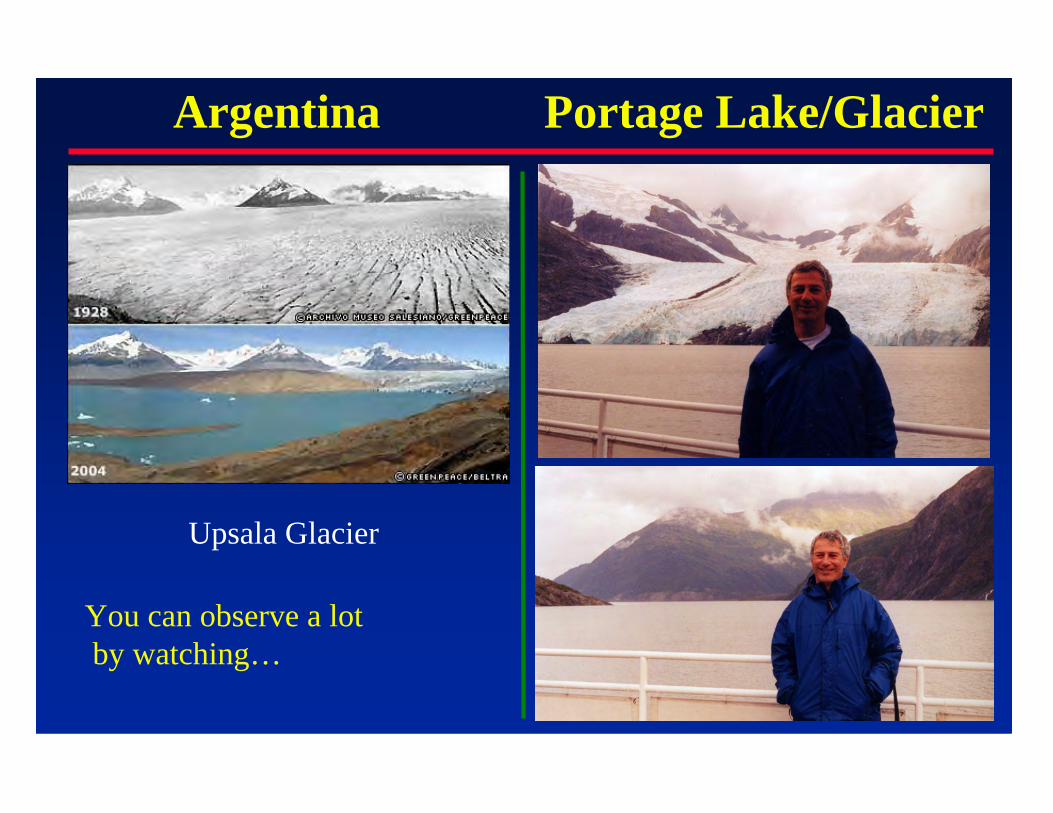
Argentina
Upsala Glacier
Portage Lake/Glacier
You can observe a lot by watching…
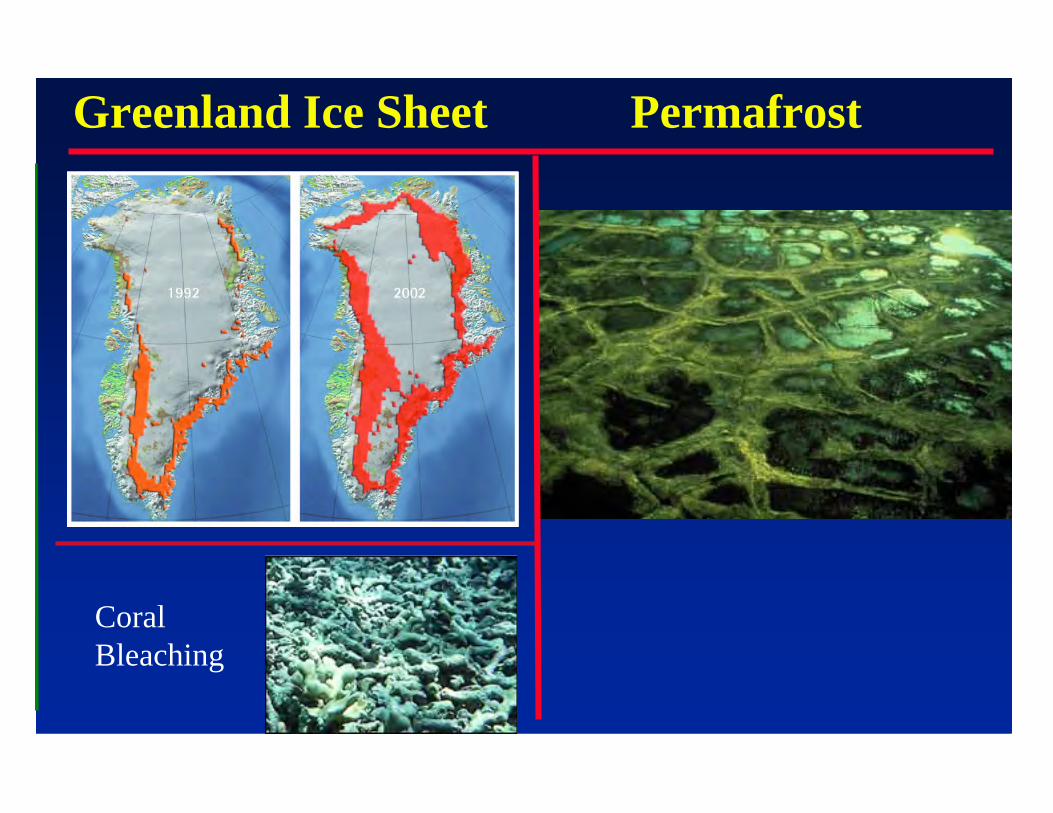
PermafrostGreenland Ice Sheet
CoralBleaching
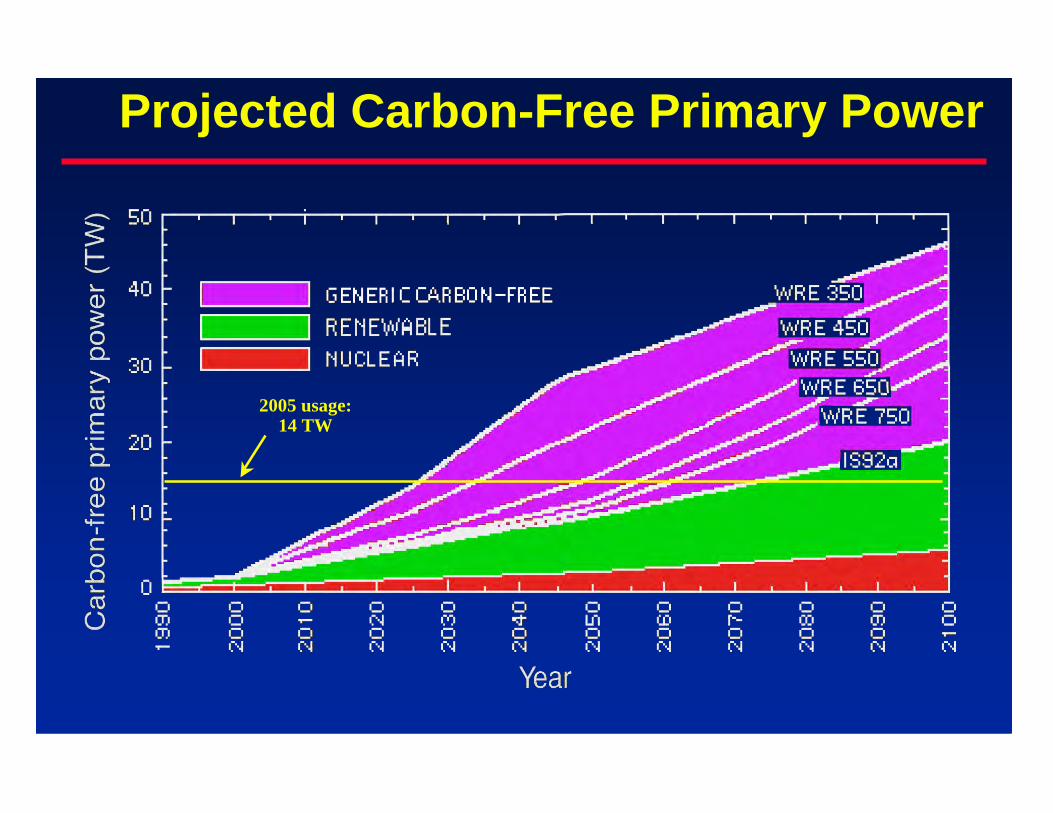
Projected Carbon-Free Primary Power
2005 usage:14 TW
• “These results underscore the pitfalls of “wait and see”.”
• Without policy incentives to overcome socioeconomic inertia,development of needed technologies will likely not occur soonenough to allow capitalization on a 10-30 TW scale by 2050
• “Researching, developing, and commercializing carbon-freeprimary power technologies capable of 10-30 TW by the mid-21st
century could require efforts, perhaps international, pursued withthe urgency of the Manhattan Project or the Apollo SpaceProgram.”
Hoffert et al.’s Conclusions

• If we need such large amounts of carbon-free power, then:
• current pricing is not the driver for year 2050 primaryenergy supply
• Hence,
• Examine energy potential of various forms of renewableenergy
• Examine technologies and costs of various renewables
• Examine impact on secondary power infrastructure andenergy utilization
Lewis’ Conclusions

• Nuclear (fission and fusion)• 10 TW = 10,000 new 1 GW reactors• i.e., a new reactor every other day for the next 50 years
’ 2.3 million tonnes proven reserves;1 TW-hr requires 22 tonnes of U
’ Hence at 10 TW provides 1 year of energy’ Terrestrial resource base provides 10 years
of energy’ Would need to mine U from seawater
(700 x terrestrial resource base; so needs 3000 Niagra Falls or breeders)
• Carbon sequestration
• Renewables
Sources of Carbon-Free Power
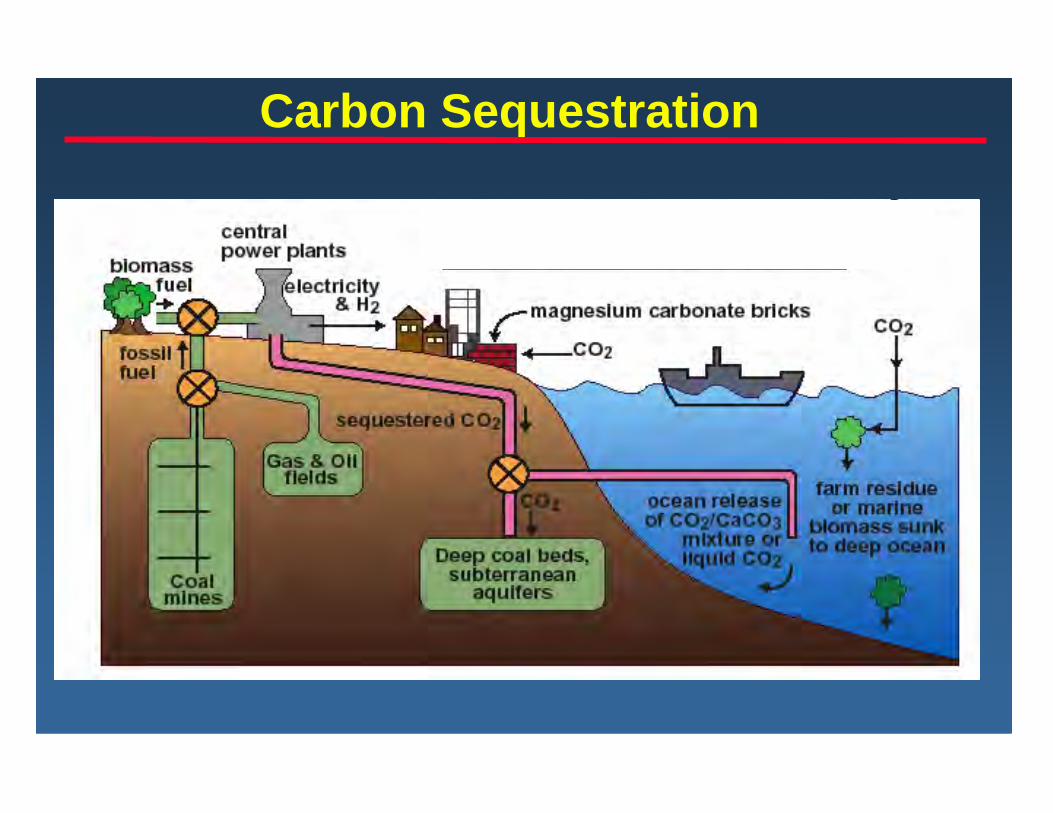
Carbon Sequestration

130 Gt total U.S. sequestration potentialGlobal emissions 6 Gt/yr in 2002 Test sequestration projects 2002-2004
CO2 Burial: Saline Reservoirs
Study Areas
One FormationStudied
Two FormationsStudied
Power Plants (dot size proportionalto 1996 carbon emissions)
DOE Vision & Goal:1 Gt storage by 2025, 4 Gt by 2050
• Near sources(power plants,refineries, coalfields)• Distribute onlyH2 or electricity
• Must not leak•At 2 Gt/yrsequestrationrate, surface ofU.S. would rise10 cm by 2100

• Hydroelectric
• Geothermal
• Ocean/Tides
• Wind
• Biomass
• Solar
Potential of Renewable Energy
Globally
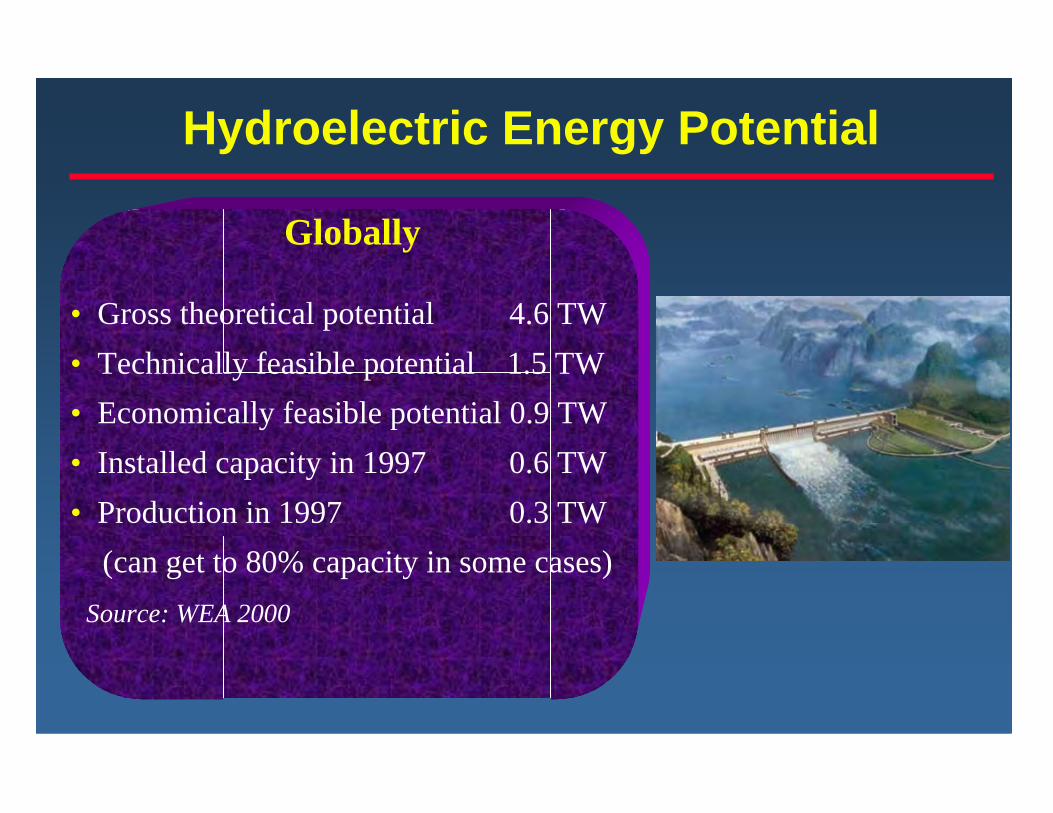
• Gross theoretical potential 4.6 TW• Technically feasible potential 1.5 TW• Economically feasible potential 0.9 TW• Installed capacity in 1997 0.6 TW• Production in 1997 0.3 TW (can get to 80% capacity in some cases) Source: WEA 2000
Hydroelectric Energy Potential
Geothermal Energy
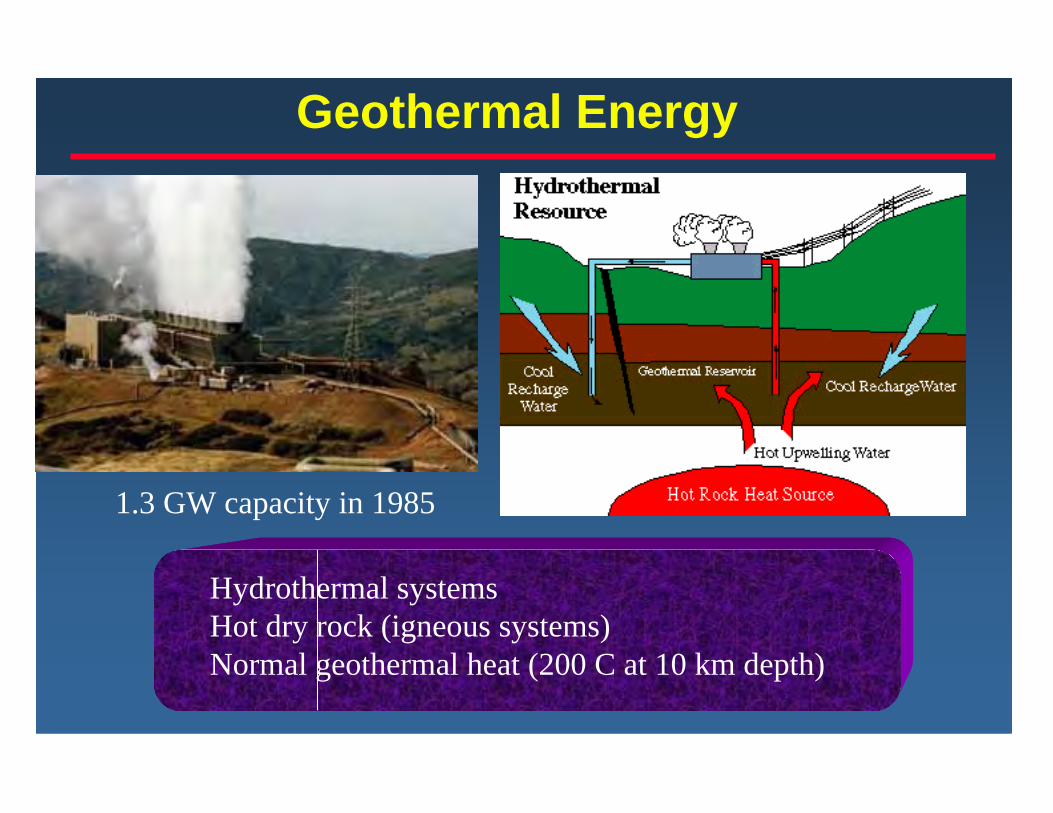
Hydrothermal systemsHot dry rock (igneous systems)Normal geothermal heat (200 C at 10 km depth)
1.3 GW capacity in 1985
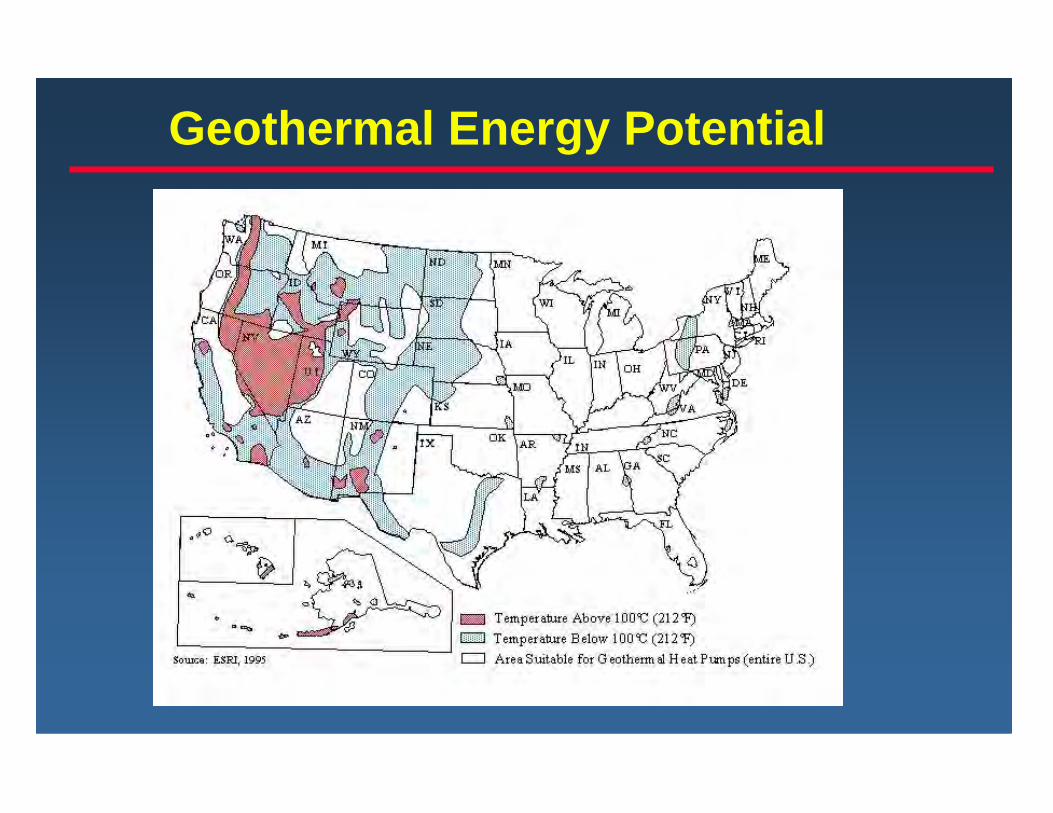
Geothermal Energy Potential
Geothermal Energy Potential
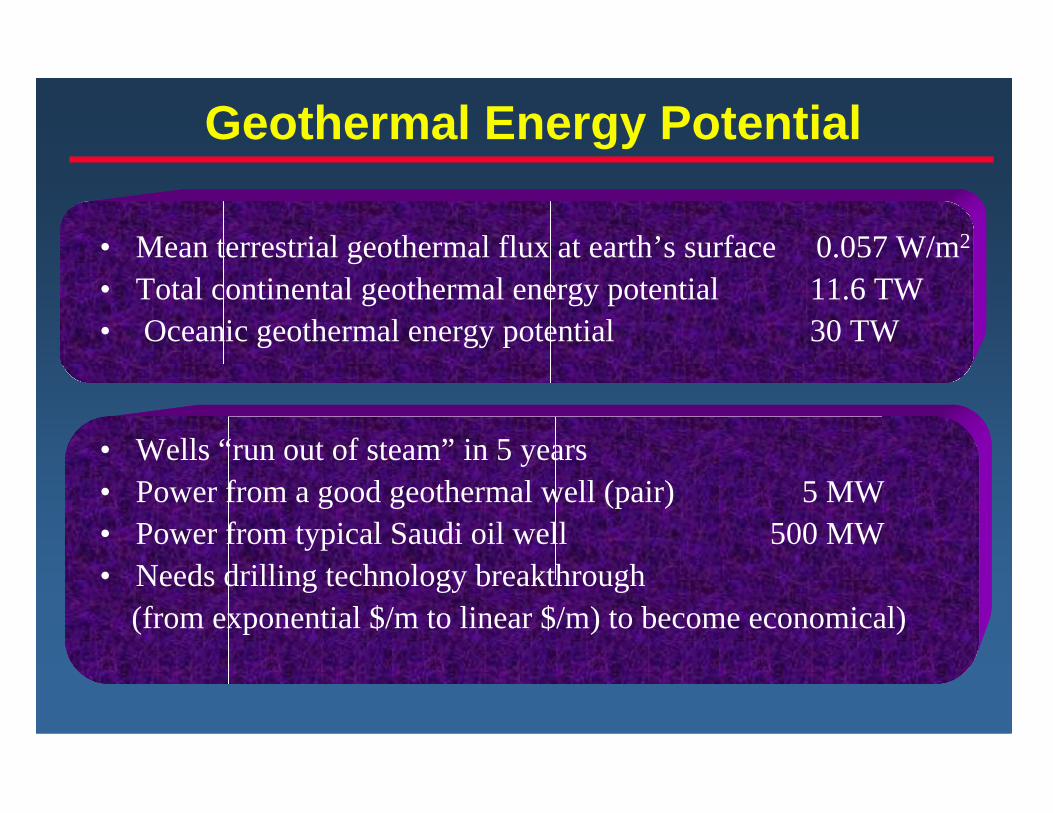
• Mean terrestrial geothermal flux at earth’s surface 0.057 W/m2
• Total continental geothermal energy potential 11.6 TW• Oceanic geothermal energy potential 30 TW
• Wells “run out of steam” in 5 years• Power from a good geothermal well (pair) 5 MW• Power from typical Saudi oil well 500 MW• Needs drilling technology breakthrough (from exponential $/m to linear $/m) to become economical)
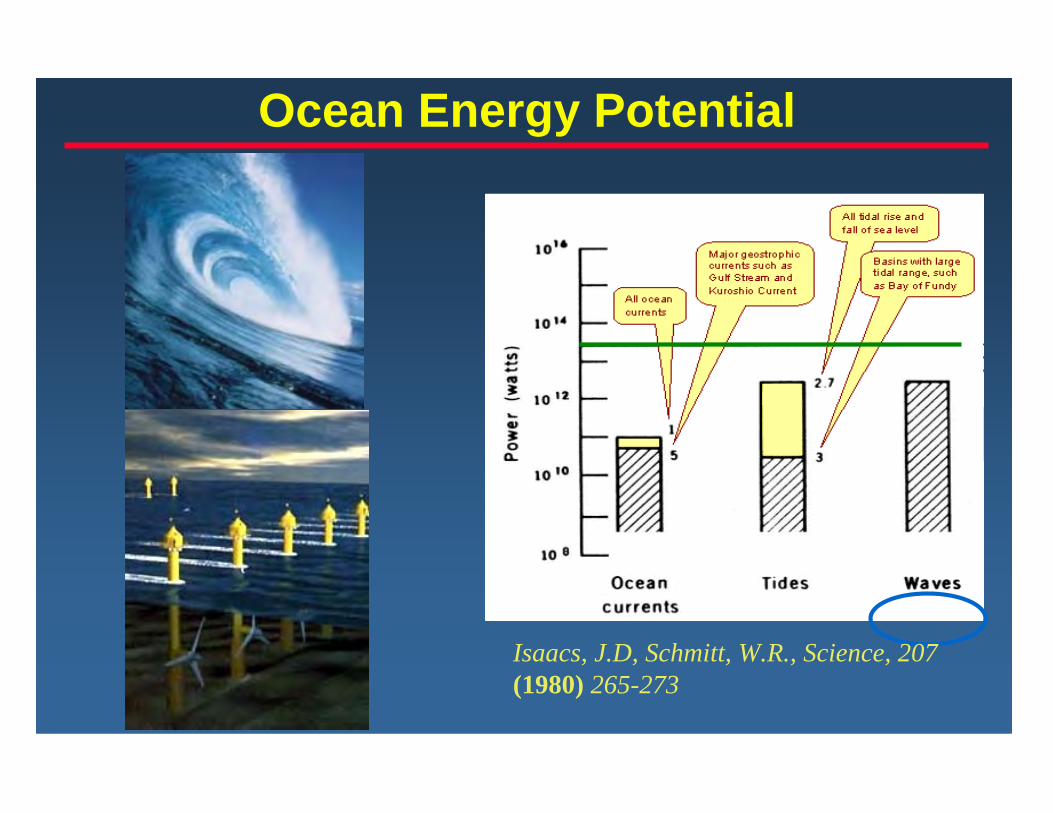
Ocean Energy Potential
Isaacs, J.D, Schmitt, W.R., Science, 207(1980) 265-273
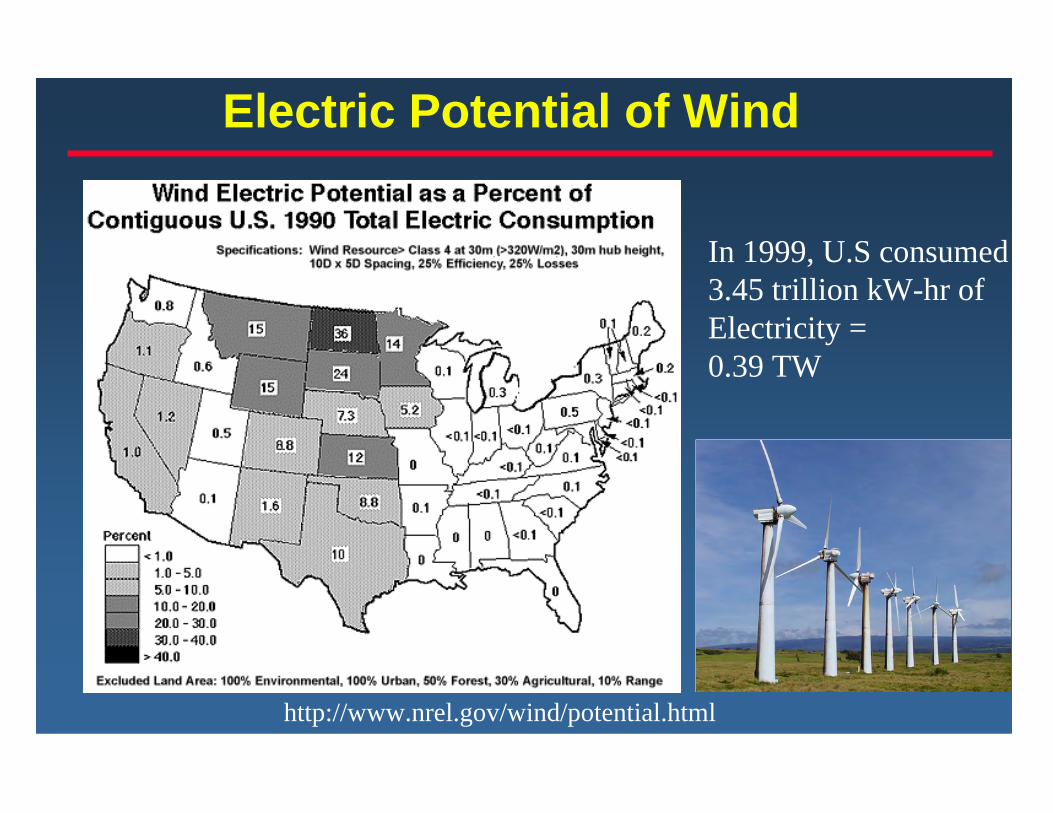
Electric Potential of Wind
http://www.nrel.gov/wind/potential.html
In 1999, U.S consumed3.45 trillion kW-hr ofElectricity =0.39 TW

• Top-down: Downward kinetic energy flux: 2 W/m2
Total land area: 1.5x10¹⁴ m2 Hence total available energy = 300 TW Extract <10%, 30% of land, 30% generation efficiency: 2-4 TW electrical generation potential
• Bottom-Up:Theoretical: 27% of earth’s land surface is class 3 (250-300W/m2 at 50 m) or greaterIf use entire area, electricity generation potential of 50 TWPractical: 2 TW electrical generation potential (4% utilizationof ≥class 3 land area, IPCC 2001)
Off-shore potential is larger but must be close to grid to beinteresting; (no installation > 20 km offshore now)
Global Potential of Terrestrial Wind
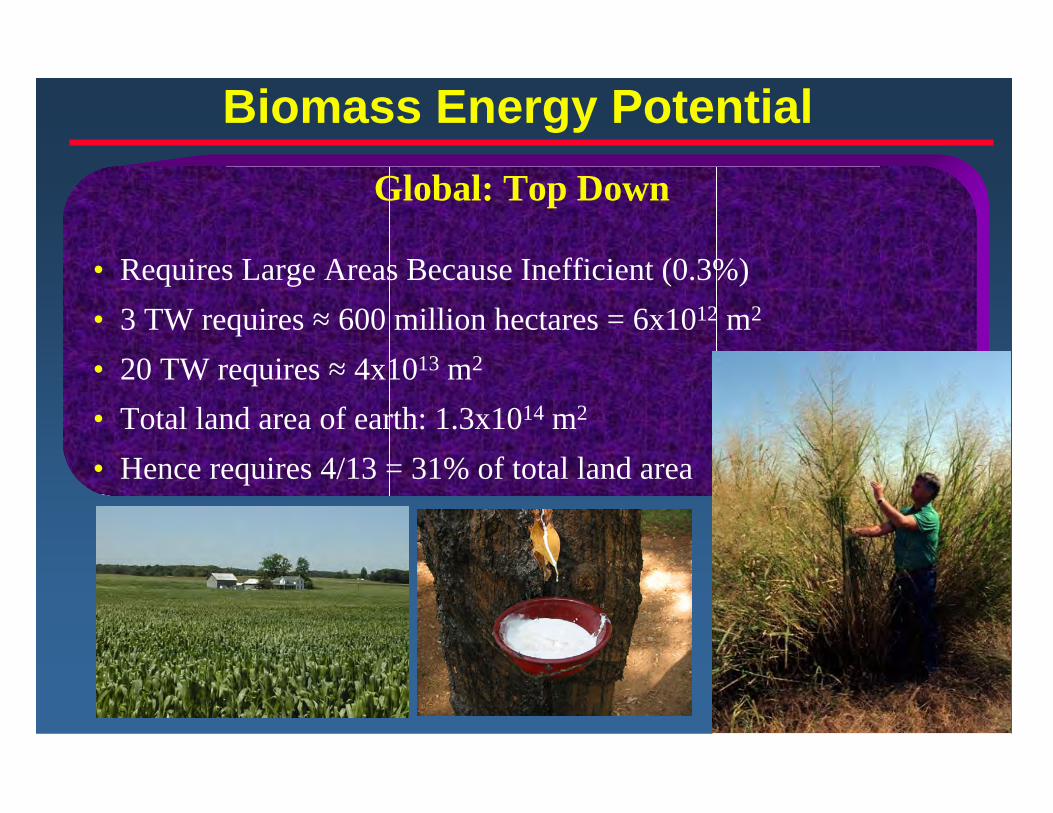
Global: Top Down
• Requires Large Areas Because Inefficient (0.3%)• 3 TW requires ≈ 600 million hectares = 6x10¹² m2
• 20 TW requires ≈ 4x10¹³ m2
• Total land area of earth: 1.3x10¹⁴ m2
• Hence requires 4/13 = 31% of total land area
Biomass Energy Potential

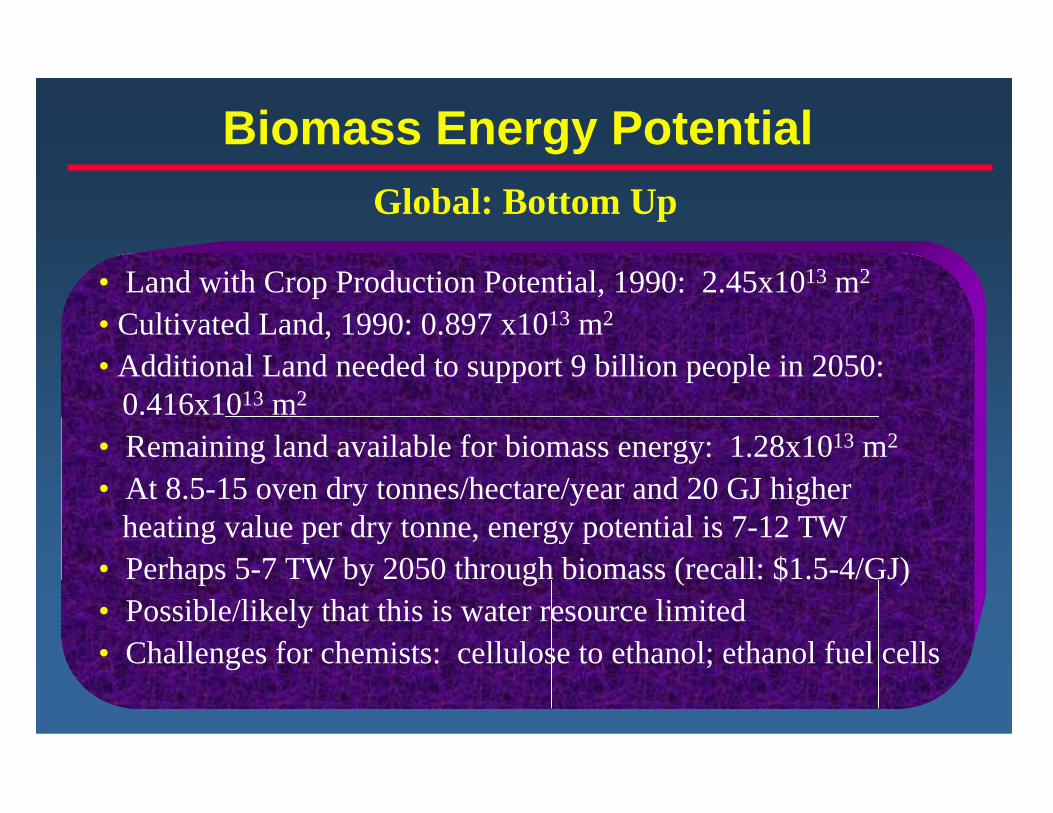
• Land with Crop Production Potential, 1990: 2.45x10¹³ m2
• Cultivated Land, 1990: 0.897 x10¹³ m2
• Additional Land needed to support 9 billion people in 2050: 0.416x10¹³ m2
• Remaining land available for biomass energy: 1.28x10¹³ m2
• At 8.5-15 oven dry tonnes/hectare/year and 20 GJ higher heating value per dry tonne, energy potential is 7-12 TW• Perhaps 5-7 TW by 2050 through biomass (recall: $1.5-4/GJ)• Possible/likely that this is water resource limited• 14% of U.S. corn provides 2% of transportation fuel• Challenges for chemists: cellulose to ethanol; ethanol fuel cells
Biomass Energy PotentialGlobal: Bottom Up
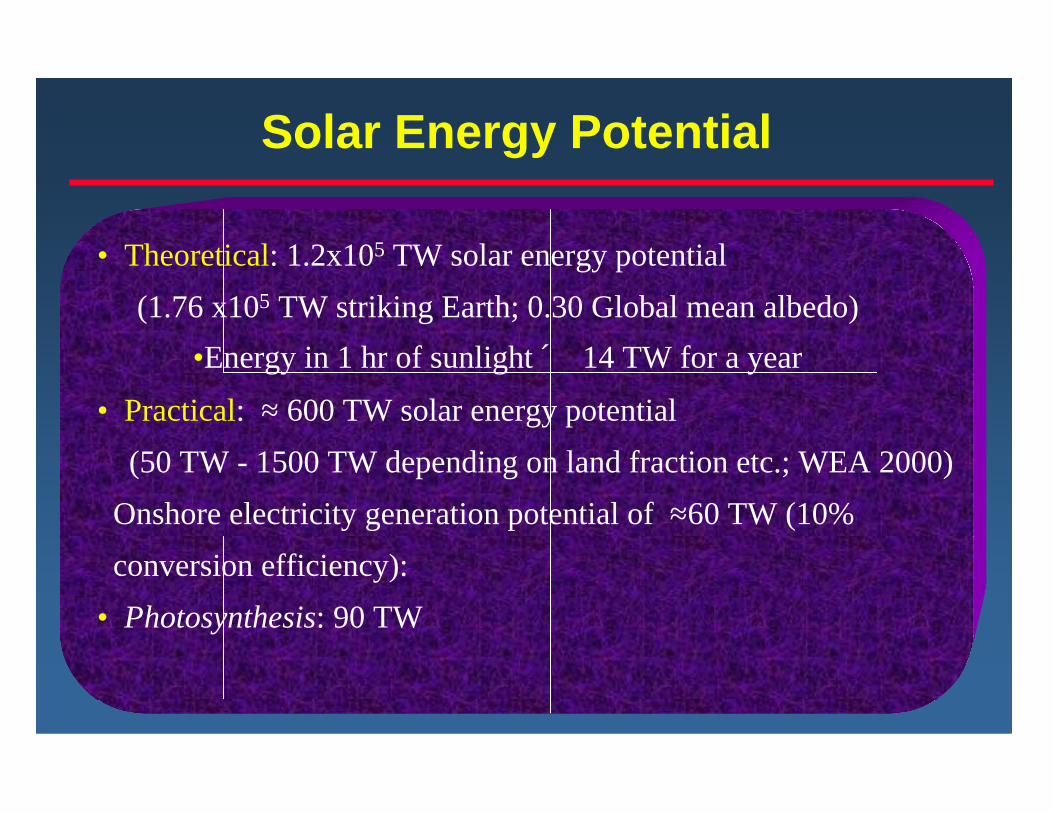
• Theoretical: 1.2x10⁵ TW solar energy potential (1.76 x10⁵ TW striking Earth; 0.30 Global mean albedo)
•Energy in 1 hr of sunlight ´ 14 TW for a year
• Practical: ≈ 600 TW solar energy potential (50 TW - 1500 TW depending on land fraction etc.; WEA 2000) Onshore electricity generation potential of ≈60 TW (10% conversion efficiency):• Photosynthesis: 90 TW
Solar Energy Potential
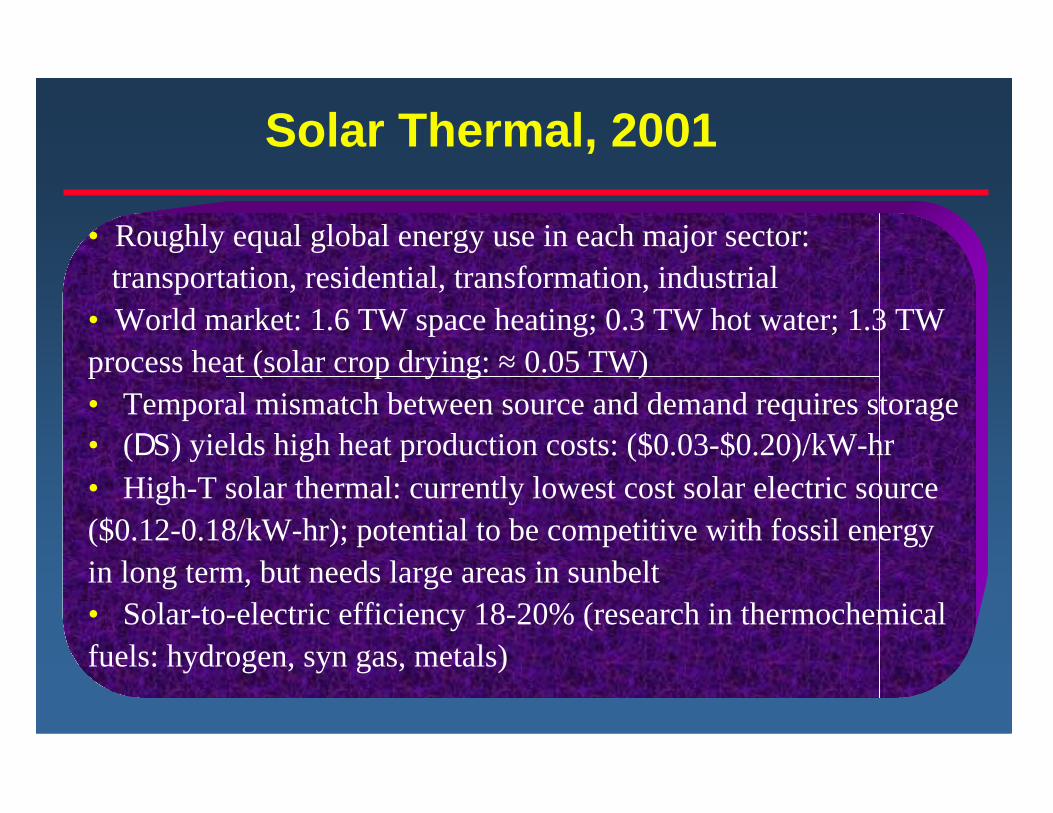
• Roughly equal global energy use in each major sector: transportation, residential, transformation, industrial• World market: 1.6 TW space heating; 0.3 TW hot water; 1.3 TWprocess heat (solar crop drying: ≈ 0.05 TW)• Temporal mismatch between source and demand requires storage• (DS) yields high heat production costs: ($0.03-$0.20)/kW-hr• High-T solar thermal: currently lowest cost solar electric source($0.12-0.18/kW-hr); potential to be competitive with fossil energyin long term, but needs large areas in sunbelt• Solar-to-electric efficiency 18-20% (research in thermochemicalfuels: hydrogen, syn gas, metals)
Solar Thermal, 2001

Solar Land Area Requirements
3 TW

Solar Land Area Requirements
6 Boxes at 3.3 TW Each

• U.S. Land Area: 9.1x10¹² m2 (incl. Alaska)
• Average Insolation: 200 W/m2
• 2000 U.S. Primary Power Consumption: 99 Quads=3.3 TW• 1999 U.S. Electricity Consumption = 0.4 TW
• Hence: 3.3x10¹² W/(2x102 W/m2 x 10% Efficiency) = 1.6x10¹¹ m2
Requires 1.6x10¹¹ m2/ 9.1x10¹² m2 = 1.7% of Land
Solar Land Area Requirements
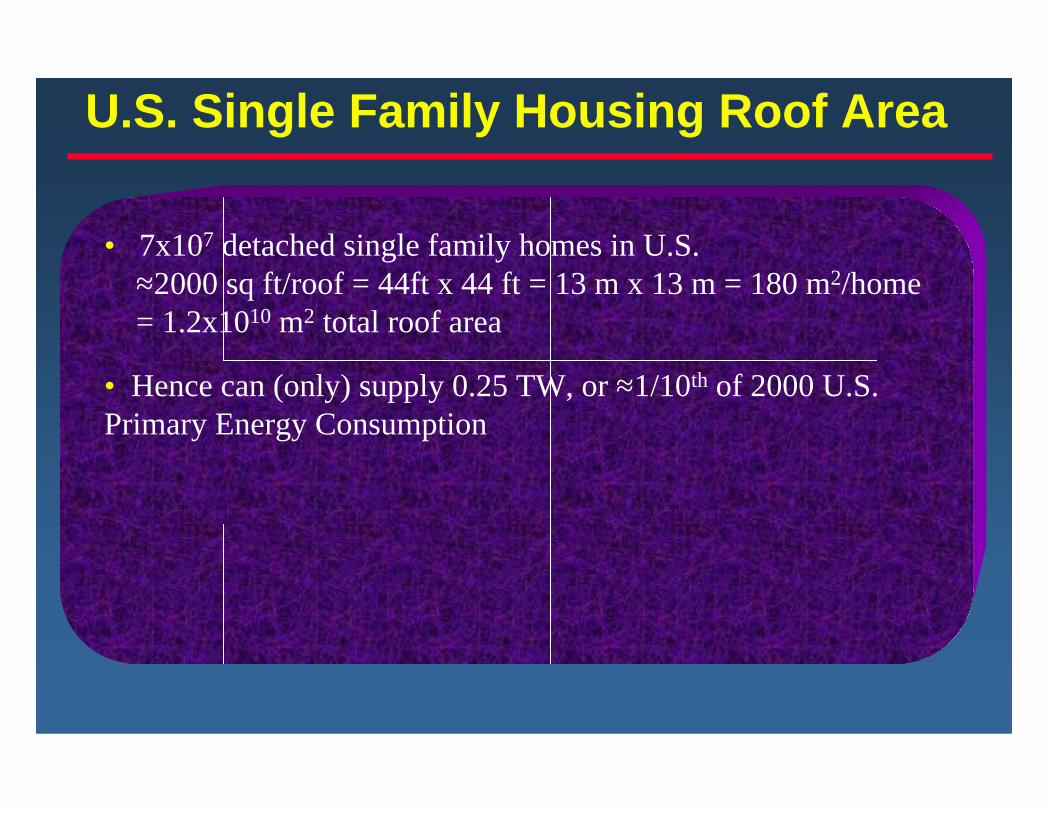
• 7x10⁷ detached single family homes in U.S. ≈2000 sq ft/roof = 44ft x 44 ft = 13 m x 13 m = 180 m2/home = 1.2x10¹⁰ m2 total roof area
• Hence can (only) supply 0.25 TW, or ≈1/10th of 2000 U.S.Primary Energy Consumption
U.S. Single Family Housing Roof Area

LightFuel
Electricity
Photosynthesis
Fuels Electricity
Photovoltaics
sc
e
SC
CO
Sugar
H O
O
2
2
2
Energy Conversion Strategies
Semiconductor/LiquidJunctions
H2O
O H22
SC

Cost/Efficiency of Photovoltaic Technology
Costs are modules per peak W; installed is $5-10/W; $0.35-$1.5/kW-hr
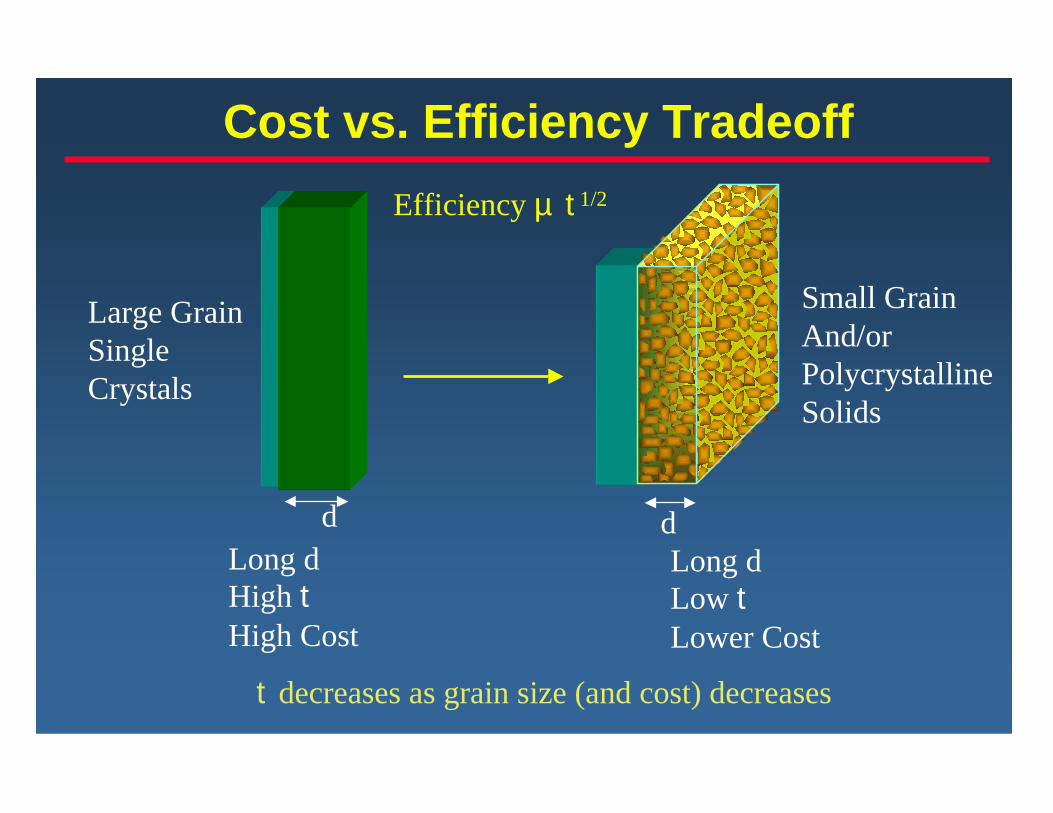
Cost vs. Efficiency TradeoffEfficiency µ t1/2
Long dHigh tHigh Cost
dLong dLow tLower Cost
d
t decreases as grain size (and cost) decreases
Large GrainSingleCrystals
Small GrainAnd/orPolycrystallineSolids

Cost vs. Efficiency TradeoffEfficiency µ t1/2
Long dHigh tHigh Cost
dLong dLow tLower Cost
d
t decreases as material (and cost) decreases
OrderedCrystallineSolids
DisorderedOrganicFilms

Nanotechnology Solar Cell Design

Cost/Efficiency of “Solar Farms”
Costs are modules per peak W; installed is $5-10/W; $0.35-$1.5/kW-hr

The Need to Produce Fuel“Power Park Concept”
Fuel Production
Distribution
Storage
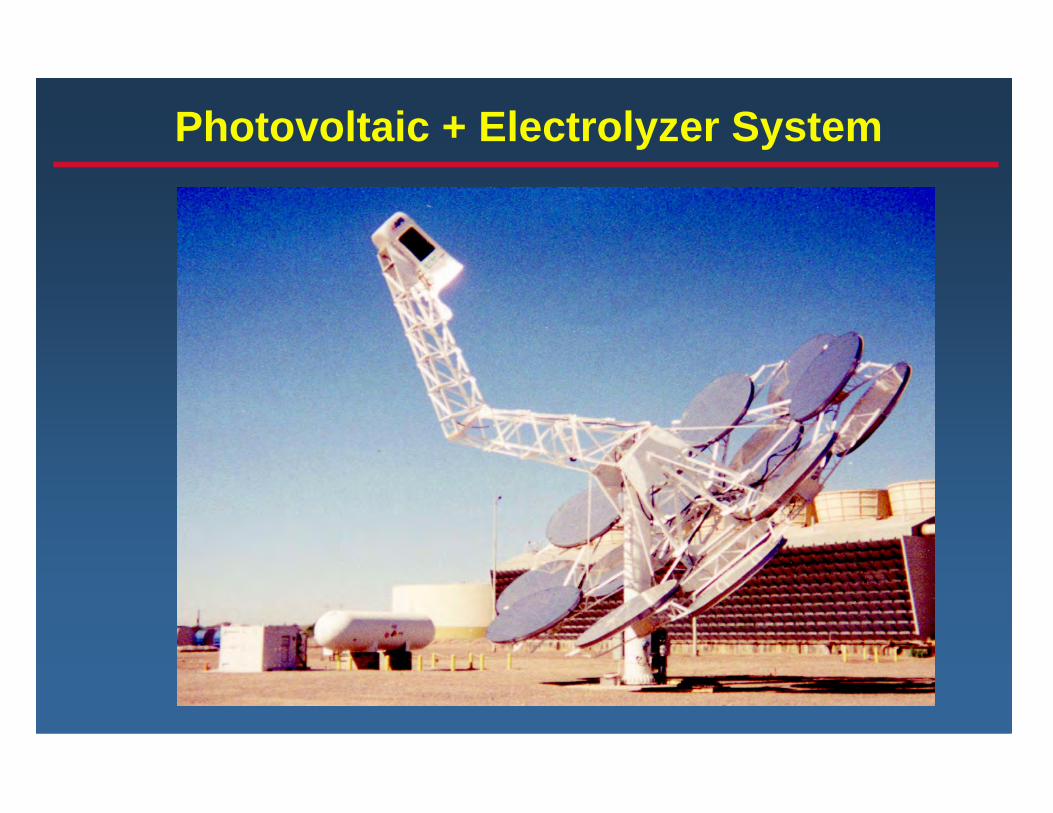
Photovoltaic + Electrolyzer System

O2AH2e-
cathodeanode
Fuel Cell vs Photoelectrolysis Cell
H2
anodecathode
O2
Fuel CellMEA
PhotoelectrolysisCell MEA
membrane
membrane
MOxMSxe-
H+
H+

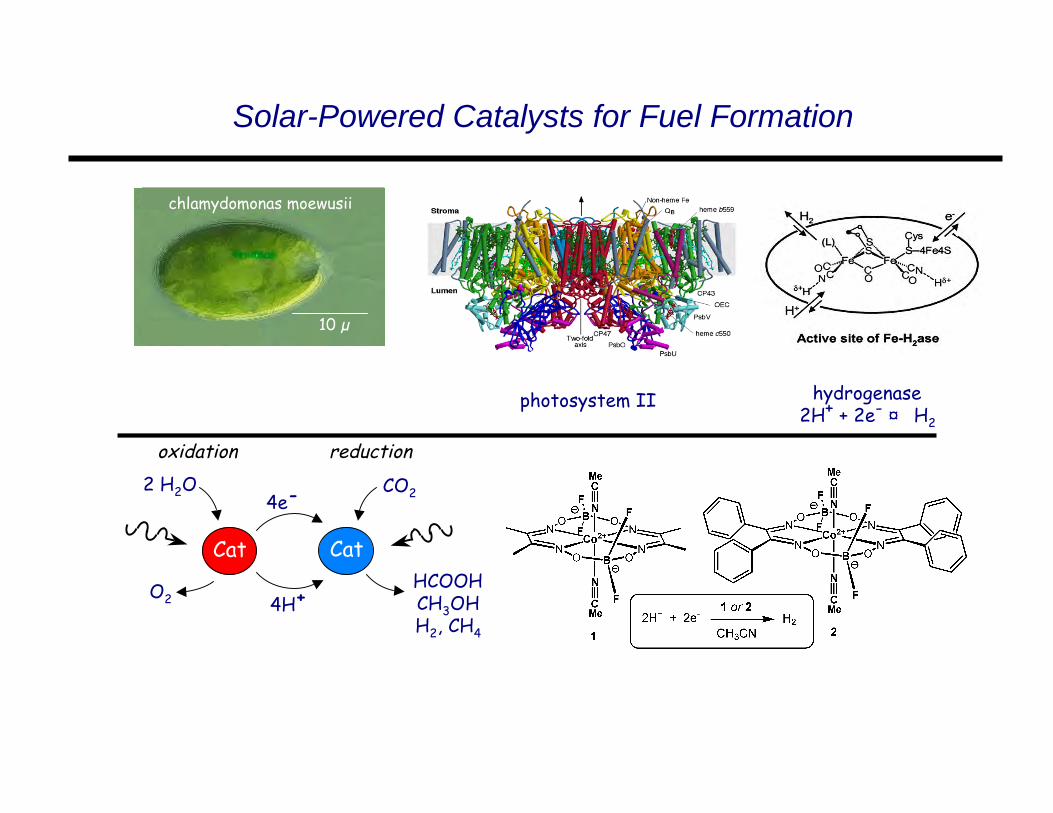
Solar-Powered Catalysts for Fuel Formation
hydrogenase2H+ + 2e- ¤ H2
10 µ
chlamydomonas moewusii2 H2O
O2
4e-
4H+
CO2
HCOOHCH3OHH2, CH4
Cat Cat
oxidation reduction
photosystem II2 H2O ¤ O2 + 4 e-+ 4H+
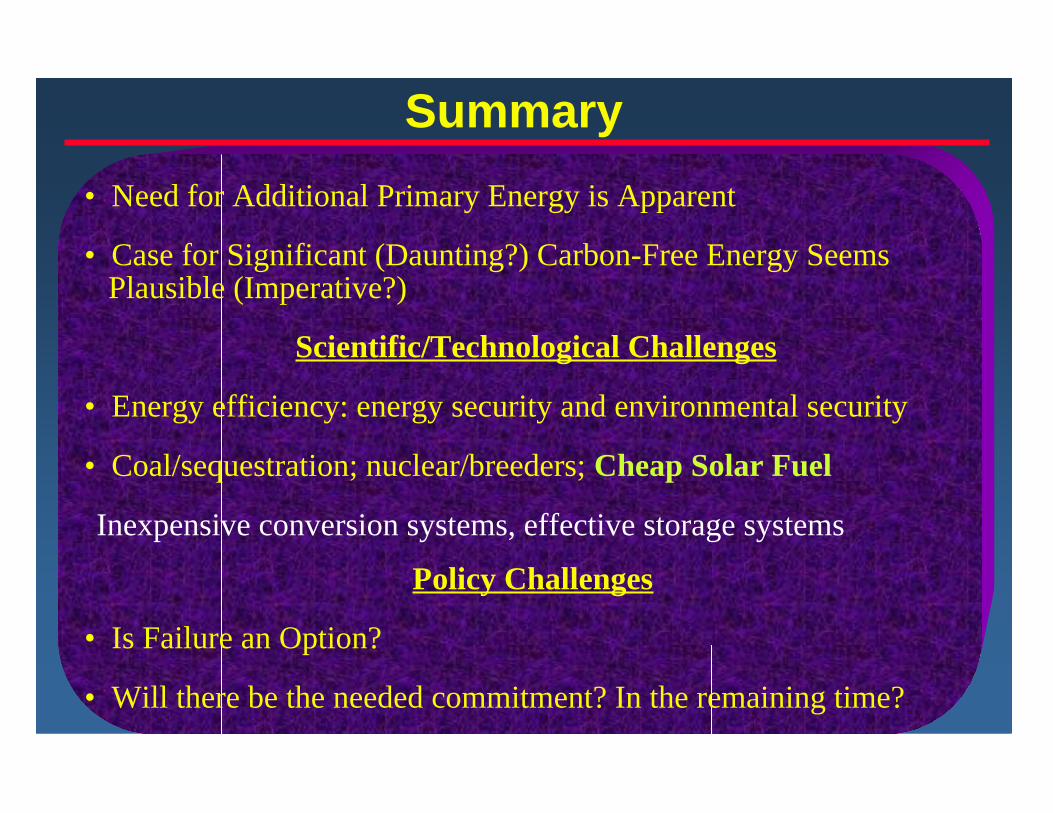
• Need for Additional Primary Energy is Apparent
• Case for Significant (Daunting?) Carbon-Free Energy Seems Plausible (Imperative?)
Scientific/Technological Challenges
• Energy efficiency: energy security and environmental security
• Coal/sequestration; nuclear/breeders; Cheap Solar Fuel
Inexpensive conversion systems, effective storage systems
Policy Challenges
• Is Failure an Option?
• Will there be the needed commitment? In the remaining time?
Summary
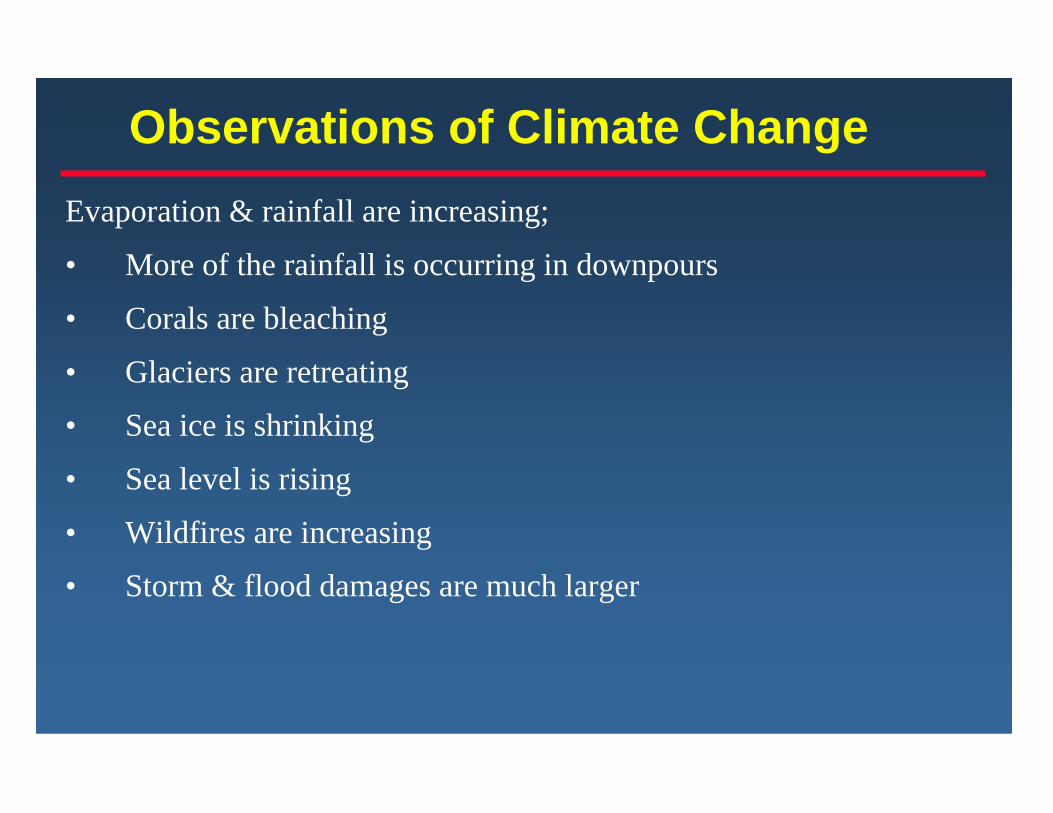
Observations of Climate ChangeEvaporation & rainfall are increasing;
• More of the rainfall is occurring in downpours
• Corals are bleaching
• Glaciers are retreating
• Sea ice is shrinking
• Sea level is rising
• Wildfires are increasing
• Storm & flood damages are much larger
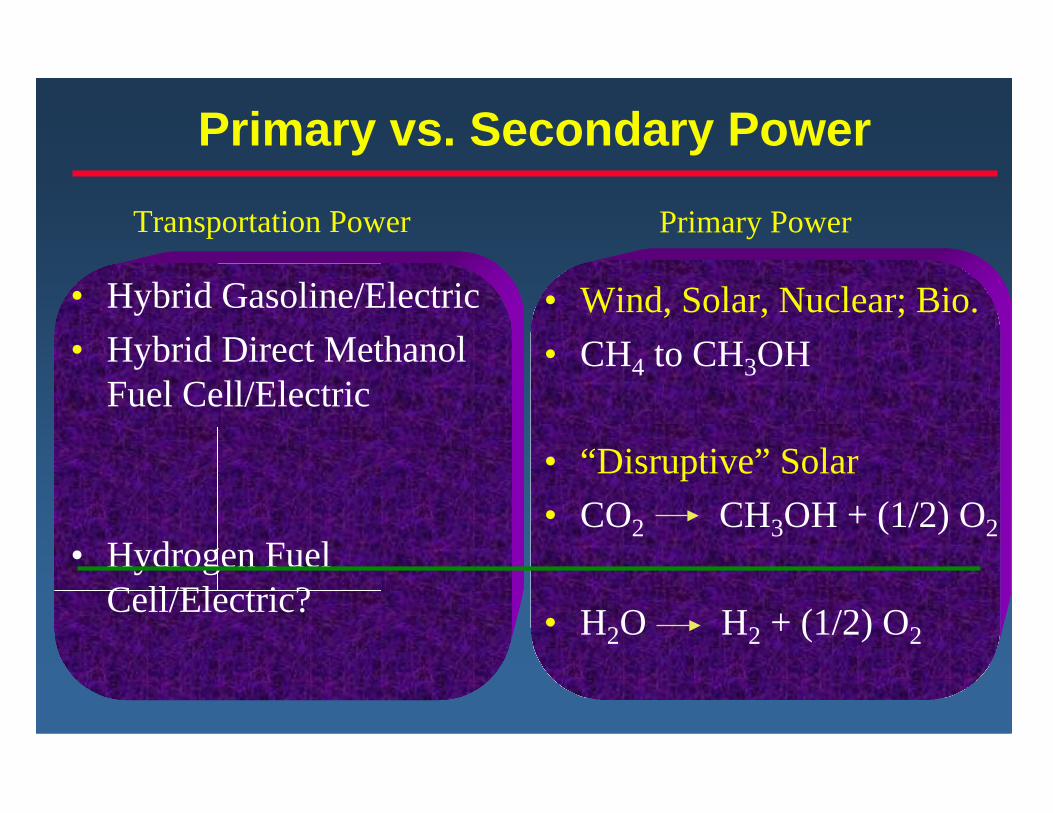
Primary vs. Secondary Power
• Hybrid Gasoline/Electric• Hybrid Direct Methanol
Fuel Cell/Electric
• Hydrogen FuelCell/Electric?
• Wind, Solar, Nuclear; Bio.• CH4 to CH3OH
• “Disruptive” Solar• CO2 CH3OH + (1/2) O2
• H2O H2 + (1/2) O2
Transportation Power Primary Power
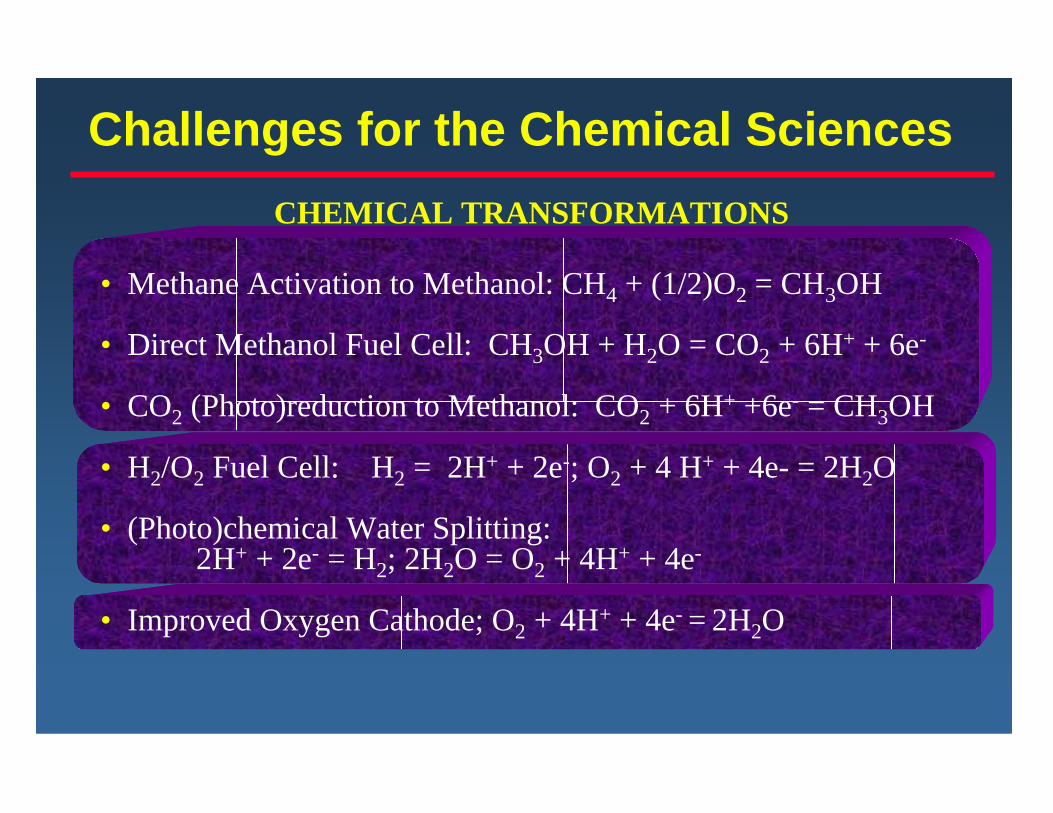
Challenges for the Chemical SciencesCHEMICAL TRANSFORMATIONS
• Methane Activation to Methanol: CH4 + (1/2)O2 = CH3OH
• Direct Methanol Fuel Cell: CH3OH + H2O = CO2 + 6H+ + 6e-
• CO2 (Photo)reduction to Methanol: CO2 + 6H+ +6e- = CH3OH
• H2/O2 Fuel Cell: H2 = 2H+ + 2e-; O2 + 4 H+ + 4e- = 2H2O
• (Photo)chemical Water Splitting:2H+ + 2e- = H2; 2H2O = O2 + 4H+ + 4e-
• Improved Oxygen Cathode; O2 + 4H+ + 4e- = 2H2O

Global Energy ConsumptionWorld energy consumption
0
1
2
3
4
5
6
7
8
9
10
1850 1875 1900 1925 1950 1975 2000
year
alloilcoalgasbiomassnuclearHydrogeothermysun; wind & other

Matching Supply and Demand
Oil (liquid)
Gas (gas)
Coal (solid)
Transportation
Home/Light Industry
ManufacturingConv to e-
Pump it around
Move to user
Currently end use well-matched to physical properties of resources

Matching Supply and Demand
Oil (liquid)
Gas (gas)
Coal (solid)
Transportation
Home/Light Industry
ManufacturingConv to e-
Pump it around
Move to user
If deplete oil (or national security issue for oil), then liquify gas,coal

Matching Supply and Demand
Oil (liquid)
Gas (gas)
Coal (solid)
Transportation
Home/Light Industry
ManufacturingConv to e-
Pump it around
Move to user
If carbon constraint to 550 ppm and sequestration works
-CO2

Matching Supply and Demand
Oil (liquid)
Gas (gas)
Coal (solid)
Transportation
Home/Light Industry
ManufacturingConv to e-
Pump it around
Move to user as H2
If carbon constraint to <550 ppm and sequestration works
-CO2
-CO2
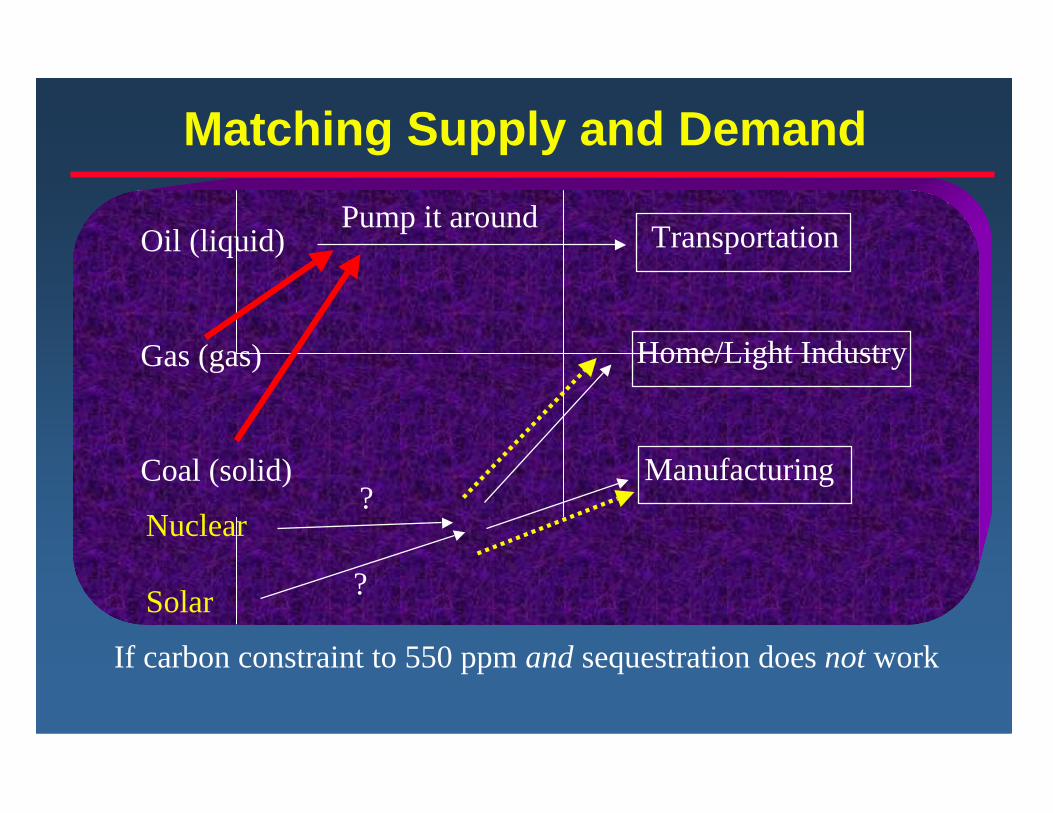
Matching Supply and Demand
Oil (liquid)
Gas (gas)
Coal (solid)
Transportation
Home/Light Industry
Manufacturing
Pump it around
If carbon constraint to 550 ppm and sequestration does not work
Nuclear
Solar ?
?
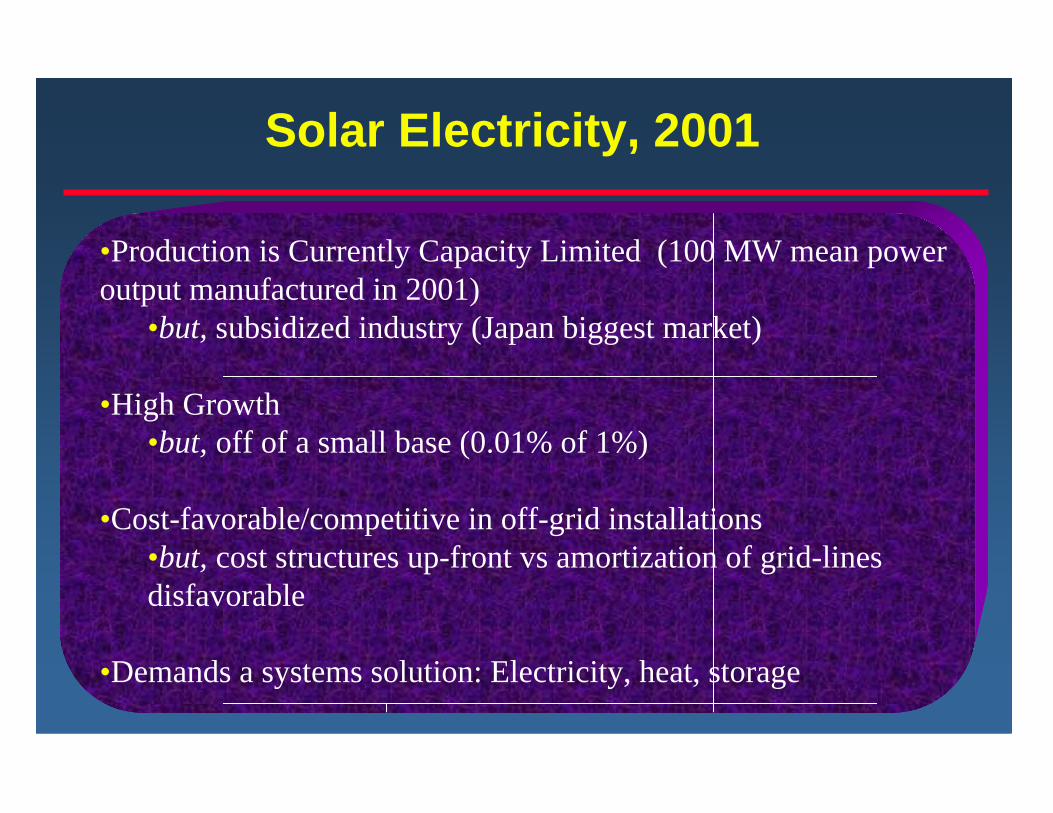
•Production is Currently Capacity Limited (100 MW mean poweroutput manufactured in 2001)
•but, subsidized industry (Japan biggest market)
•High Growth•but, off of a small base (0.01% of 1%)
•Cost-favorable/competitive in off-grid installations•but, cost structures up-front vs amortization of grid-linesdisfavorable
•Demands a systems solution: Electricity, heat, storage
Solar Electricity, 2001

1950 1960 1970 1980 1990 2000
5
10
15
20
25
Effi
cien
cy (%
)
Year
crystalline Siamorphous Sinano TiO2CIS/CIGSCdTe
Efficiency of Photovoltaic Devices
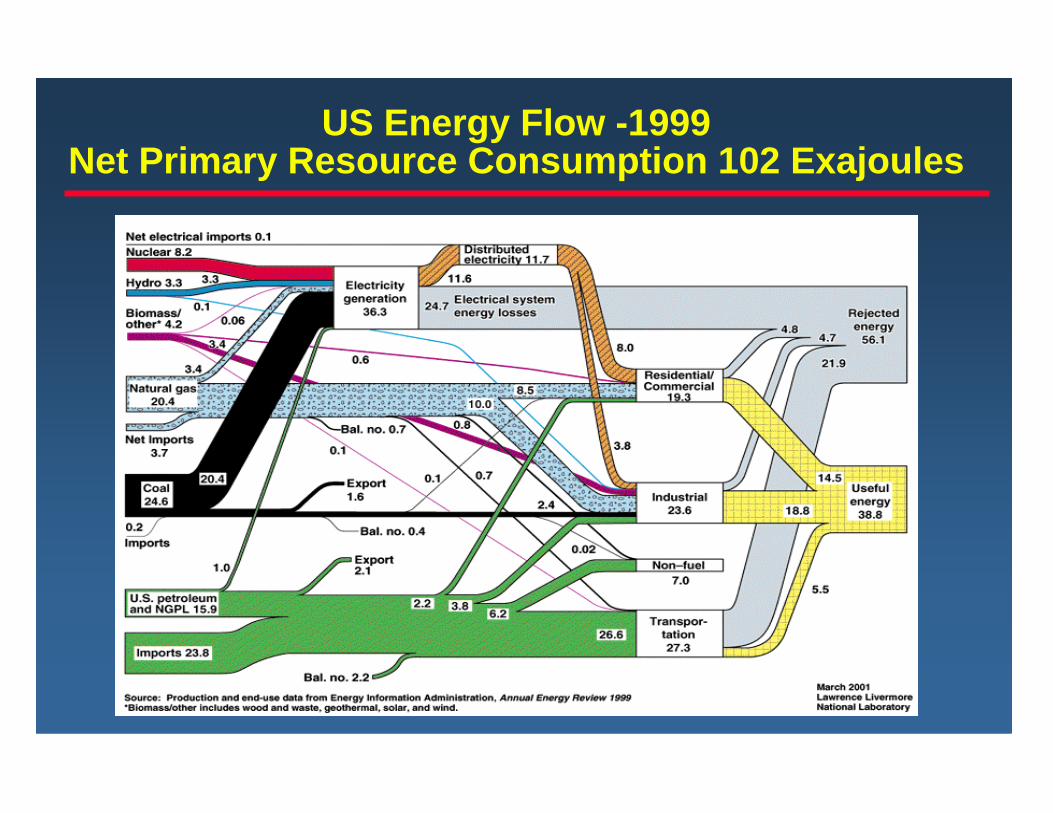
US Energy Flow -1999Net Primary Resource Consumption 102 Exajoules

Tropospheric Circulation Cross Section

Powering the Planet
Solar Æ Electric
Extreme efficiencyat moderate cost
Solar paint: grainboundary passivation
Solar Æ Chemical Chemical Æ Electric
Inorganic electrolytes:bare proton transport
O
H
S
100 nm
Catalysis:ultra highsurface area,nanoporousmaterials
Photoelectrolysis: integratedenergy conversion and fuel
generation
hn = 2.5 eV
H3O+
½H2 + H2O½O2 + H2O
OH-
__S*
__S+
S__TiO2
VB
CB
Pt
Bio-inspiredfuel generation
e-
GaAshn = 1.42eVInGaAsPhn = 1.05eVInGaAshn = 0.72eV
Si Substrate
GaInP2hn = 1.9eVGaAshn = 1.42eVInGaAsPhn = 1.05eVInGaAshn = 0.72eV
Si Substrate
GaInP2hn = 1.9eV
Synergies: Catalysis, materials discovery, materials processing
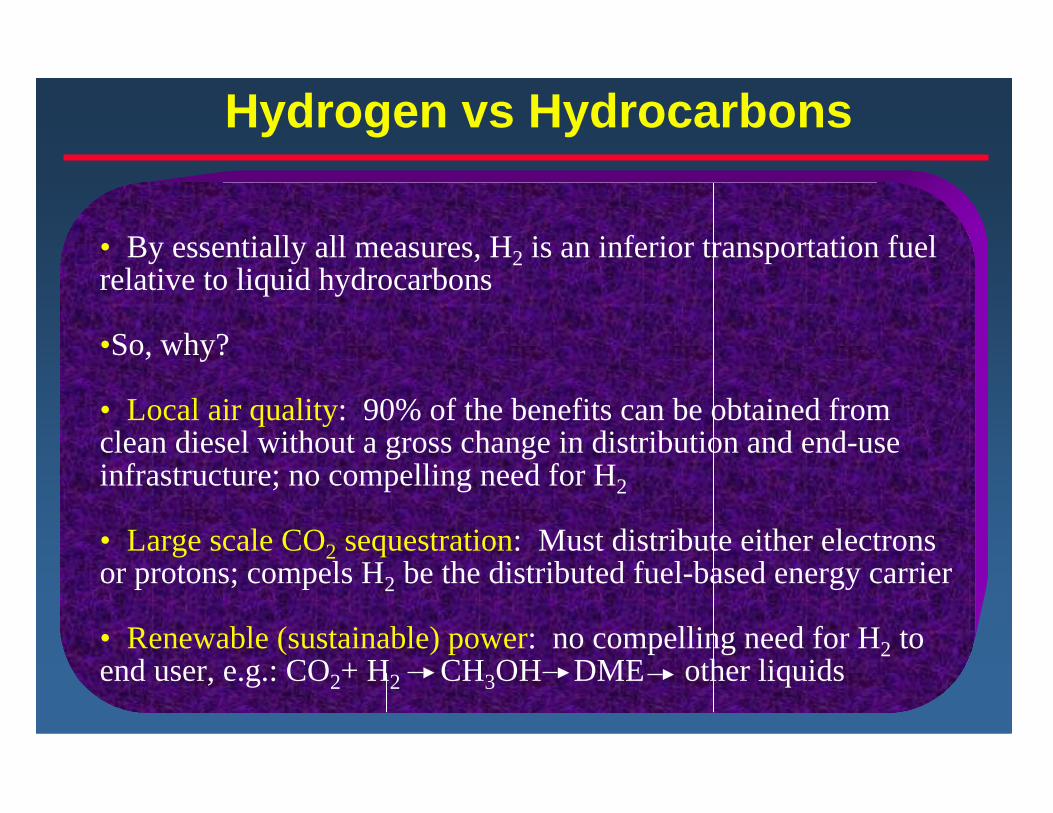
• By essentially all measures, H2 is an inferior transportation fuelrelative to liquid hydrocarbons
•So, why?
• Local air quality: 90% of the benefits can be obtained fromclean diesel without a gross change in distribution and end-useinfrastructure; no compelling need for H2
• Large scale CO2 sequestration: Must distribute either electronsor protons; compels H2 be the distributed fuel-based energy carrier
• Renewable (sustainable) power: no compelling need for H2 toend user, e.g.: CO2+ H2 CH3OH DME other liquids
Hydrogen vs Hydrocarbons

• 1.2x10⁵ TW of solar energy potential globally
• Generating 2x101 TW with 10% efficient solar farms requires 2x10²/1.2x105 = 0.16% of Globe = 8x10¹¹ m2 (i.e., 8.8 % of U.S.A)
• Generating 1.2x101 TW (1998 Global Primary Power) requires 1.2x10²/1.2x105= 0.10% of Globe = 5x10¹¹ m2 (i.e., 5.5% of U.S.A.)
Solar Land Area Requirements

Photoelectrochemical Cell
metal
e-
e-
O2
H2O
H2
H2O
e -
h+
Light is Converted to Electrical+Chemical Energy
LiquidSolid
SrTiO3
KTaO3
TiO2
SnO2
Fe2O3
• Land with Crop Production Potential, 1990: 2.45x10¹³ m2
• Cultivated Land, 1990: 0.897 x10¹³ m2
• Additional Land needed to support 9 billion people in 2050: 0.416x10¹³ m2
• Remaining land available for biomass energy: 1.28x10¹³ m2
• At 8.5-15 oven dry tonnes/hectare/year and 20 GJ higher heating value per dry tonne, energy potential is 7-12 TW• Perhaps 5-7 TW by 2050 through biomass (recall: $1.5-4/GJ)• Possible/likely that this is water resource limited• Challenges for chemists: cellulose to ethanol; ethanol fuel cells
Biomass Energy PotentialGlobal: Bottom Up

• Need for Additional Primary Energy is Apparent
• Case for Significant (Daunting?) Carbon-Free Energy Seems Plausible (Imperative?)
Scientific/Technological Challenges
• Coal/sequestration; nuclear/breeders; Cheap Solar Fuel
Inexpensive conversion systems, effective storage systems
Policy Challenges
• Energy Security, National Security, Environmental Security,Economic Security
• Is Failure an Option? Will there be the needed commitment?
Summary
Solar-Powered Catalysts for Fuel Formation
hydrogenase2H+ + 2e- ¤ H2
10 µ
chlamydomonas moewusii
2 H2O
O2
4e-
4H+
CO2
HCOOHCH3OHH2, CH4
Cat Cat
oxidation reduction
photosystem II