powering clinical and operational excellence
TRANSCRIPT

1
Powering Clinical and Operational ExcellenceSession #150, March 7, 2018
Joan Thompson, Michael Mann
Lead Systems Analyst, Cleveland Clinic
2
Agenda
• Background, Business Challenges and Objectives
• Analytics Strategy at Cleveland Clinic
• Analytics in Action
• Emergency Services
• Clinical Care Paths
• Patient Access
• Executive Operating Review
• Benefits and Next Steps


4
• Founded in 1921
• 7.1 million patient visits
• 165,000 admissions
• 207,000 surgical cases
• 550,000 ED visits
• 4,435 inpatient beds
• 150 outpatient locations
• 57,000 Caregivers
• 3,000+ physicians

5
Cleveland Clinic – Strategic Goals
Patients
First Caregivers Affordability Growth Impact
6
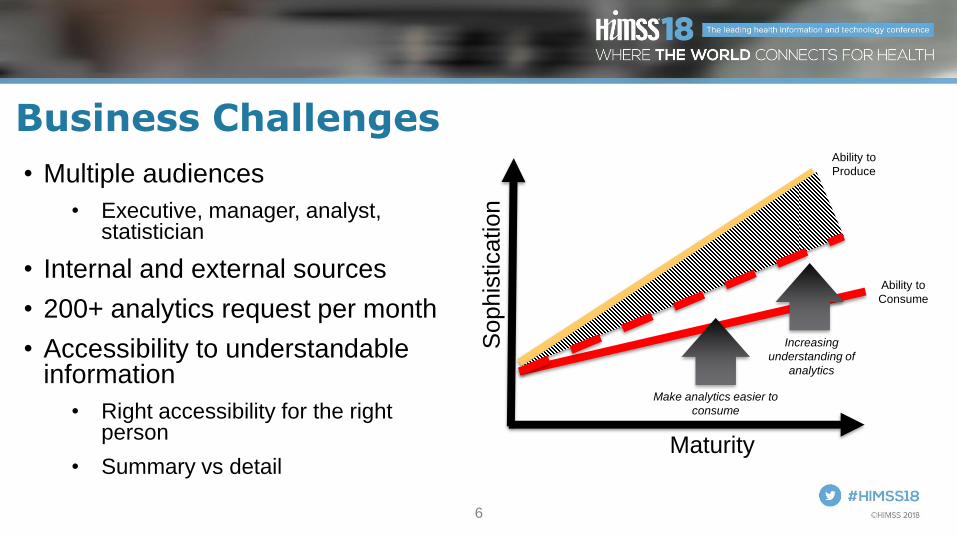
Business Challenges
Sophis
tication
Ability to
Produce
Ability to
Consume
Maturity
Make analytics easier to
consume
Increasing
understanding of
analytics
• Multiple audiences
• Executive, manager, analyst, statistician
• Internal and external sources
• 200+ analytics request per month
• Accessibility to understandable information
• Right accessibility for the right person
• Summary vs detail

7
Business Objectives
• Analytics quicker to market• Decrease visualization development
• Increase creators
• Executive usability complimented by deep drill
• Shift to self-service
• Empower overall data analytics
Enterprise Data
Sources
People
Any Data
Anywhere
Desktop Tools Analytics
Consumers


9
Commitment Flow Down
Enterprise Goals:
5 Pillars
Institute/Hospital
Department
Frontline
Performance Management
Monthly Executive Review/Strategic Initiative
Dashboards
Institute/Hospital Analytics
Center/Service Line
Frontline Management
Institutional Alignment
10
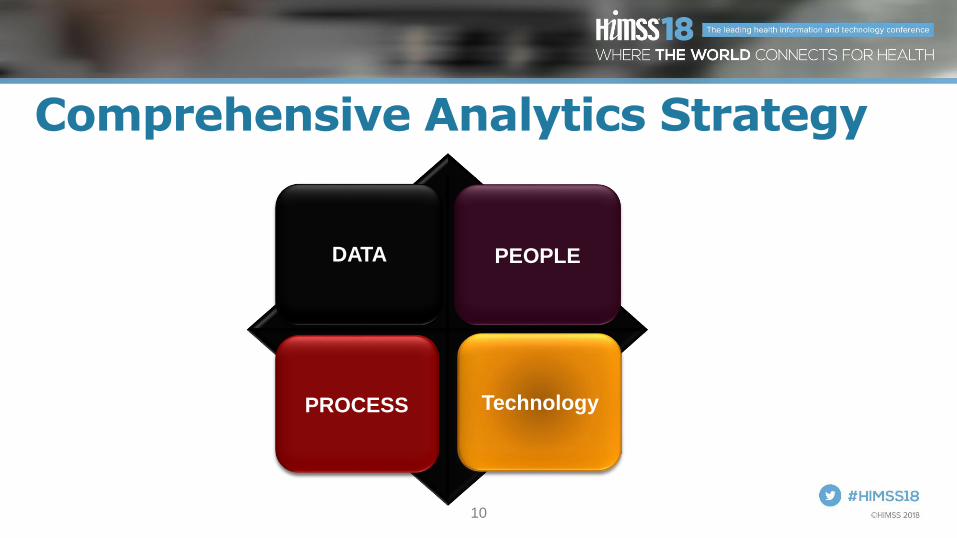
Comprehensive Analytics Strategy
Enhance the value
of CC data assets
Develop an analytically
capable organization
Promote standard
processes and a culture that
value analytics over instinct
Create a modern
analytics platform
DATA PEOPLE
PROCESS Technology

11
AnalyticsPlatform

13
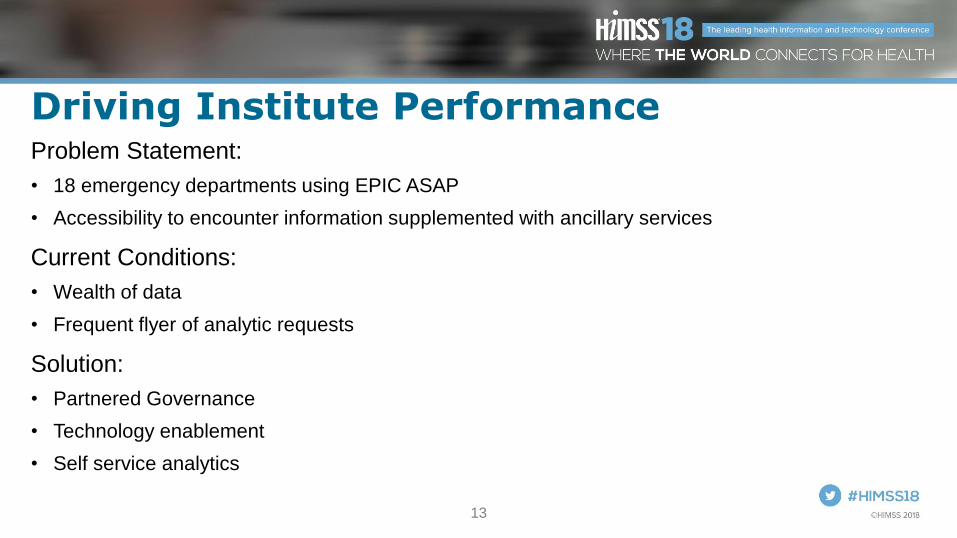
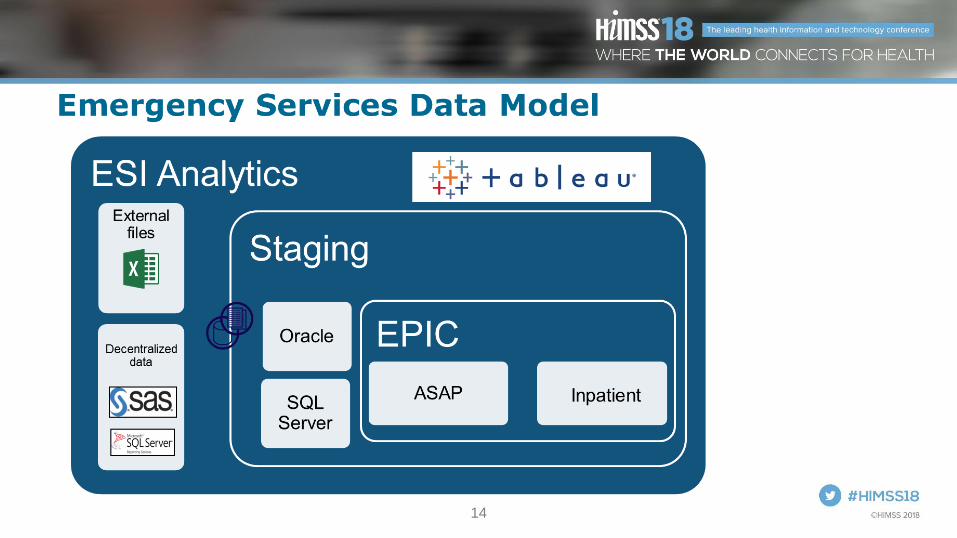
Driving Institute PerformanceProblem Statement:
• 18 emergency departments using EPIC ASAP
• Accessibility to encounter information supplemented with ancillary services
Current Conditions:
• Wealth of data
• Frequent flyer of analytic requests
Solution:
• Partnered Governance
• Technology enablement
• Self service analytics
14

15
Results
Dashboards that provide value:
• Data replaces anecdotal evidence
• Visualizations highlight opportunities and drive performance improvement
• Transparency and comparative analysis – promotes friendlycompetition
Use Cases:
• Imaging Turnaround Time - Reducing ED LOS
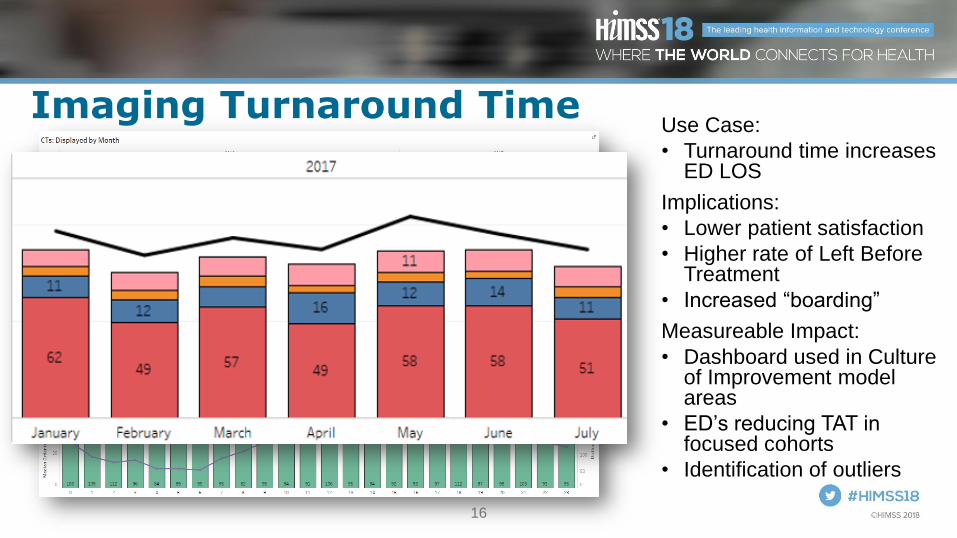
16
Imaging Turnaround TimeUse Case:
• Turnaround time increases ED LOS
Implications:
• Lower patient satisfaction
• Higher rate of Left Before Treatment
• Increased “boarding”
Measureable Impact:
• Dashboard used in Culture of Improvement model areas
• ED’s reducing TAT in focused cohorts
• Identification of outliers
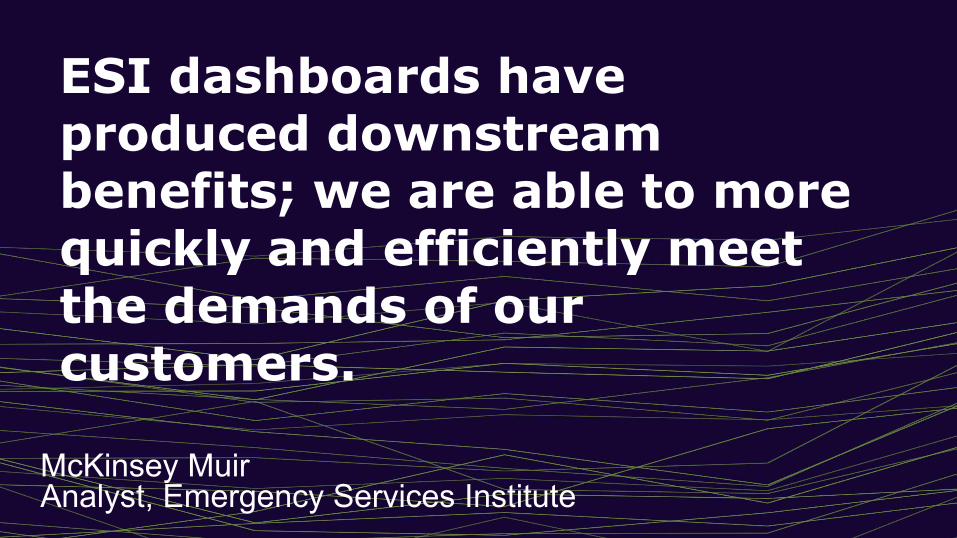
ESI dashboards have produced downstream benefits; we are able to more quickly and efficiently meet the demands of our customers.

19
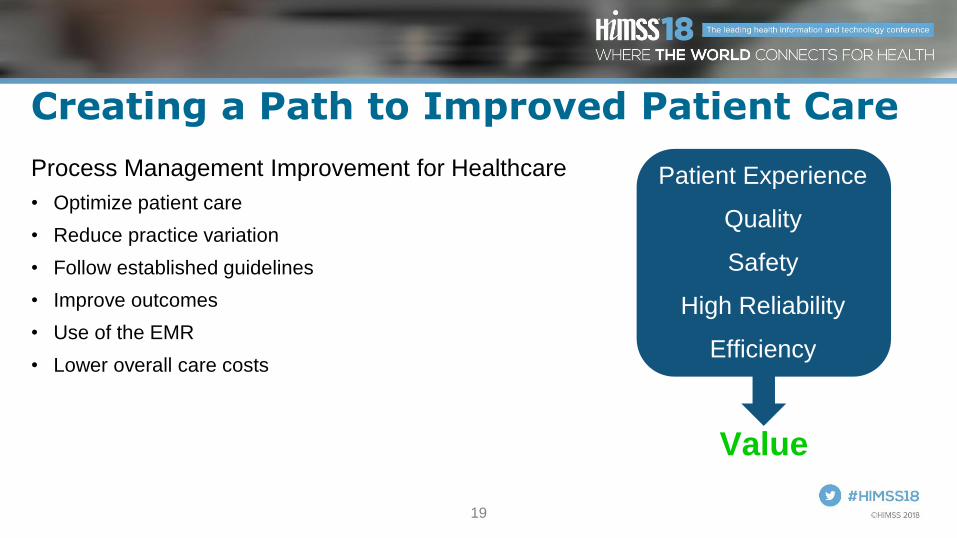
Creating a Path to Improved Patient Care
Process Management Improvement for Healthcare
• Optimize patient care
• Reduce practice variation
• Follow established guidelines
• Improve outcomes
• Use of the EMR
• Lower overall care costs
Patient Experience
Quality
Safety
High Reliability
Efficiency
Value

20
Care Path and EPIC
21
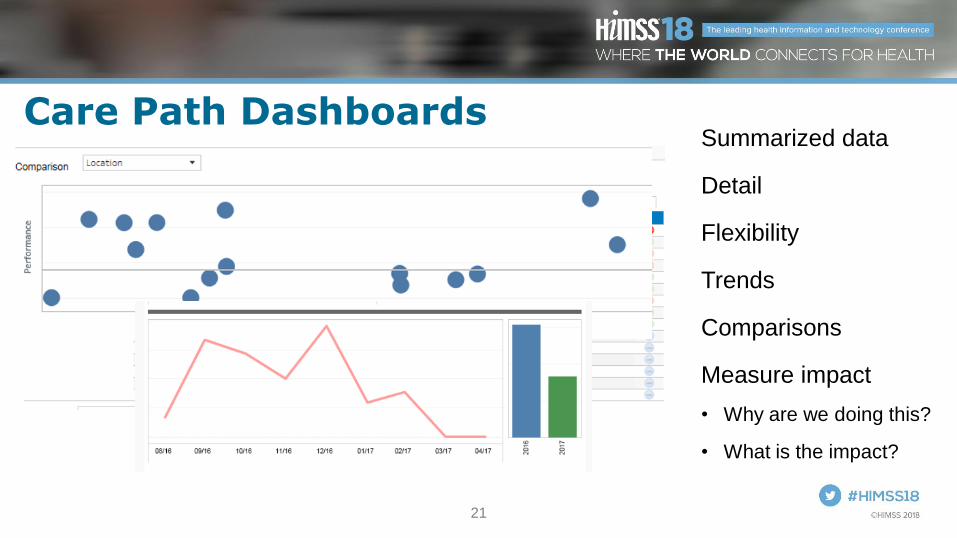
Care Path DashboardsSummarized data
Detail
Flexibility
Trends
Comparisons
Measure impact
• Why are we doing this?
• What is the impact?
22
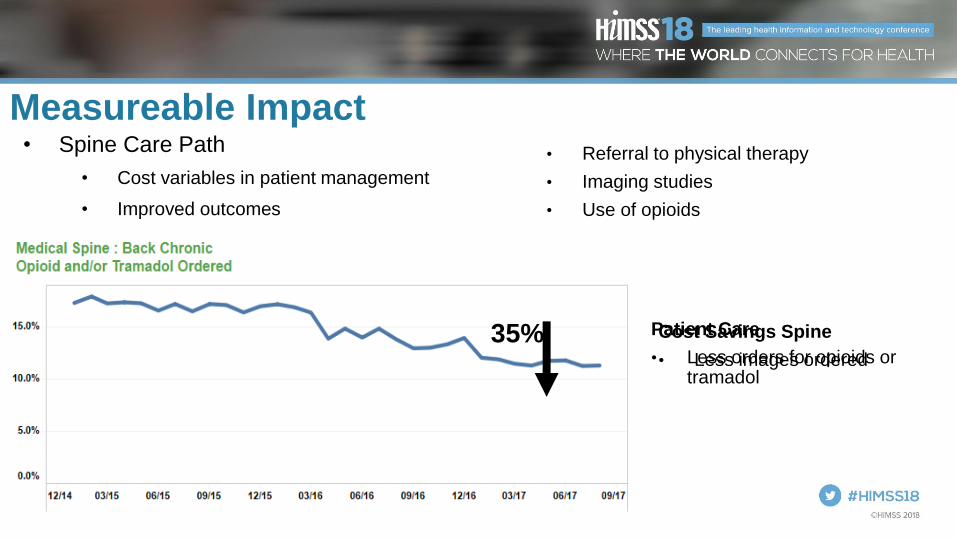
Measureable Impact
60%35%
• Referral to physical therapy
• Imaging studies
• Use of opioids
Cost Savings Spine
• Less images ordered
Patient Care
• Less orders for opioids or tramadol
• Spine Care Path
• Cost variables in patient management
• Improved outcomes

23
Measureable Impact• Total Hip/Total Knee Replacement
• Elevated hemoglobin
• Diabetes, heart disease, anemia
• Appropriate antibiotics
46%
• 30 day readmissions
• 90 day reoperations
• Discharge to home
Patient Care
• More patients discharged to home
Cost Savings
• Less nursing home days


25
Patient Access Factors#1. Making an appointment
• Provider schedule/template
Appointment type
• Provider availability
Meetings
Time off
• Patient availability
Time
Location
26
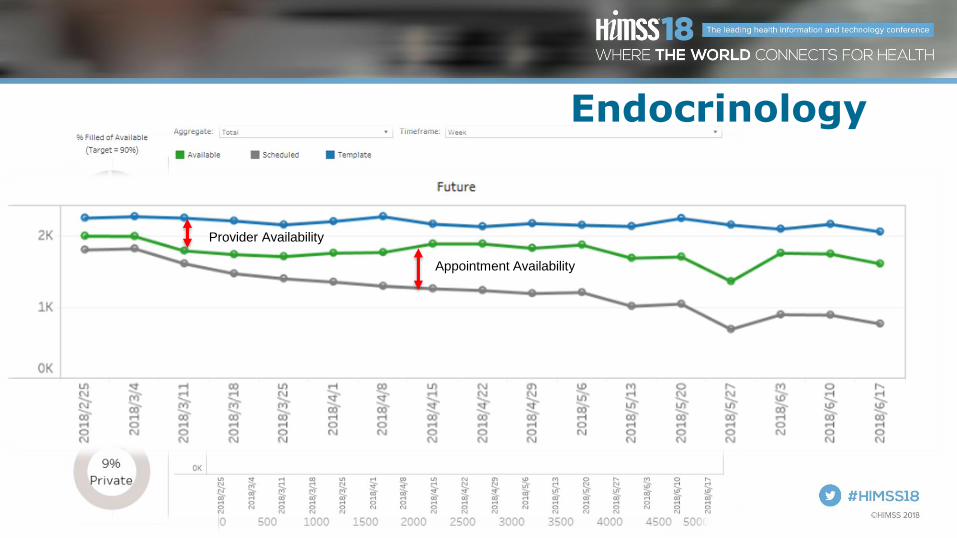
Endocrinology
Provider Availability
Appointment Availability

27
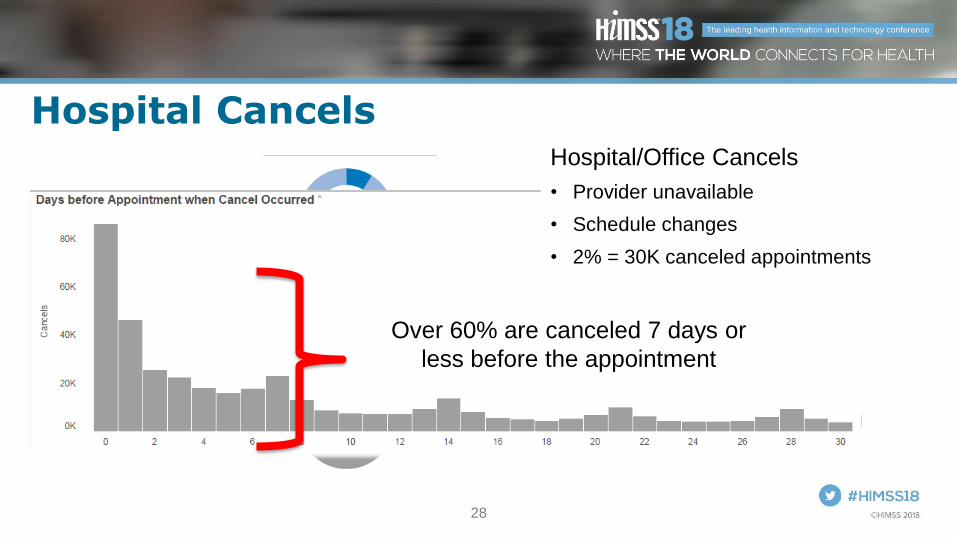
Hospital/Office Cancels
Patient Access
Same Day Cancels/No Shows
#2. Keeping appointment
28
Hospital Cancels
Over 60% are canceled 7 days or
less before the appointment
Hospital/Office Cancels
• Provider unavailable
• Schedule changes
• 2% = 30K canceled appointments

29
No Shows/Same Day CancelsOverall Impact
• Negatively Affected Patient Care
• Artificial Access Problems
• Office Productivity
• Lost Revenue

30
Summary Dashboard

31
Endocrinology
Same Day Cancel Rates
• Lower than Hospital Average
• No shows: 2% vs 6%
• Patient Cancels: 1% vs 3%
• Clinic Cancels: very low
32
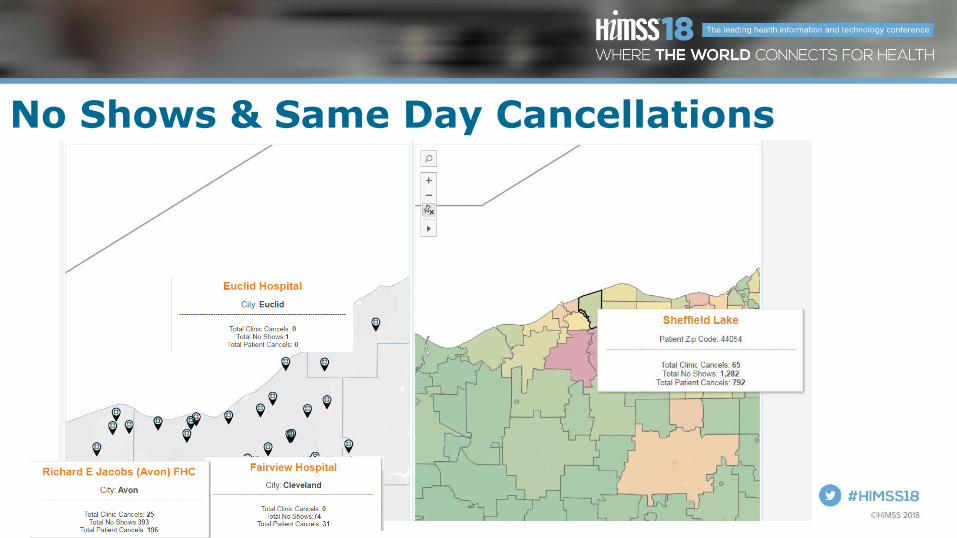
No Shows & Same Day Cancellations
33
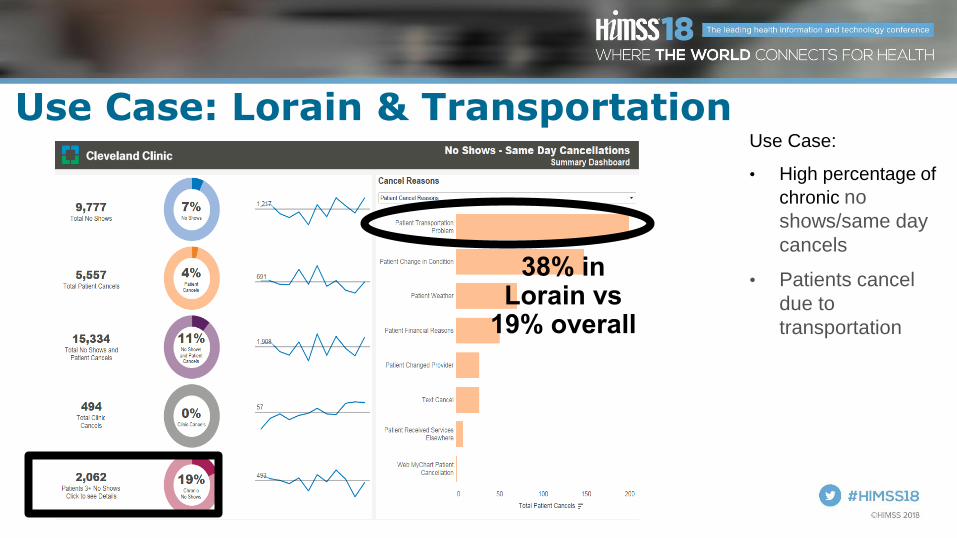
Use Case: Lorain & TransportationUse Case:
• High percentage of
chronic no
shows/same day
cancels
• Patients cancel
due to
transportation
34
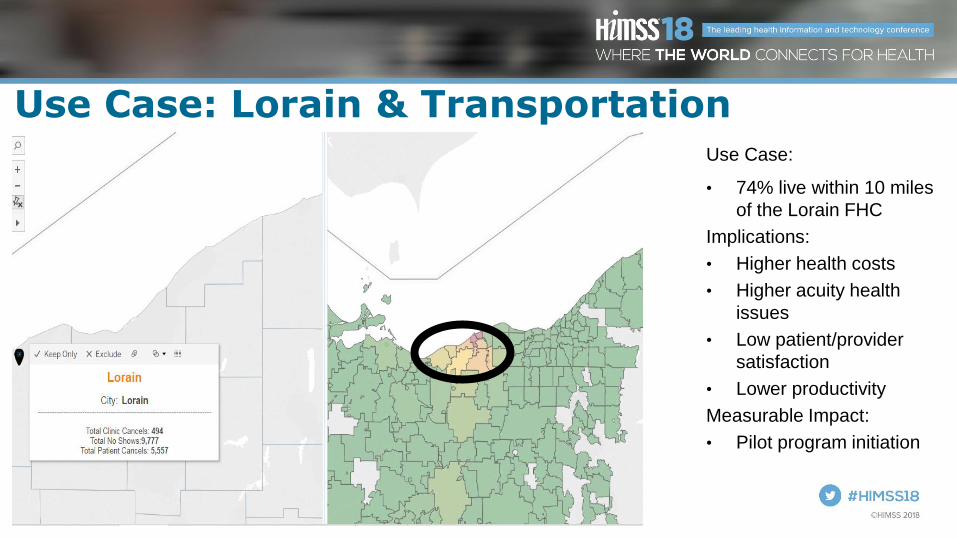
Use Case: Lorain & TransportationUse Case:
• 74% live within 10 miles
of the Lorain FHC
Implications:
• Higher health costs
• Higher acuity health
issues
• Low patient/provider
satisfaction
• Lower productivity
Measurable Impact:
• Pilot program initiation

35
Creative Solution
Same Day Cancel
• Patient calls to cancel appointment
• Patient Service Representative asks for reason
• If reason is transportation offer ride program


37
Commitment Flow Down
Enterprise Goals:
5 Pillars
Institute/Hospital
Department
Frontline
Performance Management
Monthly Executive Review/Strategic Initiative
Dashboards
Institute/Hospital Analytics
Center/Service Line
Frontline Management
Institutional Alignment
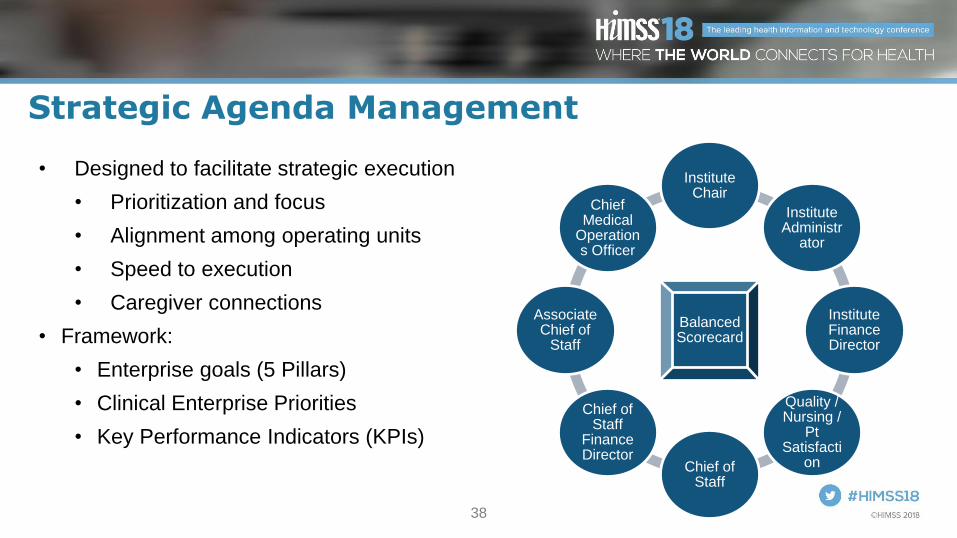
38
Strategic Agenda Management
• Designed to facilitate strategic execution
• Prioritization and focus
• Alignment among operating units
• Speed to execution
• Caregiver connections
• Framework:
• Enterprise goals (5 Pillars)
• Clinical Enterprise Priorities
• Key Performance Indicators (KPIs)
Balanced Scorecard
Institute Chair
Institute Administr
ator
Institute Finance Director
Quality / Nursing /
Pt Satisfacti
onChief of Staff
Chief of Staff
Finance Director
Associate Chief of
Staff
Chief Medical
Operations Officer
39
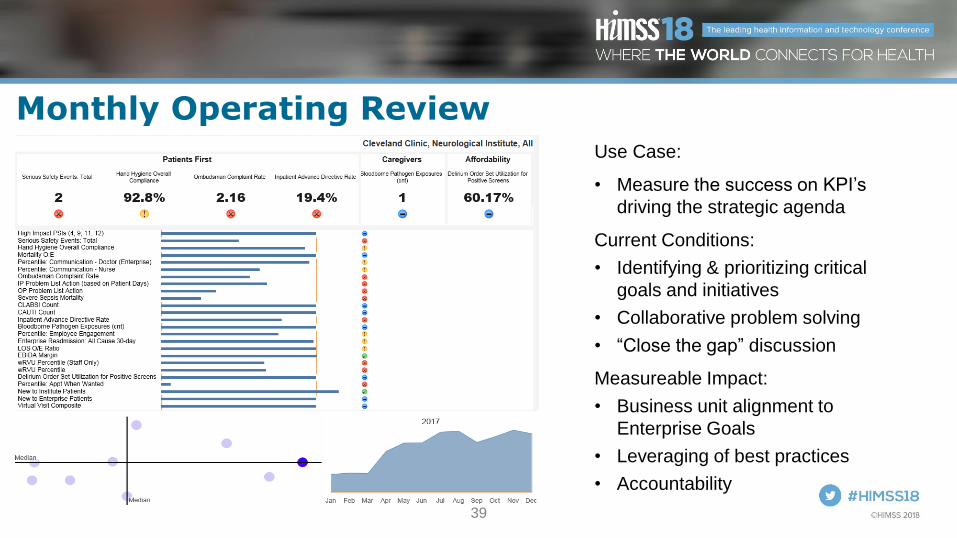
Monthly Operating ReviewUse Case:
• Measure the success on KPI’s
driving the strategic agenda
Current Conditions:
• Identifying & prioritizing critical
goals and initiatives
• Collaborative problem solving
• “Close the gap” discussion
Measureable Impact:
• Business unit alignment to
Enterprise Goals
• Leveraging of best practices
• Accountability
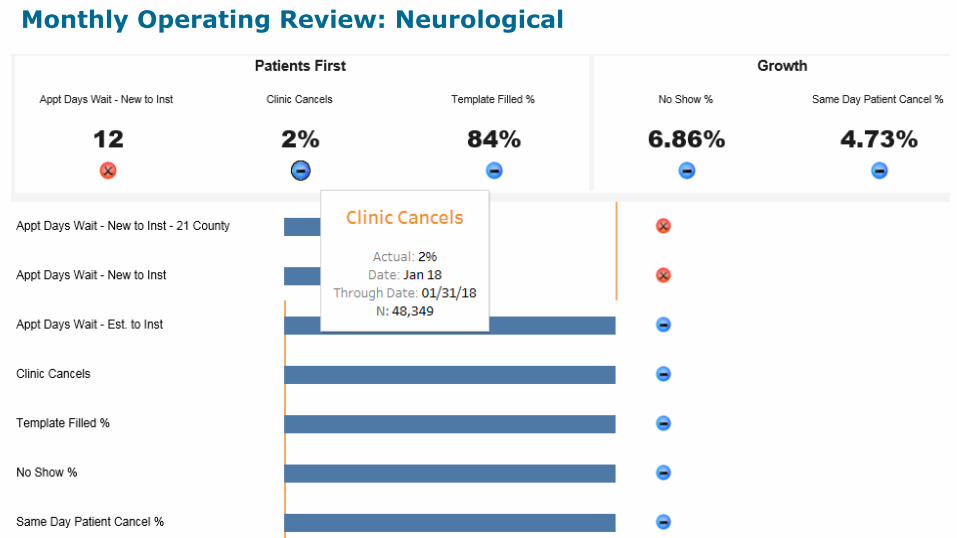
Monthly Operating Review: Neurological

42
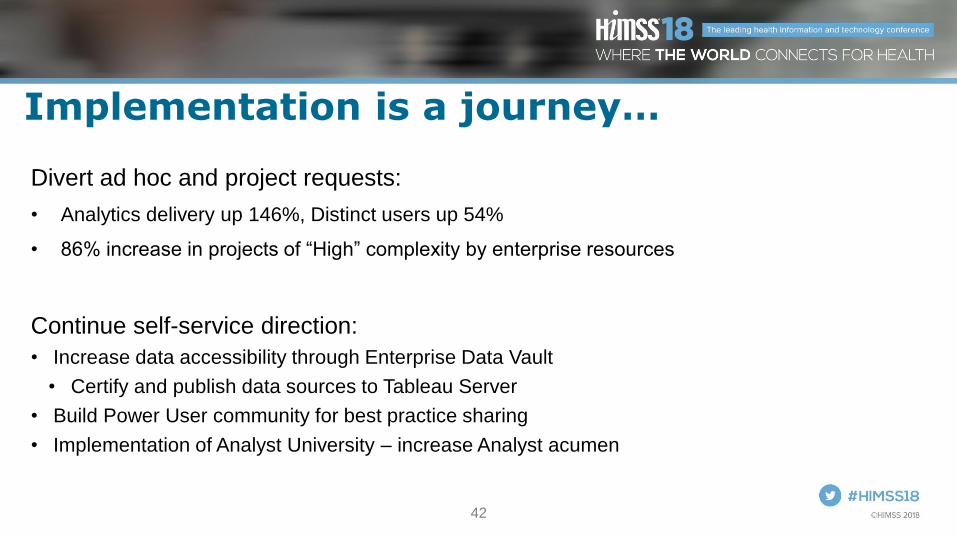
Implementation is a journey…
Divert ad hoc and project requests:
• Analytics delivery up 146%, Distinct users up 54%
• 86% increase in projects of “High” complexity by enterprise resources
Continue self-service direction:
• Increase data accessibility through Enterprise Data Vault
• Certify and publish data sources to Tableau Server
• Build Power User community for best practice sharing
• Implementation of Analyst University – increase Analyst acumen

43
Questions
Michael Mann [email protected]
Joan Thompson [email protected]
Please complete online session evaluation