powerful subordinates: internal governance and stock
TRANSCRIPT

Powerful Subordinates: Internal Governance and Stock Market Liquidity
Pawan Jain
Department of Finance and Law
Central Michigan University
Email: [email protected]
Christine Jiang
Department of Finance, Insurance and Real Estate
The University of Memphis
Email: [email protected]
Mohamed Mekhaimer
Department of Finance, Insurance and Real Estate
The University of Memphis
Email: [email protected]
This Draft: September 2013

1
Powerful Subordinates: Internal Governance and Stock Market Liquidity
Abstract
Acharya, Myers, and Rajan (2011) develop a model of internal governance where subordinate
managers may effectively monitor the CEO to maintain the future of the firm. Using a measure
of internal governance based on the difference in horizons between a CEO and his subordinates,
we show that firms with better internal governance are more liquid. We also show that internal
governance is more effective in enhancing liquidity for firms with CEOs close to retirement,
with experienced subordinate managers, and firms that require higher firm-specific skills. Our
results are robust to inclusion of conventional governance measures, alternative model
specifications, and different measures of internal monitoring and liquidity.
Keywords: Internal monitoring, Corporate governance, Subordinate managers, Liquidity.
JEL Classification: G30, G34, G39
For helpful comments, we thank Marc Lipson, Alex Butler, Michael Shill, Mao Ye, Robert Van Ness, Syed
Kamal, James Malm, Hyacinthe Y. Somé, as well as, participants of the finance seminars and conferences at the
University of Memphis, 2013 European Financial Management Association meeting in Luxembourg, 2013 Midwest
Finance Association meeting in Chicago, 2013 Eastern Finance Association meeting in Saint Pete Beach, and 2012
Southern Finance Association meeting in Charleston. We thank the Center of International Business Education and
Research, Egyptian Cultural and Educational Bureau, and the Department of Finance, Insurance, and Real Estate at
the University of Memphis for financial support. Any errors are authors‟ responsibility.
2
Powerful Subordinates: Internal Governance and Stock Market Liquidity
1. Introduction
Despite the fact that corporate governance has received much attention in finance
literature, it seems that we still have a long way to go to really understand the different
mechanisms that can protect shareholders‟ rights. Much of empirical literature examines the
impact of corporate governance (e.g., board structure, managerial compensation, charter
provisions, legal/regulatory environments, and markets for corporate control) on firm
performance, firm valuation, cost of capital, insider trading and stock market liquidity.1
Particularly, with respect to the relationship between governance and liquidity, it has been shown
that, improved financial and operational transparency, which mitigates management‟s ability to
distort information disclosure, is a significant channel through which corporate governance
affects liquidity (Faure-Grimaud and Gromb 2004; Leuz, Nanda and Wysocki 2003; Daske, Hail,
Leuz and Verdi 2013; Chung, Elder and Kim 2010).2 However, previous literature mostly
ignores the role of stakeholders inside the firm as a governance mechanism. In this paper, we
highlight the importance of internal governance by analyzing the effect of subordinate managers‟
effective monitoring of the CEO on stock market liquidity.
Acharya, Myers and Rajan (2011) define a corporation as a composition of diverse agents
with different horizons, interests, and opportunities for misappropriation and growth. In such a
structure, a younger subordinate manager is more likely to have the opportunity to succeed the
CEO who is about to retire. This divergence of horizon between CEO and the subordinate
1 See Shleifer and Vishny (1997), La Porta et al. (2000), Mitton (2002), Gompers, Ishii, and Metrick (2003),
Bebchuk and Cohen (2005), Bebchuk, Cohen, and Ferrell (2005), Chi (2005), Ashbaugh, Collins, and LaFond
(2006), Masulis, Wang, and Xie (2006), and Chung, Elder, and Kim (2010). 2 Chung, Elder and Kim (2010) suggest that improving financial and operational transparency decreases information
asymmetries between insiders and outside investors as well as among outside investors.

3
managers creates a bottom-up incentive mechanism, which is internal governance in the spirit of
Acharya, Myers and Rajan (2011).3 The power of younger subordinate managers comes from
their ability to withdraw their contributions to the firm. Subordinate managers engage in firm-
specific learning effort during their career path that helps them become more knowledgeable and
productive to the firm. Such specific knowledge also provides subordinate managers with the
ability of producing and disclosing reliable and accurate information, which increases the
financial and operational transparency of the firm in the financial markets. This will in turn result
in higher liquidity for the firm.
The relationship between corporate governance and stock market liquidity is not original
to our paper. However, prior literature yields contradicting explanations. One stream of literature
suggests that liquidity and governance are negatively related because poor governance increases
the incentive of large shareholders to trade on inside information, resulting in higher information
asymmetry or lower liquidity (Maug1998, 2002).4 Another stream of literature argues for a
positive correlation between liquidity and governance. Shareholders can vote with their feet
through their trading behavior, even if they face barriers to voice (Admati and Pfleiderer, 2009;
Edmans, 2009; Edmans and Manso 2010).5 Using trading as a governance mechanism is
desirable because it improves the value of the firm and leads to a more liquid trading (Edmans,
2009).
3 A CEO is close to retirement has a short horizon and wants to extract the maximum possible rents. However,
subordinate managers have a longer horizon and if they see that the CEO will leave nothing behind then they can
withdraw their contributions to the firm. Acharya, Myers and Rajan (2011) find that about 80% of new CEOs are
internally promoted. 4 Coffee (1991) and Bhide (1993) suggest that poor monitoring leads to large shareholders exiting the market,
leading to lower liquidity. 5 The survey evidence of McCahery, Sauntner, and Starks (2010) finds that institutions use exit more frequently than
any other governance mechanism, and Parrino, Sias and Starks (2003) document direct evidence of this channel.
Examples of voice barriers are; diversification requirements, lack of expertise, conflicts of interests, small ownership
and rarely succeed if they do (Armour et al., 2009; Yermack 2010; Del Guercio and Hawkins 1999).

4
We contribute to this debate by introducing internal governance mechanism which has
not been studied in previous literature on the relationship between governance and liquidity.6
This line of inquiry is highly connected to Chung, Elder and Kim (2010) which suggests that
corporate governance through board, audit committee, charter, state laws, and managerial
compensations affect stock market liquidity by improving financial and operational
transparency.7 We go a step further to examine whether the aspiring future CEOs, a group of the
highest-ranking executives in an organization who are responsible for the daily operation of the
company, can exert effective monitoring of a self-interested CEO. Internal governance is not the
only form of corporate governance that may affect firm value and liquidity. However, if internal
governance is highly effective, there may be less need to rely on other forms of governance such
as board, analysts, and institutional ownership.
Measuring the level of internal governance empirically can be quite challenging. The
essence of internal governance in Acharya, Myers and Rajan (2011) is linked to the difference in
appropriation horizons between the CEO and his subordinates. In this paper, we use the mean
relative age difference between the top subordinate managers‟ and the CEO as a proxy of the
divergence in their horizons within the firm. Adjustments to the raw age difference are made to
control for other factors that may affect the age difference. Using various liquidity measures,
such as Gibbs estimate, percentage spread, and turnover, we find a consistent, positive relation
between internal governance and stock market liquidity. Our results support the notion that
6 Aggarwal et al., (2013) find a hump-shaped relation between internal governance and corporate investment as well
as firm performance. In addition, Landier et al, (2012) finds that firms with a smaller fraction of independent
executives exhibit a lower level of profitability and lower shareholder returns following large acquisitions. 7 Chung, Elder and Kim (2010) suggest that Improving financial and operational transparency decreases information
asymmetries between insiders and outside investors as well as among outside investors. Poor transparency insulates
and impedes the ability of traders to discern the extent to which management can expropriate firm value through
shirking, empire building, risk aversion, and prerequisites (Gompers, Ishii and Metrick 2003; Bebchuk, Cohen and
Ferrell 2009). However, providing reliable and accurate information facilitates resource allocation decision and
enforcement of contracts for investors.

5
subordinate managers, with longer horizon than the firm‟s CEO, are effective in monitoring the
CEO and help increase operational and informational transparency of the firm. Their efforts lead
to an increase in the liquidity, making the firm more attractive to investors.
We further document that internal governance is effective in improving the stock market
liquidity for the firms with CEOs approaching their retirement. Our results are consistent with
Acharya, Myers, and Rajan‟s (2011) conjecture that young subordinate managers are more
effective in monitoring CEOs close to retirement. In addition, we show that internal governance
is more effective in human capital intensive industries that require young subordinate managers
to engage in industry and firm specific learning effort prior to their appointment for an executive
position. Such firms and industry specific knowledge increases the importance and power of the
subordinate manager and increases their influence on the CEO behavior. Finally, we find that
experienced managers are more effective in exerting internal governance.
Our results are robust across different measures of internal governance, subsamples,
measures of liquidity, and estimation methods. To avoid spurious correlations we control for
other governance mechanisms (analysts following, institutional ownership, and the governance
index compiled by Institutional Shareholder Service). Consistent with Chung, Elder and Kim
(2010), we find that the level of institutional holding and governance index are significantly
positively related to liquidity while the number of analysts following is negatively related to
liquidity. Monitoring is costly and hence, any organizational structure that promotes internal
governance would be very beneficial for the investors and will improve the efficiency of the
capital markets.

6
2. Hypothesis development
Acharya, Myers and Rajan (2011) define a public corporation as a structure of people
working together to maximize shareholders‟ residual claim. This structure separates firm
management from firm control, and investment decision from risk bearing. The CEO makes the
strategic decisions including the investment decisions, while the subordinate managers‟ are
responsible for managing the daily operations of the firm.8 On the other side, the board of
directors is responsible for decision control while shareholders bear the risk. Hence, this public
corporation management and ownership structure leads to the agency problem because of the
conflict of interests between a firm‟s management and its stakeholders.
Effective corporate governance is one possible solution to this agency problem (Jensen
and Meckling, 1976). However, defining “effective corporate governance” is a big challenge
faced by practitioners and researchers. Corporate governance is not a predefined set of
mechanisms or procedures that each firm has to follow, rather a set of puzzle pieces that all fit
together to complete the governance picture. Corporate governance is comprised of different
mechanisms to assure that the agents act for the benefits of stockholders and other stakeholders
(Shlelifer and Vishny, 1997, La porta et al 2000, Gompers et al., 2003, and Cremers and Nair,
2005). In this paper we test the efficacy of internal governance mechanism, in addition to
existing governance measures, in explaining the stock market liquidity.
2.1. Internal governance
Traditionally, the term “internal governance” has been used to describe different
governance mechanisms such as board independence, audit committee independence,
8 Graham, Harvey, and Puri (2013) suggest that managers, other than the CEO, perform important functions,
especially in large and complex firms.

7
shareholders‟ activism and institutional holding.9 However, Acharya, Myers, and Rajan (2011)
depart from these conventional views by introducing internal governance based on partnership
between the current CEO and his subordinates, who are the potential future CEO(s). The main
distinction in their model is that they see the firm as a composition of diverse agents with
different horizons, interests, and opportunities for misappropriation and growth.
A self-interested CEO may want to extract rent at the expense of the shareholders and
other stakeholders. While the CEO is the top ranking executive within a firm‟s managerial
hierarchy, he is not the single productive asset in the firm. The CEO needs the cooperation of his
subordinates, in order to operate the firm. An older CEO has a shorter employment horizon than
his younger subordinates in the firm. Younger subordinate managers have long-term interests in
the firm‟s prospects, especially if they see a sufficient scope for career development within the
firm (Prendergast, 1999). This divergence of horizons is the crux of internal governance. If
subordinate managers see that the CEO will leave nothing behind, they are less motivated to
exert effort and cash flow will fall significantly. To forestall such an outcome, incumbent CEO
commits to invest now to preserve value for the future of his young subordinates in the firm.
The constraints that parties inside the firm impose on each other ensure that the firm can
function and survive, even if outside governance is weak. Subordinate managers‟ power to
withdraw their contributions to the firm forces the CEO to act in a more public-spirited and far-
sighted manner. The importance of subordinate managers is not limited to contribution
withdrawal, but also comes from their ability to produce and disclose reliable and accurate
information about the prospects of the firm. This will increase the financial and operational
transparency in the financial market, decrease the information asymmetry and hence enhance
stock market liquidity. We test this argument by analyzing the following hypothesis:
9 See Johnstone, Li, and Rupley (2011), Cremers and Nair (2005), and Chung, Elder and Kim (2010).

8
H1: There is a positive relationship between internal governance and stock market liquidity.
2.2. Other governance mechanisms
We extend our analysis to include other external and external/internal governance
mechanisms that are established in the literature and are known to affect stock market liquidity.10
2.2.1. External governance
There are two widely accepted external corporate governance measures, institutional
ownership and number of analysts following a firm. Chung and Zhang (2011) find that
institutional investors prefer stocks of better-governed firms for fiduciary responsibilities,
monitoring costs and liquidity reasons. A block holder participates in value increasing activities
in proportion to his equity stake in a firm, a larger stake increases his benefit from higher firm
value (Faure-Grimaud and Gromb, 2004) and alleviate the free-rider problem pervasive in firms
with passive dispersed investors (Shleifer and Vishny, 1997). The recent literature suggest that
the role of block holders not only add value through direct intervention, but also can improve the
firm value through trading (McCahery, Sautner, and Starks, 2010, Admati and Pfleiderer, 2009,
Edmans 2009, Edmans and Manso 2010). Edmans (2009) and Brockman and Yan (2009) argue
that block holders increase the trading liquidity because they have more incentive to gather
information, trade on private information, compete in trading profits, and hence reflect the true
fundamental value of the firm and improve the stock market liquidity.
Analyst coverage has two competing effects on the corporate governance. The first
perspective argues that the firms that are widely followed by analysts may be pressured to adopt
better corporate governance which results in less information asymmetry and higher liquidity
(Brennan, Jegadeesh, and Swaminathan, 1993; Brennan and Subrahmanyam, 1995; Lang, Lins
10
In this paper, we define internal governance as the governance mechanism that works inside the managerial
structure of the firm. Under this definition, we assume that other stakeholders outside the managerial structure, such
as institutional investors, are external forces.

9
and Miller, 2004). Alternatively, analysts have incentive to build their own reputation to increase
their compensation. Hence, they follow the stocks with greater information asymmetry among
market participants or stocks with lower liquidity for which the marginal benefit of information
production is the greatest (Chung, Elder, and Kim, 2010; Van Ness, Van Ness, and Warr, 2001;
Chung, McInish, Wood, and Wyhowski, 1995).
2.2.2. External/Internal governance
Firm‟s charter, bylaws, and state laws can also play an important role in corporate
governance. Gompers, Ishii, and Metrick (2003) (GIM) design an index primarily to capture anti-
takeover provisions in a firm‟s charter, bylaws, and state law. However, Chung, Elder and Kim
(2010) argue that the GIM governance metrics are not appropriate in understanding the effect of
governance on liquidity. They propose a new governance index which captures governance
standards related to the independence of the audit committee, independence and effective
functioning of the board, executive and director compensation and ownership, provisions in the
firm‟s charter and bylaws, and incorporated state provision. Chung, Elder, and Kim (2010)
document a positive relationship between Gov-Index and stock market liquidity.
We analyze the following hypothesis to test if the internal governance improves a firm‟s
liquidity beyond what is explained by the other governance mechanisms.
H2: There is a positive relationship between internal governance and stock market liquidity after
controlling for other governance mechanisms.
2.3. CEO Horizon and Internal Governance
Gibbons and Murphy (1992) and Xu (2011) document that a CEO with a shorter
remaining horizon within the firm loses incentives for focusing on the long term firm
performance. Such myopic CEOs pass up investment in projects with positive long term payoffs
in order to boost contemporaneous earnings (Stein, 1989), overinvest to signal that they have

10
investment opportunities (Bebchuk and Stole, 1993), or take excessive risk (Chevalier and
Ellison, 1999). It is worth mentioning that such CEO‟s foolish behavior is also visible in
practice. One such example is the Merck scandal. In last quarter of 2004, Merck had to pull
Vioxx off the market due to concern linking Vioxx to increased risk for heart attack or stroke,
resulting in the stock prices declining by 28%. Despite the firm‟s poor stock performance in
2004, Ray Gilmartin, the 64-Year-Old CEO, received not only his base salary but performance
based bonuses worth $37.8 millions. Ray Gilmartin was scheduled to retire at the age of 65,
ended up leaving his position 8 months prior to his mandatory retirement age.
Acharya, Myers, and Rajan (2011) suggest that the internal governance should be more
effective for the firms with CEOs close to retirement. To this argument, we test the following
hypothesis:
H3: Internal governance is more effective in improving liquidity for firms with shorter horizon
CEOs.
2.4. Firm-specific learning and internal governance
Acharya, Myers, and Rajan (2011) conjecture that subordinate managers can be a reliable
part of internal governance only if they have a stake in the future of the firm. This requires some
firm-specific rents, which can come from some firm-specific ability or costs of leaving the firm.
The absence of such rents for subordinate managers would make internal governance less
effective.
In human capital intensive industries, managers are required to engage in industry and
firm-specific learning efforts prior to their appointment for an executive position, which
increases their importance, power, and influence on the CEO behavior. Pantzalis and Park (2009)
rank Fama and French 48 industries based on excess value of human capital. For example, the
pharmaceutical industry, a research-intensive and highly innovative industry that depends on

11
intellectual capital as a source of growth, scores the highest rank. Other top-ranked industries,
such as, natural gas, real estate, financial services, precious metals, communication and energy,
share similar characteristics. On the other extreme, the capital intensive industries, such as
manufacturing industries, are less innovative and do not depend heavily on intellectual capital,
and hence, are ranked in the bottom tier. We follow Pantzalis and Park (2009) rank of industries
to test the following hypothesis:
H4: Internal governance is more effective in improving the stock market liquidity for firms that
require greater firm specific skills and knowledge than other firms.
2.5. Subordinate manager experience and internal governance
Acharya, Myers and Rajan (2011) suggest that learning effort by subordinate managers‟ is
very critical not only for the CEO promotion but also for effective monitoring. Consider a firm
with a two-level managerial hierarchy: at the top of this hierarchy is a CEO who is approaching
retirement, in the second layer is a younger subordinate manager who will become CEO next
period. If the subordinate manager lacks the firm or industry needed experience he might not be
considered for CEO promotion and hence he will not be motivated enough to monitor the CEO
actions. Learning also helps the manager become more productive as CEO as it may be much
harder to acquire the knowledge at the CEO level, where vendors and customers will be far more
circumspect and the CEO‟s time more limited. Thus, we test the following hypothesis.
H5: Firms with more experienced managers, relative to the industry, are more liquid than the
firms with less experienced managers.
2.6. Alternative industry-adjusted measure of Internal Governance
The composition of management teams depends on the nature of the industry. For
example, industries in their infancy, such as computer software industry, would have companies
with younger management teams and younger CEOs than mature or older industries.

12
Adjusting the internal governance measure to industry trends adds additional important
insights to our study. Prior research has demonstrated that younger managers are associated with
greater strategic change (Wiersema and Bantel, 1992), while older executives may be less
willing to adapt to new ideas or behaviors (Bantel and Jackson, 1989). In addition, older
executives may be at a stage in their careers where financial security is more important and risk-
taking behaviors may be seen as a threat to that security (Wiersema and Bantel, 1992).
An extension to hypothesis 1 is to test if the higher internal governance as reflected by a
positive industry adjusted age difference improves liquidity. We expect that firms with a higher
age difference to have better internal governance than those with a lower age difference, relative
to the industry. We test the following hypothesis.
H6: There is a positive relationship between industry adjusted internal governance and stock
market liquidity.
3. Data and Methodology
Our sample includes 7 years of data for S&P 1500 firms for the period from 2001 to 2007.
Standard & Poor‟s Execu-Comp database provides annual data for the top executives in S&P
1500 Index U.S. firms. The database includes data on CEO and subordinates managers‟ ages,
appointment dates, dates for leaving the firm and other attributes. Following Acharya, Myers and
Rajain (2011) we limit our sample to include only the top 4 subordinate managers, in addition to
the CEO.11
In calculating our internal governance measure, relative age difference, we include
ages of all available top subordinates, up to 4 subordinates, for each firm. Stock prices, closing
bid and ask prices, trading volume, and shares outstanding are derived from the Center for
Research in Stock Prices (CRSP) database. Data on number of analyst following is extracted
11
Acharya Myers and Rajan (2011) shows in Table II, that nearly 80% of new CEOs are appointed from the top four
executives in the firm in the previous year (top four because one of the top five in the previous year is typically the
old CEO). Some firms in our sample have less than four subordinate managers.
13
from the Institutional Brokers' Estimate System (I/B/E/S) dataset. Data on institutional holdings
is collected from the 13F fillings summarized in the CDA/Spectrum database. Using Institutional
Shareholder Service (ISS) database, we extend Chung, Elder, and Kim (2010) Gov-Index beyond
their sample period of 2001 to 2004, to cover the period from 2001 to 2007. Gov-Index includes
24 governance standards across six categories that are most closely related to
financial/operational transparency and investor protection using the Institutional Shareholders
services (ISS) database.12
Finally, we obtain financial and accounting data such as total assets,
intangible assets, dividend, and R&D expenditure from Compustat database.
The trading data included some trades with zero trading prices and bid and ask quotes for
the locked and crossed markets (bid price less than/equal to ask price). These observations are
removed from the final sample. We also apply the following data filters, which are standard in
microstructure literature (Huang and Stoll, 1996) to clean the data errors and outliers. We delete
1) quotes if either bid/ask is negative, 2) if quote changes by more than 10% compared to the last
quote, 3) stocks with average annual price less than $5 and greater than $500, and 4) stocks that
are not included in SP 1500 index, Compustat, Center for Research in Security Prices (CRSP),
CDA/Spectrum, I/B/E/S, or the ISS database. The variables used in this study and their sources
are summarized in Appendix A.
3.1 Internal governance measure
A crucial parameter of internal governance in Acharya, Myers and Rajan (2011) model,
is the difference in appropriation horizons between the CEO and his subordinates. Prior literature
commonly uses age as a proxy for employment horizon (Brickley et al. 1999, Gibbons and
Murphy 1992, Dechow and Sloan 1991, Matejka et al, 2009). Tenure in the firm is an alternative
12
Similar to Brown and Caylor (2006), Chung, Elder and Kim (2010) create their index (Gov-Index) for each firm
by awarding one point for each governance standard that is met.

14
way to proxy horizon but it has three major problems. First, it reflects only the past horizon and
may not infer anything about the executives‟ expected future horizon. Second, it ignores any
executive experience outside the current firm. Third, it ignores the cumulative learning and
experience of executive beyond their executive position. Age, as a proxy of the horizon within
the firm, can circumvent these concerns. Hence, we use the average relative age differences
between the CEO and other top four executives as a proxy for the difference in horizons within
the firm and thus, the level of internal governance. Our internal governance measure is calculated
as follows.
(1)
where is the age of CEO and is the mean age of the
top four subordinate managers for firm i at year t. The use of relative age difference instead of
the original ages, rules out the possibility that this measure may proxy other attributes of CEO or
subordinates such as; sophistication, risk taking, education, or experience.13
3.1.1 Subordinate Managers’ Experience
To test hypothesis 5, we need to empirically measure subordinate manegers‟ experience
level. Antia, Pantzalis and Park (2010) devise a measure of expected CEO decision horizon
based on a combination of CEO tenure and age relative to the industry. We use their measure as
a proxy for the relative experience of subordinate managers‟ in each firm to their peers in the
same industry. As subordinate managers‟ knowledge and experience increase at firm and
industry levels, their ability to make an effective internal monitoring also increases. The
comparison with the other subordinate managers is done on two dimensions; the length of
current tenure and age. The measure of subordinate managers‟ experience is defined as follows
13
Raw age can be directly related to risk aversion, education, or experience but the age difference between CEO and
subordinates controls for the individual attributes (See, Ang, Cole and Lawson, 2010; Lundstrom, 2002).

15
[ ] [ ]
where , is the number of years that a subordinate manager has been within firm and
is the age of the subordinate manager who work for firms i in year t. is the
industry median of tenure and is the industry median of subordinate managers‟ ages.
Industry classification is defined based on the Fama-French 48 industry classification. Given that
the above measure is an industry-adjusted measure, it can take either positive or negative values.
A positive value indicates that the subordinate manager's expected experience is more than the
industry median either because the subordinate manager is older than the median age of other
subordinate managers in the same industry and/or has been in his/her current position as long as
or more than the industry median. Similarly, a negative value indicates that the expected
experience is less than the industry median because the subordinate manager is younger and/or
been in his/her position for shorter period of time than the median competitor firm's subordinate
managers.
3.1.2 Industry Adjusted Age Difference
To account for the differences of team composition among the different industries, we
develop industry-adjusted measure of internal governance. The industry-adjusted measure of
internal governance is calculated as follows.
A positive (negative) value indicates that the relative age difference between the CEO and his
subordinates‟ managers for a firm is greater (less) than the industry average.
16
3.2 Liquidity Measures
Kyle (1985) notes that „„liquidity is a slippery and elusive concept, in part because it
encompasses a number of transactional properties of markets, these include tightness, depth, and
resiliency.‟‟ Empirical liquidity measures span from direct trading costs (tightness) measured by
spreads, to indirect trading costs measured by price impact. The literature provides a variety of
measures and proxies to estimate liquidity. We use three different measures of liquidity: Gibbs
estimate proposed by Hasbrouck (2009), the percentage spread, and share turnover. Gibbs
estimate and percentage spread are inverse measures of liquidity while turnover is a direct
measure of liquidity.
3.1.1 Gibbs Estimate
Roll (1984) proposes a method to estimate bid-ask spreads from the time series of daily
price changes. Specifically, he notes that positive spreads will induce negative serial correlation
in transaction price changes and that spreads can be estimated from that serial correlation. One of
the limitations of the measure is that estimates of spreads are negative when stock price changes
are positively correlated. Hence, we use an updated Gibbs estimate measure, developed by
Hasbrouck (2009) that addresses this econometric problem with the Roll‟s measure.14
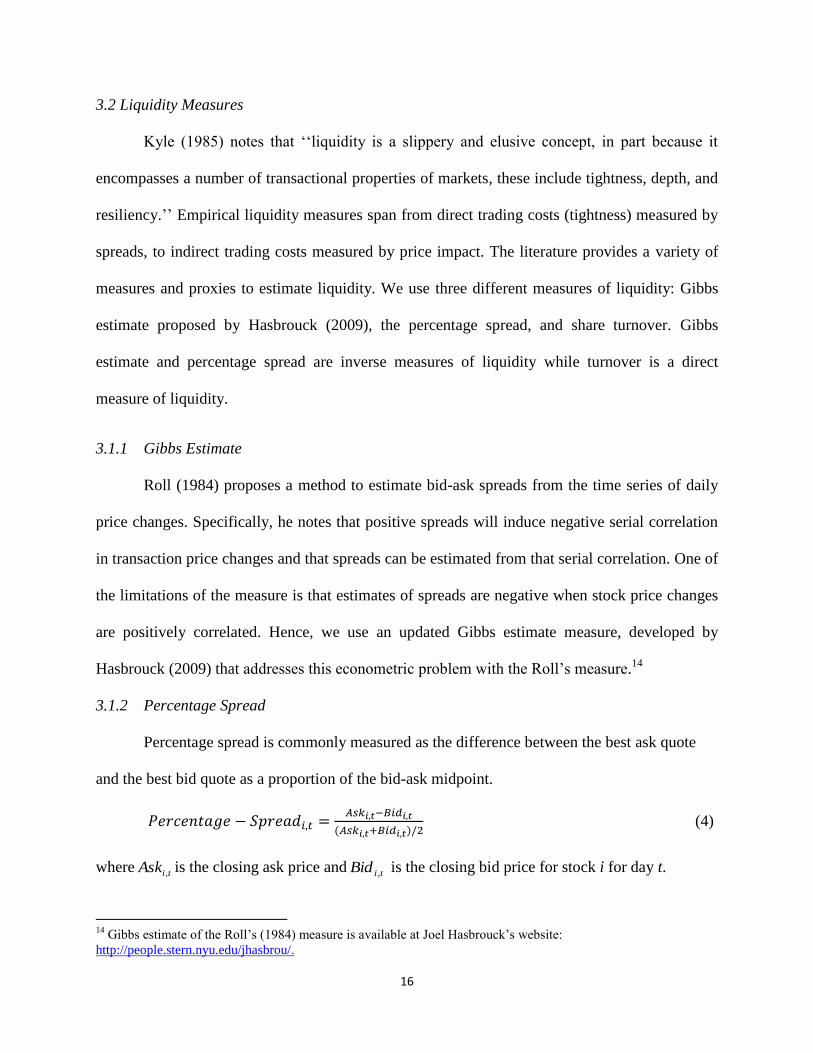
3.1.2 Percentage Spread
Percentage spread is commonly measured as the difference between the best ask quote
and the best bid quote as a proportion of the bid-ask midpoint.
(4)
where is the closing ask price and is the closing bid price for stock i for day t.
14
Gibbs estimate of the Roll‟s (1984) measure is available at Joel Hasbrouck‟s website:
http://people.stern.nyu.edu/jhasbrou/.
tiAsk , tiBid ,

17
3.1.3 Turnover
Turnover is the daily volume as a proportion of shares outstanding. We use the firm-year
average of this measure. Since volume on NASDAQ is known to be overstated as a result of
trades between dealers, following Atkins and Dyl (1997) and Lipson and Mortal (2009), we
divide volume on NASDAQ-listed firms by 2 to get to an adjusted turnover measure.
(5)
3.2. Control Variables
Level of monitoring and our measures of market liquidity could be spuriously correlated
because they are related to a common set of variables. Including the variables that are related to
both level of monitoring and market liquidity in a regression model can reduce the possibility of
spurious correlation. For example, Chung and Zhang (2011) and Chung, Elder, and Kim (2010)
document that the larger firms may simultaneously exhibit better governance structure due to
higher investor interest and lower spreads due to smaller adverse selection risks (e.g., more
information is available on larger firms). We include the following control variables: closing
price, research and development expenses, firm size, trading volume, return volatility, intangible
assets, dividend per share, and return on S&P 500 index. We provide further details on these
variables in the later sections.
4. Empirical Results
4.1. Descriptive Results
Table 1 reports the descriptive statistics for the key variables included in our study. The CEO‟s
age is available for 7694 observations and subordinate managers‟ age is available for 7556
observations for the period from 2001 to 2007. In Table (1) we include statistics about CEO and
subordinate managers only for firms that have at least one liquidity measure. The mean CEO age
18
of 54.63 years is comparable to the mean age reported by Acharya, Myers and Rajan (2011).15
The youngest CEO in our sample is 32 years old, while the oldest is 92 years old. The mean age
for the top four subordinate managers‟ is 50.6 years; the youngest being 29.33 years old while
the oldest is 81 years old. The mean relative age difference between the top 4 subordinate
managers‟ ages and the CEO‟s age is 4 years. The distribution of relative age difference ranges
from firms with subordinate managers older than the CEO by 25 years, to firms with a CEO
older than his subordinate managers by 39.25 years. Table 1 further reports an average Gov-
Index of 12.49, indicating that, on average, the sample firms meet approximately half of the
governance standards.16
In addition, we find that our sample firms have, on average, 68%
institutional ownership and 10.85 analysts following their stocks. Table 1 also shows that the
means of Gibbs estimate, percentage spread, and turnover are 0.31%, 0.36%, and 7.39%,
respectively. Descriptive statistics for the control variables are also reported in Table 1.
Insert Table (1)
4.2. Liquidity and internal governance
We regress percentage spread, Gibbs estimate, and turnover, on various levels of
monitoring and a number of control variables using annual pooled cross-sectional and time-series
data. Including the variables that are related to both level of monitoring and market liquidity in
the regression model reduces the possibility that any estimated relation between level of
monitoring and market liquidity is spurious. Previous studies show that a significant portion of
cross-sectional and time-series variation in liquidity can be explained by select stock attributes
(see McInish and Wood, 1992; Chung, Van Ness, and Van Ness, 1999; and Stoll, 2000). To
15
Acharya, Myers and Rajan (2011) provide the distribution of CEO and Subordinated managers‟ ages in Table 1
over the period of 1992- 2008. They report a mean CEO age of 55.6 years, a mean subordinated managers‟ age of
51.6 years, and the mean age difference of 4 years. 16
Chung, Elder and Kim (2010) reports that the average Gov-Index is 11.49 for their sample firms, the minimum is
3 while the maximum is 20.

19
isolate the effect of internal governance on liquidity, we control for stock‟s average daily closing
price (in logarithm), return volatility, dollar trading volume (in logarithm), and dividend per
share. S&P 500 return is included to control for the market conditions in the regression model.
Previous research shows that firm size can be positively correlated with both better
governance and lower liquidity. To examine whether corporate governance has an independent,
direct impact on liquidity, we control for firm size (as measured by the book value of total assets)
in the regression model. Further, we control for asset tangibility and R&D expenditure. Asset
tangibility could reduce asymmetric information as payoffs on tangible assets‟ are easier to
observe. In contrast, high R&D intensity may increase asymmetric information problems
because payoffs from R&D are difficult to predict. Based on these considerations, we estimate
the following regression model.
Percentage Spreadi,t,or Gibbs estimatei,t or Turnoveri,t
=β0 + β1Internal Governancei,t + β2 Other Governancei,t+ β3Log(Closing Pricei,t) + β4 R&D
Expenditurei,t + β5 Total Assetsi,t + β6 Log(Dollar Volumei,t) + β7 Volatilityi,t+ β8 Intangible
Asseti,t+ β9 Dividend per sharei,t + β10 SP500 Returni,t + εi,t; (6)
where Percentage Spreadi,t is the proportionate quoted spread, Gibbs estimate is a measure of
effective cost calculated using Gibb‟s sampler, Turnoveri,t is average daily volume as a
proportion of shares outstanding, Internal Governancei,t is measured as the average relative age
differences between the CEO and other top four executives, Other Governancei,t includes
internal/external governance (Gov-Index), and external governance (institutional ownership and
analysts following), Closing Pricei,t is the mean daily stock price, R&D Expenditurei,t is a firm‟s
annual expenditure on research and development activities, Total Assetsi,t is the book value of a
firm‟s total assets, Dollar Volumei,t is the mean daily dollar trading volume, Volatilityi,t is the

20
standard deviation of daily returns, Intangible Assetsi,t is the book value of total intangible assets,
Dividend per sharei,t is the dividend paid per share, SP 500 Return is the daily return on S&P
index, and εi,t is the error term. The subscripts i and t refers to stock i and year t. We calculate t-
statistics using White‟s (1980) standard errors and report them in parentheses.
Insert Table 2
Table 2 summarizes our main results from the regression analysis. We use three different
model specifications to analyze the relationship between liquidity and internal governance. The
first model uses internal governance, measured by the relative age difference, as the sole level of
monitoring. The second model adds the external governance as the additional level of
monitoring, and the final model accumulates the total effect of the three levels of governance.
The results show that the coefficients on relative age difference are negative and statistically
significant for both the Gibbs estimate and percentage spread, and positive and statistically
significant for turnover. Hence, firms with higher age difference between top subordinate
managers and CEO (or a higher divergence of appropriation horizons) are more liquid. These
results emphasize the importance of subordinate managers in internal corporate governance.
Subordinate managers have a longer horizon in the firm than the CEO, and thus they exert more
monitoring effort on the incumbent CEO. In addition, they are motivated enough to provide more
reliable and accurate information to the financial market to keep the firm liquid and attractive to
stock market investors. These results support Hypothesis 1 and are consistent with Acharya,
Myers and Rajan‟s (2011) theoretical model.
Consistent with previous studies, we also find that liquidity is significantly and positively
related to closing price, asset tangibility, return volatility, and dollar volume (McInish and
Wood, 1992; Chung, Van Ness, and Van Ness, 1999; and Stoll, 2000). Further we find that

21
liquidity is negatively related to R&D expenditures, volatility, and dividends. Our results are
consistent with the findings of Chung, Elder and Kim (2010) in the sense that a higher R&D
expenditure may increase asymmetric information, because payoffs from R&D expenditures are
difficult to predict, resulting in lower liquidity. Our results also support the findings of Banerjee,
Gatchev, and Spindt (2007) that owners of more (less) liquid common stocks are less (more)
likely to receive dividend. They suggest that cash dividends reduce investor dependence on the
liquidity of the market, and hence, liquidity and dividends are negatively related.
In the second model we add the two measures of external governance: the institutional
ownership and the number of analysts following. We find that the coefficient for institutional
ownership is negative and statistically significant for percentage spread and positive and
statistically significant for turnover. These results are consistent with Chung and Zhang (2011)
and Chung, Elder and Kim (2010). The institutional investors provide effective monitoring for
the corporate managers and thus reduce the information asymmetry, between insider and
liquidity providers, resulting in an increase in liquidity.
Further we find a significant and negative relationship between liquidity and number of
analysts following. One possible interpretation is that analysts have incentives to build their own
reputation by following firms with a greater information asymmetry. These results are consistent
with the findings of Chung, McInish, Wood, and Wyhowski (1995) and Chung, Elder and Kim
(2010).
For our final model, we run a pooled regression by including all three layers of
monitoring in one regression equation. We find that the coefficient for Gov-Index is significantly
positive for Turnover and significantly negative for Gibb‟s C-estimate and percentage spread.
These results are in line with the conjecture that better governance leads to higher stock market
22
liquidity. More importantly, our measure of internal monitoring, relative age difference between
CEO and subordinate managers, is still significant and positively related to liquidity, even after
controlling for the other levels of corporate governance. These results support Hypothesis 2 and
document that internal governance significantly positively impacts stock market liquidity beyond
the traditional governance measures.
4.3. Internal governance for firms with older vs. younger CEOs
Acharya, Myers and Rajan (2011) argue that subordinate managers are important
stakeholders in the firm, who care about their future. They suggest that control need not to be
exerted just from top-down (CEO to subordinates managers), or from outside the firm, it can also
be exerted bottom-up (from subordinated managers to CEO). However, the internal governance
works effectively only when there is real divergence between CEO‟s and the managers‟
appropriation horizon. Gibbons and Murphy (1992) and Xu (2011) document that a CEO with a
shorter remaining horizon within the firm loses incentives for focusing on the long-term firm
performance. Pass up positive long term payoffs investment opportunities (Stein, 1989),
overinvest to signal that they have investment opportunities (Bebchuk and Stole, 1993) and take
excessive risk (Chevalier and Ellison, 1999) are among the common behaviors of a nearsighted
CEO.
To investigate the effectiveness of internal governance and the role of subordinate
managers when a firm has a CEO close to retirement, we construct two subsamples: firms with
CEOs above the mean CEO age (55 years old) and firms with CEOs with less than 55 years
old.17
Table 3 Panel A presents summary statistics of CEOs‟ and subordinate managers‟ ages for
the two subsamples. CEO above 55 years old subsample‟s statistics show that the mean CEO age
is 59.90 years, while his subordinates have a mean age of 51.71 years. The mean relative age
17
We choose both mean and median CEO age (55 year old) as a cutoff.

23
difference is 7.91 years which indicates that there is a big difference in horizon between CEOs
and their respective subordinates. On the contrary we find that the subsample with CEO less than
55 years old has no meaningful difference between CEO‟s age and subordinates managers‟ age.
These findings are consistent with the conjecture that subordinates managers have a longer
horizon relative to the CEO, which in turn motivates them to exert higher degree of internal
governance and keep the firm attractive to capital market investors.
Our summary statistics are supported with the regression results reported in Table 3 Panel
B. The regression results show that the coefficients of relative age difference, our measure of
internal governance, are statistically significant for firms with CEOs above 55 years of age.
However, the coefficients of internal governance measure in second subsample, firms with CEO
below 55 years old, are statistically insignificant. All other layers of corporate governance are
still significant and have the correct signs in both subsamples. These results support our
Hypothesis 3 that the internal governance mechanism is effective when the remaining horizon of
a CEO is short and subordinate managers have a longer horizon relative to the CEO.
Insert Table 3
4.4. Internal governance for firms that require firm specific skills
Another key component for the effectiveness of internal governance is the level of firm-
specific learning or effort the manager needs prior to becoming a CEO (Acharya, Myers, and
Rajan, 2011). To test the third hypothesis, we adopt Pantzalis and Park (2009) excess value of
human capital industrial rank to differentiate between industries that require intensive human
capital and those that mainly depend on non- human capital. We construct two subsamples of 24
industries each. The industry classification is based on Fama and French (1997) 48-industry
listing. Table 4, Panel A reports the summary statistics for both the subsamples. For the top 24

24
human capital value industries, we find that the average of CEO‟s age, subordinate managers‟
age, and relative age difference are 54.36 years, 50.56 years, and 3.67 years, respectively.
Interestingly, we find a similar pattern for bottom 24 human capital value industries with average
of CEO‟s age of 55.15 years, subordinate managers‟ age of 50.92 years, and relative age
difference of 3.84 years.
Table 4, Panel B reports the results from regression analysis for the two subsamples of
firms divided based on the value of human capital. We find a positive and statistically significant
relation between liquidity and relative age difference only for firms in industries that have higher
excess value of human capital. These results suggest that internal governance not only depends
on the difference of horizon between the CEO and his subordinates, but also on the nature of the
job and the relative power of both the CEO and the subordinate managers within the firm. Hence,
internal governance is only effective for firms that require firm specific skills, which restricts the
mobility of employees across industries. These results support our Hypothesis 4.
Insert Table 4
4.5. Subordinate manager experience and internal governance
If the subordinate manager lacks the firm or industry needed experience he might not be
considered for CEO promotion and hence he may not be motivated enough to monitor the CEO‟s
actions. We use the measure developed by Antia, Pantzalis and Park (2010), and described in
equation 2, to proxy the relative experience of subordinate managers in each firm relative to their
peers in the same industry. As subordinate managers‟ knowledge and experience increase at the
firm and the industry levels, their ability to make an effective internal monitoring also increases
(Acharya, Myers and Rajan 2011). The comparison with other subordinate managers is
conducted on two dimensions: the length of current tenure and age. The tenure reflects the firm-

25
specific experience and knowledge, while the age reflects the accumulated experience beyond
the executive position and outside the firm.
Table 5, Panel A reports that experienced subordinate managers have a mean age of 51.7
years, compared to 49.9 year for inexperienced managers. The relative age difference of
experienced managers is 2.55 years compared to 4.19 years for inexperienced subordinate
managers‟ sub-sample. Although experienced managers have shorter horizon than inexperienced
managers, we expect to find that managers with more cumulative experience are capable of
imposing better governance. These results support our argument that age reflects the
accumulated experience of subordinate managers outside the firms and beyond executive
positions. Table 5, Panel B reports the regression results. We find that firms with more
experienced subordinate managers are capable of implementing more effective internal
monitoring than those who have subordinate managers with less experience than their industry
peers. The coefficients of internal governance measure are significant only for the experienced
managers‟ subsample. These results support Hypothesis 4. Despite the fact that the summary
statistics show that inexperienced subordinate managers have higher relative age difference, the
regression results shows that internal governance is only effective with experienced subordinate
managers. These results highlight the importance of the accumulated experience for effective
internal monitoring.
Insert Table 5
4.6. Alternative Internal Governance Measure: Industry Adjusted Age Difference
The nature of the industry maps the demographic attributes of its top management teams.
Mature industries might have older top management team compared to industries in their
infancy, such as internet and software industries. Emerging industries also might have CEOs

26
who has the same age as his subordinates. To account for variations in the top management team
across different industries, we devise industry adjusted age difference measure of internal
governance as described in equation 3.
Table 6 reports the result of regression analysis to rule out the possibility that our results
are driven by industry variations. We find that the coefficients of industry adjusted internal
governance measures are significantly negative for Gibbs estimate and percentage spread and
significantly positive for turnover. These results are in line with the conjuncture that better
internal governance leads to higher stock market liquidity and are consistent with results
summarized in Table 2.
Insert Table 6
4.7. Positive vs. Negative Industry adjusted age difference
To further understand the relationship between the internal governance and stock market
liquidity, we investigate if internal governance improves liquidity by dividing our sample into
two subsamples of firms with positive and negative industry adjusted age differences. A positive
(negative) value indicates that the relative age difference between the CEO and his subordinates
for a given firm is greater than the industry relative age difference. Table 7, Panel A reports the
descriptive statistics for both subsamples. For positive industry adjusted age difference
subsample, we find that the average CEO‟s age is 58.01years and the average of subordinate
managers‟ age is 49.23 years. The average of age difference between the CEO and his
subordinates is almost 9 years, while the industry adjusted age difference is 5.25 years. On the
other hand, the negative industry adjusted age difference subsample has mean CEO age of 51.38
years and the mean subordinate managers‟ age of 52.07 years. The average of age difference

27
between the CEO and his subordinates is -1.35 years, while the industry adjusted age difference
is -5.11 years.
Table 7, Panel B summarizes the regression results for positive and negative industry
adjusted age difference subsamples. We find that only the firms with a positive age difference
relative to operating industry have significant coefficients of internal governance as measured by
the industry adjusted age difference. The coefficients of industry adjusted measure for both
Gibbs estimate and percentage quoted spread are negative and statistically significant. Also the
coefficient of internal governance for turnover is positive and statistically significant. These
results are consistent with our earlier findings that firms with internal governance are more
liquid. However, for the firms with negative industry adjusted age difference, the level of
internal governance does not significantly influence the liquidity. It is noteworthy to mention that
other governance mechanisms are still significant for negative industry adjusted age subsample.
These results suggest the complementary relationship between internal governance and other
governance mechanisms.
Insert Table 7
5. Additional Analyses
5.1. Internal Governance and Information Content
In this paper, we conjecture that internal governance affects liquidity because better
internal governance improves operational and financial transparency and decreases the
information asymmetry in the financial market. Subordinate managers, with the ability to
produce more reliable information for the market, can actively reduce the information
asymmetry and hence improve the liquidity for the firm. To assess the extent to which internal
governance is associated with the information contents of prices, we follow Jiang, Xu and Yao

28
(2009) and use the return idiosyncratic volatility of the firm as a proxy the information content of
prices.
A growing body of literature supports the use of firm-specific return variation as a
measure of stock price informativeness. French and Roll (1986) and Roll (1988) show that
significant portion of return variation is not explained by market movement. They suggest that
firm specific stock return variation measures the rate of private trading information incorporated
into prices. Morck, Yeung and Yu (2000) find that stocks in countries with stronger property
rights promote informed arbitrage, which capitalizes firm specific information and increase
idiosyncratic return volatility. Durnev, Morck, Yeng and Zarowin (2003) find that U.S.
industries with high levels of firm-specific return variation have stock prices that are more
informative about future earnings. Along the same line of literature, Jiang, Xu and Yao (2009)
further document that the predictive power of idiosyncratic volatility is induced by its
information content about future earnings.
We estimate a stock‟s idiosyncratic volatility in each year from daily CRSP data using
two different market models. The first estimation method use S&P 500 return as the sole market
factor. While the second model uses the Fama and French (1993) three-factor model. To be
specific, idiosyncratic volatility, IVOL, is the standard deviation of the residuals ( ) from the
following regression models:
(7)
where is the return for stock i at year t, market return at period t (using either the
S&P 500 market return or Fama-French market factor) and HML and SMB are the daily Fama-
French book-to-market and size factors18
.
18
The daily and monthly Fama and French factors used in our analysis are obtained from Ken French‟s Web site.

29
Table 8 shows that the internal governance, measured by the average relative age
differences between the CEO and other top executives, is positively related to the information
content of prices. The positive relationship between the internal governance and idiosyncratic
volatility reveals that younger subordinate managers can enhance the amount of information
available for outside investors and hence reduce the information asymmetry between insiders and
outsiders. Our results are consistent with Chung, Kim, Elder (2010) that corporate governance
enhance the stock market liquidity through improving the operational and financial transparency
and hence reduce the information asymmetry between insider and outsiders.
5.2. Concentrated ownership (family firms)
Acharya, Myers, and Rajan‟s (2011) model assumes that the CEO and subordinate
managers have divergent horizons in the firm. If the CEO has a shorter horizon, he may divert
cash out of the firm, consume perks, or convert cash to leisure by shirking, leaving nothing
behind him. However, the difference in horizon and inefficient use of resources may not be
relevant to firms that owned and managed by family members. In family controlled firms, the
CEO and his subordinates, presumably, share the same objectives and do not have the divergent
misappropriation horizon problem. As we have no access to data on family ownership, we use
the ownership concentration of the top executive in the firm as a proxy for family controlled
firms. Untabulated results indicate that internal governance is not effective in enhancing stock
market liquidity for firms with executive ownership greater than 10 percent. However, the
relationship between stock market liquidity and internal governance is statistically significant for
the rest of the sample.19
This lends support to the assertion that internal governance, as a
monitoring mechanism, is less critical to mitigate agency problems when CEO and firm‟s
interests are aligned.
19
Our results are robust to alternative cutoffs for executive ownership such as 15% and 30%.

30
5.3. Econometric Issues
Although we find that the internal governance and the other layers of monitoring are
positively related to stock market liquidity, the OLS regressions may not fully account for the
potential endogeneity and reversed causality in the sample. Modeling the relationship between
governance and stock market liquidity may be problematic if there is an endogenous feedback
from stock market liquidity to different levels of governance because liquidity and governance
are jointly determined. Prior studies suggest that the causality between governance and liquidity
is more likely to be influenced by the firm characteristics and ownership structure (Stoll, 2000,
Banerjee, Gatchev, and Spindt 2007, Lipson and Mortal 2009). We do not believe that liquidity
can affect the relative age difference between the CEO and his subordinates. Hence, the main
result of this paper should not have any serious endogeneity issues. We verify this by performing
Granger causality test. In results not reported, we confirm that liquidity does not Granger-cause
our measure of internal governance.
5.4 Fixed Effect Estimation
In this section, we check for the robustness of our results with respect to different
estimation methods. In order to improve estimation efficiency, we analyze the relationship
between stock market liquidity and the different levels of monitoring using industry fixed effect
and year fixed effects. These fixed effects control for the industry‟s specific characteristics and
time trends that are not captured by other control variables. Results reported in Table 9 indicate
that the positive relationship between internal governance and liquidity is robust to the alternate
model specifications.
Insert Table 9

31
Conclusion
We examine the impact of internal governance on the stock market liquidity of S&P 1500
firms. Acharya, Myers, and Rajan (2011) introduce a new definition of internal governance
based on partnership between the current CEO and his subordinates, who are the potential future
CEOs. In order to protect their future in the firm, subordinate managers can effectively exert
internal governance to assure that the CEO makes firm value maximizing decisions.
To empirically test the theoretical proposition of Acharya, Myers, and Rajan (2011), we
devise a new measure of internal corporate governance that captures the divergence of
appropriation horizons between the current CEO and his subordinate managers. We proxy this
divergence of horizons by the mean relative age difference between the top four subordinate
managers‟ ages and the CEO‟s age. Using various, well established measures of liquidity, such
as Gibbs estimate, percentage spread, and turnover, we document that firms with a larger
divergence of appropriation horizons are more liquid. We further show that internal monitoring
is more effective for firms with CEOs with relatively shorter horizon, firms with more
experienced subordinate managers, and firms that require a higher degree of firm specific
knowledge and skills.
We also study whether the importance of internal governance on liquidity remains when
other governance measures are included in the analysis. We use two widely accepted external
corporate governance measures, institutional ownership and number of analysts following a firm
to proxy the external governance mechanisms. Our results are consistent with Chung and Zhang
(2011) who find that institutional investors prefer stocks of better-governed firms for liquidity
reasons. We find that analysts follow stocks with lower liquidity, as suggested by earlier
literature (Chung, Elder, and Kim, 2010; Van Ness, Van Ness, and Warr, 2001; Chung, McInish,

32
Wood, and Wyhowski, 1995). Further, our result of a positive relationship between governance
index and stock market liquidity is consistent with Chung, Elder, and Kim (2010). In sum,
internal governance is positively correlated with liquidity and our results are robust to inclusion
of conventional governance measures, alternative model specifications, and different measures of
internal monitoring and liquidity.

33
References
Acharya, V., S. Myers, and R. Rajan. “The Internal Governance of Firms.” Journal of Finance,
66 (2011), 689-720.
Admati, A., and P. Pfleiderer. “The Wall Street walk and shareholder activism: exit as a form of
voice.” Review of Financial Studies, 22 (2009), 2645-2685.
Aggarwal, R., H. Fu, and Y. Pan. “An Empirical Investigation of Internal Governance.” SSRN
working paper, (2013). Available at SSRN:
http://papers.ssrn.com/sol3/papers.cfm?abstract_id=1571740
Amihud, Y. “Illiquidity and stock returns: cross section and time-series effects.” Journal of
Financial Markets, 5 (2002), 31–56.
Ang, J., R. A. Cole and D. Lawson. “The role of owner in capital structure decisions: An analysis
of single-owner corporations.” Journal of Entrepreneurial Finance, 14 (2010), 1-36.
Antia, M., C.Pantzalis, and J. C. Park. “CEO decision horizon and firm performance: An
empirical investigation.” Journal of Corporate Finance, 16 (2010), 288–301.
Armour, J., Deakin, S., Sarkar, P., Siems, M. and Singh, A. “Shareholder Protection and Stock
Market Development: An Empirical Test of the Legal Origins Hypothesis.” Journal of
Empirical Legal Studies, 6 (2009), 343–380.
Ashbaugh-Skaife, H., D. Collins, and R. LaFond. “The effects of corporate governance on firms‟
credit ratings.” Journal of Accounting and Economics, 42 (2006), 203-243.
Atkins, A. B. and E. A. Dyl. “Market structure and reported trading volume: NASDAQ versus
the NYSE.” Journal of Financial Research, 20 (1997), 291-304.
Banerjee, S., V. A. Gatchev, and P. A. Spindt. “Stock market liquidity and firm dividend policy.”
Journal of Financial and Quantitative Analysis, 42 (2007), 369-398.
Bantel, K.A. and S.E. Jackson. “Top management and innovations in banking: Does the
composition of the top team make a difference.” Strategic Management Journal, 10
(1989), 107-124.
Bebchuk, L. A., and A.Cohen. “The costs of entrenched boards.” Journal of Financial
Economics, 78 (2005), 409-433.
Bebchuk, L. A., A. Cohen, and A. Ferrell. “What Matters in Corporate Governance?” Review of
Financial Studies, 22 (2009), 783-827.
Bebchuk, L.A. and L.A. Stole. “Do Short-term Objectives Lead to Under- and Overinvestment in
Long-term Projects?” Journal of Finance, 48 (1993), 719-729.
Bhide, A. “The hidden costs of stock market liquidity.” Journal of Financial Economics 34
(1993), 31-51.

34
Brennan, M.J., N. Jegadeesh, and B. Swaminathan. “Investment analysis and the adjustment of
stock prices to common information.” Review of Financial Studies, 6 (1993), 799–824.
Brennan, M. J. and A. Subrahmanyam. “Market Microstructure and Asset Pricing: On the
Compensation for Illiquidity in Stock Returns.” Journal of Financial Economics, 41
(1995), 441-464.
Brickley, J. A., J. S. Linck, J. L. Coles. “What happens to CEOs after they retire? New evidence
on career concerns, horizon problems, and CEO incentives.” Journal of Financial
Economics, 52 (1999), 341–377.
Brockman, P., and S. Yan, “Block Ownership and Firm-Specific Information.” Journal of
Banking and Finance, 33 (2009), 308-316.
Brown, L. D., and M. L. Caylor. “Corporate Governance and Firm Valuation.” Journal of
Accounting and Public Policy, 25 (2006), 409–434.
Brown, L. D., and M. L. Caylor. “Corporate Governance and Firm Operating Performance.”
Review of Quantitative Finance and Accounting, 32 (2009), 129–144.
Chevalier, J. and G. Ellison. “Career Concerns of Mutual Fund Managers.” Quarterly Journal of
Economics, 114 (1999), 389-432.
Chi, J. “Understanding the endogeneity between firm value and shareholder rights.” Financial
Management, 34 (2005), 65-76.
Chung, K.H, J. Elder, and J.C Kim. “Corporate governance and liquidity.” Journal of Financial
and Quantitative Analysis, 45 (2010), 265-291.
Chung, K.H, T. McInish, R. Wood, and D. Wyhowsky. “Production of information, information
asymmetry, and the bid-ask spread: Empirical evidence from analysts' forecasts.” Journal
of Banking and Finance, (1995), 1025-1046.
Chung, K., B. Van Ness, and R. Van Ness. “Limit orders and the bid-ask spread.” Journal of
Financial Economics, 53 (1999), 255-287.
Chung, K., and Zhang, H. “Corporate Governance and Institutional Ownership.” Journal of
Financial and Quantitative Analysis, 46 (2011), 247-273.
Coffee, J. “Liquidity versus Control: The Institutional Investor as Corporate Monitor.” Columbia
Law Review, 91 (1991), 1277-1368.
Cremers, K. J. M. and V. B. Nair. “Governance mechanisms and equity prices.” Journal of
Finance, 60 (2005), 2859-2894.
Daske, H., L. Hail, C. Leuz, R. S. Verdi. “Adopting a Label: Heterogeneity in the Economic
Consequences Around IAS/IFRS Adoptions.” Journal of Accounting Research, 51
(2013), 495–547.

35
Dechow, P. M., R. G. Sloan. “Executive incentives and the horizon problem: An empirical
investigation.” Journal of Accounting and Economics, 14 (1991), 51–89
Del Guercio, D., and J. Hawkins. “The Motivation and Impact of Pension Fund Activism.”
Journal of Financial Economics, 52(1999), 293–340.
Durnev, A., R. Morck, B. Yeung, and P. Zarowin. “Does greater firm specific return variation
mean more or less informed stock pricing?” Journal of Accounting Research, 25 (2003),
797–836.
Edmans, A. “Blockholder trading, market efficiency, and managerial myopia.” Journal of
Finance, 64 (2009).
Edmans, A., G. Manso. “Governance Through Trading and Intervention: A Theory of Multiple
Blockholders” Review of Financial Studies, 24 (2010), 2395 - 2428.
Fama, E. and K. French. "Common Risk Factors in the Returns on Stocks and Bonds." Journal
of Financial Economics, 33 (1993), 3–56.
Fama, E. and K. French. “Industry costs of equity.” Journal of Financial Economics, 43 (1997),
153–194.
Faure-Grimaud, A. and D. Gromb. “Public trading and private incentives.” Review of Financial
Studies, 17 (2004), 985-1014.
French, K. and R. Roll. “Stock return variances: The arrival of information and the reactions of
traders” Journal of Financial Economics, 17 (1986), 5-26.
Gibbons, R. and K.J. Murphy. “Optimal Incentive Contracts in the Presence of Career Concerns:
Theory and Evidence.” Journal of Political Economy, 100 (1992), 468-505.
Gompers, P., J. Ishii, and A. Metrick. “Corporate Governance and Equity Prices.” Quarterly
Journal of Economics, 118 (2003), 107-155.
Graham, J. R., C. Harvey, and M. Puri. “Managerial attitudes and corporate actions.”
Journal of Financial Economics, (2013) forthcoming.
Harford, J., S. Mansi, W. Maxwell. “Corporate governance and firm cash holdings in the US.”
Journal of Financial Economics, 87 (2008), 535–555
Hasbrouck, J. “Trading Costs and Returns for US Equities: Estimating Effective Costs from
Daily Data.” Journal of Finance, 46 (2009), 1445-1477.
Huang, R. D. and H. R. Stoll. “Dealer versus auction markets.” Journal of Financial Economics,
41 (1996), 313-357.
Jensen, M. C. and W. H. Meckling. “Theory of the firm: Managerial behavior, agency costs and
ownership structure.” Journal of Financial Economics, 3 (1976), 305-360.

36
Jiang, G., D. Xu, and T. Yao. “The Information Content of Idiosyncratic Volatility.” Journal of
Financial and Quantitative Analysis, 44 (2009), 1–28.
Johnstone, K., C. Li, and K. H. Rupley. “Changes in corporate governance associated with the
revelation of internal control material weaknesses and their subsequent remediation.”
Contemporary Accounting Research, 28 (2011), 331-383.
Kyle, A. S. “Continuous Auctions and Insider Trading.” Econometrica, 53 (1985), 1315-1335.
Landier, A., J. Sauvagnat, D. Sraer and D. Thesmar. “Bottom-Up Corporate Governance”
Review of Finance, (2012).
Lang, M., K. Lins, and D. Miller. “Concentrated control, analyst following and valuation: Do
analysts matter most when investors are protected least?” Journal of Accounting
Research, 42 (2004), 589-623.
La Porta, R., F. Lopez-de-Silanes, A. Shleifer, and R. Vishny. “Investor Protection and
Corporate Governance.” Journal of Financial Economics, 58 (2000), 3-27.
Leuz, C., D., Nanda, P. Wysocki. “Earnings Management and Investor Protection: An
International Comparison.” Journal of Financial Economics, 69 (2003), 505-527.
Lundstrom, L. “Corporate Investment Myopia: A Horserace of the Theories.” Journal of
Corporate Finance, 8 (2002), 353 – 371.
Lipson, M. L., and S. Mortal. “Liquidity and Capital Structure.” Journal of Financial Markets,
12 (2009), 611-644.
Matějka, M., K. A. Merchant, and W. A. Van der Stede. “Employment horizon and the choice of
performance measures: Empirical evidence from annual bonus plans of loss-making
entities.” Management Science, 55 (2009), 890–905.
Masulis, R., C. Wang, F. Xie. “Corporate governance and acquirer returns.” Journal of Finance,
64 (2006), 1851-1889.
Maug, E. “Large Shareholders as Monitors: Is There a Trade-Off between Liquidity and
Control?” Journal of Finance, 53 (1998), 65-98.
Maug, E. “Insider Trading Legislation and Corporate Governance.” European Economic Review, 46
(2002), 1569-1597
McCahery, J., Z. Sautner, and L. Starks. “Behind the scenes: The corporate governance
preferences of institutional investors” University of Amsterdam Working paper, (2010).
McInish, T. and R. Wood. “An Analysis of Intraday Patterns in Bid/Ask Spreads for NYSE
Stocks.” Journal of Finance, 47 (1992), 753-64.
Mitton, T. “A cross-firm analysis of the impact of corporate governance on the East Asian
financial crisis.” Journal of Financial Economics, 64 (2002), 215–241.
37
Morck, R. B. Yeung, and W. Yu. “The information content of stock markets: Why do emerging
markets have synchronous price movements?” Journal of Financial Economics, 25
(2000), 215–260.
Pantzalis, C. and J. C. Park. “Equity Market Valuation of Human Capital and Stock Returns.”
Journal of Banking and Finance, 33 (2009), 1610-1623.
Parrino, R., R. Sias, and L. Starks. “Voting with their feet: Institutional ownership changes
around forced CEO turnover”, Journal of Financial Economics, 68 (2003), 3–46
Prendergast, C. “The Provision of Incentives in Firms.” Journal of Economic Literature, 37
(1999), 7-63.
Roll, R. “A simple implicit measure of the effective bid-ask spread in an efficient market.”
Journal of Finance, 39 (1984), 1127–1139.
Roll, R. “R2” Journal of Finance, 25 (1988), 541–566.
Shleifer, A. and R. Vishny. “A Survey of Corporate Governance.” Journal of Finance, 52
(1997), 737-82.
Stein, J. “Efficient Capital Market, Inefficient Firm: A Model of Myopic Corporate Behavior.”
Quarterly Journal of Economics, 104 (1989), 655-669.
Stoll, H. “Friction.” Journal of Finance, 55 (2000), 1479-1514.
Van Ness, B., R. Van Ness, and R. Warr. “How Well Do Adverse Selection Components
Measure Adverse Selection?” Financial Management, 30 (2001), 77-98.
White, H. “A Heteroskedasticity-Consistent Covariance Estimator and a Direct Test for
Heteroskedasticity.” Econometrica, 48 (1980), 817-838.
Wiersema, M. and K. Bantel. “Top Management Team Demography and Corporate Strategic
Change.” The Academy of Management Journal, 35(1992), 91-121.
Xu, M. “CEO contract horizon and investment.” INSEAD Working paper, (2011).
Yermack, D. “Shareholder Voting and Corporate Governance” Annual Review of Financial
Economics, 2 (2010), 103–25.

38
Table 1
Descriptive Statistics
We present summary statistics for the sample firms for the period from 1 January 2001 to 31
December 2007. CEO Age is the sample firm CEO‟s present age, Subordinate Manager Age is
the mean age of the top 4 subordinate managers, Relative Age Difference is the difference
between CEO Age and Subordinate Manager Age, Gov-Index is the governance index,
Institutional Ownership is the proportion of outstanding stocks held by institutions, Number of
Analysts is the mean number of analysts following a firm, Gibbs estimate is a measure of
effective cost calculated using Gibb‟s sampler, Percentage Spread is the percent quoted spread,
Turnover is average daily volume divided by total shares outstanding, Closing Price is the mean
daily stock price at the market close, Volatility is the standard deviation of daily returns, Dollar
Volume is the mean daily dollar trading volume, Total Assets is the book value of a firm‟s total
assets, Intangible Assets is the book value of total intangible assets, R&D Expenditure is a firm‟s
annual expenditure on research and development activities, Dividend Per Share is the dividend
per year, and Market Return is the daily return on S&P index.
Variable N Mean Standard
Deviation Minimum Maximum
Internal Monitoring
CEO Age 6539 54.63 6.42 32.00 92.00
Subordinate
Managers‟ Age 6539 50.63 4.62 29.33 81.00
Relative Age
Difference 6539 4.00 6.79 -25.00 39.25
Internal/ External Monitoring
Gov-Index 4579 12.49 2.86 3.00 21.00
External Monitoring
Institutional
Ownership 5547 0.68 0.19 0.00 1.00
Number of Analysts 6494 10.85 6.57 1.00 32.00
Liquidity Measures
Gibbs estimate (%) 5688 0.31 0.20 0.02 3.31
Percentage Spread
(%) 6539 0.36 0.56 0.02 6.78
Turnover (%) 6539 7.39 5.96 0.08 68.96
Control Variables
Closing Price 6539 37.54 22.92 5.04 463.95
Volatility (%) 6538 0.37 0.20 0.01 2.36

39
Dollar Volume
(billions) 6539 65.10 142 0.03 2,752
Total Assets
(millions) 6324 18,627 103,148 0.01 3,001,251
Intangible assets
(millions) 6021 2,166 7,890 0.00 169,054
R&D Expenditure
(millions) 5456 6.98 123.76 0.00 5,052
Dividend per share 6175 0.54 0.83 0.00 17.27
Market Return (%) 6539 -0.02 0.27 -1.54 2.05

40
Table 2
Liquidity and Corporate Governance
This table reports the OLS results of the following regression model:
Percentage Spreadi,torGibbs estimatei,t or Turnoveri,t= β0 + β1Level of Monitoringi,t + β2 Log(Closing Pricei,t) + β3 R&D Expenditurei,t
+ β4 Total Assetsi,t + β5 Log(Dollar Volumei,t) + β6 Volatilityi,t+ β7 Intangible Asseti,t+ β8 Dividend per sharei,t + β9MarketReturni,t + εi,t
where Percentage Spread is the percent quoted spread, Gibbs estimate is a measure of effective cost calculated using Gibb‟s sampler,
Turnover is average daily volume as a proportion of shares outstanding, Level of Monitoring is measured as internal governance
(relative age difference), internal/external governance (Gov-Index), and external governance (institutional ownership and analysts
following), Closing Price is the mean daily stock price at the close, R&D Expenditure is a firm‟s annual expenditure on research and
development activities, Total Assets is the book value of a firm‟s total assets, Dollar Volume is the mean daily dollar trading volume,
Volatility is the standard deviation of daily returns, Intangible Assets is the book value of total intangible assets, Dividend per share is
the dividend paid per share, Market Return is the daily return on S&P index, and εi,t is the error term. The subscripts i and t refers to
stock i and year t. White‟s corrected standard errors are reported in parentheses.
Variable Gibbs estimate Percentage Spread Turnover
Model l Model2 Model3 Model1 Model2 Model3 Model1 Model2 Model3
Relative Age
Difference
-0.063**
(0.032)
-0.061*
(0.032)
-0.063**
(0.031)
-0.138*
(-0.076)
-0.153**
(0.073)
-0.186***
(0.072)
0.020**
(0.009)
0.022***
(0.008)
0.024***
(0.008)
Gov-Index -3.378***
(0.951)
-25.62***
(1.983)
1.280***
(0.271)
Institutional
Ownership
-1.570
(1.371)
-0.873
(1.388)
-35.50***
(3.140)
-29.93***
(3.055)
8.056***
(0.387)
7.777***
(0.392)
Number of Analysts 0.213***
(0.044)
0.191***
(0.045)
1.181***
(0.098)
1.001***
(0.097)
-0.098***
(0.016)
-0.089***
(0.016)
Closing Price -2.141***
(0.485)
-1.653***
(0.491)
-1.912***
(0.488)
-7.348***
(1.146)
-3.571***
(1.118)
-5.484***
(1.107)
1.135***
(0.191)
0.651***
(0.180)
0.747***
(0.178)
R& D Expenditure 9.163
(6.272)
12.96**
(6.550)
14.53**
(6.730)
-36.06*
(21.74)
-8.981
(20.53)
3.702
(21.13)
9.216
(5.825)
5.366
(5.215)
4.732
(5.249)
Total Assets 0.065
(0.091)
0.062
(0.091)
0.064
(0.091)
0.097*
(0.054)
0.043
(0.034)
0.053*
(0.031)
-0.042**
(0.017)
-0.029**
(0.012)
-0.030**
(0.012)

41
Dollar Volume -1.810***
(0.200)
-2.540***
(0.280)
-2.281***
(0.294)
-4.805***
(0.422)
-8.400***
(0.579)
-6.525***
(0.594)
1.251***
(0.069)
1.457***
(0.086)
1.363***
(0.083)
Volatility 67.23***
(2.884)
68.70***
(2.974)
67.54***
(2.996)
110.0***
(6.193)
119.1***
(6.160)
110.6***
(6.004)
17.25***
(0.871)
16.35***
(0.816)
16.77***
(0.831)
Intangible assets 0.102
(0.670)
0.148
(0.690)
0.130
(0.689)
2.874***
(0.629)
2.140***
(0.607)
2.196***
(0.563)
-1.002***
(0.159)
-0.801***
(0.135)
-0.803***
(0.132)
Dividend per share -1.108***
(0.218)
-1.112***
(0.231)
-1.029***
(0.223)
0.797
(0.553)
0.403
(0.458)
0.960**
(0.473)
-0.156*
(0.089)
-0.031
(0.071)
-0.059
(0.071)
Market Return -3.531***
(1.262)
-2.944**
(1.239)
-2.806**
(1.236)
-45.60***
(2.484)
-42.22***
(2.455)
-41.23***
(2.430)
2.435***
(0.303)
1.917***
(0.284)
0.024***
(0.008)
Adjusted R2 0.420 0.426 0.428 0.403 0.452 0.477 0.326 0.407 0.411

42
Table 3
Internal governance for firms with older vs. younger CEOs
To investigate if the CEO horizon impacts the effect of internal governance on liquidity, we divide the sample firms into two
subsamples; firms with CEOs above the sample mean CEO age (55 years old) and firms with CEOs below the sample mean CEO age.
This table reports the OLS results of the following regression model:
Percentage Spreadi,tor Gibbs estimatei,t or Turnoveri,t= β0 + β1Level of Monitoringi,t + β2 Log(Closing Pricei,t) + β3 R&D Expenditurei,t
+ β4 Total Assetsi,t + β5 Log(Dollar Volumei,t) + β6 Volatilityi,t+ β7 Intangible Asseti,t+ β8 Dividend per sharei,t + β9 Market Returni,t + εi,t
where Percentage Spread is the percent quoted spread, Gibbs estimate is a measure of effective cost calculated using Gibb‟s sampler,
Turnover is average daily volume as a proportion of shares outstanding, Level of Monitoring is measured as internal governance
(relative age difference), internal/external governance (Gov-Index), and external governance (institutional ownership and analysts
following),Closing Price is the mean daily stock price at the close, R&D Expenditure is a firm‟s annual expenditure on research and
development activities, Total Assets is the book value of a firm‟s total assets, Dollar Volume is the mean daily dollar trading volume,
Volatility is the standard deviation of daily returns, Intangible Assets is the book value of total intangible assets, Dividend per share is
the dividend paid per share, Market Return is the daily return on S&P index, and εi,t is the error term. White‟s corrected standard errors
are reported in parentheses.
Panel A: Internal Governance for the sub-samples of firms divided based on CEO horizon
Variable N Mean Median Minimum Maximum SD
CEO above 55
CEO Age 2077 59.90 59.00 55.33 91.00 4.31
Subordinate Managers‟ Age 2077 51.71 51.67 36.00 81.00 4.47
Relative Age Difference 2050 7.91 7.33 -25.00 36.33 6.11
CEO under 55
CEO Age 2261 49.85 51.00 34.00 54.80 3.70
Subordinate Managers‟ Age 2261 49.75 49.67 33.00 76.00 4.39
Relative Age Difference 2228 -0.08 0.25 -22.00 16.00 5.52

43
Panel B.
Variable CEO above 55 CEO under 55
Gibbs estimate Percentage Spread Turnover Gibbs estimate Percentage
Spread Turnover
Relative Age Difference -0.192***
(0.054)
-0.306***
(0.118)
0.054***
(0.013)
-0.012
(0.116)
-0.134
(0.174)
-0.012
(0.024)
Gov-Index -6.360***
(1.416)
-23.98***
(2.770)
0.758**
(0.347)
0.253
(2.177)
-25.43***
(3.908)
1.625***
(0.607)
Institutional Ownership -0.656
(1.951)
-28.89***
(4.453)
8.017***
(0.498)
-3.362
(3.306)
-22.97***
(6.277)
5.741***
(0.956)
Number of Analysts 0.114*
(0.061)
0.733***
(0.142)
-0.080***
(0.021)
0.528***
(0.128)
1.429***
(0.210)
-0.105***
(0.029)
Closing Price -2.021***
(0.750)
-5.228***
(1.778)
0.853***
(0.247)
-1.990*
(0.946)
-2.238
(1.898)
0.741**
(0.310)
R&D Expenditure 13.35
(9.843)
9.639
(28.95)
0.026
(7.286)
22.64
(22.48)
-23.10
(66.50)
-1.258
(22.69)
Total Assets 0.077
(0.102)
0.023
(0.028)
-0.020**
(0.009)
-0.285*
(0.170)
0.595
(0.671)
-0.155*
(0.0847)
Dollar Volume -1.609***
(0.389)
-4.947***
(0.926)
1.373***
(0.117)
-3.999***
(0.893)
-9.920***
(1.229)
1.277***
(0.176)
Volatility 67.47***
(4.415)
117.7***
(9.426)
18.29***
(1.149)
77.02***
(7.313)
121.7***
(11.19)
13.27***
(1.576)
Intangible assets -0.634
(0.999)
1.629***
(0.597)
-0.606***
(0.138)
3.354**
(1.672)
4.530
(3.252)
-1.991***
(0.772)
Dividend per share -0.771***
(0.263)
0.663
(0.639)
-0.094
(0.105)
-1.136***
(0.380)
1.014
(1.020)
-0.148
(0.148)
Market Return -1.353
(1.865)
-37.99***
(3.421)
1.914***
(0.399)
-2.562
(2.971)
-36.55***
(5.476)
1.757***
(0.620)
Adjusted R2 0.410 0.463 0.450 0.435 0.510 0.380
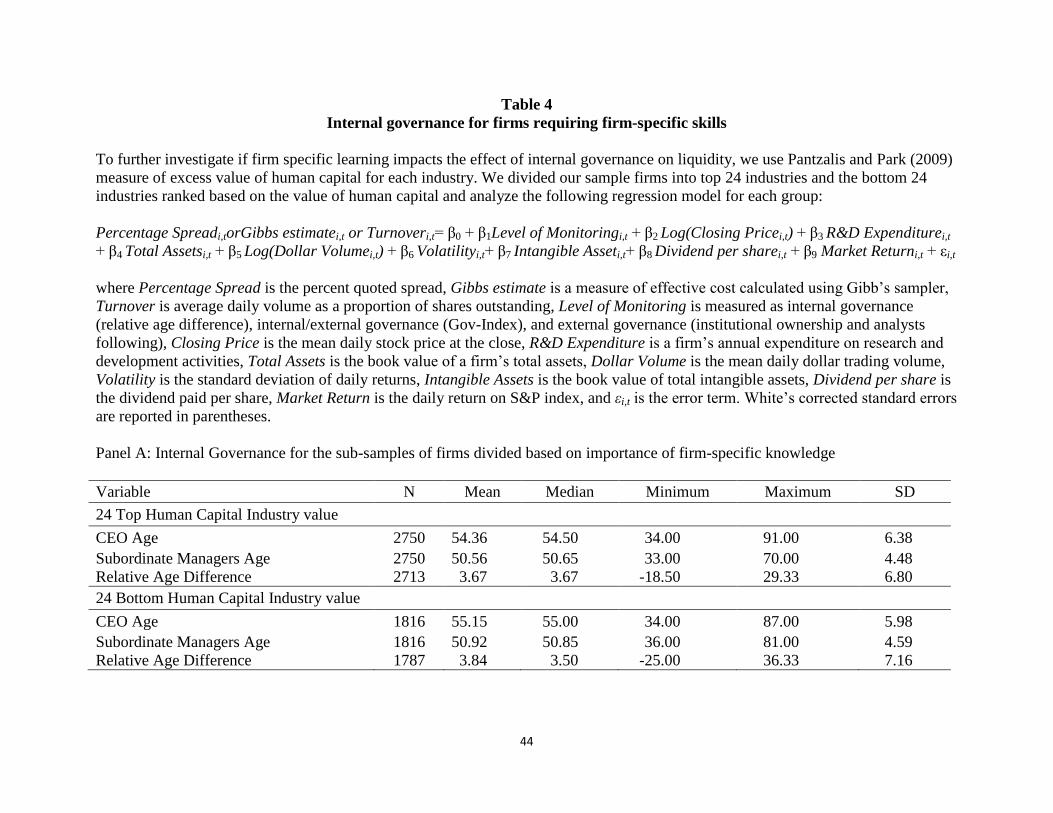
44
Table 4
Internal governance for firms requiring firm-specific skills
To further investigate if firm specific learning impacts the effect of internal governance on liquidity, we use Pantzalis and Park (2009)
measure of excess value of human capital for each industry. We divided our sample firms into top 24 industries and the bottom 24
industries ranked based on the value of human capital and analyze the following regression model for each group:
Percentage Spreadi,torGibbs estimatei,t or Turnoveri,t= β0 + β1Level of Monitoringi,t + β2 Log(Closing Pricei,t) + β3 R&D Expenditurei,t
+ β4 Total Assetsi,t + β5 Log(Dollar Volumei,t) + β6 Volatilityi,t+ β7 Intangible Asseti,t+ β8 Dividend per sharei,t + β9 Market Returni,t + εi,t
where Percentage Spread is the percent quoted spread, Gibbs estimate is a measure of effective cost calculated using Gibb‟s sampler,
Turnover is average daily volume as a proportion of shares outstanding, Level of Monitoring is measured as internal governance
(relative age difference), internal/external governance (Gov-Index), and external governance (institutional ownership and analysts
following), Closing Price is the mean daily stock price at the close, R&D Expenditure is a firm‟s annual expenditure on research and
development activities, Total Assets is the book value of a firm‟s total assets, Dollar Volume is the mean daily dollar trading volume,
Volatility is the standard deviation of daily returns, Intangible Assets is the book value of total intangible assets, Dividend per share is
the dividend paid per share, Market Return is the daily return on S&P index, and εi,t is the error term. White‟s corrected standard errors
are reported in parentheses.
Panel A: Internal Governance for the sub-samples of firms divided based on importance of firm-specific knowledge
Variable N Mean Median Minimum Maximum SD
24 Top Human Capital Industry value
CEO Age 2750 54.36 54.50 34.00 91.00 6.38
Subordinate Managers Age 2750 50.56 50.65 33.00 70.00 4.48
Relative Age Difference 2713 3.67 3.67 -18.50 29.33 6.80
24 Bottom Human Capital Industry value
CEO Age 1816 55.15 55.00 34.00 87.00 5.98
Subordinate Managers Age 1816 50.92 50.85 36.00 81.00 4.59
Relative Age Difference 1787 3.84 3.50 -25.00 36.33 7.16

45
Panel B.
Variable Top 24 Industries Bottom 24 Industries
Gibbs estimate Percent Spread Turnover Gibbs estimate Percent Spread Turnover
Relative Age Difference -0.072*
(0.044)
-0.238***
(0.088)
0.031***
(0.010)
-0.050
(0.044)
-0.164
(0.116)
0.016
(0.013)
Gov-Index -2.196*
(1.319)
-26.79***
(2.771)
1.026***
(0.377)
-4.634***
(1.403)
-24.45***
(2.864)
1.684***
(0.390)
Institutional Ownership -0.657
(1.934)
-24.85***
(3.886)
7.115***
(0.499)
-1.024
(2.010)
-35.01***
(4.857)
7.870***
(0.600)
Number of Analysts 0.227***
(0.063)
0.849***
(0.123)
-0.091***
(0.020)
0.161**
(0.065)
1.291***
(0.153)
-0.100***
(0.027)
Closing Price -1.280**
(0.631)
-3.837***
(1.338)
0.576***
(0.243)
-2.624***
(0.773)
-7.940***
(1.906)
0.858***
(0.256)
R&D Expenditure 12.23
(9.793)
-6.285
(20.95)
5.095
(5.379)
473.9*
(259.5)
-1646**
(694.2)
391.3***
(50.23)
Total Assets 0.070
(0.101)
0.064**
(0.033)
-0.027***
(0.011)
-0.038
(0.110)
-0.029
(0.259)
-0.240***
(0.081)
Dollar Volume -2.524***
(0.457)
-6.1417***
(0.763)
1.368***
(0.111)
-2.085***
(0.397)
-7.033***
(0.970)
1.547***
(0.130)
Volatility 71.35***
(4.157)
111.3***
(7.720)
14.54***
(1.044)
62.16***
(4.288)
111.0
(9.605)
20.21***
(1.216)
Intangible assets 0.231
(1.046)
1.923***
(0.597)
-0.762***
(0.147)
0.199
(0.388)
4.121***
(1.060)
-0.688**
(0.304)
Dividend per share -1.219***
(0.275)
1.294*
(0.693)
-0.038
(0.084)
-0.645*
(0.346)
0.529
(0.552)
-0.113
(0.124)
Market Return -3.813**
(1.738)
-40.13***
(3.329)
1.139***
(0.385)
-1.759
(1.752)
-42.42***
(3.548)
2.846***
(0.407)
Adjusted R2 0.440 0.476 0.369 0.409 0.483 0.479

46
Table 5
Internal governance for firms with experienced Subordinate Managers
To test the impact of experience of subordinate managers‟ in each firm, relative to their peers in the same industry, on liquidity, we
divide our sample firms into two sub-samples based on Antia, Pantzalis and Park (2010) measure of expected decision horizon as
summarized in equation (3). This table reports the OLS results of the following regression model for each of the sub-sample:
Percentage Spreadi,torGibbs estimatei,t or Turnoveri,t= β0 + β1Level of Monitoringi,t + β2 Log(Closing Pricei,t) + β3 R&D Expenditurei,t
+ β4 Total Assetsi,t + β5 Log(Dollar Volumei,t) + β6 Volatilityi,t+ β7 Intangible Asseti,t+ β8 Dividend per sharei,t + β9 Market Returni,t + εi,t
where Percentage Spread is the percent quoted spread, Gibbs estimate is a measure of effective cost calculated using Gibb‟s sampler,
Turnover is average daily volume as a proportion of shares outstanding, Level of Monitoring is measured as internal governance
(relative age difference), internal/external governance (Gov-Index), and external governance (institutional ownership and analysts
following),Closing Price is the mean daily stock price at the close, R&D Expenditure is a firm‟s annual expenditure on research and
development activities, Total Assets is the book value of a firm‟s total assets, Dollar Volume is the mean daily dollar trading volume,
Volatility is the standard deviation of daily returns, Intangible Assets is the book value of total intangible assets, Dividend per share is
the dividend paid per share, Market Return is the daily return on S&P index, and εi,t is the error term. White‟s corrected standard errors
are reported in parentheses.
Panel A: Internal Governance for the sub-samples of firms divided based on Subordinate Managers level of Experience
Variable N Mean Median Minimum Maximum SD
Experienced Subordinates Managers
CEO Age 503 54.64 54.00 39.00 91.00 6.69
Subordinate Managers Age 503 51.71 51.50 39.00 79.00 5.40
Relative Age Difference 500 2.55 2.83 -25.00 23.67 7.70
Inexperienced Subordinates Managers
CEO Age 532 54.28 54.50 38.00 78.00 6.38
Subordinate Managers Age 532 49.87 49.71 39.33 81.00 4.28
Relative Age Difference 526 4.19 4.21 -25.00 27.67 7.04

47
Panel B.
Variable Experienced Subordinate Managers Inexperienced Sub Managers
Gibbs estimate Percent Spread Turnover Gibbs estimate Percent Spread Turnover
Relative Age Difference -0.102
(0.087)
-0.847***
(0.237)
0.076***
(0.016)
-0.091
(0.099)
-0.277
(0.181)
0.008
(0.023)
Gov-Index 0.032
(3.122)
-20.131***
(6.453)
0.719
(0.754)
-7.318**
(3.467)
-13.950**
(6.079)
0.007
(0.824)
Institutional Ownership 7.267*
(4.392)
-42.087***
(9.506)
11.363***
(1.053)
-1.903
(4.991)
-44.557***
(9.292)
8.564***
(1.105)
Number of Analysts 0.327**
(0.137)
1.785***
(0.373)
-0.109***
(0.041)
0.449***
(0.145)
1.241***
(0.290)
-0.131***
(0.039)
Closing Price -0.866
(1.911)
6.218
(4.102)
-0.633
(0.449)
-2.142
(1.522)
-6.717**
(3.327)
1.179***
(0.431)
R& D Expenditure 15.925*
(8.782)
28.271
(25.171)
-8.284**
(3.548)
81.935
(51.450)
27.423
(104.357)
-31.971*
(16.582)
Total Assets -0.055
(0.088)
0.090
(0.258)
-0.144***
(0.031)
-0.322
(0.649)
1.000
(0.715)
-0.514***
(0.158)
Dollar Volume -3.755***
(1.035)
-12.992***
(2.036)
1.835***
(0.212)
-3.538***
(0.988)
-9.326***
(1.851)
1.952***
(0.221)
Volatility 80.018***
(11.673)
142.265***
(19.222)
14.943***
(2.020)
63.338***
(8.363)
117.271***
(18.448)
13.98***
(2.203)
Intangible assets 1.728*
(0.938)
6.395***
(2.194)
-1.674***
(0.304)
6.218*
(3.734)
4.538
(3.952)
-3.879***
(0.891)
Dividend per share 0.291
(1.268)
-0.739
(2.213)
0.437
(0.318)
-0.593
(0.487)
-0.509
(1.118)
0.284***
(0.086)
Market Return -6.220
(3.963)
-39.319***
(7.177)
2.433***
(0.653)
0.103
(3.446)
-40.156***
(6.860)
1.307
(0.829)
Adjusted R2 0.452 0.499 0.523 0.402 0.550 0.485

48
Table 6
Alternative internal governance measure: Industry adjusted age difference
To control for variation in the level of internal governance due to the inherent differences across
industries, we adjust our measure of internal governance as follows:
Industry adjusted Age Differencei,t = Age Differencei,t – Age Differenceind,t, where, Age Differencei,t
is the difference between CEO‟s age and top 4 subordinate managers‟ ages for firm i and year t, Age
Differenceind,t is the Age Difference for the industryi and year t. Then we use the industry adjusted
internal governance measure and analyze the following regression model:
Percentage Spreadi,torGibbs estimatei,t or Turnoveri,t= β0 + β1Level of Monitoringi,t + β2 Log(Closing
Pricei,t) + β3 R&D Expenditurei,t + β4 Total Assetsi,t + β5 Log(Dollar Volumei,t) + β6 Volatilityi,t+ β7
Intangible Asseti,t+ β8 Dividend per sharei,t + β9 Market Returni,t + εi,t
where Percentage Spread is the percent quoted spread, Gibbs estimate is a measure of effective cost
calculated using Gibb‟s sampler, Turnover is average daily volume as a proportion of shares
outstanding, Level of Monitoring is measured as internal governance (relative age difference),
internal/external governance (Gov-Index), and external governance (institutional ownership and
analysts following), Closing Price is the mean daily stock price at the close, R&D Expenditure is a
firm‟s annual expenditure on research and development activities, Total Assets is the book value of a
firm‟s total assets, Dollar Volume is the mean daily dollar trading volume, Volatility is the standard
deviation of daily returns, Intangible Assets is the book value of total intangible assets, Dividend per
share is the dividend paid per share, Market Return is the daily return on S&P index, and εi,t is the
error term. White‟s corrected standard errors are reported in parentheses.
Gibbs estimate Percent Spread Turnover
Industry Adjusted Age
Difference
-0.058*
(0.032)
-0.177**
(0.073)
0.016*
(0.008)
Gov-Index -3.368***
(0.952)
-25.575***
(1.983)
1.267***
(0.272)
Institutional Ownership -0.876
(1.389)
-29.961***
(3.054)
7.781***
(0.392)
Number of Analysts 0.189***
(0.045)
1.003***
(0.096)
-0.088***
(0.016)
Closing Price -1.914***
(0.489)
-5.480***
(1.108)
0.751***
(0.178)
R&D Expenditure 14.436**
(6.738)
3.162
(21.257)
4.793
(5.280)
Total Assets 0.063
(0.091)
0.052*
(0.031)
-0.029**
(0.012)
Dollar Volume -2.272***
(0.294)
-6.500***
(0.592)
1.357***
(0.083)
Volatility 67.412***
(2.983)
110.201***
(5.990)
16.830***
(0.830)
Intangible assets 0.142
(0.691)
2.213***
(0.567)
-0.805***
(0.132)
Dividend per share -1.026***
(0.223)
0.964**
(0.474)
-0.061
(0.071)
Market Return -2.834**
(1.237)
-41.297***
(2.431)
1.881***
(0.284)
Adjusted R2 0.428 0.477 0.410

49
Table 7
Positive vs. Negative Industry-Adjusted Age Difference
To further investigate if industry-adjusted internal governance measure affects liquidity, we divide our sample firms into groups with
positive and negative industry adjusted age differences and analyze the following regression model for each sub-sample:
Percentage Spreadi,torGibbs estimatei,t or Turnoveri,t= β0 + β1Level of Monitoringi,t + β2 Log(Closing Pricei,t) + β3 R&D Expenditurei,t
+ β4 Total Assetsi,t + β5 Log(Dollar Volumei,t) + β6 Volatilityi,t+ β7 Intangible Asseti,t+ β8 Dividend per sharei,t + β9 Market Returni,t + εi,t
where Percentage Spread is the percent quoted spread, Gibbs estimate is a measure of effective cost calculated using Gibb‟s sampler,
Turnover is average daily volume per share outstanding, Turnover is average daily volume as a proportion of shares outstanding, Level
of Monitoring is measured as internal governance (relative age difference), internal/external governance (Gov-Index), and external
governance (institutional ownership and analysts following), Closing Price is the mean daily stock price at the close, R&D
Expenditure is a firm‟s annual expenditure on research and development activities, Total Assets is the book value of a firm‟s total
assets, Dollar Volume is the mean daily dollar trading volume, Volatility is the standard deviation of daily returns, Intangible Assets is
the book value of total intangible assets, Dividend per share is the dividend paid per share, Market Return is the daily return on S&P
index, and εi,t is the error term. White‟s corrected standard errors are reported in parentheses.
Panel A: Internal Governance for the sub-samples of firms divided based on level of industry adjusted internal governance
Variable N Mean Median Minimum Maximum SD
Positive Industry adjusted measure (Firm-Industry)
CEO Age 2239 58.01 57.50 40.00 91.00 5.59
Sub Managers‟ Age 2239 49.23 49.25 33.00 65.50 4.15
Relative Age Difference 2239 8.99 8.00 -3.50 36.33 4.77
Industry adjusted Age Difference 2239 5.25 4.20 0.00 31.97 4.42
Negative industry adjusted measure (Firm-Industry)
CEO Age 2229 51.38 51.50 34.00 68.50 5.01
Sub Managers‟ Age 2229 52.07 52.00 39.33 70.00 4.20
Relative Age Difference 2229 -1.35 -0.50 -15.50 13.33 4.19
Industry adjusted Age Difference 2229 -5.11 -4.18 -17.90 0.00 3.95
Panel B.
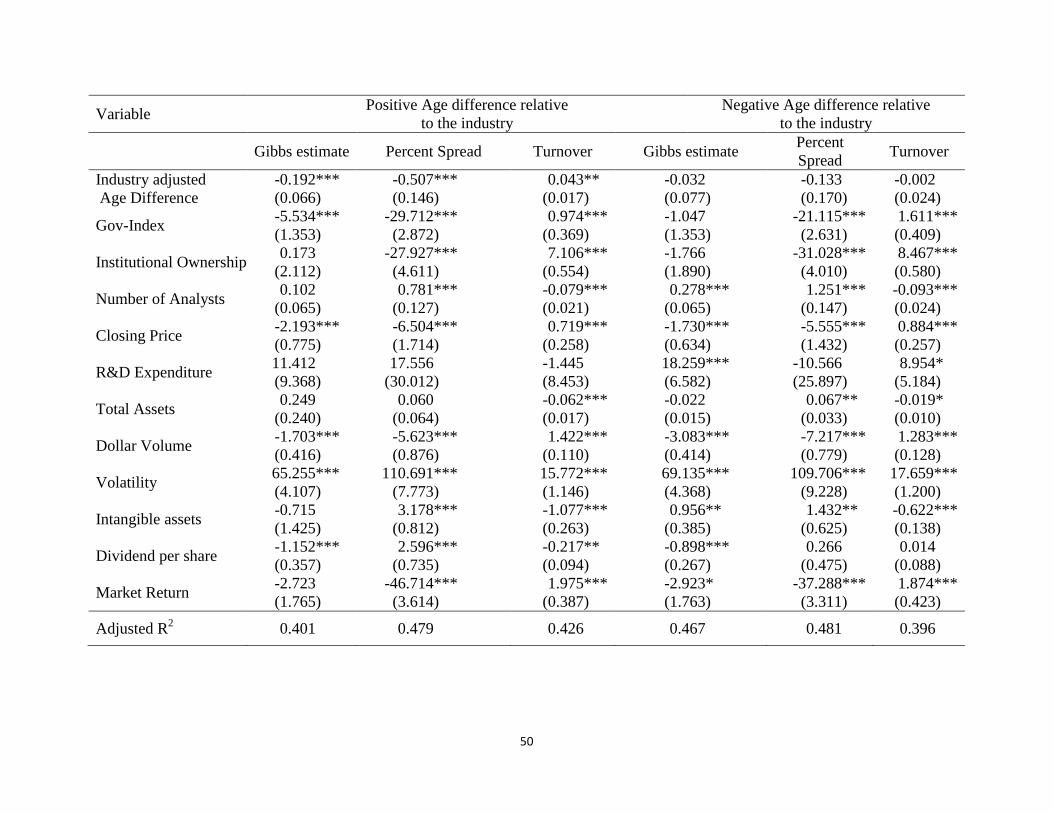
50
Variable Positive Age difference relative
to the industry
Negative Age difference relative
to the industry
Gibbs estimate Percent Spread Turnover Gibbs estimate Percent
Spread Turnover
Industry adjusted
Age Difference
-0.192***
(0.066)
-0.507***
(0.146)
0.043**
(0.017)
-0.032
(0.077)
-0.133
(0.170)
-0.002
(0.024)
Gov-Index -5.534***
(1.353)
-29.712***
(2.872)
0.974***
(0.369)
-1.047
(1.353)
-21.115***
(2.631)
1.611***
(0.409)
Institutional Ownership 0.173
(2.112)
-27.927***
(4.611)
7.106***
(0.554)
-1.766
(1.890)
-31.028***
(4.010)
8.467***
(0.580)
Number of Analysts 0.102
(0.065)
0.781***
(0.127)
-0.079***
(0.021)
0.278***
(0.065)
1.251***
(0.147)
-0.093***
(0.024)
Closing Price -2.193***
(0.775)
-6.504***
(1.714)
0.719***
(0.258)
-1.730***
(0.634)
-5.555***
(1.432)
0.884***
(0.257)
R&D Expenditure 11.412
(9.368)
17.556
(30.012)
-1.445
(8.453)
18.259***
(6.582)
-10.566
(25.897)
8.954*
(5.184)
Total Assets 0.249
(0.240)
0.060
(0.064)
-0.062***
(0.017)
-0.022
(0.015)
0.067**
(0.033)
-0.019*
(0.010)
Dollar Volume -1.703***
(0.416)
-5.623***
(0.876)
1.422***
(0.110)
-3.083***
(0.414)
-7.217***
(0.779)
1.283***
(0.128)
Volatility 65.255***
(4.107)
110.691***
(7.773)
15.772***
(1.146)
69.135***
(4.368)
109.706***
(9.228)
17.659***
(1.200)
Intangible assets -0.715
(1.425)
3.178***
(0.812)
-1.077***
(0.263)
0.956**
(0.385)
1.432**
(0.625)
-0.622***
(0.138)
Dividend per share -1.152***
(0.357)
2.596***
(0.735)
-0.217**
(0.094)
-0.898***
(0.267)
0.266
(0.475)
0.014
(0.088)
Market Return -2.723
(1.765)
-46.714***
(3.614)
1.975***
(0.387)
-2.923*
(1.763)
-37.288***
(3.311)
1.874***
(0.423)
Adjusted R2 0.401 0.479 0.426 0.467 0.481 0.396

51
Table 8
Internal Governance and Information Content
To assess the extent to which internal governance is associated with the information contents of
prices, we analyze the following regression model:
IVOL= α0 + β1Internal Monitoringi,t + β2 Log(Closing Pricei,t) + β3 R&D Expenditurei,t + β4 Total
Assetsi,t + β5 Log(Dollar Volumei,t) + β6 Intangible Asseti,t+ β7 Dividend per sharei,t + β8 Market
Returni,t + εi,t
where IVOL represents the idiosyncratic volatility of stock i during period t. IVOL in model 1 use
S&P 500 return as the sole market factor. While the second model use Fama and French
(1993) three-factor model. Internal Monitoring (relative age difference), Closing Price is the mean
daily stock price at the close, R&D Expenditure is a firm‟s annual expenditure on research and
development activities, Total Assets is the book value of a firm‟s total assets, Dollar Volume is the
mean daily dollar trading volume, Volatility is the standard deviation of daily returns, Intangible
Assets is the book value of total intangible assets, Dividend per share is the dividend paid per share,
Market Return is the daily return on S&P index, and εi,t is the error term. White‟s corrected standard
errors are reported in parentheses.
Model 1 Model2
Age Difference 0.048***
(0.166)
0.050***
(0.167)
Closing Price -0.404***
(3.080)
-0.400***
(3.100)
R&D Expenditure -0.003
(0.004)
-0.001
(0.004)
Total Assets -0.017
(0.000)
-0.017
(0.000)
Dollar Volume 0.093***
(0.959)
0.064***
(0.971)
Intangible assets -0.128***
(0.000)
-0.135***
(0.000)
Dividend per share -0.198***
(2.784)
-0.194***
(2.841)
Market Return -0.209***
(5.228)
-0.202***
(5.241)
Adjusted R2 0.280 0.288

52
Table 9
Fixed Effects
To control for the effects of differences across industries on the liquidity and level of monitoring,
we analyze the following regression model:
Liquidityi,t= α0 + β1Level of Monitoringi,t + β2 Log(Closing Pricei,t) + β3 R&D Expenditurei,t + β4
Total Assetsi,t + β5 Log(Dollar Volumei,t) + β6 Volatilityi,t+ β7 Intangible Asseti,t+ β8 Dividend per
sharei,t + β9 Market Returni,t+ +εi,t
where Liquidity is measured in terms of Percentage Spread, which is the percent quoted spread,
Gibbs estimate, which is a measure of effective cost calculated using Gibb‟s sampler, and
Turnover is average daily volume as a proportion of shares outstanding, Level of Monitoring is
measured as internal governance (relative age difference), internal/external governance (Gov-
Index), and external governance (institutional ownership and analysts following),R&D
Expenditure is a firm‟s annual expenditure on research and development activities, Total Assets
is the book value of a firm‟s total assets, Dollar Volume is the mean daily dollar trading volume,
Volatility is the standard deviation of daily returns, Intangible Assets is the book value of total
intangible assets, Dividend per share is the dividend paid per share, Market Return is the daily
return on S&P index, Industry is a dummy variable that takes value 1 if the firm i belongs to
industry i, and εi,t is the error term. White‟s corrected standard errors are reported in parentheses.
Variable GibbsC-estimate Percentage Spread Turnover
Relative Age Difference -0.063**
(0.030)
-0.174***
(0.061)
0.016**
(0.008)
Gov-Index -2.900***
(0.943)
-26.94***
(1.906)
1.417***
(0.253)
Institutional Ownership -0.327
(1.452)
-26.25***
(2.913)
7.527***
(0.387)
Number of Analysts 0.231***
(0.053)
1.129***
(0.106)
-0.110***
(0.014)
Closing Price -1.851***
(0.526)
-4.729***
(1.059)
0.623***
(0.141)
R&D Expenditure 6.612
(16.95)
-3.446
(35.65)
-0.368***
(4.739)
Total Assets 0.103***
(0.034)
0.052
(0.068)
-0.025***
(0.009)
Dollar Volume -2.632***
(0.273)
-6.926***
(0.543)
1.377***
(0.072)
Volatility 66.09***
(2.183)
122.2***
(4.367)
14.70***
(0.581)
Intangible assets 0.298
(0.497)
2.333***
(0.786)
-0.619***
(0.104)
Dividend per share -0.740**
(0.304)
0.541
(0.578)
-0.150**
(0.077)
Market Return -2.589**
(1.067)
-39.83***
(2.155)
1.643***
(0.287)
Industry Fixed Effect Yes Yes Yes

53
Appendix A
Variable Description and source
Variable Description Source
CEO Age Mean CEO age for each firm each year EXECUCOMP
Subordinate Manager
Age
Mean age for top 4 managers for each firm
each year
EXECUCOMP
Relative Age
Difference
Difference between the mean CEO age and
mean subordinate manager age
EXECUCOMP
Gov-Index
Chung, Elder and Kim (2010) Governance
Index
Institutional
Shareholders
Services (ISS)
Institutional
Ownership (%)
Proportions of stocks held by institutions Spectrum CDA
Number of Analysts Number of analysts following a firm I/B/E/S
Gibbs estimate (%) Hasbrouck‟s Gibbs estimate using Gibbs
Sampler
Hasbrouck‟s website
Percent Spread Quoted spread as a proportion of quote
midpoint
CRSP
Turnover Ratio Dollar volume per share outstanding CRSP
S and P index return
(%)
Daily return on S and P 500 index CRSP
Closing Price Daily closing price for a stock CRSP
R& D
Expenditure(Millions)
Annual firm expense on research and
development activity
COMPUSTAT
Dollar Volume
(billions)
Daily dollar volume CRSP
Total Assets
(millions)
Firm‟s total assets COMPUSTAT
Volatility (%) Standard deviation of returns CRSP
Intangible assets
(mill)
Total intangible assets COMPUSTAT
Dividend per share Dollar dividend paid per share outstanding COMPUSTAT