powerful owl project in southeast queensland progress report
TRANSCRIPT

Powerful Owl Project in southeast Queensland
Progress Report
October 2020

Powerful Owl Project in southeast Queensland
Progress Report
Rob Clemens, Larry Chen, Callan Alexander, Susan Fuller
October 2020
Citation
This publication should be cited as follows:
Clemens, R., and Chen, L., Alexander, C., Fuller, S. (2020) Powerful Owl Project in southeast
Queensland, Progress Report. Unpublished report. BirdLife Southern Queensland, Brisbane.
Copyright © BirdLife Australia
This document is subject to copyright and may only be used for the purposes for which it was
commissioned. The use or copying of this document in whole or part without the permission of
BirdLife Australia is an infringement of copyright.
Disclaimer
Although BirdLife Australia has taken all the necessary steps to ensure that an accurate document has
been prepared, the organisation accepts no liability for any damages or loss incurred as a result of
reliance placed upon the report and its content.
Cover image: Powerful Owl Ninox Strenua, by Amanda Robertson.

3
Table of Contents
Acknowledgements ........................................................................................................................................................ 5
Executive Summary ........................................................................................................................................................ 6
Introduction .................................................................................................................................................................... 9
Objectives ..................................................................................................................................................................... 11
Powerful Owl distribution in southeast Queensland ................................................................................................. 12
Powerful Owl observations .............................................................................................................................. 12
Figure 1. Map of Powerful Owl records in southeast Queensland at 25 km2 resolution................................... 14
Other Nocturnal bird locations in southeast Queensland in BirdData database ............................................. 14
Engagement.................................................................................................................................................................. 16
Number of people involved .............................................................................................................................. 17
Volunteer engagement and feedback .............................................................................................................. 20
.......................................................................................................................................................................... 20
Rat Poison Campaign ........................................................................................................................................ 23
Media attention .................................................................................................................................................. 24
Stakeholder Engagement ................................................................................................................................. 25
Acoustic Monitoring ..................................................................................................................................................... 26
QUT Acoustic Monitoring ................................................................................................................................. 26
Current Progress: ................................................................................................................................................ 26
Additional deployments ................................................................................................................................... 27
Impact of summer 2019/20 bushfires on forest owl habitat .................................................................................... 29
Methods .............................................................................................................................................................. 29
Results ................................................................................................................................................................. 31
Two research papers submitted to Sunbird in 2020 .................................................................................................. 33
Review of conservation status of three forest owls ................................................................................................... 35
Powerful Owl Ninox Strenua ............................................................................................................................ 37
Overview .............................................................................................................................................................. 37
Infraspecific taxa ................................................................................................................................................. 37
Range .................................................................................................................................................................. 37
Abundance .......................................................................................................................................................... 37
Ecology................................................................................................................................................................. 38
Monitoring ........................................................................................................................................................... 39
Threats ................................................................................................................................................................. 39
Australian Greater Sooty Owl Tyto tenebricosa tenebricosa ........................................................................... 41
Overview .............................................................................................................................................................. 41
Infraspecific taxa ................................................................................................................................................. 41
4
Range ................................................................................................................................................................... 41
Abundance .......................................................................................................................................................... 41
Ecology................................................................................................................................................................. 42
Monitoring ........................................................................................................................................................... 42
Threats ................................................................................................................................................................. 42
Southern Masked Owl Tyto novaehollandiae novaehollandiae ....................................................................... 44
Overview .............................................................................................................................................................. 44
Infraspecific taxa ................................................................................................................................................. 44
Range ................................................................................................................................................................... 44
Abundance .......................................................................................................................................................... 44
Ecology................................................................................................................................................................. 45
Monitoring ........................................................................................................................................................... 45
Threats ................................................................................................................................................................. 45
Comparisons of forest plots near Powerful Owl breeding and random locations ................................................... 47
Methods .............................................................................................................................................................. 47
Results ................................................................................................................................................................. 48
Literature Cited ............................................................................................................................................................ 50
Appendix A. Powerful Owl Project Volunteer Survey Results 2020 ................................................................. 57
5
Acknowledgements
We would like to thank the over 500 volunteers who have signed up to the project, and
special thanks to Jasmine Zeleny and Matt Wright. This pair of seasoned owl experts
have helped deliver workshops, and have been a huge help in the field, providing a large
amount of data on owl distributions.
This year we would like to thank Laura Ferris and Darcy Brady who helped tremendously in
the field this year, and worked on the project as student placements from the University of
Queensland.
We would like to thank QUT for their partnership and support on the Queensland
Government grant.
We would like to thank all those who have helped with the project, and would especially like
to thank the following people for their contributions: Alicia Allan, Claire Anderson, Robert
Auld, John Baldry, Ed Blackwood, Julie Cahill, Rodney Appleby, Anthony Baker, Tyde Bands,
Josh Bowell, Nick Bradsworth, Nick Bricknell, Leah Burns, Brett Coleman, Jennifer Davis, Alexis
Dawson, Stephen Debus, Lesley Eagles, Andrew Evans, Leonard Fitzpatrick, Jane Frost,
Benjamin Green, Bob Hambling, Danielle Hanmer, Roger Jaensch, Kevin Jensen, Rod
Kavanagh, Heather Kay, Bianca Keys, Satoko Kuroda, Russ Lamb, Llynlly Langdon, Kerrie Lock,
Michael Mathieson, Warrick McCorkell, Keith McCosh, David McKitrick, Ross Monks, Lyn
Monteath, Greg Neill, Tida Nou, Hemal Patel, Bruce Penman, Michelle Phung, Amanda
Robertson, Lyn Robinson, Marion Roper, Tim Shields, Geoffrey Smith, Oliver Spohr, Adam
Taylor, Judith Vink, Brenden Ward, Dominic Ward, Jonathon Westacott, Michael Willis, John
Wilmott, and Christine Zupanc.
The Powerful Owl Project is operating in partnership with Birds Queensland, and is proudly
supported by the Queensland Government, including through the Queensland Citizen Science
Grants. The project has previously been supported by the Logan City Council, the Sunshine
Coast Council’s Environment Levy, The Wettenhall Environment Trust, Redland City Council,
Brisbane City Council and the Australian Environment Foundation.

6
Executive Summary
When this project started in 2018 the
number of breeding Powerful Owl pairs was
suspected to be around 30 to 50 pairs.
Collation of available data, collection of new
data and modelling now provides certainty
that there are least 70 pairs in the region,
and there is strong evidence to indicate
there are 186 pairs. If we assume that most
records of single owls in remote areas also
likely include a pair, and account for some of
the high densities of owls in some areas
(breeding only 1km apart), we are fairly sure
there are at least 300 pairs. Then using species distribution modelling to predict into the
many areas where there are no data, we get an estimate of 950 pairs in the region. While we
need to confirm that Powerful Owls are found in remote and sometimes higher elevation
areas as predicted by modelling, in three years we have shown that the Powerful Owl
population is six to nearly 20 times higher than suspected initially.
Successful breeding has now been recorded at 46 locations, and 31 breeding hollows have
been detected within 25 territories. A review of breeding success indicates that in the
Brisbane area and the Sydney area breeding success hovers around one fledged chick
produced per breeding attempt. In 2020, that fledging success rate dropped to 0.8 which
could become a concern if repeated in future years. Mortality rates remain unassessed aside
from a handful of reports of vehicle strike or electrocution, but work in New South Wales
indicates mortality rates could be high enough in Australian urban environments to inhibit
population viability in those areas.
These growing understandings would not have been possible without the 548 people
currently formally signed up to conduct field surveys, and the many others who contribute
assistance and data. In 2020 597 sightings were reported during 985 surveys. This marks
another big increase in survey effort. In 2018, 200 Powerful Owl sightings were recorded
from 444 surveys, and in 2019 347 sightings were recorded in 655 surveys. Throughout
Queensland 1,883 sightings have now been collated from 2,223 surveys into Birdata.
Eleven Powerful Owl workshops or presentations were held this year, and workshop content
was also uploaded to YouTube. The project mailing list includes 787 people, 857 people are
signed up to the Brisbane Powerful owl Facebook group, and over 2000 people have
Photo: Powerful Owl chick; Amanda Robertson
7
attended various talks. On-line media has reached tens of thousands of people, and broader
media coverage of the project has reached over 1 million people.
Together with QUT, the project has amassed in excess of 10 terabytes of acoustic data. QUT
deployed 16 sensors in active territories to measure detection probabilities and to capture
enough Powerful Owl vocalizations to train automated recognizers. They are also going to
deploy 20 sensors over summer to characterize summer calling, and determine how
detection rates change after the breeding season. Another 44 sensors were deployed in
areas Powerful Owl are known to occur. Data will be analyzed in the coming year, and a
larger deployment is planned for March and April of 2021 with the primary aim of testing and
refining species distribution models. We are optimistic that acoustic monitoring will
transform our ability to detect cryptic species like the Powerful Owl.
While the project has uncovered a lot of good news about Powerful Owl, with a larger
population and reasonable breeding success, the summer bushfires had catastrophic impacts
on many of the forests of eastern Australia. We developed some species distribution models
and overlayed them with fire mapping to discover over 1/3 of three forest owl’s habitat was
impacted by these fires. This prompted a review of the conservation status of these three
owls to determine if the evidence was sufficient for IUCN listing. Unfortunately, data on owl
populations in most of their remote range were not sufficient to demonstrate thresholds for
listing had been clearly met. The review, however, provides an excellent foundation for
future investigations.
Analyses revealed that breeding areas had significantly more forest cover, higher rainfall, and
were at lower elevations than random areas less than 20km away. Breeding plots had a
median of 59% of the plot covered in forest or 187 ha of forest in a 314-ha plot. Random
plots had a median of 21% of the plot covered in forest. While breeding was indicated in
areas with as little as 50ha of forest, those areas also had low density housing with many
trees and / or wide forest corridors to other patches of forest.
We were fortunate in attracting three University of Queensland student placements, Darcy
Brady and Laura Ferris who helped considerably in the field this season. Michelle Phung a UQ
placement from last year submitted the work she led last year on species distribution
modelling to Sunbird. Tyde Bands another UQ student who volunteers on the project also led
a paper submitted to sunbird which reviewed site fidelity, breeding success and occupancy
from the decade long NSW dataset.
This year 41 people responded to our survey about the project and like last year, the results
were highly positive. Encouragingly, the percentage of people who make a record every time
they go out to do a survey, regardless of whether they see an owl, grew from 29% to 49%.

8
Feedback also identified a desire for more field training and group outings, as well as few
other places we can look to improve in the coming years.
We are very thankful for the support from the Queensland Government which will allow this
project to continue for two more years.

9
Introduction
The Powerful Owl is listed as vulnerable in Queensland but we lack up to date information on
where the owls are found, how big their population is, how that population is trending over
time or what factors are related to breeding success. Powerful Owl are reliant on large
patches of forest with trees from 100 to 500 years old (Kavanagh 1997, Loyn et al. 2001), and
the loss of forest habitat is seen as the primary reason Powerful Owl populations have
declined (Webster et al. 1999, NSW Scientific
Committee 2008). Unfortunately, Powerful Owl can
be especially difficult to detect in Australian forests
(Department of Sustainability and Environment
2011, Cooke et al. 2017), so it is likely that loss of
forest habitat leads to impacts to Powerful Owl that
occur unnoticed. As apex predators, Powerful Owl
also likely perform an important function within
ecosystems (Estes et al. 2011, Wallach et al. 2015),
and due to their large home range it is likely that
many species are conserved when Powerful Owl are
conserved (Senzaki et al. 2015, Burgas et al. 2016,
Senzaki and Yamaura 2016, Yamaura et al. 2018,
Rodríguez-Estrella et al. 2019). Unfortunately, the
threats to Powerful Owl and other wildlife reliant on
forest habitats are increasing (McAlpine et al. 2002)
due to on-going growth of the human population in
Queensland (Queensland Government Statistician’s
Office 2019) and associated on-going forest clearing
(Simmons et al. 2018).
Despite the many good reasons to conserve Powerful Owl as threats to their survival
increase, there is little that can be achieved if the owls cannot be detected (Cooke et al.
2017). Fortunately, it has been shown that engaging large numbers of people in looking for
owls can overcome the difficulties in detection. Sydney’s long-running Powerful Owl
monitoring program has demonstrated that the distribution and breeding success of these
owls can be uncovered with a citizen science program (Bain et al. 2014) . These monitoring
efforts have enabled general and site specific management recommendations to be made
(Kavanagh and Owls 2002, Bain et al. 2014, Lake Macquarie City Council 2014). Powerful Owls
are proving good indicators of the location and condition of some of the best wildlife habitats
in urban areas. As apex predators reliant on the presence of abundant prey (Kavanagh 1988,
Pavey et al. 1994, Cooke et al. 2006), old trees with hollow for nesting, and often large blocks
of mature forest (Bain et al. 2014). A recent study in Victoria successfully modelled the
distribution of Powerful Owl and highlighted the need to establish clear vegetation
Photo: Powerful Owl; Amanda Robertson

10
management strategies throughout the urban matrix, an area increasingly being used by
Powerful Owl (Bradsworth et al. 2017). Two-thirds of the habitats in need of protection in
Victoria included areas that are outside existing protected areas (Bradsworth et al. 2017). The
above rich understanding has yet to be developed in Queensland.
Acoustic monitoring also has the potential to overcome the low detection probabilities in
cryptic species like the Powerful Owl. This kind of monitoring is already proving successful for
improving our understanding of other species in Australia (Law et al. 2018). If it works this
kind of sampling could provide more representative sampling of Powerful Owl in remote
areas where citizen scientists are unlikely to travel.
Owl monitoring has been done by Brisbane City Council (Brisbane City Council 2005) and
other owl experts in the region, but there is insufficient data to guide management decisions
that would ensure this species persists in the long-term in Queensland. Monitoring efforts
have occurred at too few sites with too little frequency to determine how owl populations
are changing in this region, let alone why any changes may be occurring. There are also gaps
in our understanding of where breeding owls are found in the region. Further, in order to
develop the best possible management recommendations, we require an understanding of
what habitat factors might relate to the presence of breeding owls, and the ability for any
pair to successfully produce young. Previous studies also indicate that Powerful Owl
populations may be most sensitive to adult mortality (McCarthy et al. 1999). So, a
monitoring program is also needed to capture potential sources of adult mortality, or other
factors that can impact populations aside from habitat loss (Gagné et al. 2015, Eccleston and
Harness 2018, Lohr and Davis 2018). Fortunately, due to the help from many people involved
in this project, we are now on a road to deliver these understandings.
The Powerful Owl project is not just important for conservation of this species and associated
biodiversity (Bennett et al. 2015, Schlagloth et al. 2018), but it can raise environmental
awareness and engage growing numbers of the community in meaningful experiences in the
natural world (Bain et al. 2014). Species like Powerful Owl attract wide public attention and
citizen science projects attract growing
numbers of people to work in the outdoors.
The benefits of connecting to nature are
increasingly being documented for human
health (Keniger et al. 2013, Shanahan et al.
2016), and it is thought that direct experiences
with the natural world are more likely to lead
people toward taking or supporting
conservation actions (Dunn et al. 2006, Zaradic
et al. 2009). We feel broad programs which
educate the community on ecological and
conservation issues are increasingly important as Photo: Powerful Owl chick; Mark Clarke

11
evidence indicates the general public is becoming increasingly detached from the natural
world (Soga and Gaston 2016, Soga et al. 2016). This kind of project serves as a catalyst to
generate broader community interest in the surrounding natural areas.
If google scholar searches provide a crude proxy of how much we have learned about a
species. It looks like we have a lot to learn about Powerful Owl and other nocturnal species,
as a search on Mallard returns 142,000 articles, a search on Powerful Owl returns 1,450
articles, and a search on Marbled Frogmouth returns 162 articles.
In 2017 we undertook a pilot investigation in the Brisbane region to determine project
feasibility, and in 2018 and 2019 we have initiated a wider scale Powerful Owl citizen science
monitoring project in southern Queensland. In 2020 we have partnered with QUT to explore
the utility of acoustic monitoring in helping us refine species distribution models, and
understand correlates of breeding success. This report summarises our progress so far.
Objectives
(Our project is currently focused on Powerful Owl, but there is room for this kind of work on
most nocturnal birds.)
Inspire the general public, and educate
them about nocturnal birds, and their
habitat / conservation requirements.
Train citizen scientists to conduct
surveys to find nocturnal birds and
track breeding success.
Develop/review codes of practice for
such surveys (to protect welfare of
birds): minimum approach distances,
etc.
Survey and monitor the distribution and abundance of nocturnal birds and uncover
why birds are present in some areas and absent in others.
Uncover habitat characteristics, including indices of prey abundance, associated with
species presence and breeding success in nocturnal birds.
Photo: Powerful Owl chick; Jasmine Zeleny

12
Develop species distribution and population models of sufficient accuracy to be used
as planning layers by state and council and for assessment of population trajectories.
Identify site-specific management recommendations for nocturnal birds. (Review in
context of various generic codes, e.g. forestry practices, road construction, etc.)
Understand the impact of threats such as vehicle strike, secondary poisoning or
electrocution.
Inform, and support land management for the conservation of nocturnal birds.
Powerful Owl distribution in southeast Queensland
Powerful Owl observations
Before we started the Powerful Owl project in southern Queensland in 2017, we guessed
that there might be 30 to 50 breeding pairs in the region. Since 2017, Powerful Owl have
been recorded in 186 grid cells (5km2 resolution) in southeast Queensland, with additional
sightings recorded from additional 73 grid cells prior to 2017 (Figure 1), many of which came
from the Queensland Government’s historic records (Queensland Herbarium 2020). Two of
these grid cells contains three active
breeding hollows within it, and another
grid cell contains two pairs. Powerful Owl
are also thought to be present in large
blocks of forest that have not been
surveyed. Together, we suggest there are
a minimum of 300 pairs in southeast
Queensland, and initial species
distribution modelling indicates there
could be over 950 pairs in the region (see
abstract below). While there remains a
high level of uncertainty regarding the
population size of Powerful Owl in
southern Queensland, we are confident that
the population is much larger than we guessed
three years ago, possibly nine times higher than originally thought.
Since 2018 we have confirmed 70 Powerful Owl pairs are active in the region, with multiple
sightings of a pair of owls 1 km or less apart. In addition, successful breeding has been
recorded at 46 distinct areas. At 25 of these locations a total of 31 breeding hollows have
now been identified.
Photo: Powerful Owl chick; Amanda Robertson

13
The council areas where we were able to identify the most breeding pairs, were those where
targeted funding permitted regular outings where volunteers were taken out into the forest
(Table 1).
Powerful Owls can likely turn up in any forested habitat occasionally (The Department of
Sustainability and Environment 2011), so we want to continue to confirm pairs in locations on
multiple occasions or confirm breeding to get a more precise understanding of population
size.
Throughout Queensland 1,883 sightings have been collated from 2,223 surveys into Birdata.
In 2018, 200 Powerful Owl sightings were recorded from 444 surveys, in 2019 347 sightings
were recorded in 655 surveys, and 597 sightings were reported in 985 Powerful Owl surveys
in 2020.
In 2019, two instances were reported this year where owls flew toward observers landing
within three meters. In both
cases observers left the area
immediately. In 2020 one
observer reported being
swooped by an owl on two
occasions when visiting a
hollow on private property.
The observer subsequently
kept their distance, and were
able to confirm young later in
the year with no further
swooping.
No other swooping or aggressive behaviour has been reported in Queensland Owls. Once
again, this year we did not look for data on mortality, but six Powerful Owl were found dead
due to vehicle collision, one to electrocution, and two others were hospitalised due to
collision.
Table 1. Summary of pairs, breeding pairs and hollows found in council areas of southeast Queensland in 2018 & 2019.
COUNCIL # OF HOLLOWS
# BREEDING PAIRS
# ADDITIONAL
PAIRS
Brisbane 11 18 4
Fraser 0 0 0
Gold Coast 0 1 2
Gympie 0 0 1
Ipswich 1 3 2
Photo: Powerful Owl pair; Amanda Robertson

14
Lockyer 0 0 1
Logan 3 7 0
Moreton 1 5 3
Noosa 0 0 0
North Burnett 0 0 0
Redland 6 8 1
Scenic Rim 0 1 3
Somerset 0 0 0
South Burnett 0 0 0
Southern Downs 0 0 1
Sunshine 1 3 0
Toowoomba 1 3 0
Figure 1. Map of Powerful Owl records in southeast Queensland at 25 km2 resolution.
Other Nocturnal bird locations in southeast Queensland in BirdData database
Records on other nocturnal birds have been collected as part of the Powerful Owl project and
there are some historic records in Birdata (Figure 2a – 2e). There is likely more data in other
databases. It has been surprising how few observations of other nocturnal birds are being
recorded during Powerful Owl surveys and this suggests that capturing data on other species
will require more targeted efforts.

15
Figure 2a. Map of Barking Owl and Barn Owl records in southeast Queensland at 25 km2
resolution, available in BirdData.
Figure 2b. Map of Southern Boobook Owl and Eastern Grass Owl records in southeast
Queensland at 25 km2 resolution, available in BirdData.
Figure 2c. Map of Masked Owl and Greater Sooty Owl records in southeast Queensland at 25
km2 resolution, available in BirdData.

16
Figure 2d. Map of Marbled Frogmouth and Australian Owlet-nightjar records in southeast
Queensland at 25 km2 resolution, available in BirdData.
Figure 2e. Map of Tawny Frogmouth and White-throated Nightjar records in southeast Queensland at 25 km2 resolution, available in BirdData.
Engagement
The project received a large boost in engagement after the Minister for Environment and the
Great Barrier Reef, The Honourable Leeanne Enoch joined us at Mt Coot-tha to announce the
Powerful Owl project would get funding for the next three years as part of the Palaszczuk
Government’s $1.4 million in funding for threatened species projects. This announcement led
to media coverage and growing numbers of people contacting the project with sightings or to
get involved.
Since then, BirdLife, Birds Queensland, Natura Pacific and other groups and local councils
have helped the project reach a growing number of people. The restrictions around activities
due to COVID-19 also resulted in a large increase in opportunistic sightings and on-line
engagement. Details on the numbers of people participating in the project, public
engagement

17
Number of people involved
The project mailing list includes over 787 people, 857 people are signed up to the
Brisbane Powerful Owl Facebook group, and over 2,000 people have attended various
talks since 2018.
548 people are now formally signed up to the project (148 from 2020) and have
attended workshops were given maps of areas, permits, notification requirements,
methods, and flyers for letterboxing private landholders.
11 Powerful Owl presentations were given this year attended by 420 people. Six
included the full three-hour workshop followed by a field visit, two included a 1-hour
presentation followed by field visits, one was an on-line live workshop, and two one-
hour presentations were given (see below for details).
COVID-19 forced the cancellation of four workshops, but all those who had RSVPed
were sent links to on-line videos of workshop content (see below).
Groups of volunteers are starting to form in some areas with local leaders.
Over 300 volunteers have gone out in the field with me or other experienced people
to actively look for owls or check on existing territories on casual visits outside those
at workshops.
We trialled the collection of data on the number of arboreal mammals observed, and
the distance walked on each survey in a google form. While 7 people did report these
data indicating and average of 4.2 arboreal mammals were seen on walks of an
average of two kilometres. These variables will need to be incorporated into Birdata if
we hope to capture enough data to analyse. We also talked about including the
number of trees with large hollows as another variable to include in the future.
Photo: Powerful Owls with different prey items; Amanda Robertson

18
Table 2. Summary of Powerful Owl workshops and presentations held in the last year.
Date Location URL # of people attended
Full three-hour workshops followed by field visit
29/02/2020 THECA, 47 Fleming Rd, Chapel Hill
https://tinyurl.com/rrt45sm 52
1/03/2020 Toowoomba City Library, 155 Herries Street, Multipurpose Room, Level 3, Toowoomba City
https://tinyurl.com/rn9uneg 24
7/03/2020 177 Meakin Rd, Slacks Creek https://tinyurl.com/rv4nq9m 24
8/03/2020 Ipswich Central Library, 40 South St, Ipswich, Qld
https://tinyurl.com/vp3232c 22
14/03/2020 Indigiscapes, 17 Runnymede Road, Capalaba
https://tinyurl.com/smyhcbj 55
15/03/2020 149 Acacia Rd, Karawatha https://tinyurl.com/wnydhg8 31
One-hour presentation with no field visit
26/8/2020 Gecko Environment Council- Currumbin RSL, 165 Duringan St, Currumbin
https://tinyurl.com/y3fuo2vv 82
22/10/2020 Albert Valley Wilderness Society, 1368 Beenleigh Rd, Cedar Creek
https://tinyurl.com/y5f7njhz 35
One-hour presentation followed by field walk
21/9/2020 Woodfordia's Bushtime, 87 Woodrow Rd, Woodford
https://tinyurl.com/y49vcew2 20
28/9/2020 Woodfordia's Bushtime, 87 Woodrow Rd, Woodford
https://tinyurl.com/y49vcew2 25
On-line live workshop one-hour
25/9/2020 On-line Gold Coast workshop, live, Natura Pacific and City of Gold Coast hosted
https://tinyurl.com/y4m2grfz 50
Table 3. The links to on-line workshop content and number of views so far
Name of video URL Number of views
The Powerful Owl Project - Overview https://youtu.be/ieDWU78HuCc 618
Overview from Gold Coast on-line workshop
https://tinyurl.com/y4m2grfz unknown
The Powerful Owl Project – South East Queensland Owls and Ecology
https://tinyurl.com/y4r8nb3s 857

19
The Powerful Owl Project - Research https://youtu.be/A5Nxm-8EGJI 155
The Powerful Owl Project - What we have learned
https://youtu.be/eoRfC2ykcSU 255
The Powerful Owl Project - How to find Powerful Owls
https://youtu.be/1kqU1AY8-0w 613
The Powerful Owl Project - Project Safety and Rules
https://youtu.be/5NBRxruVUv8
129
The Powerful Owl Project - QUT Acoustic Monitoring
https://youtu.be/-gOK_sv80uI 286
The Powerful Owl Project - Glider Talk https://youtu.be/9NtRRm4P9pI 175
Photos: Eleven Powerful Owl presentations or workshops were given in 2020, with
attendance at each workshop varying from 20 to 55.

20
Volunteer engagement and feedback
Promotion of the project was helped again this year
with the help of BirdLife, Birds Queensland, and
Natura Pacific. We were also invited to speak to the
members of The Hut Environmental & Community
Association (THECA), Gecko Environment Council,
Woodfordia, and the Albert Valley Wilderness Society.
Further promotion was provided by council staff,
through word of mouth, email announcements,
newsletters, social media, and advertising.
Advertising was purchased again this year in the online
events bulletin Weekend Notes, and through boosting
on Facebook. With a $75 Weekend Notes
advertisement, 213 unique readers were reached
with an announcement of a Powerful Owl workshop
schedule. A $345 spend on Facebook reached far more people (49,271), with 4,062
engagements and 4,277 clicking on links in those posts about the workshops. In 2020 we also
saw a very large increase in the number of people visiting the Powerful Owl website
https://birdlife.org.au/projects/urban-birds/powerful-owl-project-pow with 23 times more
unique visitors visiting the site in 2020 than did in 2019, and 41 times more people
downloading content from the site. A variety of Powerful Owl Facebook posts have now
exceeded tens of thousands of likes and shares. The Project’s private Facebook group has
now grown to 857 https://www.facebook.com/groups/brisbane.powerful.owls/
Additional promotion resulted from media coverage (see below). Owl experts Jasmine Zeleny
and Matt Wright have volunteered to help with field work and helped deliver half the content
of the workshops.
The project has continued to grow this year, with 148 formally signing up to participate. The
most growth this year has been in informal participation, and a growing number of
opportunistic sightings being reported.
We again asked volunteers to fill out a survey about their participation in the Powerful Owl
project. A few new questions were added this year, while many were left the same to
provide some comparison. Last year 58 people responded, and this year 41 people
responded to the survey. It is hard to know how representative these results are of the
entire 548 people signed up formally to the project, but results are still informative.
This year participants did an average of 16 surveys (range 0 to 70) in 2020, which is slightly up
on the average of 11 last year. Participants also walked on average of 2.6 km per survey
(range 0 to 7), which is down slightly on last year’s average of over 3km. Participants this
Photo: Powerful Owl; Michael Willis

21
year indicated they drove on average 18km to do surveys (range 0 to 200). 82% of
participants ranked the project at 8, 9, or 10, with 42% giving it a perfect score of ten. These
results were very similar to last year with no one scoring the project less than five, but there
were far more people who scored the project a ten this year. 88% of participants this year
would recommend the project to a friend, which is down slightly on the 93% reported last
year.
This year 90% of respondents learnt something new about owls (96% last year) and 78% now
find themselves looking and listening for owls when they get the chance (86% last year). In
addition, 73% of them felt proud to be a part of the project and the work they were doing
(76% last year), while 61% reported the project was allowing them to reconnect with nature
(50% last year). 32% of participants met new people in their area that they go out on surveys
(30% last year) with and 63% of people engaging with others about the project (15% last
year). These results indicate that most people found the project rewarding and engaging,
with over half reporting the project was a catalyst to
reconnecting with the natural world. The project also
required increases in physical activity with volunteers
reporting on average walking over two kilometres on
each survey while conducting on average 16 surveys
for a total average of 41 kilometres walked by each
volunteer.
We were encouraged to see that an increasing
proportion of people are submitting records each time
they go out to look for owls, even if they do not see
anything (Figure 3). In 2019 29% of participants
indicated they always entered their surveys in Birdata
and that increased to 49% in 2020. This encouraging
result indicates that we will have much improved data
on sampling effort, which will allow us to develop more precise predictions of species
occupancy.
A few additional questions were added to the survey this year. One was if people wanted to
shorten the workshops. 52% indicated they did not want a change while 41% wanted to
“shorten the indoor presentation, and cover field identification, calls and survey protocols on
a field trip.” Fortunately, we can accommodate both going forward. We asked participants
to rate the workshops and 67% indicated they were excellent, 31% indicated they were good,
and the remaining 2% indicated they were fair. Also 95% of people were accessing a variety
of on-line resources with 71% accessing owl calls, and nearly half watching on-line videos
accessing last year’s report and survey methodologies. 60% have used the maps provided on
survey locations and over 30% of people accessed other material in a shared Dropbox folder,
Photo: Powerful Owl; Kevin Jensen

22
downloaded management guidelines, downloaded the project flyers for letterboxing, and 6%
have downloaded the education materials.
Figure 3. Results of volunteer survey regarding the frequency that participants record their
surveys in Birdata regardless of whether they see an owl 2020 (n = 41), and 2019 (N=59).
Participants also provided written feedback (Appendix A) which we will draw on to look to
improve the program next year. The comments were varied, but many indicated a desire for
more field training, and chances to get together. Program improvements will also be looked
at during the end of year meeting and our project advisory committee meeting in early
December.
To further help people to learn about nocturnal birds, thousands of nocturnal bird booklets
have been printed with funding from ABEF and Ipswich City Council. These are distributed at
all live presentations and are also available on-line:
https://birdlife.org.au/documents/Nocturnal_birds_reduced.pdf Grant funding from ABEF
also allowed us to purchase blue-tooth speakers and red torches for some of the most active
volunteers.

23
Flyers for letterbox drops were also printed this year and given to some volunteers who
distributed them with some responses that led to a couple more Powerful Owls being
located.
Education materials have in previous years been developed by the Powerful Owl project in
NSW to fit in with the curriculum. See the Powerful Owl education kit available for download
here: http://birdlife.org.au/projects/powerful-owl-project We will continue to look for
people that might be interested in delivering education programs in schools.
Electronic monthly newsletters are sent to the 787 people on the project monthly email list
and links to each newsletter are posted to Facebook.
October 2020: https://tinyurl.com/y3kntm7w
September 2020: https://tinyurl.com/y2f7r867
August 2020: https://tinyurl.com/y33enc4d
July 2020: https://tinyurl.com/y3qjy878
June 2020: https://tinyurl.com/y4763b9x
May 2020: https://tinyurl.com/y3oqfdvo
April 2020: https://tinyurl.com/yyunnyqx
March 2020: https://tinyurl.com/y4deojq4
February 2020 update 2: https://tinyurl.com/y3lorqob
February 2020: https://tinyurl.com/y5qcx7rr
December 2019: https://tinyurl.com/y4d6xxa7
November 2019: https://tinyurl.com/yxg2newh
Rat Poison Campaign
BirdLife made a submission and initiated a campaign to regulate second generation anti-
coagulant rodenticides. The Powerful Owl project staff and volunteers assisted with these
submissions. These compounds are highly regulated in the EU, the USA and Canada. Almost
4,000 people made a submission to the Australian Pesticide and Veterinary Medicines
Authority (APVMA) review into rodenticides through the BirdLife network, asking for the most
harmful second-generation products to be taken off supermarket shelves.
The APVMA has recently released a first response to those review submissions, indicating they
will be updating labelling of products. While this is a positive move it does not go nearly far
enough to protect birds, or to bring Australian regulations in line with European and North
American standards. BirdLife will continue to push for stronger regulation of these compounds.
https://www.actforbirds.org/ratpoison
Photo: Powerful Owl; Sylvia Alexander

24
Media attention
As we near the end of 2020 we estimate that media coverage has reached over 1 million
people throughout southeast Queensland with stories about both Powerful Owl and the
project (Table 4). In 2019, the greatest amount of media coverage came as a result of the
minister for the environment announcing three years of project funding. In 2018, media
attention came as a result of parallel interest in a zip-line development at Mt Coot-tha, and a
press release sent out by one of our volunteers. In both years we have generated numerous
internal project updates, and external newsletter articles and social media links.
Table 4. Summary of media coverage
Year Outlet / program location reach URL
2020 ABC Radio: Catherine Feeney
Southeast Queensland
Tens of thousands
https://tinyurl.com/y3vug8np
2020 ABC Radio: Scenic Rim Local
Southeast Queensland
Thousands NA
2020 ABC Print: News Science
National Hundreds of thousands
https://tinyurl.com/y8ofrz8p
2020 Channel Ten TV: Totally Wild- featuring Jasmine Zeleny and Rob Clemens
National Hundreds of thousands
https://tinyurl.com/y3jkqgpr
2020 Sydney Morning Herald
National Hundreds of thousands
https://tinyurl.com/y5wutnyg
2020 Podcast: Natura Pacific
National Tens of thousands
https://tinyurl.com/y545sg4a
2020 Cosmos magazine National Thousands https://tinyurl.com/yycnv4q7
2020 Planet Ark article National Thousands https://tinyurl.com/yym97tme
2020 Print: The Local Bulletin Brisbane West – by Jim Butler
Local SE Queensland
Thousands https://tinyurl.com/y5uaekfa
2020 Electronic BirdLife communications
Tens of thousands
https://tinyurl.com/y26qt68r https://tinyurl.com/y6ctum32 https://tinyurl.com/yyzf664m https://tinyurl.com/yxnbm9at
2019 ABC – on-line National Hundreds of thousands
https://tinyurl.com/y2e7j87f
2019 Channel 7 TV: 7pm news
Southeast Queensland
Hundreds of thousands
https://tinyurl.com/yybxjvax

25
2019 Gold Coast Channel 7 Facebook
Southeast Queensland
Tens of thousands
https://tinyurl.com/qmwepxv
2019 Queensland Government Facebook - Science
Southeast Queensland
Thousands https://tinyurl.com/wc5jpcd
2018 Print: Brisbane Times
National Hundreds of thousands
https://tinyurl.com/y7dtppa6
2018 Print: Sydney Morning Herald
National Hundreds of thousands
https://tinyurl.com/y64m3tau
2018 Print: Beaudesert Times
Local southeast Queensland
Thousands https://tinyurl.com/y6slbna5
2018 Natura Pacific: on-line doco
National Tens of thousands
https://tinyurl.com/yypowetb
2018 Print: Jimboomba Times
Local southeast Queensland
Thousands https://tinyurl.com/y6n5hpdf
2018 Print: Redland City Bulletin
Local southeast Queensland
Thousands https://tinyurl.com/y5yl766q
2018 ABC TV Southeast Queensland
Hundreds of thousands
https://tinyurl.com/y7f4e89z
2018 Print: Architecture.com
National Thousands https://tinyurl.com/y6efd57c
2018 Print / on-line: Land for Wildlife article
Southeast Queensland
Thousands https://tinyurl.com/yxor59of
Stakeholder Engagement
Many council and state employees are included on project
email updates, and are sent data and project reports at the
end of the season. Last year we had our first meeting of the
Powerful Owl advisory group, which included
representatives from within the project as well as QUT,
Deakin University, University of Queensland, Redland City
Council, Moreton Regional Council, Ipswich City Council,
Sunshine City Council, Faunagraphic, and BirdLife national
office.
We will be having another meeting of the project
advisory committee in early December of this year. Photo: Powerful Owl; Nick Bradsworth

26
So far, the diverse group of attendees advised on ways to improve the project, discussed
ways improve conservation instruments within different levels of government, and to
identified related projects of interest to participants.
Acoustic Monitoring
QUT Acoustic Monitoring
The aim of this research project is to use bioacoustics to monitor Powerful Owls (Ninox
strenua) in south-east Queensland. The development of an automated species recognition
tool will provide insight into the vocalisation habits of this secretive species, with the aim of
providing an efficient method for monitoring breeding success and improved field detection
relative to traditional observation methods. Acoustic recognisers are automated tools
developed to detect vocalisations of a particular species amongst complex environmental
acoustic data (Duan et al., 2011). One of the most promising applications of passive acoustic
monitoring using ARUs is the monitoring of vocal cryptic species, such as the Powerful Owl
(Duchac et al., 2020).
This project addresses the following questions:
• What are the vocalisation characteristics of Powerful Owls and can different
vocalisations be linked to behavioural functions?
• How does the vocalisation behaviour of Powerful Owls change throughout the
breeding season?
• Can automated acoustic recognisers be utilised to determine whether a pair of
Powerful Owls have bred successfully?
• How far do Powerful Owl vocalisations travel in different environments? How should
acoustic monitors be placed in order to maximise monitoring efficiency?
Current Progress:
16 acoustic monitors were
deployed for approximately 6
months in active owl territories and
have now been returned from the
field (Figure 4,). Approximately 7
terabytes of long-duration
recordings have been obtained.
Manual annotation of the
recordings is being conducted in
Raven Pro in order to build a Figure 4. Locations of initial acoustic sensor deployment
locations

27
training dataset for acoustic recogniser application. Directional recordings will be obtained
over the following months for call classification. Once manual annotation is completed,
recogniser testing will begin, along with call attenuation testing. 20 Birdlife Audiomoths
(small acoustic monitoring devices) will also be deployed in the coming weeks to provide
additional testing data and gain insight into summer vocalisation habits.
Additional deployments
Seventy-seven acoustic sensors are being deployed in 2020 (Figure 5). These deployments
are intended to further test how often Powerful Owl are detected when they are deployed in
areas where Powerful Owl have been detected previously. We were also hoping some of
these deployments might confirm the presence of a territorial pair, or uncover evidence of
breeding success in areas where it was not detected in 2020. Data has been retrieved from
44 locations, and five additional sensors are currently in the field. Unfortunately, seven
sensors were stolen, and one sensor was left on the ground but the mounting strap and
micro SD card was stolen. Twenty additional sensors will be deployed in November by QUT in
order to explore how well acoustic monitoring can detect breeding success in territories
where young owls were produced this year. There is little understanding of how often
Powerful Owl call over summer, or how well breeding success might be detected once the
chicks are flying around well. Close to 3TB of acoustic data has been collected and a few
more TB are expected to be collected by the year’s end. These data will be analysed, and
screened for Powerful Owl detections in the coming year.
Deployments at 30 known breeding locations are planned again in March and April of 2021 to
test the detection probability at sites known to have Powerful Owl at a time of year when
adult birds are calling the most throughout the area to set up a territory prior to breeding. In
March and April, to test and refine species distribution models, another 60 sensors will be
deployed. Thirty will be deployed at locations predicted to have suitable habitat and where
Powerful Owl have not been recorded previously. A third set of 30 sensors will be deployed
in forested areas with at least one tree of at least 85cm diameter at breast height which are
predicted to be unsuitable for Powerful Owl.

28
Figure 5. Locations of 77 acoustic sensor deployment locations in 2020. Red dots are
locations where seven sensors were stolen.

29
Impact of summer 2019/20 bushfires on forest owl habitat
The fires in eastern Australia during the summer of 2019/20 were unprecedented in scale
and severity. Remote sensing data on fire extent were overlayed onto species distribution
models to estimate the impact these fires had on the habitat of Powerful Owl, Australian
Greater Sooty Owl, and Southern Masked Owl.
Methods
Bird records were sourced from Birdata
(BirdLife Australia 2020) and ebird (Sullivan
et al. 2009) and included all records of each
owl in Australia. The records from these
sources included Powerful Owl 19,462
records, 3,721 Australian Greater Sooty
Owl records, and 5,402 Southern Masked
Owl records.
The environmental predictor variables that
were selected were believed to be related
to the ecological niche of these owls and
included: area of closed forest, area of
woodland forest, area of open woodland
forest, area of rainforest, average normalised
difference vegetation index (NDVI), average
vegetation forest height, area of remnant vegetation cover, stream density, stream aspect,
annual precipitation, maximum temperature, precipitation in the wettest quarter and
temperature in the coldest quarter, and population density. All variables were either totalled
or averaged at a 4km2 resolution (Table 5). The 4km2 resolution was set to capture variables
at the scale of core breeding habitats and to minimise overlapping territories which are
occasionally only one kilometre apart.
Variables were aggregated, processed and resampled to a matching resolution and projection
using ArcMap (v.10.7.1, ESRI, Redlands, CA, USA) and in RStudio (RStudio Team 2015, R Core
Team 2018) using the following packages: ‘raster’ (Hijmans 2017), ‘rdgal’ (Bivand et al.
2018), ‘sf ‘(Pebesma 2018), ‘sp’ (Pebesma and Rivand 2005) and ‘dplyr’ (Wickham et al.
2019).
Fire data were derived from VIIRS sensor aboard the joint NASA/NOAA Suomi National Polar-
orbiting Partnership (Suomi NPP) and NOAA-20 satellites at a resolution of 375m. NRT VIIRS
375 m Active Fire product VJ114IMGTDL_NRT is available on-line
https://earthdata.nasa.gov/firms doi: 10.5067/FIRMS/VIIRS/VJ114IMGT_NRT.002
Photo: Powerful Owl; Brett Coleman

30
Spatial variation in sampling effort was accounted for by generating a spatial bias grid layer
for use in Maxent which contained the number of Birdata or eBird surveys conducted in each
grid cell.
Table 5. Predictor variables used in Maxent models generated for three forest owls in Australia.
Predictor Description Reference
Area of four classes of forest cover
Classified forest cover at 100m2 resolution was reclassified into four forest classes: closed forest, woodland, open woodland, and rainforest. The area was totalled in each 4km2 grid cell for each of these four classes.
Australian Bureau of Agricultural and Resource Economics and Sciences (ABARES, 2019)
Normalised difference vegetation index (NDVI)
Averaged over two years (2018 and 2019), based on four six-month periods of NDVI data and averaged by resampling from 100m2 resolution.
Bureau of Meteorology (BOM, 2019)
Vegetation height Vegetation height was totalled from 100m2 resolution data.
Terrestrial Ecosystem Research Network (TERN, 2011)
Climatic variables Averaged from 1976 through 2005 and resampled from 5km2 resolution. Climatic variables included: annual precipitation, maximum temperature, precipitation in the wettest quarter and temperature in the coldest quarter.
Future climate layers for Australia (Vanderwal, 2012).
Remnant vegetation The area of remnant vegetation was first converted from polygons to a 100m2 raster, and then area was totalled.
(Queensland Government, 2018)
Stream density and stream aspect
The total length of streams in each 4km2 grid cell was used to represent stream density, and the stream aspect was derived from averaging reclassified aspect into four 90-degree directions with southern aspects given a value of 1, east and west a value of 2 and north a value of 3.
(GeoScience Australia, 2019)
Population Density The density of human population at 100m2 resolution was totalled within each 4km2 grid cell.
Australian Bureau of Statistics (ABS, 2017)
Models were run iteratively in MaxEnt machine learning software which has proven to
predict distributions well from presence only data (Phillips et al. 2004, Phillips et al. 2006,
Elith et al. 2011). The following settings were used within Maxent: output format was
‘cloglog’, predictor response curves and jackknife tests were included, all hinge features were
selected, a random seed value was used with five replicates of 5,000 iterations using cross-
validation, and samples were added to the background with the regularization multiplier set
to a factor of one. Model performance was assessed using the area under the Receiver
Operating Characteristic curve (AUC) (Elith et al. 2011). The predictions were mapped as
probabilities of occurrence and as either suitable or non-suitable based on a threshold rule to

31
maximise training sensitivity plus specificity. That number of cells was then divided by four to
come up with an estimate of the number of pairs likely to be found in the study area. This
step assumed there would be one pair per 16km2 which is close to the average Powerful Owl
home range of 14.6 km2 (Bradsworth et al. 2017).
Results
Maxent model AUC suggested these models did a fair to good job of capturing the
distribution of Powerful Owl, Australian Greater Sooty Owl and Southern Masked Owl with
values of 0.85, 0.93 and 0.90 respectively. When overlayed with estimates of the areas
burned in the 2019/20 summer bushfires of eastern Australia over 1/3 of the predicted
habitat for each of these species was impacted by fire with 31.5% impacted for Powerful Owl,
40.3% impacted for Australian Greater Sooty Owl, and 32.2 % impacted for Southern Masked
Owl. These values are broadly similar if somewhat higher than estimates from independent
work conducted elsewhere (see Table 6 below). The recently published work (Ward et al.
2020) used more precise fire mapping data which may account for some of these differences.
Also, we used some predictive variables such as forest cover which may have resulted in
more precise predictions for these species as opposed to the bio-climatic variables used in
Ward’s work. Either way, the results are broadly similar and raise concerns about the possible
impacts of possible more frequent or severe fire on these owls in future decades.
Figure 6. Species distribution models generated with MaxEnt software for Powerful Owl, and
overlayed with estimated fire mapping from the summer of 2019/20 derived from
NASA/NOAA VIIRS sensor data. Top shows probability of occurrence and bottom shows
suitable habitat based on threshold values that maximized training sensitivity plus specificity.

32
Figure 7. Estimates of suitable habitat impacted by fire: Powerful Owl 31.5%, Australian
Greater Sooty Owl 40.3%, and Southern Masked Owl 32.2%. Suitable habitat was estimated
by maximizing training sensitivity plus specificity of Maxent derived predictions. AUC values
were 0.85, 0.93 and 0.90 respectively.
33
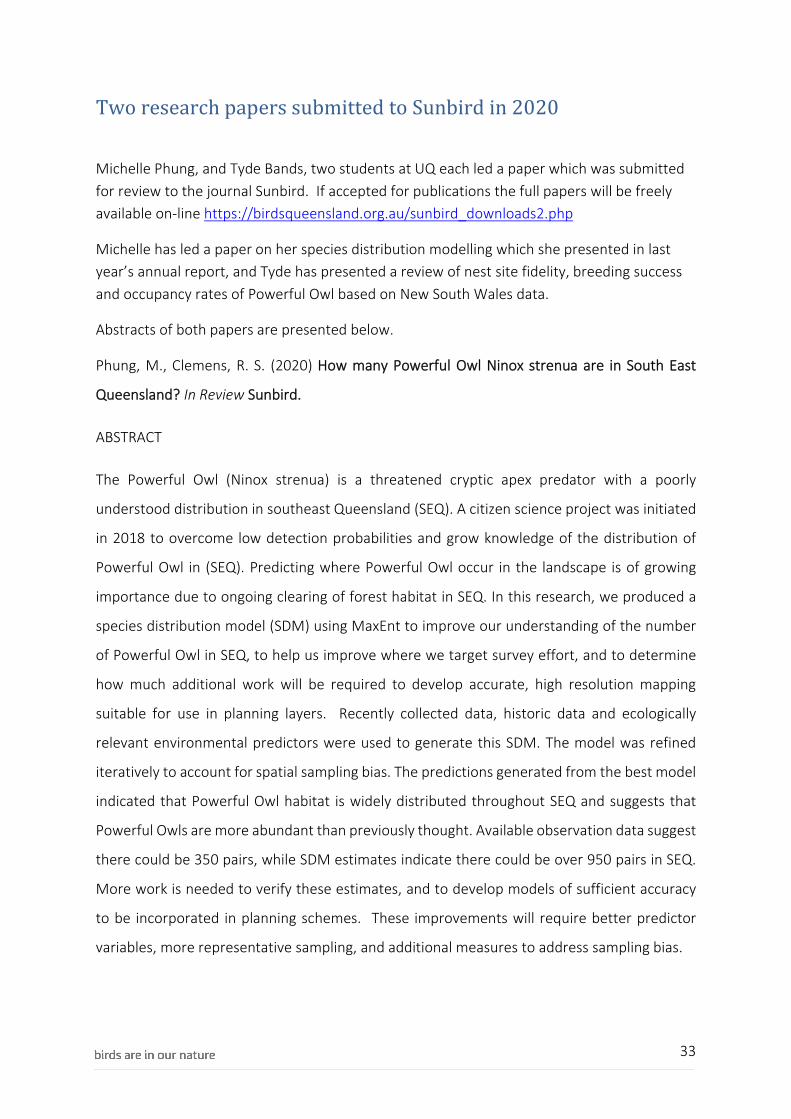
Two research papers submitted to Sunbird in 2020
Michelle Phung, and Tyde Bands, two students at UQ each led a paper which was submitted
for review to the journal Sunbird. If accepted for publications the full papers will be freely
available on-line https://birdsqueensland.org.au/sunbird_downloads2.php
Michelle has led a paper on her species distribution modelling which she presented in last
year’s annual report, and Tyde has presented a review of nest site fidelity, breeding success
and occupancy rates of Powerful Owl based on New South Wales data.
Abstracts of both papers are presented below.
Phung, M., Clemens, R. S. (2020) How many Powerful Owl Ninox strenua are in South East
Queensland? In Review Sunbird.
ABSTRACT
The Powerful Owl (Ninox strenua) is a threatened cryptic apex predator with a poorly
understood distribution in southeast Queensland (SEQ). A citizen science project was initiated
in 2018 to overcome low detection probabilities and grow knowledge of the distribution of
Powerful Owl in (SEQ). Predicting where Powerful Owl occur in the landscape is of growing
importance due to ongoing clearing of forest habitat in SEQ. In this research, we produced a
species distribution model (SDM) using MaxEnt to improve our understanding of the number
of Powerful Owl in SEQ, to help us improve where we target survey effort, and to determine
how much additional work will be required to develop accurate, high resolution mapping
suitable for use in planning layers. Recently collected data, historic data and ecologically
relevant environmental predictors were used to generate this SDM. The model was refined
iteratively to account for spatial sampling bias. The predictions generated from the best model
indicated that Powerful Owl habitat is widely distributed throughout SEQ and suggests that
Powerful Owls are more abundant than previously thought. Available observation data suggest
there could be 350 pairs, while SDM estimates indicate there could be over 950 pairs in SEQ.
More work is needed to verify these estimates, and to develop models of sufficient accuracy
to be incorporated in planning schemes. These improvements will require better predictor
variables, more representative sampling, and additional measures to address sampling bias.

34
Bands, T. L., Mott, B., Zeleny, J., Wright, M., Clemens, R. S. (2020) Nest site fidelity, breeding
success, and occupancy of Powerful Owl Ninox strenua as indicated from a long-term citizen
science project in New South Wales. In Review Sunbird.
ABSTRACT
Birdlife Australia’s Powerful Owl Project has amassed a dataset on Powerful Owl (Ninox
strenua) territory occupancy and breeding success that spans 12 years and is inclusive of 228
separate territories in the greater Sydney region of New South Wales. Year-on-year Powerful
Owl nest site fidelity averages 76%, with a recruitment rate of 1.02 fledglings per territorial
pair. On average, breeding is attempted in 59% of occupied territories each year, and an
average of 92% of territories are occupied in any given year. Over four years, 46% of pairs
switched nest trees at least once. Statistical tests did not reveal any difference in the number
of chicks produced if pairs switched nest trees or re-used nest trees to which they had fidelity.
No relationships were found between average breeding success in a territory and human
population density nor distance to nearest neighbouring Powerful Owl nest tree. Recruitment
rates suggest stable recruitment in this largely suburban population of Powerful Owl. The
switching of nesting trees by Powerful Owl reinforces the importance of having large trees with
hollows in the landscape. Long-term Powerful Owl recruitment will likely require multiple
potential nesting trees, as well as hollows for their preferred arboreal prey.

35
Review of conservation status of three forest owls The summer bushfires of 2019/2020 prompted a review of the conservation status of three
forest owls of eastern Australia including the Powerful Owl, the Greater Sooty Owl, and the
Southern Masked Owl. At this time data was found to be insufficient to warrant listing under
IUCN criteria, but we report the findings of the review below.
Further work to confirm the population impacts of the
recent fires, to quantify population declines, or which
demonstrate the impact of high mortality rates or
poor breeding rates on population viability will be
required to demonstrate that thresholds for IUCN
listing have been met.
Data were not sufficient to capture population change
throughout most of the range of these three forest
owls. When records were excluded if within 50km of
Melbourne Sydney or Brisbane, there were few
records left to assess population change throughout
most of these species’ ranges (mean # of records each
year in remote areas: Powerful Owl = 72; Greater
Sooty Owl = 18; Southern Masked Owl = 20).
The criteria for listing species as threatened have
become more stringent in recent years. For species
that are declining, thresholds need to be exceeded in
a time period spanning over three generations. For
these owls the time periods are 24 years for Powerful
Owl, 17 years for Australian Greater Sooty Owl, and 12 years for Southern Masked Owl.
Under IUCN, criterion A thresholds for a vulnerable or near threatened listing would be the
most likely to be met. However, evidence would need to indicate that the population had
declined by 30% for a vulnerable listing to be given or by 25% for a near threatened listing.
While the threats highlighted below lead us to suspect that these thresholds may have been
exceeded, we do not have sufficient data to demonstrate these declines have happened.
Population declines are inferred due to ongoing loss of large hollow-bearing trees, forest
clearing, and recent extensive bush fires. Global warming is expected to increase the
likelihood of both fire and drought throughout the range of these species. Overall forest
habitat and large trees with hollows are predicted to continue to be lost.
Further, while these thresholds were exceeded when looking at the amount of habitat
impacted by fires in 2019/20, fire severity was not believed to have been severe enough in all
these areas to have resulted in over 25% of these populations to have been killed in the fires
Photo: Australian Greater Sooty Owl;
Amanda Robertson

36
(Table 6). This was based on assumptions made about four classes of fire severity impacted
populations, with 10%, 30%, 80% and 100% of each population assumed to have been killed
in the four classes of fire severity.
None of these species would currently meet criterion B or D. Currently, only the Australian
Greater Sooty Owl has a population of less than 10,000 mature individuals in the population
which is one of the thresholds for Criterion C. However, Criterion C also requires thresholds
of 30% or 25% decline are clearly demonstrated with data. Criterion E requires a population
viability analysis, which has not been conducted for any of these species. It has been noted
that Powerful Owl in urban areas have high mortality rates, and are known to occupy
territories where they cannot breed, but no data on mortality or recruitment is available from
most of any of these species ranges.
Table 6. Estimates of fire impacts and population decline are reported here.
Species % habitat burned 1
% habitat burned 2
% habitat burned 3
% killed 2 mean and range
Rate of annual population decline 4
p-value of population decline 4
Powerful Owl
31.5 17.7 23 10.6 (7.4 – 14.9)
-0.002 0.89
Greater Sooty Owl
40.3 32.5 38 19.6 (13.6 – 27.4)
-0.2 0.64
Southern Masked Owl
32.2 20.1 NA 12.0 (7.4 – 14.9)
-0.014 0.711
1 Estimate taken from this document 2 Estimates reported from separate internal assessment by BirdLife Australia 3 Estimate reported from published paper (Ward et al. 2020). 4 Estimates based on reporting rates from data > 100km from cities (few records)

37
Powerful Owl Ninox Strenua
The following people helped compile the information in the review below: Larry Chen,
Robert Clemens, Nick Bradsworth, Holly Parsons, Beth Mott, and Raylene Cooke.
Overview
The Powerful Owl is currently listed as Vulnerable in Queensland, Vulnerable in New South
Wales, and Threatened in Victoria. It is not listed under the EPBC Act, no recovery plan or
federal conservation advice has been drafted. IUCN status is currently at Least Concern and
our review did not uncover sufficient data to change that listing. Combined threats are
suspected to have impacted these species enough for listing, but evidence is lacking.
Table 7. Summary of Powerful Owl population
Metric Estimate Minimum Maximum Reliability Source
Extent of occurrence
396,000 km2 376,000 km2 415,800 km2 High This document
Area of Occupancy
195,000 km2 NA NA Medium BirdLife 2020
Number of mature individuals
13,000 7,000 19,000 High This document, Garnett & Crowley 2000
Generation Time
8.2 6.2 10.3 Low Bird et al. (2020)
Infraspecific taxa
Monotypic.
Taxonomic uniqueness: high (Hogan 2008); subspecies/species: 1, species/genus: 37,
genera/family: 28, families/order: 2.
Range
The Powerful Owl is endemic to eastern and southeastern Australia, where it is found mainly
on the seaward side of the Great Dividing Range (HANZAB 2006). Most widespread in New
South Wales, where approximately half of the population is estimated to occur (NSW
Scientific Committee 2008). In Queensland, found only in the southeast, principally south of
the Dawson River (Pavey 1993; HANZAB 2006). Limited to southeast in Victoria, and
presumed vagrant in Southern Australia (HANZAB 2006).
Abundance
The number of mature individuals is suspected to be at around 13,000 based on MaxEnt
predicted area of occurrence divided by a suspected average home range / density (Clemens
2020). Ongoing population decline is inferred from forest clearing (Evans 2016; DEC, NSW

38
2006; Bruce et al. 2020), and widespread bushfires in the summer of 2019-20. Recent
modelling indicated that 31% of this species’ predicted area of occurrence was impacted by
these bushfires. Threats across this owl’s range are likely leading to a significant loss of
habitat.
The global population of mature individuals has been estimated to be at approximately 7000
individuals (Garnett and Crowley 2000), with 3000-4250 individuals in the core of its range
and 2000-3250 in New South Wales (Garnett & Crowley 2000). Another estimate places the
population in New South Wales at 2000 pairs, with a minimum of 10,000 individuals (Debus
1994; Kavanah 1997). In greater Melbourne, there are estimates of around 30 pairs (Cooke
2020). In urban Sydney the known number of territories has expanded from 50 to over 230
territories since 2011. Whilst some of this population increase can be attributed to greater
monitoring effort, historical indigenous records from the area do not identify the regular
presence of Powerful Owls in the 1940s and earlier, suggesting the urban population increase
is a recent phenomenon (B. Mott, pers. comm. BirdLife July 2020). In Greater Melbourne,
there are estimates of around 30 pairs (N. Bradsworth, pers. comm. Deakin University July
2020).
While the species has shown adaptive ability in utilising degraded and anthropogenic habitats
such as city parks (Isacc et al. 2014), deforestation through logging and bushfires have caused
an ongoing decline in its population (HANZAB 2006; Department of Environment and
Conservation (NSW) 2006; NSW Scientific Committee 2008).
Ecology
Powerful Owls inhabit sclerophyll forests and woodlands, as well as forest edges, plantations
and extensive parklands (Isaac et al. 2008, Olsen et al. 2020). This species frequently favors
dense, well-shaded areas of structurally diverse forest, especially close to gullies or streams,
for roosting (Cooke et al. 2002, Olsen et al. 2020). Eggs are laid in the winter, from May to
June (NANZAB 2006), in the large tree cavities averaging 1 meter wide and 2 meters deep
(NSW Scientific Committee 2008; Cooke 2000). Owls typically select older living trees of
advanced age; breeding pairs in Victoria selected trees between 350 and 500+ years of age
(HANZAB 2006). Diet consists of significant numbers of medium-sized to large mammals,
particularly arboreal species, including Common Ringtail Possums and Greater Gliders
(HANZAB 2006; Cooke & Wallis 2004; Cooke et al. 2006). Powerful Owls predate primarily
arboreal and occasionally terrestrial mammals, as well as bats, birds, and invertebrates
(HANZAB 2006). In Sydney there are several pairs eating mostly rats and rabbits (B. Mott,
pers. comm. BirdLife July 2020). Home range size estimates are extremely varied and are
likely linked to prey availability, from over 4700 ha in box-ironbark forests (Soderquist and
Gibbons 2007) to as small as 338 ha in suburban Melbourne (Bradsworth et al. 2017).
Movement patterns within their home range is heavily dependent on the amount of riparian
vegetation available, with areas of concentrated movement and hunting close to river
systems (Cater et al. 2019).

39
Monitoring
A variety of monitoring has been undertaken at local scales over the years (HANZAB 2006). In
Victoria, research and monitoring of the urban Melbourne population has continued for over
25 years at Deakin University (Cooke et al. 2018). In the broader Sydney region, BirdLife has
run a monitoring program (Bain et al. 2014), which has expanded to Melbourne and Brisbane
in recent years. Generally, there is only opportunistic monitoring throughout most of the
Powerful Owl’s range (e.g. Bilney 2013).
Threats
Trends of deforestation for purposes such as timber, ranching, and settlement expansion
have resulted in loss of habitat for this species (NSW Scientific Committee 2008; Isaac et al.
2013; Cooke et al. 2017). In all, 53% of Powerful Owl forest habitat is estimated to have been
lost (Simmonds et al. 2019). Additionally, the loss of suitable nesting trees through the
logging of large, old-growth stands and replacement with secondary growth and commercial
plantations is likely to contribute to a downturn in the owl’s range and abundance (NSW
Scientific Committee 2008). While the owl has shown itself capable of utilising some human-
altered or artificial habitats (Bradsworth et al. 2017), there still exists the risk of habitat
fragmentation as a result of extensive urban and suburban sprawl (NSW Scientific Committee
2008; Bradsworth et al. 2017; Carter et al. 2019). In the sub-urban environments around
Sydney, mortality due to either collision or electrocution has been estimated to be as high as
20% annually (BirdLife unpublished data). This could be increasing adult mortality past
thresholds that would push local populations toward exponential decline (McCarthy et al.
1999). In the Brisbane region, the amount of clearing for settlement has roughly doubled in
recent years (Technology and Innovation 2015). Within remaining forests there is evidence of
a decline in large, hollow-bearing trees due to past logging activities and repeated prescribed
burning (Eyre 2005; Eyre et al. 2010). Additional risks due to powerline collisions, pesticide or
rodenticide poisoning, and vehicle strikes (Grilo et al. 2020; Slater et al. 2020; Lohr and Davis
2018; Debus and Chafer 1994; NSW Scientific Committee 2008) are also present.
While forest clearing rates have increased dramatically in recent years in Australia (Evans
2016; Reside et al. 2017; Taylor 2015), much of that clearing has taken place outside the
Powerful Owl’s predicted area of occurrence (Evans 2016), with only approximately 1% of
these forests cleared since in the last 17 years (Ward et al. 2019). However, the summer
bush fires of 2019-2020 which burned more than 80,000 km2 of forest, impacted 31.5% of
the predicted area of occurrence of Powerful Owl (Clemens 2020). A separate recent paper
reviewing fire impacts estimated that approximately 23% of Powerful Owl habitat was
impacted (Ward et al. 2020). While we suspect that the recent BirdLife modelling is more
precise as it was focused solely on three species of owls and used predictor variables related
to these species such as forest cover, it highlights the uncertainty regarding the extent of
impact. It is also unclear how variable fire severity throughout these areas might have
resulted in population impacts (Ward et al. 2020), but old hollow-bearing trees would have
likely been at higher risk of being lost to fire (Salmona et al. 2018). Unfortunately, the

40
frequency and severity of fires are likely to be exacerbated by climate change (Cary and
Banks 2000; Williams et al. 2009). Drought-related dieback is also a growing threat associated
with drought and exemplified in Western Australia (Matusick et al. 2013; Hoffmann et al.
2019)
Powerful Owls require large old trees with large hollows to breed. Old growth tree loss will
likely be exacerbated as the climate changes with predicted increasing warm, dry days
leading to up to a 65% increase in fire danger in southeast Australia (Williams et al. 2009).
Increasing fire frequency and severity will likely further reduce available large hollows
(Salmona et al. 2018). Threats to old trees are increasing and include: droughts, fire, pests,
forest clearing for agriculture, road or infrastructure fire breaks, timber harvesting, and
climate change (Lindenmayer et al. 2016). There is a progressive decline in numbers of
hollow-bearing trees in production forests as logging rotations become shorter and as dead
stags collapse (Ball et al. 1999; Lindenmayer et al. 2012).
Table 8. Summary of Powerful Owl threats
Threat Impact Certainty Research priority
Management priority
Management feasibility
Principal source
Fire very high very high high high low Williams, et al. (2009), Salmona et al. (2018)
Drought medium medium high high low Lindenmayer et al. (2016), Matusick et al. (2013)
Climate change very high high high high low Williams et al. (2009)
Forest pests and pathogens
low low high high low Lindenmayer, et al. (2016)
Commercial logging
low medium low low low Taylor 2015
Forest Clearing high high medium high high Evans 2016
Rodenticides low low medium medium high Lohr and Davis (2018)
Automobile collision
medium medium medium low low Grilo et al. (2020)
Electrocution medium medium medium low high Slater, et al. (2020)

41
Australian Greater Sooty Owl Tyto tenebricosa tenebricosa
The following people helped compile the information in the review below: Larry Chen,
Robert Clemens, Nick Bradsworth, Holly Parsons, and Raylene Cooke.
Overview
The Australian Greater Sooty Owl is currently listed as Vulnerable in New South Wales, and
Threatened in Victoria. It is not listed under the EPBC Act, no recovery plan or federal
conservation advice has been drafted. IUCN status is currently at Least Concern and our
review did not uncover sufficient data to change that listing. Combined threats are suspected
to have impacted this species enough for listing, but evidence is lacking.
Table 9. Summary of Australian Greater Sooty Owl population
Metric Estimate Minimum Maximum Reliability Source
Extent of occurrence
177,845 km2 169,000 km2 186,737 km2 Medium This document
Area of Occupancy
115,000 km2 NA NA Medium BirdLife 2020
Number of mature individuals
8,000 4,000 11,500 Medium BirdLife 2020
Generation Time
5.7 4.3 7.1 Low Bird et al. (2020)
Infraspecific taxa
Tyto tenebricosa arfaki of New Guinea is the only other recognised subspecies.
Taxonomic uniqueness: subspecies/species: 2, species/genus: 13, genera/family: 2,
families/order: 2.
Range
The Australian subspecies (tenebricosa) of Greater Sooty Owl (Tyto tenebricosa) is endemic
to eastern and south-eastern Australia, ranging from east-central Queensland south to the
Dandenong and Strzelecki ranges of Victoria (Bruce et al. 2020). Suitable habitat is lacking in
the Hunter Valley, so there appears to be a gap in this subspecies distribution in this area
(NSW Scientific Committee 2008). Subspecies occurs from coastal lowlands west towards the
tablelands and dividing range (NSW Scientific Committee 2008). Majority of range likely
occurs in New South Wales, where more than 5000 birds are estimated to occur (Garnett &
Crowley 2000).
Abundance
The number of mature individuals is suspected to be at around 8,000 based on MaxEnt
predicted area of occurrence divided by a suspected average home range / density (Clemens
2020). Ongoing population decline is inferred from forest clearing (Evans 2016; Bruce et al.
2020), with modelling of recent intense and widespread bushfires in the summer of 2019-20
42
indicating over 40% of this species’ predicted area of occurrence was impacted (Clemens
2020). Threats across this owl’s range are likely leading to a significant loss of habitat. This
species’ difficulty of detection (Bruce et al. 2020) explains how a traditional “area of
occurrence” approach of using a (16 km2) grid over occurrence records results in a much
lower estimated AOO of 4,000 km2, while our MaxEnt approach accounts for survey bias and
doubles the more traditional estimate. The density of Sooty Owl across the range of
predicted suitable habitat is suspected to be lower than a maximum saturation with average
home range sizes, therefore placing the total population at under 10,000 mature individuals.
Ecology
The Australian Greater Sooty favours moist or wet forests, particularly rainforests, moist
eucalyptus forests, and gully forests with a dense mid- and understory (NSW Scientific
Committee 2008; Bruce et al. 2020). Eggs are laid in tree hollows up to 10 meters deep, and
30 centimetres or more in girth (NSW Scientific Committee 2008). Rock crevices and caves
are also used (Bruce et al. 2020). Breeding time varies, though typically between March and
April (HANZAB 2006). Lays 1-2 eggs (Bruce et al. 2020). Carnivorous, taking a range of
mammals, birds, insects, and others (NSW Scientific Committee 2008), though mammals
predominate (Bruce et al. 2020, HANZAB 2006).
Monitoring
A variety of monitoring has been undertaken at local scales over the years (HANZAB 2006).
Monitoring is opportunistic throughout much of the Australian Greater Sooty Owl’s range.
Threats
It is estimated that, historically, 37% of the Australian Greater Sooty Owl’s forest habitat has
been lost (Simmonds et al. 2019). While forest clearing rates have increased dramatically in
recent years in Australia (Evans 2016; Reside et al. 2017; Taylor 2015), much of that clearing
has taken place outside the Australian Greater Sooty Owl’s predicted area of occurrence
(Evans 2016), with only approximately 1% of these forests cleared in the last 17 years (Ward
et al. 2019). However, the summer bush fires of 2019-2020, which burned more than 80,000
km2 of forest, impacted 40.3% of the predicted area of occurrence of Australian Greater
Sooty Owl (Clemens 2020). A separate recent paper reviewing fire impacts estimated that
approximately 38% of Australian Greater Sooty Owl habitat was impacted (Ward et al. 2020).
While we suspect that the recent BirdLife modelling is more precise as it was focused solely
on three species of owls and used predictor variables related to these species such as forest
cover, it highlights the uncertainty regarding the extent of impact. It is also unclear how
variable fire severity throughout these areas might have resulted in population impacts
(Ward et al. 2020), but old hollow-bearing trees would have likely been at higher risk of being
lost to fire (Salmona et al. 2018). Unfortunately, the frequency and severity of fires are likely
to be exacerbated by climate change (Cary and Banks 2000; Williams, Bradstock et al. 2009).
Drought-related dieback is also a growing threat associated with climate change and
exemplified in Western Australia (Matusick et al. 2013; Hoffmann et al. 2019)

43
Greater Sooty Owls require large old trees with large hollows to breed. Old growth tree loss
will likely be exacerbated as the climate changes with predicted increasing warm, dry days
leading to up to a 65% increase in fire danger in southeast Australia (Williams et al. 2009).
Increasing fire frequency and severity will likely further reduce available large hollows
(Salmona et al. 2018). Threats to old trees are increasing and include: droughts, fire, pests,
forest clearing for agriculture, road or infrastructure fire breaks, timber harvesting, and
climate change (Lindenmayer et al. 2016). There is a progressive decline in numbers of
hollow-bearing trees in production forests as logging rotations become shorter and as dead
stags collapse (Ball et al., 1999; Lindenmayer et al., 2012).
Rodenticides (Lohr and Davis 2018), electrocution (Slater, et al. 2020), and automobile
collision (Grilo et al. 2020) are known threats to raptors.
Table 10. Summary of Australian Greater Sooty Owl threats
Threat Impact Certainty Research priority
Management priority
Management feasibility
Principal source
Fire very high very high high high low Williams, et al. (2009), Salmona et al. (2018)
Drought medium medium high high low Lindenmayer et al. (2016), Matusick et al. (2013)
Climate change very high high high high low Williams et al. (2009)
Forest pests and pathogens
low low high high low Lindenmayer, et al. (2016)
Commercial logging
low medium low low low Taylor 2015
Forest Clearing high high medium high high Evans 2016
Rodenticides low low low medium high Lohr and Davis (2018)
Automobile collision
low low medium low low Grilo et al. (2020)
Electrocution low low medium low high Slater, et al. (2020)

44
Southern Masked Owl Tyto novaehollandiae novaehollandiae
The following people helped compile the information in the review below: Larry Chen,
Robert Clemens, Nick Bradsworth, Holly Parsons, and Raylene Cooke.
Overview
The Southern Masked Owl is currently listed as Vulnerable in New South Wales, Threatened
in Victoria, Endangered in South Australia, and a priority taxon in Western Australia. It is not
listed under the EPBC Act, no recovery plan or federal conservation advice has been drafted.
IUCN status is currently at Least Concern and our review did not uncover sufficient data to
change that listing. Combined threats are suspected to have impacted this species enough for
listing, but evidence is lacking.
Table 11. Summary of Southern Masked Owl population
Metric Estimate Minimum Maximum Reliability Source
Extent of occurrence
177,845 km2 169,000 km2 186,737 km2 Medium This document
Area of Occupancy
115,000 km2 NA NA Medium BirdLife 2020
Number of mature individuals
8,000 4,000 11,500 Medium BirdLife 2020
Generation Time
5.7 4.3 7.1 Low Bird et al. (2020)
Infraspecific taxa
Nine subspecies, of which five in Australia (including T. n. galei, T. n. kimberli, T. n.
melvillensis and T. n. novaehollandiae) and four on islands to the north.
Taxonomic uniqueness: very high; subspecies/species: 9, species/genus: 13, genera/family: 2,
families/order: 2.
Range
Southern Masked Owls are found in both far south-west Australia and throughout forests of
southeast Queensland (Olsen 2002, HANZAB 2006). They are most common east of the Great
Dividing Range and are rarely observed more than 300 kilometres from the coast (Garnett
and Crowley 2000; HANZAB 2006). The most records of Southern Masked Owl have been
observed in New South Wales (Garnett and Crowley 2000).
Abundance
The number of mature individuals is suspected to be at around 12,500 based on MaxEnt
predicted area of occurrence divided by a suspected average home range / density (Clemens
2020). Ongoing population decline is inferred from forest clearing (Evans 2016), with recent
modelling of intense and widespread bushfires in the summer of 2019-20 indicating that
40.3% of this species’ predicted area of occurrence was impacted (Clemens 2020). Threats

45
across this owl’s range are likely leading to a significant loss of habitat. Previous estimates of
the number of pairs were up to 400 in Victoria and up to 2000 in New South Wales (HANZAB
2006), with a total Australian population estimate of 7,000 mature individuals (Garnett and
Crowley 2000). The modelled estimates are larger than previous estimates. Southern Masked
Owls are not easy to detect, but they are widely thought to be rare in the wild. They are also
widely distributed in a variety of forests in southeast Australia, so it is possible that modelled
estimates indicate a more even density of distribution than is present.
Ecology
Southern Masked Owl breed and roost in hollows in large trees in a variety of forest types
(Garnett and Crowley 2000). Prey includes a variety of mammals, birds and lizards, but they
principally take terrestrial mammals. Breeding areas are often next to open areas where they
can hunt (HANZAB 2006). Breeding areas are generally associated with riparian areas and
pairs tend to occupy a home range from 5 to 10 km2.
Monitoring
A variety of monitoring has been undertaken at local scales over the years (HANZAB 2006).
Monitoring is opportunistic throughout much of Southern Masked Owl’s range.
Threats
Historically, 28% of Masked Owl forest habitat is estimated to have been lost (Simmonds et
al. 2019), but estimates are not available by sub-species. While forest clearing rates have
increased dramatically in recent years in Australia (Evans 2016; Reside et al. 2017; Taylor
2015), much of that clearing has taken place outside the Southern Masked Owl’s predicted
area of occurrence (Evans 2016), with only approximately 1% of these forests cleared in the
last 17 years (Ward et al. 2019). However, the summer bush fires of 2019-2020 which
burned more than 80,000 km2 of forest, impacted 32.2% of the predicted area of occurrence
of Southern Masked Owl (Clemens 2020). Unfortunately, the frequency and severity of fires
are likely to be exacerbated by climate change (Cary and Banks 2000; Williams, Bradstock et
al. 2009). Drought-related dieback is also a growing threat associated with climate change
and exemplified in Western Australia (Matusick et al. 2013; Hoffmann et al. 2019).
Southern Masked Owls require large old trees with large hollows to breed. Old growth tree
loss will likely be exacerbated under climate change, with predicted increasing warm, dry
days leading to up to a 65% increase in fire danger in southeast Australia (Williams et al.
2009). A separate recent paper reviewing fire impacts estimated that approximately 15% of
Masked Owl habitat was impacted (Ward et al. 2020). However, a larger proportion of this
impact would have been felt by the Southern Masked Owl, as the fires occurred primarily
within this subspecies’ habitat. While we suspect that the recent BirdLife modelling is more
precise as it was focused solely on three species of owls and used predictor variables related
to these species such as forest cover, it highlights the uncertainty regarding the extent of
impact. It is also unclear how variable fire severity throughout these areas might have
resulted in population impacts (Ward et al. 2020), but old hollow-bearing trees would have
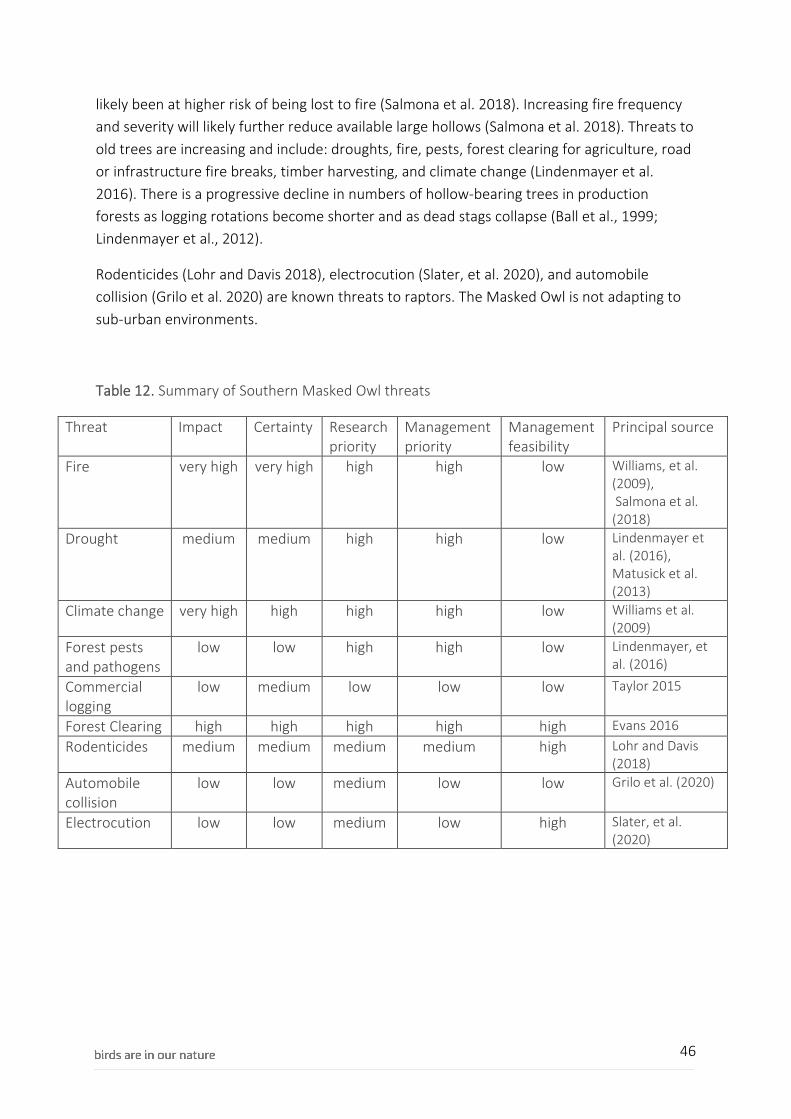
46
likely been at higher risk of being lost to fire (Salmona et al. 2018). Increasing fire frequency
and severity will likely further reduce available large hollows (Salmona et al. 2018). Threats to
old trees are increasing and include: droughts, fire, pests, forest clearing for agriculture, road
or infrastructure fire breaks, timber harvesting, and climate change (Lindenmayer et al.
2016). There is a progressive decline in numbers of hollow-bearing trees in production
forests as logging rotations become shorter and as dead stags collapse (Ball et al., 1999;
Lindenmayer et al., 2012).
Rodenticides (Lohr and Davis 2018), electrocution (Slater, et al. 2020), and automobile
collision (Grilo et al. 2020) are known threats to raptors. The Masked Owl is not adapting to
sub-urban environments.
Table 12. Summary of Southern Masked Owl threats
Threat Impact Certainty Research priority
Management priority
Management feasibility
Principal source
Fire very high very high high high low Williams, et al. (2009), Salmona et al. (2018)
Drought medium medium high high low Lindenmayer et al. (2016), Matusick et al. (2013)
Climate change very high high high high low Williams et al. (2009)
Forest pests and pathogens
low low high high low Lindenmayer, et al. (2016)
Commercial logging
low medium low low low Taylor 2015
Forest Clearing high high high high high Evans 2016
Rodenticides medium medium medium medium high Lohr and Davis (2018)
Automobile collision
low low medium low low Grilo et al. (2020)
Electrocution low low medium low high Slater, et al. (2020)
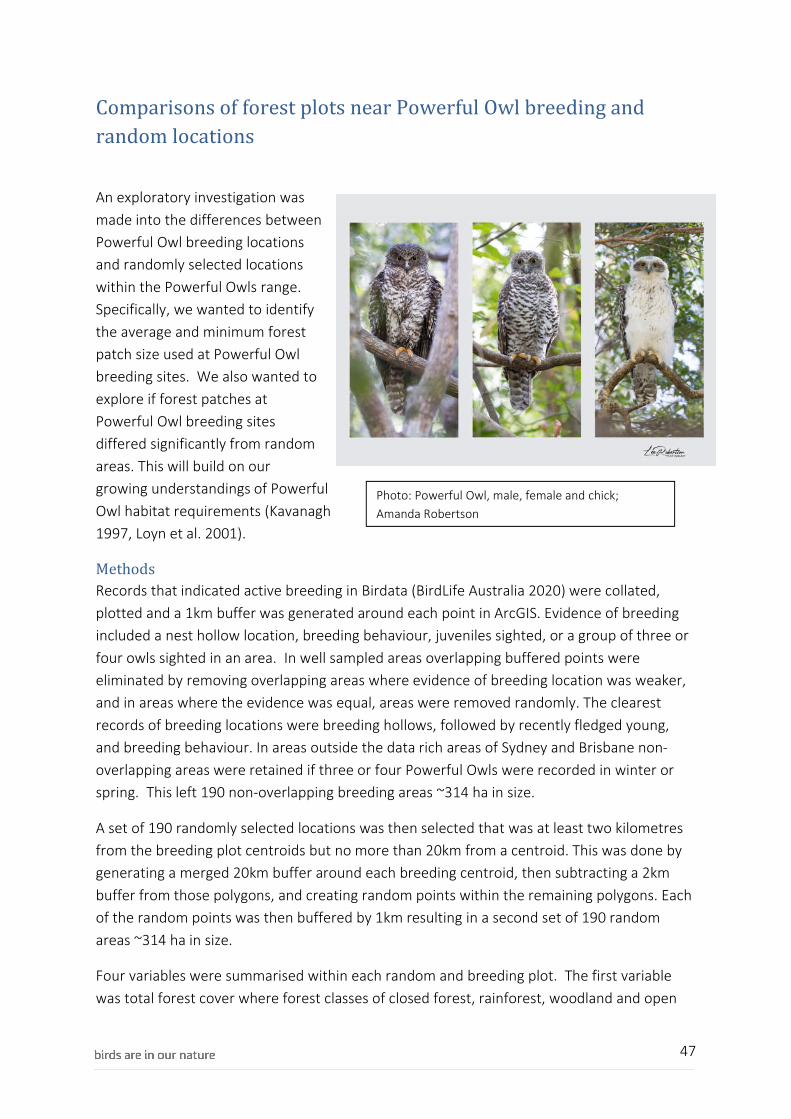
47
Comparisons of forest plots near Powerful Owl breeding and
random locations
An exploratory investigation was
made into the differences between
Powerful Owl breeding locations
and randomly selected locations
within the Powerful Owls range.
Specifically, we wanted to identify
the average and minimum forest
patch size used at Powerful Owl
breeding sites. We also wanted to
explore if forest patches at
Powerful Owl breeding sites
differed significantly from random
areas. This will build on our
growing understandings of Powerful
Owl habitat requirements (Kavanagh
1997, Loyn et al. 2001).
Methods
Records that indicated active breeding in Birdata (BirdLife Australia 2020) were collated,
plotted and a 1km buffer was generated around each point in ArcGIS. Evidence of breeding
included a nest hollow location, breeding behaviour, juveniles sighted, or a group of three or
four owls sighted in an area. In well sampled areas overlapping buffered points were
eliminated by removing overlapping areas where evidence of breeding location was weaker,
and in areas where the evidence was equal, areas were removed randomly. The clearest
records of breeding locations were breeding hollows, followed by recently fledged young,
and breeding behaviour. In areas outside the data rich areas of Sydney and Brisbane non-
overlapping areas were retained if three or four Powerful Owls were recorded in winter or
spring. This left 190 non-overlapping breeding areas ~314 ha in size.
A set of 190 randomly selected locations was then selected that was at least two kilometres
from the breeding plot centroids but no more than 20km from a centroid. This was done by
generating a merged 20km buffer around each breeding centroid, then subtracting a 2km
buffer from those polygons, and creating random points within the remaining polygons. Each
of the random points was then buffered by 1km resulting in a second set of 190 random
areas ~314 ha in size.
Four variables were summarised within each random and breeding plot. The first variable
was total forest cover where forest classes of closed forest, rainforest, woodland and open
Photo: Powerful Owl, male, female and chick;
Amanda Robertson

48
woodland were reclassified into one forest class (ABARES, 2019). Annual rainfall was then
totalled from each plot (Vanderwal, 2012). The average plot elevation was then calculated
from a 9 second DEM (Geoscience 2008). Finally, the length of all streams within each plot
was calculated to represent stream density.
Plots were then imported into RStudio (RStudio Team 2015, R Core Team 2018), data was
then extracted and either totalled, or averaged using the following packages: ‘raster’
(Hijmans 2017), ‘rdgal’ (Bivand et al. 2018), and ‘dplyr’ (Wickham et al. 2019).
Results
Breeding plot had significantly more forest cover, more annual rainfall, and were at lower
elevations than random plots (Figure 8). The density of streams was not significantly different
at breeding and random plots.
Breeding plots had a median of 59% of the plot covered in forest or 187 ha of forest in a 314-
ha plot. Random plots had a median of 21% of the plot covered in forest or 65 ha of forest in
a 314-ha plot. Forest cover in breeding plots ranged from 15 ha to 314 ha, while random
plots ranged from 0 to 314 ha. Only two breeding plots had less than 30 ha of forest, and only
five of the 190 has less than 50 ha of forest. Breeding locations with less than 50 ha of forest
were not places where breeding hollows were identified, so it is possible these locations
were simply ones that juveniles dispersed to soon after breeding. In Queensland, all breeding
locations had more than 50 ha of forest. However, based on Google Earth imagery there
were two locations where the patch of contiguous forest around the breeding hollow was
only ~30-ha in size, but these areas had forested corridors joining the breeding patch to
other larger patches of forest, and housing in the area was low density with many trees. We
did not assess how low-density housing with many trees was classified in the forest layers
and this is something as well as connectivity that should be explored further. Together the
available evidence indicates that breeding in southeast Queensland is unlikely to occur in
areas with less than 50 ha of forest habitat, and is more common in areas where over ½ of
the area is forested.
It was surprising to find that annual rainfall was higher in breeding areas than in random plots
no more than 20km away, but it is likely that forested areas have higher rainfall totals. The
finding that Powerful Owl were found at significantly lower elevations than random sites is
consistent with the idea that Powerful Owl are found predominantly in low-land or bottom
land forest. However, there is scarce sampling for Powerful Owl at higher elevations, so it is
possible that this finding relates to sampling bias. It was also surprising that stream density
was not significantly higher in breeding plots, but this analysis did not distinguish between
streams that flow regularly, and those that are usually dry. We would expect Powerful Owl to
be found more regularly near streams that flow more regularly.

49
We will continue to explore the habitat characteristics associated with breeding sites, and
breeding success. We expect some improvements by only using breeding locations where the
breeding hollow has been located, and by collecting some vegetation data at plots centered
on breeding hollows and random locations.
Figure 8. Comparisons of Poweful Owl breeding plots and random plots 2km to 20 away from
breeding locations all ~314 ha in size. A = comparisons of total forest cover significantly different
Mann-Whitney U p-value < 0.001; B = comparison of totalled annual rainfall significantly different
Mann-Whitney U p-value < 0.001; C = comparison of elevation significantly different Mann-Whitney
U p-value < 0.001; D = comparison of stream density showed no significant differences.

50
Literature Cited
Australian Bureau of Agricultural and Resource Economics and Sciences, 2019. Forests of Australia.
Canberra: ABARES.
Australian Bureau of Statistics 2017. Australian Population Grid. In: Abs (ed.). Canberra.
Barrett, G., A. Silcocks, R. Cunningham and R. Poulter (2002). Comparison of Atlas 1 (1977-1981) and
Atlas 2 (1998-2001): Supplementary Report No. 1. Melbourne, Birds Australia. report for
National Heritage Trust.
Bain, D., R. Kavanagh, K. Hardy, and H. Parsons. 2014. The Powerful Owl Project: Conserving owls in
Sydney’s urban landscape. BirdLife Australia, Melbourne.
Ball, I.R., Lindenmayer, D.B., and Possingham, H.P. (1999) A tree hollow dynamics simulation model.
Forest Ecology and Management 123(2-3), 179-194.
Bennett, J. R., R. Maloney, and H. P. Possingham. 2015. Biodiversity gains from efficient use of private
sponsorship for flagship species conservation. Proceedings of the Royal Society B: Biological
Sciences 282:20142693.
Bilney, R.J., 2013. Home-range, diet and breeding of a Powerful Owl Ninox strenua in East Gippsland,
Victoria. Aust. F. Ornithol. 30, 40–46.
Bird J.P., Martin R., Akçakaya H.R., Gilroy J., Burfield I.J., Garnett S.T,. Symes A., Taylor J., Şekercioğlu
Ç.H,. Butchart S.H., 2020. Generation lengths of the world's birds and their implications for
extinction risk. Conservation Biology DOI: 10.1111/cobi.13486.
BirdLife Australia 2020. BirdLife Australia, Birdata. Occurrence dataset https://birdata.birdlife.org.au/
BirdLife, 2020 unpublished data.
Bivand, R., Keitt, T. & Rowlingson, B. 2018. rgdal: Bindings for the Geospatial Data Abstraction Library.
Boezeman, E. J., and N. Ellemers. 2008. Pride and respect in volunteers' organizational commitment.
European Journal of Social Psychology 38:159-172.
Bradsworth, N., J. G. White, B. Isaac, and R. Cooke. 2017. Species distribution models derived from
citizen science data predict the fine scale movements of owls in an urbanizing landscape.
Biological Conservation 213:27-35. https://doi.org/10.1016/j.biocon.2017.06.039
Brisbane City Council. 2005. Large Forest Owls Conservation Action Statement BCC, Brisbane.
Bruce, M.D., J. S. Marks, and G. M. Kirwan (2020). Sooty Owl (Tyto tenebricosa), version 1.0. In Birds
of the World (S. M. Billerman, B. K. Keeney, P. G. Rodewald, and T. S. Schulenberg, Editors).
Cornell Lab of Ornithology, Ithaca, NY, USA. https://doi.org/10.2173/bow.sooowl1.01
Bulbeck, C. 2012. Facing the wild: Ecotourism, conservation and animal encounters. Routledge.
Bureau of Meteorology 2019. Archive - Six-monthly NDVI Average for Australia. BOM.
Burgas, D., A. Juutinen, and P. Byholm. 2016. The cost-effectiveness of using raptor nest sites to
identify areas with high species richness of other taxa. Ecological Indicators 70:518-530.
Carter, N., Cooke, R., White, J.G., Whisson, D.A., Isaac, B., Bradsworth, N., (2019). Joining the dots:
How does an apex predator move through an urbanizing landscape? Glob. Ecol. Conserv. 17,
e00532. https://doi.org/10.1016/j.gecco.2019.e00532
Cary, G.J., and Banks, J.C. (2000) Fire regime sensitivity to global climate change: an Australian
perspective. In 'Biomass burning and its inter-relationships with the climate system.' pp. 233-
246.
Clemens 2020 unpublished species distribution modelling, BirdLife Australia.

51
Cooke, R., (2000). Ecology of Powerful Owls (Ninox strenua) in contrasting habitats of the Yarra Valley
corridor, Victoria, Australia. Deakin University.
Cooke, R., Wallis, R., and White, J. (2002). Use of vegetation structure by powerful owls in outer urban
Melbourne, Victoria, Australia – Implications for management. Journal of Raptor Research 36,
294-299.
Cooke, R., Wallis, R., (2004). Conservation management and diets of powerful owls (Ninox strenua) in
outer urban Melbourne, Australia. Aust. J. Ecol. 110–113.
Cooke, R., H. Grant, I. Ebsworth, A. R. Rendall, B. Isaac, and J. G. White. 2017. Can owls be used to
monitor the impacts of urbanisation? A cautionary tale of variable detection. Wildlife
Research 44:573-581, 579.
Cooke, R., R. Wallis, F. Hogan, J. White, and A. Webster. 2006. The diet of Powerful Owls (Ninox
strenua) and prey availability in a continuum of habitats from disturbed urban fringe to
protected forest environments in south-eastern Australia. Wildlife Research 33:199-206.
Cooke, R., Hogan, F., Isaac, B., Weaving, M., and White, J. (2018). Powerful owls: possum assassins
move into town. In: Urban Raptors: Ecology and Conservation of Birds of Prey in Cities. Island
Press.
Cooper, C. B., J. Shirk, and B. Zuckerberg. 2014. The Invisible Prevalence of Citizen Science in Global
Research: Migratory Birds and Climate Change. PloS one 9:e106508.
Curtin, S., and G. Kragh. 2014. Wildlife Tourism: Reconnecting People with Nature. Human
Dimensions of Wildlife 19:545-554.
Debus, S. J. S. and Chafer, C. J. (1994) The Powerful Owl Ninox strenua in New South Wales. Australian
Birds 28:S21-S38.
DeMares, R., and K. Krycka. 1998. TRANSPERSONAL ASPECTS. The Journal 30:161.
Department of Environment and Conservation (DEC, NSW) (2006). NSW Recovery Plan for the Large
Forest Owls: Powerful Owl (Ninox strenua), Sooty Owl (Tyto tenebricosa) and Masked Owl
(Tyto novaehollandiae) DEC, Sydney.
Department of Sustainability and Environmet. 2011. Approved Survey Standards: Powerful Owl Ninox
strenua. Victoria.
Duan, S., Towsey, M., Zhang, J., Truskinger, A., Wimmer, J., & Roe, P. (2011, December). Acoustic
component detection for automatic species recognition in environmental monitoring. In 2011
Seventh International Conference on Intelligent Sensors, Sensor Networks and Information
Processing (pp. 514-519). IEEE.
Duchac, L. S., Lesmeister, D. B., Dugger, K. M., Ruff, Z. J., & Davis, R. J. (2020). Passive acoustic
monitoring effectively detects northern spotted owls and barred owls over a range of forest
conditions. The Condor, 122, 1-22.
Dunn, R. R., M. C. Gavin, C. S. Monica, and N. S. Jennifer. 2006. The Pigeon Paradox: Dependence of
Global Conservation on Urban Nature. Conservation Biology 20:1814-1816.
Eccleston, D. T., and R. E. Harness. 2018. Raptor Electrocutions and Power Line Collisions. Pages 273-
302 Birds of Prey. Springer.
Elith, J., S. J. Phillips, T. Hastie, M. Dudik, Y. E. Chee, and C. J. Yates. 2011. A statistical explanation of
MaxEnt for ecologists. Diversity and Distributions 17:43-57.
Estes, J. A., J. Terborgh, J. S. Brashares, M. E. Power, J. Berger, W. J. Bond, S. R. Carpenter, T. E.
Essington, R. D. Holt, and J. B. Jackson. 2011. Trophic downgrading of planet Earth. Science
333:301-306.

52
Evans, M.C. (2016) Deforestation in Australia: drivers, trends and policy responses. Pacific
Conservation Biology 22(2), 130-150.
Eyre, T.J. (2005) Hollow-bearing trees in large glider habitat in south-east Queensland, Australia:
abundance, spatial distribution and management. Pacific Conservation Biology 11(1), 23-37.
Eyre, T.J., Butler, D.W., Kelly, A.L., and Wang, J. (2010) Effects of forest management on structural
features important for biodiversity in mixed-age hardwood forests in Australia's subtropics.
Forest Ecology and Management 259(3), 534-546.
Fourcade, Y., J. O. Engler, D. Rödder, and J. Secondi. 2014. Mapping species distributions with
MAXENT using a geographically biased sample of presence data: a performance assessment
of methods for correcting sampling bias. PLoS ONE 9:e97122.
Franklin, J. 2009. Mapping Species Distributions. Cambridge University Press, Cambridge, UK.
Gagné, S. A., J. L. Bates, and R. O. Bierregaard. 2015. The effects of road and landscape characteristics
on the likelihood of a Barred Owl (Strix varia)-vehicle collision. Urban Ecosystems 18:1007-
1020.
Garner, J. T., and L. T. Garner. 2011. Volunteering an opinion: Organizational voice and volunteer
retention in nonprofit organizations. Nonprofit and Voluntary Sector Quarterly 40:813-828.
Garnett ST, Duursma DE, Ehmke G, Guay PJ, Stewart A, Szabo JK, Weston MA, Bennett S, Crowley GM,
Drynan D, Dutson G (2015) Biological, ecological, conservation and legal information for all
species and subspecies of Australian bird. Scientific data 2, 150061
Garnett, S., and Crowley, G. (2000) The action plan for Australian birds: 2000. Environment Australia
and Birds Australia. CSIRO Publishing, Melbourne, Australia.
Geoscience Australia (2008) GEODATA 9 second DEM and D8: Digital Elevation Model Version 3 and
Flow Direction Grid 2008. Bioregional Assessment Source Dataset. Viewed 20 March 2020,
http://data.bioregionalassessments.gov.au/dataset/ebcf6ca2-513a-4ec7-9323-
73508c5d7b93
Geoscience Australia. 2015. Surface Hydrolog Lines (National) [Online]. Canberra ACT: Commonwealth
of Australia. [Accessed 14/10/2019].
Grilo, C., Koroleva, E., Andrasik, R., Bil, M., and Gonzalez-Suarez, M. (2020) Roadkill risk and
population vulnerability in European birds and mammals. Frontiers in Ecology and the
Environment.
Hager, M. A. 2004. Volunteer management practices and retention of volunteers.
HANZAB. 2006. Handbook of Australian, New Zealand and Antarctic birds, Volumes 1–7, 1990–2006.
Hecker, S., M. Haklay, A. Bowser, Z. Makuch, J. Vogel, and A. Bonn. 2018. Innovation in open science,
society and policy–setting the agenda for citizen science. Innovation in Open Science, Society
and Policy; UCL Press: London, UK.
Hijmans, R. 2017. raster: Geographic Data Analysis and Modeling.
Hoffmann, A.A., Rymer, P.D., Byrne, M., Ruthrof, K.X., Whinam, J., McGeoch, M., Bergstrom, D.M.,
Guerin, G.R., Sparrow, B., and Joseph, L. (2019) Impacts of recent climate change on
terrestrial flora and fauna: Some emerging Australian examples. Austral Ecology 44(1), 3-27.
Hogan, F. (2008). DNA Fingerprinting the Powerful Owl. PHD Thesis. Deakin University.
Isaac, B., R. Cooke, D. Simmons, and F. Hogan. 2008. Predictive mapping of Powerful Owl (Ninox
strenua) breeding sites using Geographical Information Systems (GIS) in urban Melbourne,
Australia. Landscape and Urban Planning 84:212-218.
Isaac, B., White, J., Ierodiaconou., and Cooke, R. (2013). Response of a cryptic apex predator to a
complete urban to forest gradient. Wildlife Research 40, 427 – 436.

53
Isaac, B., Cooke, R., Ierodiaconou., and White, J. (2014). Does urbanization have the potential to
create an ecological trap for powerful owls (Ninox strenua)? Biological Conservation 176, 1-
11.
Ives, C. D., D. J. Abson, H. von Wehrden, C. Dorninger, K. Klaniecki, and J. Fischer. 2018. Reconnecting
with nature for sustainability. Sustainability Science 13:1389-1397.
Kavanagh, R. 1997. Ecology and management of large forest owls in south-eastern Australia.
University of New South Wales.
Kavanagh, R. P. 1988. The impact of predation by the Powerful Owl, Ninox strenua, on a population of
the greater glider, Petauroides volans. Austral Ecology 13:445-450.
Kavanagh, R. P. J. E., and C. o. Owls. 2002. Conservation and management of large forest owls in
southeastern Australia.201-219.
Keniger, L. E., K. J. Gaston, K. N. Irvine, and R. A. Fuller. 2013. What are the benefits of interacting with
nature? International journal of environmental research and public health 10:913-935.
Lacey, A., and S. Ilcan. 2006. Voluntary labor, responsible citizenship, and international NGOs.
International Journal of Comparative Sociology 47:34-53.
Lake Macquarie City Council. 2014. Interim Lake Macquarie Large Forest Owl Planning and
Management Guidelines 2014. Lake Macquarie, NSW.
Law, B.S., Brassil, T., Gonsalves, L., Roe, P., Truskinger, A. and McConville, A., 2018. Passive acoustics
and sound recognition provide new insights on status and resilience of an iconic endangered
marsupial (koala Phascolarctos cinereus) to timber harvesting. PloS one, 13(10), p.e0205075.
Lindenmayer, D.B., Blanchard, W., McBurney, L., Blair, D., Banks, S., Likens, G.E., Franklin, J.F.,
Laurance, W.F., Stein, J.A., and Gibbons, P. (2012) Interacting factors driving a major loss of
large trees with cavities in a forest ecosystem. PLoS One 7(10), e41864.
Lindenmayer, D.B., Blanchard, W., Blair, D., McBurney, L., and Banks, S.C. (2016) Environmental and
human drivers influencing large old tree abundance in Australian wet forests. Forest Ecology
and Management 372, 226-235.
Lohr, M. T., and R. A. Davis. 2018. Anticoagulant rodenticide use, non-target impacts and regulation: A
case study from Australia. Science of the Total Environment 634:1372-1384.
Louv, R. 2011. Reconnecting to nature in the age of technology. The Futurist 45:41-45.
Loyn, R. H., E. G. McNabb, L. Volodina, and R. Willig. 2001. Modelling landscape distributions of large
forest owls as applied to managing forests in north-east Victoria, Australia. Biological
Conservation 97:361-376.
Matusick, G., Ruthrof, K.X., Brouwers, N.C., Dell, B., and Hardy, G.S.J. (2013) Sudden forest canopy
collapse corresponding with extreme drought and heat in a mediterranean-type eucalypt
forest in southwestern Australia. European Journal of Forest Research 132(3), 497-510.
McAlpine, C., R. Fensham, and D. Temple-Smith. 2002. Biodiversity conservation and vegetation
clearing in Queensland: principles and thresholds. The Rangeland Journal 24:36-55.
McCarthy, M., A., A. Webster, R. H. Loyn, and K. W. Lowe. 1999. Uncertainty in assessing the viability
of the Powerful Owl Ninox strenua in Victoria, Australia. Pacific Conservation Biology 5:144-
154.
McNabb, E. 2016. Observations on the biology of the Powerful Owl Ninox strenua in southern
Victoria. Australian Field Ornithology 16.
NSW Scientific Committee. 2008. Powerful Owl Ninox strenua. Review of current information in NSW.
September 2008, Unpublished report arising from the Review of the Schedules of the
Threatened Species Conservation Act 1995. NSW Scientific Committee, Hurstville.

54
NSW Scientific Committee (2008) Sooty Owl Tyto tenebricos. Review of current information in NSW.
September2008. Unpublished report arising from the Review of the Schedules of the
Threatened Species Conservation Act 1995. NSW Scientific Committee, Hurstville.
O’Brien, L., M. Townsend, and M. Ebden. 2010. ‘Doing something positive’: Volunteers’ experiences of
the well-being benefits derived from practical conservation activities in nature. VOLUNTAS:
International Journal of Voluntary and Nonprofit Organizations 21:525-545.
Olsen, J. (2002) 'Ecology and Conservation of Owls.' (CSIRO PUBLISHING)
Pavey, C. (1993) The distribution and conservation status of the Powerful Owl (Ninox strenua) in
Queensland. Australian Raptor Studies’.(Ed. P. Olsen.) pp, 144-154.
Pavey, C. R., A. K. Smyth, and M. T. Mathieson. 1994. The Breeding Season Diet of the Powerful Owl
Ninox strenua at Brisbane, Queensland. Emu - Austral Ornithology 94:278-284.
Pebesma, E. 2018. Simple Features for R: Standardised Support for Spatial Vector Data. The R Jorunal,
10, 439-446.
Pebesma, E. & Rivand, R. 2005. Classes and methods for spatial data in R. R News.
Phillips, S. J. 2017. A Brief Tutorial on Maxent [Online]. Available:
http://biodiversityinformatics.amnh.org/open_source/maxent/ [Accessed 28/10 2019].
Phillips, S. J., Dudík, M. & Schapire, R. E. A maximum entropy approach to species distribution
modeling. Proceedings of the twenty-first international conference on Machine learning,
2004. 83.
Queensland Government Statistician’s Office. 2019. Population growth highlights and trends,
Queensland, 2019 edition Brisbane, Queensland.
Queensland Government. 2018. Remnant vegetation cover - 2017 - Queensland: Department of
Environment and Science. Retrieved from
http://qldspatial.information.qld.gov.au/catalogue/custom/detail.page?fid
R Core Team, 2018. R: A Language and Environment for Statistical Computing Vienna, Austria: R
Foundation for Statistical Computing,.
Rstudio Team, 2015. RStudio: Integrated Development for R. Boston , MA: RStudio Inc,.
Raylene, C., R. Wallis, and A. Webster. 2002. Urbanisation and the ecology of Powerful Owls (Ninox
strenua) in outer Melbourne, Victoria. Ecology and Conservation of Owls:100.
Reside, A.E., Beher, J., Cosgrove, A.J., Evans, M.C., Seabrook, L., Silcock, J.L., Wenger, A.S., and Maron,
M. (2017) Ecological consequences of land clearing and policy reform in Queensland. Pacific
Conservation Biology 23(3), 219-230.
Rodríguez-Estrella, R., C. G. Estrada, S. T. Alvarez-Castañeda, and Y. Ferrer-Sánchez. 2019. Comparing
individual raptor species and coarse taxonomic groups as biodiversity surrogates in desert
ecosystems. Biodiversity and Conservation 28:1225-1244.
Salmona, J., Dixon, K.M., and Banks, S.C. (2018) The effects of fire history on hollow-bearing tree
abundance in montane and subalpine eucalypt forests in southeastern Australia. Forest
Ecology and Management 428, 93-103.
Schlagloth, R., B. Golding, and H. Thomson. 2018. Why is it Important to Use Flagship Species in
Community Education? The Koala as a Case Study. Animal Studies Journal 7:127-148.
Senzaki, M., and Y. Yamaura. 2016. Surrogate species versus landscape metric: does presence of a
raptor species explains diversity of multiple taxa more than patch area? Wetlands Ecology
and Management 24:427-441.

55
Senzaki, M., Y. Yamaura, and F. Nakamura. 2015. The usefulness of top predators as biodiversity
surrogates indicated by the relationship between the reproductive outputs of raptors and
other bird species. Biological Conservation 191:460-468.
Shanahan, D. F., R. Bush, K. J. Gaston, B. B. Lin, J. Dean, E. Barber, and R. A. Fuller. 2016. Health
benefits from nature experiences depend on dose. Scientific Reports 6:28551.
Simmons, B. A., E. A. Law, R. Marcos-Martinez, B. A. Bryan, C. McAlpine, and K. A. Wilson. 2018.
Spatial and temporal patterns of land clearing during policy change. Land Use Policy 75:399-
410.
Simmonds, J.S., Watson, J.E., Salazar, A., and Maron, M. (2019) A composite measure of habitat loss
for entire assemblages of species. Conservation Biology 33(6), 1438-1447.
Slater, S.J., Dwyer, J.F., and Murgatroyd, M. (2020) Conservation letter: raptors and overhead
electrical systems. Journal of Raptor Research 54(2), 198-203.
Soderquist, T., and D. Gibbons. 2007. Home-range of the Powerful Owl (Ninox strenua) in dry
sclerophyll forest. Emu - Austral Ornithology 107:177-184.
Soga, M., and K. J. Gaston. 2016. Extinction of experience: the loss of human–nature interactions.
Frontiers in Ecology and the Environment 14:94-101.
Soga, M., K. J. Gaston, T. F. Koyanagi, K. Kurisu, and K. Hanaki. 2016. Urban residents' perceptions of
neighbourhood nature: Does the extinction of experience matter? Biological Conservation
203:143-150.
Sullivan, B.L., C.L. Wood, M.J. Iliff, R.E. Bonney, D. Fink, and S. Kelling. 2009. eBird: a citizen-based bird
observation network in the biological sciences. Biological Conservation 142: 2282-2292.
Taylor, R. (2015) Saving forests at risk. WWF Living Forests Report.
Technology, Q.D.o.S.I., and Innovation (2015) Land cover change in Queensland 2012–13 and 2013–
14: a Statewide Landcover and Trees Study (SLATS) report.
Terrestrial Ecological Research Network. 2011. Vegetation height and structure - derived from ALOS-1
PALSAR, Landsat and ICESat/GLAS, Australia coverage [Online]. Terrestrial Ecological Research
Network. Available:
https://geonetwork.tern.org.au/geonetwork/srv/eng/catalog.search#/metadata/de1c2fef-
b129-485e-9042-8b22ee616e66 [Accessed 4/09 2019].
The Department of Sustainability and Environment. 2011. Approved Survey Standards: Powerful Owl
Ninox strenua. DSE, Victoria.
Tinati, R., M. Van Kleek, E. Simperl, M. Luczak-Rösch, R. Simpson, and N. Shadbolt. 2015. Designing for
citizen data analysis: A cross-sectional case study of a multi-domain citizen science platform.
Pages 4069-4078 in Proceedings of the 33rd Annual ACM Conference on Human Factors in
Computing Systems. ACM.
Tulloch, A. I., H. P. Possingham, L. N. Joseph, J. Szabo, and T. G. Martin. 2013. Realising the full
potential of citizen science monitoring programs. Biological Conservation 165:128-138.
Valliant, R., and J. A. Dever. 2011. Estimating propensity adjustments for volunteer web surveys.
Sociological Methods & Research 40:105-137.
Vanderwal, J. 2012. All future climate layers for Australia - 5km resolution. James Cook University.
[Data files] jcu.edu.au/tdh/collection/633b4ccd-2e78-459d-963c-e43d3c8a5ca1
Vecina, M. L., F. Chacón, D. Marzana, and E. Marta. 2013. Volunteer engagement and organizational
commitment in nonprofit organizations: what makes volunteers remain within organizations
and feel happy? Journal of community psychology 41:291-302.

56
Wallach, A. D., I. Izhaki, J. D. Toms, W. J. Ripple, and U. Shanas. 2015. What is an apex predator? Oikos
124:1453-1461.
Ward, M.S., Simmonds, J.S., Reside, A.E., Watson, J.E., Rhodes, J.R., Possingham, H.P., Trezise, J.,
Fletcher, R., File, L., and Taylor, M. (2019) Lots of loss with little scrutiny: The attrition of
habitat critical for threatened species in Australia. Conservation Science and Practice 1(11),
e117.
Ward, M., Tulloch, A.I.T., Radford, J.Q., Williams, B.A., Reside, A.E., Macdonald, S.L., Mayfield, H.J.,
Maron, M., Possingham, H.P., Vine, S.J., O’Connor, J.L., Massingham, E.J., Greenville, A.C.,
Woinarski, J.C.Z., Garnett, S.T., Lintermans, M., Scheele, B.C., Carwardine, J., Nimmo, D.G.,
Lindenmayer, D.B., Kooyman, R.M., Simmonds, J.S., Sonter, L.J., and Watson, J.E.M. (2020)
Impact of 2019–2020 mega-fires on Australian fauna habitat. Nature Ecology & Evolution.
Wauchope, H. S., J. D. Shaw, Ø. Varpe, E. G. Lappo, D. Boertmann, R. B. Lanctot, and R. A. Fuller. 2017.
Rapid climate-driven loss of breeding habitat for Arctic migratory birds. Global Change Biology
23:1085-1094.
Webster, A., R. Humphries, and K. Lowe. 1999. Powerful Owl Ninox strenua. Flora and Fauna
Guarantee Action Statement.
Wickham, H., Cheng, X., Yang, Z. & Zhang, S. 2019. dplyr: A Grammar of Data Manipulation.
Williams, R.J., Bradstock, R.A., Cary, G.J., Enright, N.J., Gill, A.M., Leidloff, A., Lucas, C., Whelan, R.J.,
Andersen, A.N., and Bowman, D.J. (2009) Interactions between climate change, fire regimes
and biodiversity in Australia: a preliminary assessment.
Yamaura, Y., M. Higa, M. Senzaki, and I. Koizumi. 2018. Can charismatic megafauna be surrogate
species for biodiversity conservation? Mechanisms and a test using citizen data and a
hierarchical community model. Pages 151-179 Biodiversity Conservation Using Umbrella
Species. Springer.
Zaradic, P. A., O. R. W. Pergams, and P. Kareiva. 2009. The Impact of Nature Experience on Willingness
to Support Conservation. PLoS ONE 4:e7367.

57
Appendix A. Powerful Owl Project Volunteer Survey Results 2020

58
What changes would you like to see in the project? Since all other owls now look outnumbered by Powls it would be great to expand the program to all other owls. I think I would like see survey information from the other surveys in assigned areas such as cabbage tree creek, bunyaville and one mile creek, cashmere
Communication is improving but i would like some support on printing copy of information to deliver to residents etc. The project itself was great!
I rather suggest something in the next season as I just joined the project.
More interaction between those just starting out in the project and those with experience. I know COVID-19 made it difficult for face to face, but there was a lack of interaction at other levels, such as email, online meetings it even phone calls. None
Excellent as is
Totally happy with it. Nothing needs changing.
We are very happy with the project.
More organised survey walks with experienced people
Perfect as is.
None
More information about recording the data and trouble shooting
None that I can think of
Better training, compulsory training and rudimentary certification, more objective and transparent protocols which must be signed off on by all members, more involvement in the development of protocols particularly those pertaining to ethics, somewhat more academic output, much less emphasis on photography on social media groups, better networking including perhaps a dedicated website with portal, significant improvement of the Birdata app (including controls which default to private lists for P Owl project observations), more advanced management structure The BirdData app via which we record our sightings sometimes doesn’t seem to reliably work with all locations (e.g., D’Aguilar NP, or Mt Coot-tha forest don’t come up via the location search). Many times, I’ve gone to enter sightings or calls heard, but the App seems stuck on locations near Sydney- even when I ensure my phone’s GPS is on... Sign up and form filling is cumbersome and not user friendly
more information passed between participants in each small area

59
Covid really killed off my participation this year. Notwithstanding that I would have undertaken more surveys if I had linked up with more people. Get some social benefit. There was always talk of linking up people but it never happened. It is a pretty inconvenient assignment; going out on dusk (dinner time) and not actually doing much walking but going to places that one would not normally walk. None
Perhaps a twice a year meeting of smaller (area-territory) would improve communication and knowledge on a local level. Perhaps a twice a year meeting of smaller (area-territory) would improve communication and knowledge on a local level. Recording of sightings of a known pair is a valid part of the project, rather than surveying for new territories. More volunteers involved.
I would like the project to continue throughout the Summer to learn more of the outcome of owlets (mortality vs survival rates). Nothing to add
Nothing to add
What could we do to increase the benefits of participating? Great project, exceeded any expectations, nothing comes to mind how this could be even better.
I don't think I need additional benefits
Some more support connecting residents and work with government especially QLD
It feels inspiring when I hear or see an owl, so knowing where it is most likely to find an owl
Look for other birds as well once the PO sometimes is not present. It would be a way to keep people engaged.
More interaction
More events once covid allows to bring more people together
No extra benefits needed
Nothing
Have several organised local surveys after the training
Happy as is.
None
Have a T Shirt for the project.
Perhaps some personal accounts of joys of seeing the owls
Certification for members who complete training and familiarise themselves with protocols, opportunities for official middle management positions
Set up a private FB page
be more informative with what was seen/heard in each survey area
Doing a good job now.
As mentioned, I think encouraging closer contact with other participants in a smaller area or by suburb, for instance, West Logan, East Ipswich, McDowell etc. would bring benefits.
Some organised field trips to known nest sites
Add extra hours to the day - you guys are great, life is a struggle, wish I could help more
More workshops
I would very much like to have a positive sighting
End of season social gathering perhaps (though difficult to implement at the current time)
End of season social gathering perhaps (though difficult to implement at the current time)
More group meetings :)

60
What kind of further field training would you like? Once first owl is found no further training needed.
I'm good - just being able to ask questions of Rob/Matt/Jasmine is enough
How to use the recording machine
Identification of material in pellets
Recognize better PO environment and used resources (trees that would work as a nest). It would be nice to try to set up a quiz with the different birds and calls so we could feel more confident to identify species.
More on identification of calls, types of hollows to look for and other nocturnal animals
Habitat I guess
Would like to know more about calls of other night creatures that I might hear when I am in the field
Learning skills to help us identify other birds we see or hear on our surveys would be very helpful.
More walks with people who know how to find the owls
NA
None
Are we allowed off tracks?
Not applicable
Field training needs to be more formalised, should be compulsory, and trainees must be assessed much more thoroughly for their understanding.
Go out with experienced spotters
None
I think more, maybe shorter field visits could be considered. For example, visit a site that contains some wash to show the general layout of the areas the Owls like to roost could be of assistance. It has been my experience that newer researchers concentrate too much on trying to spot the Owls roosting instead of looking for signs they are actually in the area first.
bush safety e.g. snake bite response.
Capacity to form local groups
Just more info grams in emails
To accompany experienced researchers on field trips. More workshops.
Nothing to add
Nothing to add
Some recordings of Baby Powerful Owls

61
What have you learned from the project? It was an eye opener. Before visiting first workshop I was of an opinion Powerful Owls are rare and impossible to find, as opposed to Southern Boobooks, but in fact in Redlands I now there are more Powls than any other owl.
a lot about p'owl behaviour and calling (and other ninox owls) and what constitutes p'owl habitat.
Where to look for powerful owl.
A lot about owls, and a deeper understanding of the natural areas that I've surveyed in.
The importance of communication with everyone involved in the project, whether it be in the field or in volunteer engagement. Patience; more often than not having to hear signs of Powerful Owl presence later in the evening. Tracking/problem solving; having to observe canopy coverage with types of trees, other bird behaviours, creek direction, whitewash and feathers to find the likely location of the owls. The importance of following a survey/data entrance routine. How to Identify different species within each forest.
Habits of PO and other nocturnal birds.
That there are different owls which can be identified by calls as well as visible features.
Powerful owl info.
Everything about the owls
So much about owls!
Patience
Did learn some information about owls
Powerful owls are difficult to spot
Pretty much everything we know about owls.
More about birds, owls especially. The range of places they can be found in.
Different owls, bird behaviours, different birds,
More about nesting habitat to look out for
That there are far more Powerful Owls in SEQ than previously thought
Powerful owl habitat and behaviour including breeding times
Patience
That the Owls are initially hard to find but once found I think a pattern of observing them can be worked out without intruding too much on their territory.
Bird calls, how to spot POWLS.
More aware of the ecology of my local pair of owls
About different types of aussie owls
Learning about habitat and owl territories amongst many other things.
The timing of owlets fledging
Owl ecology and habits
Owl ecology and habits
Trees

62
Is there anything else you would like to learn? Purely, because I am Redlands local, I would like to know if there are any other owl active?
I'd like to know more about how and why they communicate with each other
Interact with residents nearby of the habitat and spread awareness of the owl habitats.
How the occurrence of every animal species or vegetation type helps each other and how they influence Powerful Owl occurrence
No
More on the daily routine of the owls
Nothing in particular that can't be discovered through further field work.
Unsure - probably more about the relationship between owls, environment and protection
No
The best way to find owls
How long should we continue to monitor the group after the young have fledged? Is it better to just note where they appear to have settled while teaching the young, before separating, and moving back towards the nest tree for the breeding season or do we still need to study them in the “in between period†before they start the mating season again?
Where they nest and how we can secure future nesting options.
Always learning and open to new experiences.
More about owlets after fledging.
Nothing to add
Nothing to add
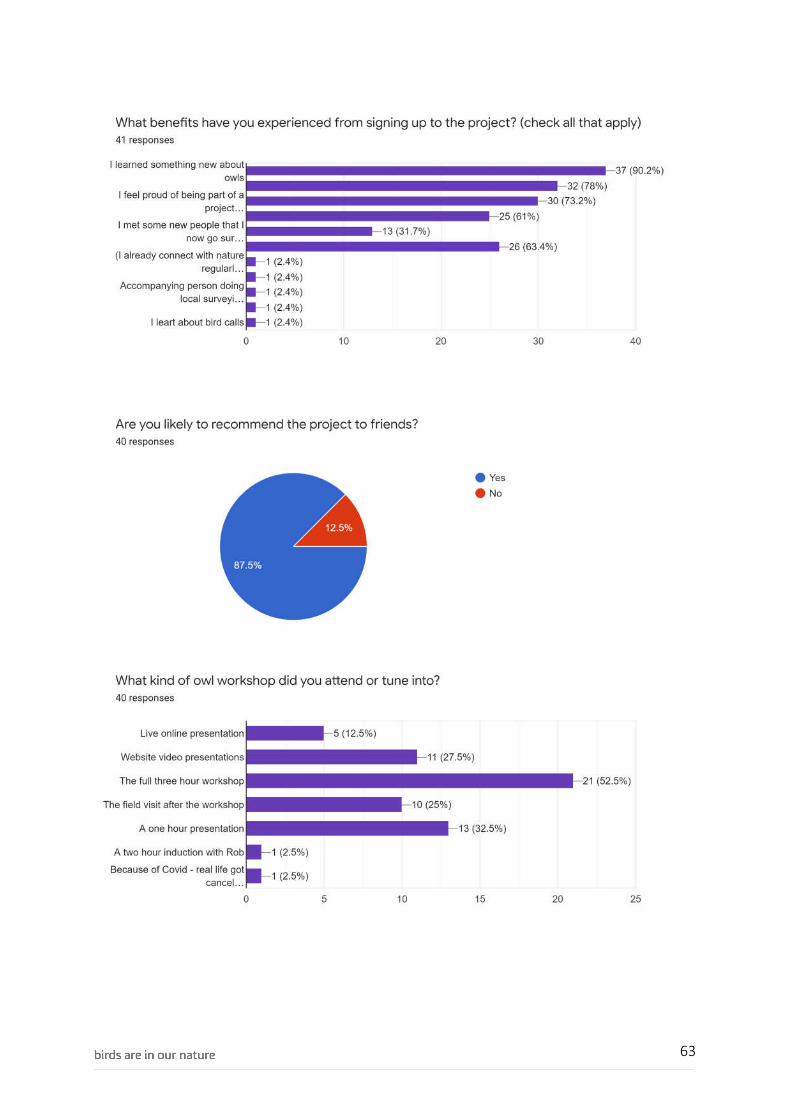
63
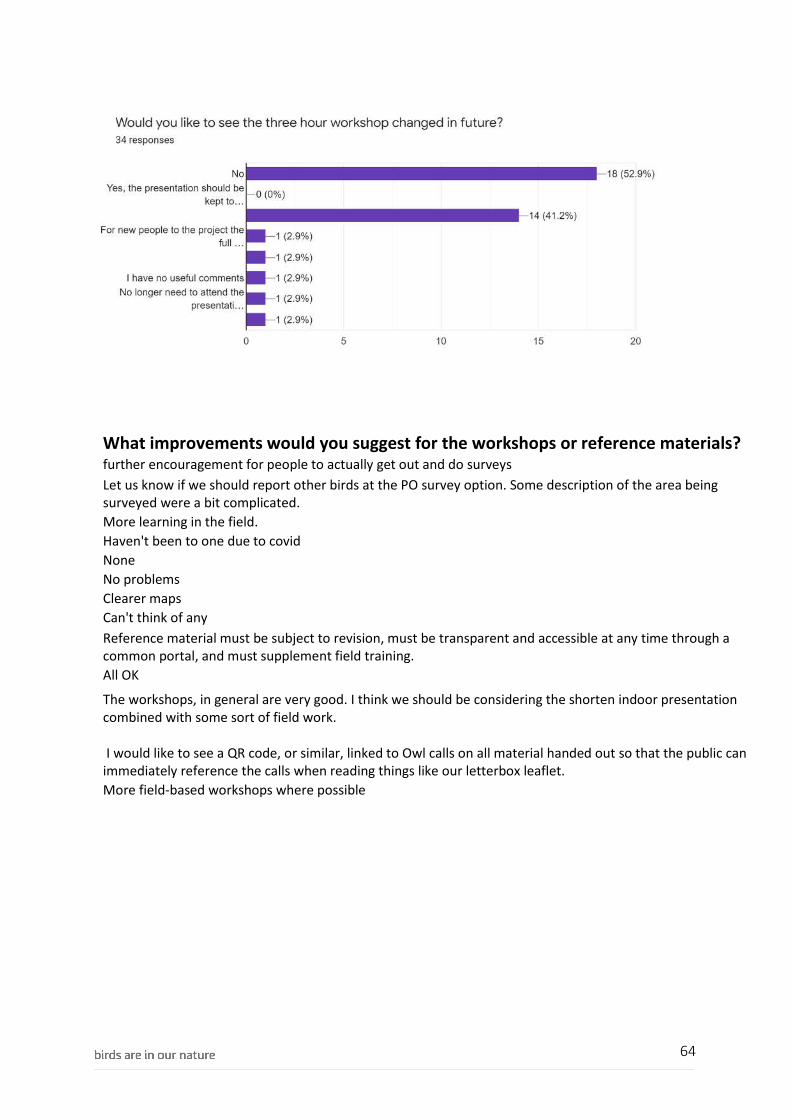
64
What improvements would you suggest for the workshops or reference materials? further encouragement for people to actually get out and do surveys
Let us know if we should report other birds at the PO survey option. Some description of the area being surveyed were a bit complicated.
More learning in the field.
Haven't been to one due to covid
None
No problems
Clearer maps
Can't think of any
Reference material must be subject to revision, must be transparent and accessible at any time through a common portal, and must supplement field training.
All OK
The workshops, in general are very good. I think we should be considering the shorten indoor presentation combined with some sort of field work. I would like to see a QR code, or similar, linked to Owl calls on all material handed out so that the public can immediately reference the calls when reading things like our letterbox leaflet.
More field-based workshops where possible

65