power system operation and control design for combined
TRANSCRIPT

GEOTHERMAL TRAINING PROGRAMME Reports 2012 Orkustofnun, Grensasvegur 9, Number 17 IS-108 Reykjavik, Iceland
329
POWER SYSTEM OPERATION AND CONTROL DESIGN FOR COMBINED GEOTHERMAL AND WIND DIESEL POWER
GENERATION ON NEVIS, WEST INDIES
Jonathan A Kelly Nevis Electricity Company Ltd.
P.O. Box 852; Pinney’s Commercial Site Charlestown NEVIS W.I.
ABSTRACT
Electricity is presently generated on the island of Nevis by a combination of a 12.3 MWe diesel power plant and a 2.2 MWe wind-farm. The island presently has a peak demand of approximating 9.5 MWe. With a conscious drive towards becoming less dependent on fossil fuels for power generation and seeking to reduce the cost of electricity, it is proposed that geothermal power will be added to this energy mix within the next three years. It is necessary, however, to take a well-structured approach towards this geothermal integration, wherein a holistic assessment is taken of the existing power generation and distribution infrastructure with the view of how geothermal power can be best utilized; adjustments to the existing power system may be necessary to achieve this goal. This report carries out such an assessment, highlights the areas for improvement and ultimately proposes a centralized operation and control system that would enable the Nevis Electricity Company Ltd. to unify the operation and control of all three generating stations, and the transmission and distribution grid in the most economical and ergonomic way possible.
1. INTRODUCTION Nevis is a 93 km2 Caribbean island, located in the Lesser Antillean island chain, which together with the island of St Kitts forms the federation of St Christopher and Nevis (St Kitts and Nevis). The island economy is based on tourism and offshore banking services, and has been negatively impacted by the global economic downturn observed since 2008. In commonality with every other country in the world, the availability of a reliable cost effective electricity supply on the island of Nevis is a driver for economic growth; hence, in recent years the Nevis Island Administration (NIA) has placed major emphasis on lessening the dependency on costly fossil fuels used for power generation, and seeking to exploit available renewable energy resources. To date, two major thrusts have been made in this direction with geothermal and wind energy projects.

Kelly 330 Report 17
Being one of the volcanic islands formed along the Atlantic and Caribbean plate boundary, the island has geothermal surface manifestations such as fumaroles and a hot spring which is regularly utilised for bathing by locals and tourists alike. Such manifestations, in conjunction with geological surveys that were conducted on the island, have led to the conclusion that Nevis has a significant geothermal energy resource. In 2007, the NIA granted exploration and developmental rights to West Indies Power Holdings (WIPH) for conducting geothermal exploration and development on the island of Nevis. In 2008, WIP successfully drilled and flow tested 3 test wells (Figure 1), with the results shown in Table 1.
TABLE 1: Results of test wells
Well Date Depth
(m) Pressure
(bar) Temperature
(°C) Nevis 1 June 2008 1065 6.8 250 Nevis 2 July 2008 732 14.5 260 Nevis 3 October 2008 899 17.9 232
These test wells further confirm the abundant geothermal potential of Nevis and further indicate the resource is located at fairly shallow depths. To date, however, no further development in regards to this project has taken place. Notwithstanding, as the demand for sustainable cost effective renewable energy remains real on this island, it is expected that in the near future a geothermal power plant will be constructed and operated on Nevis. In 2010, the Independent Power Provider (IPP) Windwatt Ltd., installed and commissioned a 2.2 MW grid tied wind-farm in Nevis. As the island is bordered by the Atlantic Ocean, it receives significant trade winds along the eastern coast. This wind project is the second major thrust towards harnessing renewable energy for electricity production, and since commissioning, has contributed on average 6% to the total annual energy production. Since its commissioning, however, the operation of the wind-farm in conjunction with the existing diesel power plant has been prone to some difficulties, due mainly to the stochastic nature of wind power generation and the consequent impact on grid stability during periods of high wind energy penetration. With future plans for tandem wind-diesel and geothermal power generation, it is therefore necessary to consider optimal methodologies for operation and control of these three generation sources. For the purpose of this project, an introspection of the existing power generation and distribution systems, their dynamics, problems and needs, was first carried out to create a basis for justifying the implementation of the proposed operation, the control system and methods.
FIGURE 1: Map of Nevis showing locations of test wells

Report 17 331 Kelly
2. OVERVIEW OF EXISTING POWER GENERATION AND DISTRIBUTION SYSTEMS NEVLEC (Nevis Electricity Company Ltd.) is the sole electrical utility on the island of Nevis and was formed in September 2000 as a subsidiary of the NIA. Prior to the formation of NEVLEC, the electrical utility services were operated by the Nevis Electricity Department (NED) of the NIA. Predating 2010, there had never been any IPP’s in operation on the island. The power generation and distribution infrastructure has continuously evolved and improved over the decades to meet the changing electricity demands of Nevis. 2.1 The diesel power plant
Ever since electricity was introduced to the island, the primary mode of generation has been by medium-speed diesel engine driven generators. Since the commissioning of the Prospect power station (PPS) in 1983, there have been incremental increases in installed capacity, to reach a present day total of 12.3 MW. Present day plant operations have become increasingly costly, to the extent that approximately 90% of the annual operational budget is dedicated to fuel and lubricants. In addition to burgeoning fuel costs, two of the six existing generators are rapidly approaching the end of their life cycle, as indicated by Table 2.
TABLE 2: NEVLEC Prospect power station diesel engine generator data
Engine name
Manufacturer Engine
type/model No. of
cylindersSpeed(RPM)
Capacity (kW)
Eff. capacity
(kW)
Year of installation
Unit No. 3 Mirrlees Blackstone ESL-8-MKII 8 900 900 600 1983 Unit No. 4 Mirrlees Blackstone ESL-16-MKII 16 900 2,000 1,850 1989 Unit No. 5 Mirrlees Blackstone ESL-16-MKII 16 900 2,200 2,200 1996 Unit No. 6 Mirrlees Blackstone ESL-16-MKII 16 900 2,500 2,500 1995 Unit No. 7 General Motors 16-645-HF4B 16 900 2,500 2,500 1997 Unit No. 8 Wartsila 9R32LN 9 720 2,700 2,700 2002
The operation and maintenance cost of these generators increases annually as they age, and there is a general reduction in engine efficiency as more fuel and lubricants are consumed per kWh generated. 2.1.1 Diesel plant operation and control systems
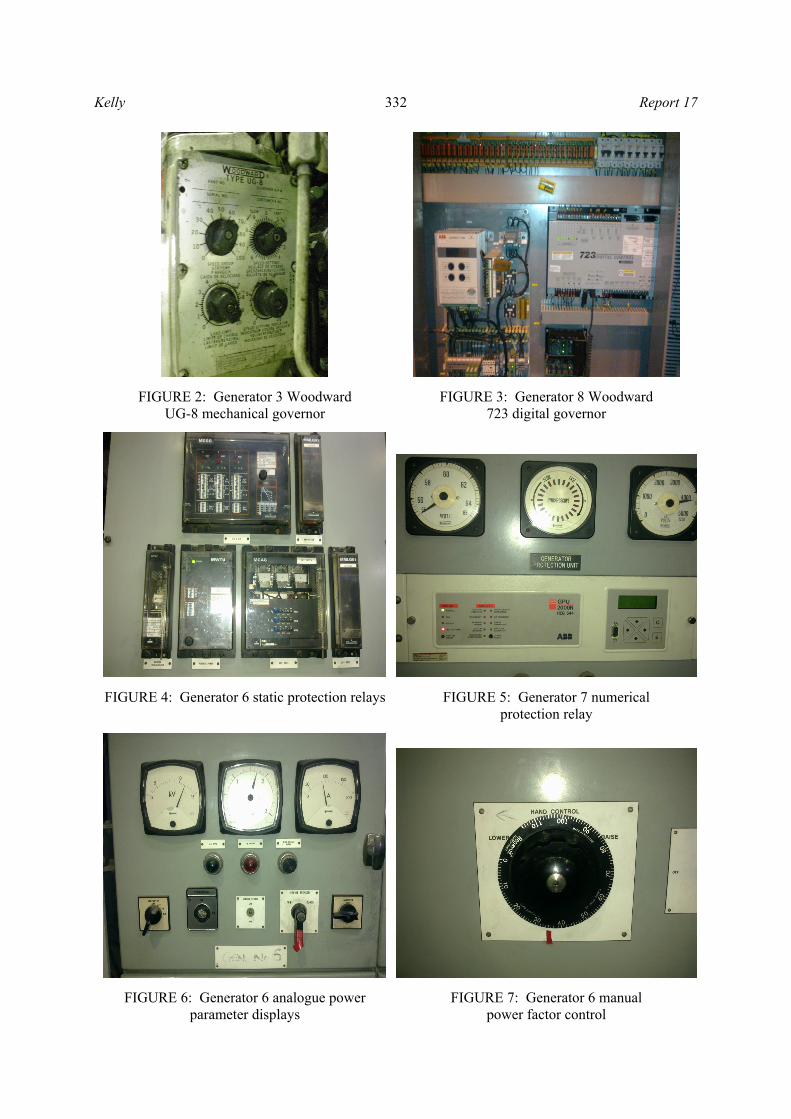
Over the 29 year operation of the PPS, several technological advancements in regards to generator control systems have been observed with each new generator installation. One significant change has been from fundamental mechanical governing systems to electronic and digital governors, as shown by Figures 2 and 3, respectively. Similar technological improvements have also occurred in areas of generator protective devices as shown in Figures 4 and 5, respectively. The normal operation and generation dispatch scheme sees generator 8 set at a fixed 2.6 MW output while the other five generators contribute to the remaining system demand in droop mode. Apart from the more recently installed generators 7 and 8, the other four generators require intensive operator input in regards to regulating the parameters of active and reactive power, voltage and power factor in response to changes in system demand. Such control is normally achieved through monitoring analogue displays and making changes with control devices, as shown in Figures 6 and 7.
Kelly 332 Report 17
FIGURE 2: Generator 3 Woodward UG-8 mechanical governor
FIGURE 3: Generator 8 Woodward 723 digital governor
FIGURE 4: Generator 6 static protection relays
FIGURE 5: Generator 7 numerical protection relay
FIGURE 6: Generator 6 analogue power parameter displays
FIGURE 7: Generator 6 manual power factor control

Report 17 333 Kelly
Generators 7 and 8 utilise modern graphical human machine interfaces (HMI) and supervisory control and data acquisition (SCADA) systems interfaced with programmable logic controllers (PLC) to control generator power parameters. Figure 8 shows a screen grab of generator 8’s Wartsila Operator Interface System (WOIS) which allows remote control of this generator. 2.2 Wind power generation The wind power generation on Nevis is provided by eight grids tied to 275 kW Vergnet GEV MP, an asynchronous induction generator wind turbine. This total wind-farm output of 2.2 MW can have a penetration rate ranging from approximately 24 to 40% of the present system demand at the peak and off peak periods, respectively.
FIGURE 9: Graph of electricity generation on Nevis, July 2010 - July 2011
The graph in Figure 9 shows the wind contribution to the total system energy consumption for the first year of operation. Between the months of January and February 2011, a significant reduction in diesel generation can be seen. This was due to high wind availability during these months. A scheme to maximise the use of available wind is discussed in Section 5 of this report. The significant difference in total demand shown between July 2010 and July 2011 is due to a major consumer, the Four Seasons hotel, being closed at the time of the wind-farm commissioning. In December 2010, however, the hotel reopened; hence, a significant increase in demand is observable. Initially during the PPA discussions for this project, it was agreed that the acceptable nominal power output from the wind-farm would be 1.1 MW with a maximum of 1.6 MW at any given time. However, after commissioning, in an effort to offset diesel consumption with wind generation, it was deemed possible to accept up to 2.2 MW during periods of sustained wind gusts.
FIGURE 8: Generator 8 Wartsila Operator Interface System (WOIS) HMI & SCADA

Kelly 334 Report 17
In as much as this acceptance of 2.2 MW of wind power was with good intent, as the wind-farm to grid’s interconnection is void of any storage or buffering mechanisms, significant instantaneous variations in the output of the wind-farm within a given hour resulted in grid stability issues, mostly observed at instances of minimum demand. Such instances of high wind penetration resulted in an undesirable grid over frequencies beyond the nominal 60 Hz. Several solutions have been considered for this problem while endeavouring to maintain earnings for the IPP at the expected return on investment (ROI) rates. To date, grid stability is being maintained by using diesel generator spinning reserves to compensate for any dips in output, and also reducing the number of turbines online during minimal demand hours. Considering that this project was approached with the intention of lessening the fuel surcharge that is added to the consumer energy charges, this methodology of diesel spinning reserves and reduction of wind-farm output has not proven most effective in achieving the stated goal. Section 5.1 of this report offers suggestions for increasing wind energy penetration. 2.2.1 Wind-farm operation and control
Presently, the wind-farm is monitored and controlled remotely at the NEVLEC Prospect power station. This remote control functionality is facilitated via a digital subscriber line (DSL) linked to a virtual private network (VPN) between the Prospect power station and the wind-farm. Figure 10 shows the operational screen where operators can observe in real time the wind speed and power output of each turbine. NEVLEC plant operators have the ability to reduce or increase the wind-farm output kW set point.
FIGURE 10: Screen shot of Windwatt wind-farm SCADA
It has been observed, however, that setting the total output lower than the generation capacity can have an adverse effect on the turbine pitching systems. In instances of surges in grid frequency due to high wind penetration, it was decided that the set point would remain at 2.2 MW and output would be reduced by stopping individual turbines until stability was achieved. 2.3 Power distribution network There presently exits no power transmission network in Nevis. Rather, power is distributed throughout the island via a five feeder overhead line (OHL) 11 kV radial network, which has the possibility of forming an outer ring of the two longest rural feeders as shown in Figure 11.

Report 17 335 Kelly
FIGURE 11: Existing NEVLEC distribution network All generators at the PPS feed into an 11 kV bus which then powers the distribution network, having various low voltage (LV) transformation levels and configurations to meet domestic and commercial consumer requirements. Each distribution feeder is isolated from the grid via ABB vacuum circuit breakers, type Unigear VD4, with ABB SPAJ 140 C numerical protection relays providing over-current and earth fault protection. Spurs and sections along each feeder are mostly isolated and protected via fast blow k-type cutout fuse mechanisms with fuses sized to operate at calculated fault currents per section. A few load break switches (LBS) are located on larger feeders. The maximum demand and other statistics are shown in Table 3.
TABLE 3: NEVLEC distribution feeder data
Feeder Maximumdemand (MW)
Overhead line length
(km)
Overhead line type
Overhead line capacity
(MW) Charlestown 1 2.7 6.84 AAAC Alliance (4/0) 6.4 Charlestown 2 0.4 3.48 AAAC Alliance (4/0) 6.4 Cotton Ground 2.4 17.7 AAAC Hazel (2/0) 3.3 Gingerland 2.5 19.8 AAAC Alliance (4/0) 6.4 Four Seasons Hotel 1.9 5.64 3/.147 Copper 2.5
Four Seasons Hotel Feeder
Cotton Ground Feeder
Charlestown 1 Feeder
Charlestown 2 Feeder
Gingerland Feeder
Windwatt Windfarm
NEVLEC Prospect Power
Station
WTG-8
WTG-1
LEGEND
Diesel Power Generation
Cutout Fuse Switch
Circuit Breaker
Wind Turbine
Circuit Termination

Kelly 336 Report 17
The data shown above indicates that, of the five feeders, Cotton Ground and Four Seasons will soon need upgrading in conductor size and type as the present demand is approaching line capacity limits. 2.3.1 Power distribution network operation and control Excluding the main circuit breakers at the power plant, there presently exist no other distribution network automated control systems. The WOIS functions mainly for monitoring, control and data recording for the Wartsila engine, but also includes a display of feeder circuit breaker status as shown (Figure 12). Monitoring of the power demand of the two largest feeders, Charlestown 1 and Gingerland, is also facilitated by this interface. This operator interface does not, however, permit remote opening or closing of the feeder circuit breakers. Such operations would have to be done manually from the feeder control board with mimic diagram as shown (Figure 13).
FIGURE 12: WOIS feeder status display
FIGURE 13: Distribution feeder control panel
The present distribution network operation is highly dependent on contact and coordination via phone calls between plant operators and linesmen, to facilitate network maintenance and emergency procedures when necessary. Presently, no efforts towards power distribution network automation have been made. 2.4 Nevis island load profile The typical diurnal and annual load profiles for Nevis are illustrated in Figures 14 and 15. Figure 14 shows clearly that on a typical day there are two main instances of peak demand:
During the daytime hours of 9 am to 3 pm, when activity in the central business district areas are highest.
Between 6-8 pm just after sunset when street lights turn on. Nevis, being a tropical island, has no seasonal variations in power demand due to space heating requirements; rather, the variations are due to proliferated usage of air conditioning and refrigeration systems during the summer months. In this regard, for the year 2011 the maximum system demand recorded was 9.35 MW in the month of June, as shown in Figure 15. Being a prime tourist destination, Nevis is home to 9 hotels. Hence, the seasonal fluctuations in load are also related to variations in hotel occupancies, in particular at the Four Seasons Resort Hotel which is also the largest single power consumer on the island.

Report 17 337 Kelly
FIGURE 14: Typical daily load profile of Nevis
FIGURE 15: Nevis island monthly maximum power demand for 2011 Being a prime tourist destination, Nevis is home to 9 hotels. Hence, the seasonal fluctuations in load are also related to variations in hotel occupancies, in particular at the Four Seasons Resort Hotel which is also the largest single power consumer on the island. 2.4.1 Load forecast
Should geothermal development on Nevis prove successful, it is expected that there will be a subsequent reduction in the cost of electricity and the removal of fuel charges presently included with energy charges. Such a reduction in the cost of electricity will stimulate socio-economic development and may foster economic diversification from being solely tourism-based to the inclusion of light manufacturing industry. A significant growth in demand is, therefore, predicted. Irrespective of geothermal development, however, the island load is forecasted as shown in Figure 16. Notwithstanding any immediate plans for manufacturing industries to start operating on the island, the forecasted increase in system demand is due to:

Kelly 338 Report 17
Future plans exist for several other major hotelier developments ranging in sizes similar to the Four Seasons resort.
In August 2012, construction commenced for an 80-100 slip marina project which, on completion, should increase electricity demand.
Construction of domestic dwellings will increase incrementally as the economy slowly recovers from the impact of global recession.
FIGURE 16: Graph showing forecasted maximum power demand for Nevis (Nexant, 2010)
3. JUSTIFICATION FOR IMPROVEMENTS TO GENERATION AND DISTRIBUTION SYSTEMS The introduction of the wind-farm to the power generation regime in Nevis commenced the shift from centralised to distributed generation. Considerations for geothermal integration to this mix makes it now incumbent on NEVLEC’s power system planners to incorporate present and future technologies in their designs to embrace the opportunities and benefits presented by geothermal power generation. However, for each of the aforementioned sections of the existing system, there are areas that need improvement and problems that could be addressed with a novel system design. 3.1 Summary of main areas for improvement It is arguable that most imminent improvements are related to the need for better protection and network automation and control at NEVLEC. Also considering the future plans for integrating geothermal into the generation mix, a well thought and executed plan would have to be made for improvements in the protection, control and operation systems to maximize operability and increase reliability.
a) Problems with grid protection selectivity. Under existing conditions grid faults sometimes propagate to the main distribution bus thereby causing tripping of generators. Fault isolation on the grid is minimal as fuse reaction times are slower than feeder protection relays. Hence often there are total feeder interruptions due to grid faults.
b) Coordination with linesmen. The present distribution network operation is highly dependent on contact and coordination via cellular phone calls between plant operators and linesmen, to facilitate network maintenance and emergency procedures when necessary.

Report 17 339 Kelly
c) Fault location and isolation. Feeder faults are at times not located without a repetitive process of manually opening and closing each spur and section after numerous feeder trips.
d) Communication reliability. There have been instances when there is a loss of communication between wind-farm and the PPS due to repairs or failures of the DSL link that permits remote monitoring and control. It has also occurred that such link downtime coincided with peak wind gusts and minimum system demand when control of the wind-farm is crucial. Such cases have highlighted the realistic need for redundant communications networks and grid automation systems to remotely isolate a distributed generator such as the wind-farm at the point of grid connection if necessary.
e) Security of supply. Significant consumers such as the airport, hospital and Four Seasons Hotel can be adversely affected from repetitive power interruptions due to feeder faults. Though such consumers normally have standby or backup generators installed to improve security of supply, dependency on these can be risky. Also purchasing and maintaining backup power generators incurs a significant cost to the consumer.
f) Unsatisfactory utilisation of wind farm. The island power demand profile is not evenly distributed hence minimum demand coincides with periods of highest wind availability between the hours of 11 pm and 4 am. During this period of minimum demand, grid frequency fluctuations from wind-farm operation are most observable. Present scheme to solve issue is to reduce wind-farm output and balance with diesel spinning reserve. Though it is a solution, wind power is not being maximised.
g) Inadequate stability of grid voltage and frequency. Distribution system voltage and frequency control presently requires intensive manual set point adjustment especially when older existing diesel generators are online at PPS.
In addition to the above Conductor overload needs to be dealt with. Cotton Ground and Four Season feeders need upgrading in conductor sizes as they are rapidly approaching load limits. 3.2 Possible improvements to the power generation and distribution systems For the main existing problems outlined in Section 3.1 the following possible solutions can be considered:
a) Problems with grid protection selectivity. Integration of distribution grid automation, control and protective devices such as autoreclosers and sectionalizers to reduce propagation of faults back to power plant and to improve fault location and rectification methods. The minimisation of fault propagation by these devices would thus reduce the number of grid fault power interruptions experienced by NEVLEC´s consumers.
b) Coordination with linesmen. Devices such as autoreclosers and sectionalizers also permit remote isolation of grid sections thereby reducing requirements for linesmen to travel distances to perform switching and isolation procedures during emergency or maintenance situations. Distribution grid automation would therefore also improve power dispatch and coordination between system operators and linesmen.
c) Fault location and isolation with aid of SCADA system. The monitoring and control of the distribution network and power plant dispatch should be unified under a central 24 hour supervisory control and data acquisition (SCADA) operation command. This command should have the functionality to remotely operate grid automated isolation and protective devices as mentioned in the previous point.
d) Communication reliability. All stations should be linked via redundant communication paths and include microwave or satellite links to ensure operators can have control over all generation stations at all times.
e) Security of supply. Restructuring of distribution network to provide redundant or alternative paths to significant consumers such as Four Seasons hotel, hospital and the airport to reduce occurrences of power loss due to grid maintenance, or fault situations.

Kelly 340 Report 17
f) Unsatisfactory utilisation of wind farm. Deployment of smart grid technologies and implementation of a ‘green energy’ tariff to encourage consumers to utilise off peak periods when wind penetration is highest thereby flattening load profile and improving optimization of renewables especially wind energy.
g) Inadequate stability of grid voltage and frequency. Establishment of a stable base load generation plant would reduce voltage and frequency fluctuations and be a reliable quality power source such as the proposed geothermal power plant.
In addition conductor overload needs to be dealt with, with re-conductoring of feeders approaching load limits. 3.2.1 Measures to improve the security of the supply Power system reliability The intention to develop renewable power generation to reduce the cost of electricity in Nevis is likely to attract light manufacturing and other power intensive industries to the island. In light of the foreseeable diversification of the island’s power generation and consumption base, it is imperative that NEVLEC take the necessary measures to ensure the reliability of the power supply. Frequent and sustained interruptions of the power supply inconveniences consumers and can pose severe technical and production problems to industrial installations. In such instances, the power utility also incurs a significant loss of revenue. Machowski et al. (2008) provided an outline to ensure high reliability of the supply by:
High quality of installed elements; The provision of reserve generation; Employing large interconnected power systems capable of supplying each consumer via
alternative routes; A high level of system security.
Based on these points, it is clear that the proposed improvements to the NEVLEC power system must use quality components certified by relevant authorities. Guidelines and codes for operation would have to be put in place to ensure the quality of the equipment to be utilised by IPP‘s connecting to the grid. In regards to geothermal power developers, such codes would stipulate the acceptable performance parameters of turbine generators connected to the grid, thereby ensuring no compromise of system reliability. The third and fourth points bolster the justification for a distributed generation infrastructure in Nevis, linked by a robust grid which has its operation and control facilitated by intelligent adaptable electronic devices and systems. Power quality Machowski et al. (2008) define a high quality electrical energy supply as one having the following characteristics:
Regulated and defined voltage levels with low fluctuations; A regulated and defined value of frequency with low fluctuations; Low harmonic content.
During the commissioning and testing stages of the wind-farm, it became clearly evident that there was an urgent need for power quality regulations and a grid code, to be formulated and enforced for IPP‘s operating in Nevis. Presently there is no statutory requirement regarding the permitted variation of the declared system’s frequency. Statutory requirements for permitted voltage variation are also lacking. Methods for ensuring such high quality include the use of automatic voltage and frequency control methods and utilizing large stable generation systems, such as geothermal plants, which are less susceptible to voltage fluctuations and other power disturbances. The proposed interconnection of the geothermal, wind and diesel plants will significantly improve system frequency and voltage stability.

Report 17 341 Kelly
3.3 Necessity for improvements before integration of geothermal power It is possible to restart and resynchronise diesel generators to the grid within minutes after a trip resulting from a grid fault. Geothermal plants, however, are best operated under base load conditions and can take up to an hour to be returned to grid operation and full load due to the differing thermal and mechanical characteristics compared to diesel generators. It would, therefore, be necessary for distribution network faults to be isolated at the point of occurrence as best as possible to minimize the likelihood of tripping the geothermal plant. In addition, the existing load profile for Nevis would require a geothermal plant to vary its output according to peaks and troughs in system demand. This, however, is not best suited for geothermal turbine generators; hence, the island load profile should be flattened as best as possible to accommodate base load geothermal power generation, and peaking by diesel generators or wind where necessary. Section 5 discusses such power dispatch scenarios integrating all three sources.
4. PROPOSED POWER GENERATION AND DISPATCH OPERATION AND CONTROL SYSTEM Having examined the existing NEVLEC power generation and distribution infrastructure, and identified the necessity for improvements, a frame work of proposals can now be established. 4.1 Proposed system requirements
The following system requirements were extracted from the solutions proposed in Section 3.2 with the view that when the system is constructed accordingly, it should solve the issues raised in the introductory discussion and system overview. These requirements should also present NEVLEC with a system tailored for the future integration of geothermal power. Communication link: The system must link the main functional points as shown on the map in Figure 17. It must also link grid substations, automation points and devices. A wireless backup communication network must exist to permit control of all major systems in the event of loss of the wired system. Central power dispatch control: The system must permit centralised remote control of all
FIGURE 17: Image showing main points to be integrated for proposed operation and control system

Kelly 342 Report 17
generation stations but also have functionality for local site control. The system must dispatch power to NEVLEC’s consumers in the most effective manner, seeking to minimize generation related outages and improve reliability to major and priority loads. Distribution network automation: The system shall incorporate automated devices to provide isolation and protective functions for the NEVLEC distribution network. Feeders must be designed with multiple switching configurations to allow fault isolation or to accommodate maintenance, while minimizing the impact of the outage to as small an area as possible. Redundancy: All critical system components must be redundant and have readily available spares. Security: The system shall be designed to restrict unauthorised access and control of power generation and distribution processes. Attacks from viruses and malware shall be prevented or mitigated as possible. Operation or control of any section of the infrastructure must be restricted to a single point at any given time. Switching and lockout procedures must be implemented. The system must also be robust enough to remain operational through a hurricane. Expandability: The system must be able to be easily expanded and integrated into a larger system if future demands exceed Nevis’s current capacities. 4.2 General available topology for operation and control
Modern technologies facilitate the possibility for centralized control of remotely distributed power generation, transmission and distribution processes under Supervisory Control and Data Acquisition (SCADA) systems. A typical energy generation operation and control system would consist of several subsystems committed to specific tasks. Such subsystems can include:
Supervisory Control and Data Acquisition systems (SCADA), o Master terminal units (MTU), o Remote terminal units (RTU);
Energy management systems (EMS), o Generation management systems (GMS);
Distribution management systems (DMS), o Outage management systems (OMS), o Network asset management.
The proliferation of these systems in modern industrial and utility based processes has been due to the significant technological and economic advantages that they provide. Such advantages include:
Ability to achieve operational targets and goals as efficiently and reliably as possible; Reducing human error and losses; Improved safety measures; Faster system restoration after power outages; Enabling the acquisition of real-time performance data for analysis for application to
improvement models and performance reports; Unification of process control under a central command, thereby optimizing labour force size; Information gained from the energy operations to be integrated into a SCADA business
management system (BMS).
4.2.1 SCADA system SCADA systems have varying complexities depending on the process being monitored and controlled; fundamentally, however, they consist of software based management systems integrating:

Report 17 343 Kelly
Master terminal units (MTU); Remote terminal units (RTU); Process management equipment; Communications quipment.
Figure 18 shows the main components of a typical SCADA system.
FIGURE 18: Typical SCADA system (Controlmanuals.com, 2012) 4.2.2 Communication system It is necessary for SCADA systems to have a communications network, linking distributed and remote operations to a central command centre. Due to the critical importance of power utility systems, it is necessary for such networks to have redundant communication paths to reduce the risk of loss of monitoring and control during normal operations. Typically, utility SCADA system communications are facilitated via:
Fibre optic networks; Microwave radio networks; Power line carriers (PLC); Broadband network; Public telephone network.
4.2.3 Protocols There exist several industry standard communication protocols which are suitable for power system SCADA and automation systems. The International Electrotechnical Commission (IEC) 61850 is an example of one such protocol which can be inherently integrated with several other protocols. These protocols can run over TCP/IP wide area networks (WAN) or substation LANs using high-speed switched Ethernet to obtain the necessary response times below four milliseconds for protective relaying.

Kelly 344 Report 17
The IEC 61850 protocol is touted by several automation manufacturers for having an excellent track record as the established communication standard on the worldwide market for the automation of substations. Along with its benefits for diversity for integration with other automation communication protocols, the IEC 61850 replaces the older system architecture of wiring between feeders, control switches and signalling devices. For each generation site local area network, there will exist a particular communication protocol that may function on a copper or fibre based Ethernet communication infrastructure. At the PPS for example, G7 control devices are linked via Modbus plus protocol on a combination of RS485 and Ethernet LANs. The wider area fibre linked network would utilise a protocol dedicated to distribution system management such as the IEC 61968-1. 4.2.4 SCADA web access features Web browser based software packages are now made available for integration with human machine interfaces (HMI) and SCADA systems. The diagram in Figure 19 shows the typical setup for enabling web access. These systems enable user flexibility wherein a worker can monitor system processes from remote locations such as home.
Implementing web based external access points in a control system, however, introduces elements of security risks. Recent attacks on industrial infrastructure, such as by the Stuxnet virus, have highlighted vulnerabilities in industrial process control networks and associated hardware. To reduce such risk, it would be necessary to include firewalls and protected servers as indicated in the system in Figure 19. Another possible option would be to have a portable network backup client computer that is kept isolated from the network at all times, but completely updated and configured with all control system configurations and protocols. In the event of a top level system compromise, this backup client could be connected to the local terminal unit and used for operation and control, thereby reducing downtime. 4.3 Main operational and control devices for integration
Before a detailed system is designed, consideration must be given to the existing operational and control devices that are available for inclusion, and also future devices. Table 1 in Appendix I lists the various existing control system devices used for the wind-farm and the sections of the prospect power station being considered for this project. 4.3.1 NEVLEC Prospect power station
As generators 7 and 8 are using the Modbus protocol to communicate between protective, control devices, plc‘s and operating systems, it would be possible to integrate such into a larger control system.
FIGURE 19: SCADA web access structure (Broadwin Technology, Inc., 2012)

Report 17 345 Kelly
Integrating the remaining four engines to a remote system would require significant control and monitoring equipment upgrades. Considering that these engines are rapidly approaching the end of their life cycles, the cost of such upgrades cannot be easily justified by possible benefits gained. Also, considering that it is expected that the proposed geothermal plant will absorb the majority of the base load, these engines are likely only to be used during periods of geothermal plant maintenance and for peak load if absolutely necessary. The conceptual design of the operation and control system for this project will, therefore, only consider integrating G7 and G8 into the larger proposed system. These engines would be kept on warm standby for rapid start and synchronisation when necessary. However, modifications would have to be made to pre-heating systems on these engines, as presently they cannot attain full load conditions without a gradual run up process, wherein temperatures of cooling and lubricating systems are gradually raised as the engine operates. Generator 7 control devices Generator control is achieved by the integration of the devices listed for G7 in Appendix I Table 1, as demonstrated in the schematic shown in Figure 20. The figure demonstrates that generator 7 can be remotely monitored and controlled by interfacing with the Sixnet programmable gateway, RTU ST-IPM-1350. This device interfaces Citect SCADA software for control and monitoring various generator processes. According to the product data sheet, this device can communicate via several protocols including: Ethernet TCP, Modbus and OPC. Sixnet now lists this device as a legacy product, which means it will not be upgraded but still manufactured and serviced. Though Sixnet previously designated the ST-IPM-13850 as an End of Life (EOL) product, the recent acquisition of Sixnet by Red Lion Business Inc. has ensured continued product support for the customer base.
FIGURE 20: Generator 7 main control system components

Kelly 346 Report 17
Taking this company commitment to support for the IPM controller, it is possible to consider this device usable for the future. However, as business markets are volatile and prone to rapid changes, it may be best to upgrade the control system on Generator 7 to use products from well-established suppliers that can guarantee product support over its lifetime. Section 7.1 of this report further discusses control system life cycles prerequisites and further supports this argument. Generator 8 control devices Generator 8 operations control is achieved through the interoperation of the devices listed in Appendix I Table 1, as shown in Figure 21.
FIGURE 21: Generator 8 main control system components
Research into Original Equipment Manufacturers (OEM) for devices listed in Appendix I has indicated that the existing control and protection system devices support existing and, in some cases, future communication protocols. On average, control systems tend to require major upgrades after approximately a 20 year life span. Upgrades are normally driven by unavailability of spare parts and service support, and also increased demand for functionality and interoperability with emerging devices and systems that the existing devices eventually cannot provide. By this rule of thumb, G8 would be due for an upgrade in 2020. However, it is possible that OEM support for products can extend this life cycle. Typically, the Human Machine Interface (HMI) components of a control system will require more frequent upgrades due to the shorter life span of components and regular updates for software and firmware. In 2007, for example, the G8 WOIS was upgraded from a Windows 2000 based pc to a Windows XP pc running the most recent version of the WOIS software. It is expected that another upgrade to the WOIS will be conducted within the next decade.

Report 17 347 Kelly
Presently, however, the WOIS software permits only operator level interaction from the NEVLEC staff. Administrative privileges are reserved for Wartsila personnel only. In as much as the proposed control and operation system will integrate G8 with other generation systems, Wartsila will have to play an integral role in facilitating modifications to the G8 control interface to permit the proposed integration. Load sharing capabilities between G7 and G8 As both of these generators are equipped with Woodward governors, it is possible to enable automatic load sharing between G7 and G8. Woodward governors can communicate via the local operation network (LON) protocol. Presently, this functionality is not in use. Communication lines would need to be established between the G7 DSLC and the G8 723 governor. Substation The 11 kV switch gear, associated control and protection devices listed in Appendix I, Table 1 are the primary isolation and control components of the PPS substation. The ABB product line of numerical protection relays being utilised at the PPS substation is suitable for larger system integration. As the existing feeder switch gear (Figure 22) are of ABB type Unigear VD4, automation control devices and systems originating from the same manufacturer would be well suited for integration. Also, considering that ABB has a reputable standing in the automation and control market and considering the availability of regional support offered to Caribbean based customers, the use of equipment from this manufacturer is a suitable choice. Generally, however, control system packages are marketed with similar functionality and protocols conforming to standards such as IEC 61850, regardless of the manufacturer. Hence, products and systems from any of the major control and automation system market players such as ABB, Alstom or Schneider Electric can be used.
FIGURE 22: Substation switchgear There presently exists no transmission system, only a power distribution system on Nevis. Hence, the substation switch yard at the PPS is void of transformers or any automated switching devices, and is of a rudimentary design utilising pole mounted fuses for line protection and isolation. Figure 23 shows the five feeders leaving the PPS via overhead lines. 4.3.2 Windwatt wind-farm
The Siemens control system at the wind-farm utilizes ET200S and S7-300S RTU’s communicating on a CP 342-5FO Profibus network. The Micom P127 protection relay and the PLC devices enable control of wind turbines
FIGURE 23: Five 11 kV feeders leaving PPS via overhead lines

Kelly 348 Report 17
and substations. All devices are modern and have the ability to be integrated into a larger control system. 4.3.3 Main geothermal plant operation and control components
From an operational and control perspective, a geothermal plant can be grouped into two main systems: Thermo mechanical systems Comprising all systems involved in transporting geothermal fluid from the production well, converting steam pressure and flow into electrical energy via steam turbine and then cooling and disposal of the condensed fluid after completing mechanical to electrical energy conversion process. The general sequence for a geothermal power plant and the key thermo mechanical system components are illustrated in Figure 24.
FIGURE 24: General sequence of processes for a geothermal power plant (DiPippo, 2012)
Each stage of the process illustrated in Figure 24 includes monitoring, protection and control systems. At the plant site, monitoring and control of all processes, as illustrated above, is necessary to ensure reliable operation and proper power generation dispatch. Remote generation system dispatch operators, however, would be primarily concerned with monitoring and control of the turbine generator operation, leaving monitoring of the other mechanical and geothermal field processes to the localized plant operators. Within the geothermal plant there would exist a dedicated turbine protection, monitoring and control system consisting of:
Governor control; Vibration and temperature monitoring; Turbine mechanical protection.
In order to remotely monitor and control a geothermal turbine, this system must be interfaced with and integrated from a local area network into a wide area network leading to the central command centre. It would still be necessary, however, to locally monitor all protection system alarms to ensure proper response in the event of an emergency. Electrical systems These include all communication, control, auxiliary, and main power generation and distribution systems of the geothermal power plant. Each system is characterised by voltage level, current and conductor size. Systems common to geothermal power plants include:

Report 17 349 Kelly
Generator automatic voltage regulation (AVR); Generator excitation; Generator synchronisation control; Generator electrical protection; 110 Vdc and UPS systems; 400 Vac transformation and distribution systems; 11 kVac bus systems; Substation automation and protection; Local area communication network; Heating ventilation and air-conditioning (HVAC).
Of this list, in commonality with the approach taken for the thermal plant components, control of all systems would not be necessary from the remote perspective. In this regard, parameters of primary importance to remote power system despatch operators would include:
Generator power output (active, reactive); Generator power factor (Cos phi); Generator voltage (V); Generator frequency (Hz); Generator total energy generated (MWh); Generator protection relay status; Generator breaker position; 11kV bus voltage and frequency; Total plant output; Substation circuit breakers status; Transmission or distribution feeder protection relay status; Transformer protection relay status; Individual feeder load.
The relevant geothermal plant system devices that would permit remote monitoring and control of the above listed parameters would be integrated into a wider area network linking all power generation sites to a central power system control and despatch location. 4.4 Proposed transmission and distribution system design
The proposed system design shall constitute the following sections, arranged according to the diagrams shown. Each stage of the design is subject to the requirements stipulated in Section 5.1. 4.4.1 Transmission network
The proposed transmission line from the geothermal plant to the Prospect power plant shall be structured as shown in Figure 25. This transmission will function for transmitting base load power from the geothermal station at 33 kV back to the PPS distribution point where it will be transformed to 11 kV and distributed. A voltage of 33 kV has been chosen over 11 kV to permit mass power transfer while minimising losses and avoiding larger conductor sizes that would be needed for the same power transfer at 11 kV. Redundancy has been incorporated into this design by utilising equally sized transformer pairs for 11-33 kV transformation and vice versa on all transmission routes originating from the geothermal plant bus bar. It is arguable that such a design may be costly, however, in the event of a transformer failure, the cost of replacing a transformer with a lead time of more than 6 months, would be exceeded by the cost of powering the island by diesel generators for that same period.

Kelly 350 Report 17
It is, therefore, more economical to have redundant transformer pairs where in the event of a single transformer failure, base load geothermal power can still be supplied to the grid, and diesel generation can then be kept at a minimum. The same justification has been applied to incorporating redundant 33 kV underground cables into this design. Consideration has also been given to the future supply of approximately 30 MWe to the neighbouring island, St. Kitts. As St. Kitts’ power demand exceeds that of Nevis, the size requirements for the transformer would be greater. This design could unify both the St. Kitts and Nevis 33 kV lines to one bus bar fed from step-up transformers, sized for the demand of both islands. However, considering St. Kitts will be powered via a submarine cable, the project verification and time frame would hinge on other factors such as cable laying and PPA’s between the IPP and the St. Kitts Electricity Company (SKELEC). Taking this into consideration, emphasis has been placed on supplying geothermal power to Nevis in the initial project deployment.
Also, as geothermal plant output can decline over years of operation due to pressure drawdown in the reservoir, the best approach would be to prove the operational pattern through reservoir monitoring for several years before seeking to increase the power output. Therefore, expansion to the supply power to St. Kitts from the Spring Hill geothermal field should only be done once the field has been proven capable of sustaining such a demand. Having taking the aforementioned points into consideration, the transmission network has, therefore, been designed to keep the St. Kitts and Nevis transmission paths separate. 4.4.2 Power generation and distribution network
The generation and distribution network shall be designed as shown in Figure 26, with automation functions provided by auto recloser and sectionalizer devices (Figure 27). The highest concentrations of these devices are located on the Gingerland and Cotton Ground feeders because:
These are the longest feeders on the island and have the capability of forming a ring. Automated switching devices will permit options for various configurations to facilitate line maintenance or isolate faults to a minimal impact area, thus increasing system reliability.
Both feeders are rural and pass through areas of dense foliage. Normally, during the hurricane season, several nuisance trips occur on the Cotton Ground feeders. Utilising auto reclosers and sectionalizers will reduce the likelihood of tripping the complete feeder and will allow isolating the fault to a more precise location.
In keeping with the system prerequisites of minimising outages to priority consumers and loads, several novel configurations have been included in the distribution network design. Alternate feeder paths have been mapped, leading from the Spring Hill geothermal plant to the Cotton Ground and Four Seasons
FIGURE 25: Proposed transmission line design
Spring Hill Geothermal Plant 11kV Bus Bar
NEVLEC Prospect Power Station 11kV Busbar
11kV
33kV
11kV
33kV
33kV Transmission Line to St Kitts
11kV
33kV
33kV Transmission Cable

Report 17 351 Kelly
FIGURE 26: Proposed power distribution network for Nevis
feeders, thereby ensuring the possibility of powering the Newcastle airport and Four Seasons hotel directly from the geothermal plant, in the event of a service disruption from the Prospect power station. In order for the proposed design to be implemented, significant upgrades to the existing network hardware will be necessary. Proposed future feeders and automation equipment would require modifications to the existing substation at PPS and training and equipment for line maintenance and operation personnel. 4.4.3 Proposed control system architecture The control system architecture, as shown in Figure 28, will provide control and operation of all generation stations and the distribution network. The key requirements for an electrical utility control system are:
WTG-1
WTG-8
Windwatt Windfarm
DG-3 DG-8 DG-n
NEVLEC Prospect Power Station
33kV Line to St Kitts
Spring Hill Geothermal
Power Station
GTG-n
GTG-1
Busbar A Busbar B
Busbar A
Busbar B
11kV
11kV
11kV 33kV
11kV
33kV
33kV Transmission Line
FOUR SEASONS FEEDER
FOUR SEASONS HOTEL CHARLESTOWN 1 FEEDER
COTTON GROUND FEEDER
CHARLESTOWN 2 FEEDER
GINGERLAND FEEDER
XX
X
X X X X
XX
X
X
X
X
X
LEGEND
X
EXISITING 11kV FEEDER
FUTURE 11kV FEEDER
FUTURE 33kV TRANSMISSION LINE
TRANSFORMER
GTG
WTG
DG DIESEL GENERATOR
WIND TURBINE GENERATOR
GEOTHERMAL TURBINE GENERATOR
CIRCUIT BREAKER
ISOLATOR
AUTOMATED CIRCUIT ISOLATION & PROTECTIVE
DEVICE
I
FIGURE 27: Auto recloser and feeder protection and control device (ABB, 2012)

Kelly 352 Report 17
Equipment redundancy for higher availability;
Control of all generation and distribution infrastructure from central location;
Remote monitoring of plant processes;
Rapid fault location and isolation; Communications network; Web access; Cyber security; Historical data logging.
The design in Figure 28 seeks to provide unified control of the existing and future generation and distribution infrastructure on the island of Nevis by incorporating key components into a flexible, redundant multi levelled system. The hierarchical structure is comprised of three main levels:
Local station control, wherein the plant can be operated and controlled by onsite operators. This is reflected in the design above by the presence of operator consoles and HMI’s at each of the power plants and grid substations.
Remote control, wherein plant automation devices are integrated through redundant Programmable Automation Controllers (PAC) into a fibre optic based WAN, to a remote station that has identical system monitoring and control interfaces as the local plant. The design above shows this site being the central NEVLEC SCADA command centre. The ability to monitor and control all generation and distribution infrastructures is indicated by multiple operator screens and redundant servers at this location.
Backup operation: In the event of both local and remote control systems being compromised, for example due to infection by malicious code similar to the Stuxnet virus, a separate backup operating system could be deployed at the localized plant site to provide system restoration. In the design above, this backup functionality is indicated by the portable operator console (POC).
FIGURE 28: Proposed control system
OS1
OS2
OS3
CH
AR
LEST
OW
N 1
FE
ED
ER
P
RO
TEC
TIO
N
AN
D C
ON
TRO
L
PA
C L
AN
STA
TIO
N L
AN
FEED
ER
CO
NTR
OL
HM
I
98
5
IM 36
4
IM
210
11
CP
2
PL
C
1
PS
0
CP
3
CP
2
PL
C
1
PS
0
CP
3
OS1
VE
RG
NE
T SC
AD
A
SIEM
ENS
ET 2
00
SR
TU
SIEM
ENS
S7 3
00
SR
TU
CP
2
PL
C
1
PS
0
CP
3
CP
2
PL
C
1
PS
0
CP
3
98
5
IM 36
4
IM
210
11
CP
2
PL
C
1
PS
0
CP
3
CP
2
PL
C
1
PS
0
CP
3
98
5
IM 36
4
IM
210
11
CP
2
PL
C
1
PS
0
CP
3
CP
2
PL
C
1
PS
0
CP
3
Device
MIC
OM
P1
27
PR
OTE
CTI
ON
RE
LAY
EATO
N H
OLE
C
MV
SWIT
CH
GEA
R
CO
NTR
OL
PA
C L
AN
STA
TIO
N L
AN
98
5
IM 36
4
IM
210
11
CP
2
PL
C
1
PS
0
CP
3
CP
2
PL
C
1
PS
0
CP
3
98
5
IM 36
4
IM
210
11
CP
2
PL
C
1
PS
0
CP
3
CP
2
PL
C
1
PS
0
CP
3
98
5
IM 36
4
IM
210
11
CP
2
PL
C
1
PS
0
CP
3
CP
2
PL
C
1
PS
0
CP
3
OS1
VER
GN
ET
SCA
DA
G8
W
AR
TSIL
A
HM
I
G8
M
OD
ICO
N
PLC
G7
CIT
ECT
HM
I
G7
SIX
NET
P
RO
GR
AM
MA
BLE
G
ATE
WA
Y
SUB
STA
TIO
N
CO
NTR
OL
CP
2
PL
C
1
PS
0
CP
3
CP
2
PL
C
1
PS
0
CP
3
CP
2
PL
C
1
PS
0
CP
3
CP
2
PL
C
1
PS
0
CP
3
CP
2
PL
C
1
PS
0
CP
3
CP
2
PL
C
1
PS
0
CP
3
OS1
OS2
BA
CK
UP
O
PER
ATI
ON
PA
C L
AN
STA
TIO
N L
AN
THER
MA
L P
OW
ER P
LAN
T C
ON
TRO
L
ELE
CTR
ICA
L P
OW
ER
PLA
NT
C
ON
TRO
L
SUB
STA
TIO
N
CO
NTR
OL
NEV
LEC
LO
CA
L O
FFIC
E N
ETW
OR
K
INTE
RN
ET/V
PN
TER
MIN
AL
SER
VER
CO
NTR
OL
SYST
EM
BA
CK
UP
SE
RV
ER
NEV
LEC
H
EAD
QU
AT
ERS
&
SCA
DA
CEN
TR
E
SPR
ING
HIL
L G
EOTH
ERM
AL
PLA
NT
NEV
LEC
PR
OSP
ECT
PO
WER
STA
TIO
N
WIN
DW
ATT
W
IND
FAR
MN
EVLE
C
DIS
TRIB
UTI
ON
G
RID
CP
2
PL
C
1
PS
0
CP
3
Fir
ewal
l
Ser
ver
Pro
gra
mm
able
Au
tom
atio
n C
on
tro
ller
or
Co
mm
un
icat
ion
Gat
eway
HV
/MV
pro
tec
tio
n R
ela
y a
nd
b
ay
co
ntr
olle
rs
Po
rta
ble
Op
era
tor
Co
nso
le
Pri
nte
r
Op
erat
or
Wo
rkst
atio
n
Leg
end
Fib
er
98
5
IM
36
4
IM
21
01
1
IO R
AC
K
CH
AR
LEST
OW
N 2
FE
EDE
R
PR
OTE
CT
ION
AN
D
CO
NTR
OL
CO
TTO
N
GR
OU
ND
FEE
DER
P
RO
TEC
TIO
N
AN
D C
ON
TRO
L
FOU
R S
EA
SON
S FE
EDER
P
RO
TEC
TIO
N
AN
D C
ON
TRO
L
GIN
GER
LAN
D
FEE
DER
P
RO
TEC
TIO
N
AN
D C
ON
TRO
L
FUTU
RE
FEE
DER
P
RO
TEC
TIO
N
AN
D C
ON
TRO
L
PA
C L
AN
STA
TIO
N L
AN
FIB
RE
OP
TIC
AN
D M
ICR
OW
AV
E W
AN

Report 17 353 Kelly
Redundancy of equipment and key control system components is necessary to ensure reliable and uninterruptible plant operations. At the plant automation level, it is imperative that equipment such as PAC’s and networks are made redundant as such are often integrated into key systems such as turbine vibration monitoring, lube circulation pumps and generator speed control. If single component designs were used in these subsystems, major interruptions of power supply and equipment damages could occur in the event of component failures. Most plant automation equipment is powered by voltages in the range of 24 -110 Vdc. HMI’s, servers and monitoring stations normally are powered from 120-240 Vac sources. Such systems, other communication network components, should be powered through uninterruptible power supplies (UPS) to ensure continuous reliable operation regardless of main power interruption. The performance of UPS should be specified to provide power quality monitoring and protection functionality to reduce the risk of damages to sensitive electronic equipment from over or under voltage occurrences. 5. GENERATION DISPATCH MODELLING Various software tools can be used to model power system dynamics. For this report, an Excel based simulation has been used to determine the optimal generation dispatch based on the fundamental criterion of optimizing power generation by the least-cost source. 5.1 Considerations for wind penetration
It is technically advisable that wind energy is not constituting more than 30% of the electrical generating capacity because of the natural fluctuation in output depending on wind speeds. For consistency and security, there needs to be about 70% firm capacity at all times. Wind farms using induction generators such as Windwatt wind-farm in Nevis, are prone to instantaneous power output fluctuations, wherein total power production can rise or fall up to 50% of the nominal value within a few seconds. As a PPA was signed between the NIA and Windwatt IPP, it is, therefore, mandatory that wind power be allowed into the grid when available. The present problems of system frequency and power fluctuations are due to the following:
Wind turbine generators are directly tied to the grid. As this setup is devoid of a storage mechanism, any wind fluctuations are instantly mirrored in grid frequency and power.
As the wind-farm output increases, the PPS generators observe a reduction in load. For the older generators that are intensively manually controlled, there is a consequent rise in system frequency as the generators momentarily speed up before the governors respond to trim the speed to prevent an over-speed occurrence. The response time of these governors and speed actuation systems are not as precise and rapid as those on generators 7 and 8, hence, it is still necessary for the operators to adjust the speed setting to obtain normalcy.
The absence of a well formulated grid code and standards regarding the integration of renewables, has allowed the Windwatt Wind Farm to operate irrespective of the stability issues. The measures to stabilize the system by limiting the number of turbines online and using diesels for spinning reserves, works out to be disadvantageous to both NEVLEC and the IPP as the renewable energy penetration level and expected fuel savings are not being fully realized.

Kelly 354 Report 17
5.1.1 Use of energy storage device It would be advantageous to Windwatt to install an energy storage mechanism, such as a fly wheel, that would regulate power and frequency impacts of wind surges and dips on grid power and the frequency profile. From the grid end, a more consistent wind-farm power profile would be observed. There are several examples of wind-farms using the Vergnet GEV MP turbines that have energy storage integrated through flywheels. The Coral Bay wind-farm in Australia is one such example which, in tandem with seven low load diesel generators, supplies 95% of the local grid production and offers up to a 90% penetration rate. 5.1.2 Forecasting Though it is not possible to predict wind speeds for a given area with minute accuracy, by utilising annual observations and data collation of weather patterns, it is possible to forecast monthly wind speed probabilities (Figure 29). By employing such forecasting techniques, power dispatch from a wind-farm can be planned. In the case of Nevis, the first year performance of the wind-farm and its contribution to total system power can be used as a basis for forecasting and dispatch modelling.
FIGURE 29: Nevis annual wind probability and speeds 5.2 Power system dispatch scenarios and models Distributed generation dispatch models can be based on a least-cost generation scheme wherein the bulk of the power is generated using the most stable and least-cost source. For the Nevis geothermal wind diesel mix, the simplified generation costs scenarios could be as shown below. 5.2.1 Geothermal scenarios Inexpensive geothermal scenario In this model a high success rate of test and subsequent drilled production wells is assumed along with the following:

Report 17 355 Kelly
Investment cost at 5,000 USD per kW financed by loans at 6% interest rate; The investment cost per MW for 5 MW geothermal is assumed to be almost twice the cost for
larger plants (30-50 MW) (AETS, 2006); If no investment is made in installing new diesel generators, investment cost is zero (AETS, 2006;
Cross and Freeman, 2009); Diesel costs set at 600 USD per kW if investment made in new diesel generators; The operational cost for diesel generators is 0.23 US$/kWh (information sourced from NEVLEC).
The total cost for a typical single day of operation for a range of geothermal plant sizes is shown in Table 4. This model shows that the optimal size of a geothermal plant with or without new diesel generator investment is 7 MW with a subsequent energy cost that is competitive with present day diesel generation energy costs. Hence, the investment is worthwhile.
TABLE 4 : Model energy costs for inexpensive geothermal plant scenario
Size of geothermal plant (MW)
Total cost for 1 day operation (no new diesel investment)
(USD)
Energy costs (USD/kWh)
Total cost for 1 day operation (new diesel investment)
(USD)
Energy costs (USD/kWh)
4 19,494 0.12 21,341 0.13 5 15,794 0.10 17,642 0.11 6 13,329 0.08 15,177 0.09 7 12,516 0.08 14,364 0.09
10 15,661 0.09 17,509 0.11 Expensive geothermal scenario In this model, a low success rate of test wells occurs leading to multiple test drills and consequent high drilling cost to secure suitable production wells. Other unforeseen costs may also be incurred as the project is based on an unproven geothermal field. The following assumptions are therefore made:
Investment cost at 10,000 USD/kW financed by loans at 6% interest rate; No new diesel investment is assumed.
The total cost for a typical single day’s operation for a range of geothermal plant sizes is shown in Table 5.
TABLE 5 : Model energy costs for expensive geothermal plant scenario
Size of geothermal plant (MW)
Total cost for one day operation (no new diesel
investment) (USD)
Energy costs (USD/kWh)
4 26,939 0.16 5 24,639 0.15 6 23,573 0.14 7 24,160 0.15
10 31,503 0.19 This model shows that the optimal geothermal plant size with no new diesel generator investment is 6 MW with a subsequent energy cost that is competitive with present day diesel generation energy costs. Hence, the investment is worthwhile.

Kelly 356 Report 17
Expensive geothermal project with private investor scenario The 6% loan interest rate assumed in the previous models would be suitable for projects funded largely by established lending institutions such as the World Bank. If a private investor or IPP wishes to fund and develop a geothermal project, they would seek a higher return on the equity. The financing in this case could be a combination of IPP equity with an assumed rate of return and a bank loan. The corresponding interest rate of the equity and the loan is here assumed at 15%. For such a scenario, with inconsistent test well success, the total cost for a single day’s operation appears as shown in Table 6. In this case the cost of electricity production is almost the same as present day production with the diesel generators. It can be concluded that this method of financing impacts heavily on the cost effectiveness of the project and the energy tariff that would be imposed on consumers.
TABLE 6 : Model energy costs for expensive private investor developed geothermal plant
Size of geothermal plant (MW)
Total cost for one day operation (no new diesel
investment) (USD)
Energy costs (USD/kWh)
4 36,363 0.22 5 35,872 0.22 6 36,615 0.22 7 39,010 0.23
10 48,739 0.29 Summary The models above indicate conclusively that the optimal sizes for a geothermal power plant for Nevis, under present power demand conditions, in in the range 5-7 MW. It was noted, however, that when actual load profile data was used for simulating daily power contribution by all three sources, if the geothermal plant size exceeded 5 MW, the geothermal plant would have to continuously vary its output in accordance with the diurnal load profile. This report has shown that, due to high investment costs and also turbine generator thermal and inertial characteristics, geothermal plants are best suited for base load operations rather than following minute demand fluctuations. This report will not ignore, however, those loads of the following systems which are in the developmental stages. Taking this into consideration, the energy cost for operating a 5 MW World Bank funded geothermal plant along with the existing diesels and wind assuming successful drilling (low cost scenario), would be as indicated in Table 7.
TABLE 7 : Model energy costs for geothermal plant
Generation method Energy costs (USD/kWh)
Diesel 0.23 Wind 0.14
Geothermal 0.11 Table 7 indicates that geothermal is the least-cost generation source; hence, this 5 MW plant will form the base load power generation for the dispatch models. After observing the Windwatt wind-farm operation for one year, the system power dispatch can be modelled based on two main scenarios: high wind forecast and low wind forecast.

Report 17 357 Kelly
5.2.2 Wind scenarios Scenario 1: High wind forecast From the existing historical meteorological data for Nevis and observations of the first year of wind-farm operation, the highest consistency of power generation occurs in the months of January, April, June and July. Using actual recorded wind generation data from a typical day in January 2011, and superimposing a 5 MW plant for base power generation for the Nevis island load on that given day, the power system dispatch is modelled as shown in Figure 30. The model clearly demonstrates that during such instance of high wind incidence, diesel generation can be kept below 2 MW and was required only for peaking power during the hours of 06:00 to 23:00 on average. Though this seems very promising, several other overriding factors have to be taken into consideration that would affect this model:
FIGURE 30: Generation dispatch model scenario 1: high wind forecast
As the wind-farm is grid tied via the Gingerland feeder, a feeder fault or a wind-farm fault could result in a reduction in generation capacity and a subsequent under frequency and load shedding situation. To prevent such, it would be necessary to have reserved diesel online at all times. The model demonstrates the peak diesel demand at 1.9 MW, coinciding with the peak wind generation at 1.4 MW, to give a total of approximately 3.3 MW. Using diesel generators 7 and 8 for peaking purposes as recommended by this report, the wind-farm could be safely allowed to operate at its maximum of 2.2 MW, as both generators combined can cover the total loss of the wind-farm while meeting the peaking demand as demonstrated in the model.
Though significant wind speeds may be forecasted for a given period, instantaneous fluctuations in gusts are predictable. Power output fluctuations from the wind farm would be a consequence of such changes especially in the absence of an energy storage device such as a flywheel as mentioned in Section 5.1.1. As the geothermal plant would be set at a fixed output, it therefore means diesel generators would have to absorb any such fluctuations. The model indicates that all diesel generators can be kept offline between the hours of midnight and 5 am. However, considering the above mentioned case of wind fluctuations, it would be best to keep one generator online during these periods.
Scenario 2: Low wind forecast Applying the same methodology used in the previous section for a month of lowest wind probability, the model generated is as shown in Figure 31. In this scenario it is observed that an excess of 3 MW of diesel generation is required for peaking purposes. Again, the combination of generators 7 and 8 can meet this peaking requirement and still substitute for the total wind-farm output if necessary.

Kelly 358 Report 17
5.3 Demand side management
The total power demand profile, as reflected in Figure 31, is typical for the island of Nevis. It is clear that there exists a difference of approximately 4 MW between peak and minimal load periods. One consideration for further optimising the available renewable resources is to attempt to flatten the load profile which would reduce the diesel peaking requirement and allow for increasing the geothermal base load generation.
FIGURE 31: Generation dispatch model scenario 2: low wind forecast
One possible technique for flattening the grid load profile (Belhomme et al., 2005) is via a demand side management (DMS) scheme wherein consumers, especially with large motor loads such as water pumps, air-conditioning and refrigeration units, can be encouraged to utilise the periods of highest wind penetration for conducting their peak load operations. A major consumer such as the Four Seasons Resort on Nevis, which has a peak demand approximating 2 MW, could be encouraged to vary the timing of watering its golf courses and the use of the laundry to coincide with system off peak demand periods. An off peak energy tariff would be part of the incentive offered to consumers agreeing to this scheme. Though this approach seems plausible, it is, however, not simple to organize except for very short periods of time (Belhomme et al., 2005). From the NEVLEC perspective, a more practical approach to renewable energy optimization would be the deployment of demand side management devices and techniques to form a smart grid. DMS would then be collaborated with economic generation dispatch derived from optimized wind-diesel-geothermal models. 5.4 Smart grid A smart grid can be defined as the integration of electrical and information infrastructures, and the incorporation of automation and information technologies within an existing electrical network (McDonald, 2006). According to this, smart grid implementation can provide comprehensive solutions that:
Improve the utility´s power reliability, operational performance and overall productivity; Deliver increases in energy efficiencies and decreases in carbon emissions; Empower consumers to manage their energy usage and save money without compromising their
lifestyle; Optimize renewable energy integration and enabling broader penetration.
With future considerations for NEVLEC seeking to improve its existing reliability, technical and financial performance, and capitalize on the mix of renewable and fossil power generation, implementing a smart grid can provide solutions for meeting these goals.

Report 17 359 Kelly
The fourth advantage of the smart grid, wherein it facilitates the integration and increased penetration of renewable energy sources, is that it meshes directly with the goal of optimizing the proposed wind and geothermal integration. A smart grid would also, therefore, offer a solution to the existing wind penetration issues in Nevis. 5.4.1 Smart grid elements A smart grid can be dissected into the constitutive elements, grouped according to the main functional points in an electricity network: generation, transmission, distribution and utilization. With a smart grid, however, additional management and control elements are also included. Figure 32 summarizes the main elements of a smart grid.
FIGURE 32: Elements and structure of a smart grid (Powner, 2011)
From the NEVLEC perspective, in order to capitalize on the available wind energy, sensors and smart meters would have to be deployed at consumer residences. As wind availability and forecasting is rapidly variable and not always accurate, these devices would alert the consumer when the wind energy is actually available for utilization. The smart meters would work along with the sensors to measure and communicate consumer energy usage at the ´green energy tariff´ and normal tariff. Such a scheme would, therefore, be a practical solution to the grid stability issues at points of high wind penetration. 6. IMPLEMENTATION OF PROPOSED SYSTEM A well-structured approach and corresponding time frame for deployment of the proposed system would need to be established, to ensure maximum efficacy while minimising the interruption of the supply to the Nevis island load. Such deployment would hinge majorly on the concerted efforts of all parties involved, mainly: Geothermal IPP, Windwatt IPP and NEVLEC, to come to agreement on how power generation will be dispatched. PPA’s would be drawn and ratified accordingly. Procedures for normal operations, maintenance and emergency situations must be stipulated, agreed on and enforced. Most importantly, all parties must arrive at the agreement that centralised control of all generation and distribution infrastructure rests solely with NEVLEC.

Kelly 360 Report 17
6.1 Power system operator training As NEVLEC present day power plant operators have extensive experience in plant operation and load dispatch, they would be best suited for continuing to perform such a task with the future inclusion of geothermal power generation. These operators should play an integral part in the design process of the control and operation system. Their views and opinions on the layout and performance of HMI´s and operator interfaces could result in the most ergonomic designs possible that can ensure operator efficacy. There are significant equipment, process and control differences between the prime movers of geothermal, wind and diesel power plants. The use of geothermal derived steam to drive a turbine also introduces unique problems such as possible turbine failures if steam quality is low, H2S corrosion and calcite scaling, of which a proper understanding is critical to prevent operational failures and subsequent equipment damage. For centralised control of all three to exist, NEVLEC operators would have to undergo extensive training and familiarisation with geothermal plant operation and control. It is imperative that they understand the characteristics of the geothermal fluid and parameters such as steam moisture content that are critical to plant operation. Hands on training and observance of an existing geothermal power plant operation should be carried out at relevant utilities in countries such as El Salvador or Iceland, where successful geothermal power generation has been in operation for several decades. Significant costs for travel and accommodation related expenses would, however, be incurred on NEVLEC to fund such training. In light of this, the use of Operator Training Simulators (OTS) would prove a cost effective alternative. OTS enable operators to be trained in real life scenarios without actual manipulation of live grid and plant systems. Training on live systems incurs the risk of unnecessary power supply interruptions and, in the event of training errors, the risk of damaging plant equipment. OTS reduce such risks. Through regular retraining in the OTS, the location of all controls and their functions become second nature to the operators, and they gain a thorough understanding of the connections between sub –processes and the operation of the total plant (Magnússon, 2003). Training Simulators would enable plant operators to become versed and proficient with plant scenarios and procedures such as:
Cold start, Hot start, Normal shutdown, Emergency shutdown, Load shedding, Over-speed trip, Process disturbances, Fault finding, Steam-field dynamics.
Figure 33 shows the configuration for OTS used in training operators for the Svartsengi geothermal plant in Iceland. The training operator console (P-CIM SCADA) is identical to that used in the power
FIGURE 33: General configuration of an OTS (Magnússon, 2003)

Report 17 361 Kelly
plant, enabling the operating personnel to view and interact with the various processes just as if they were operating a real plant. On the instructor station, a separate program is used to interact with the simulation process, enabling the instructor to monitor the trainee’s performance and configure various training scenarios to simulate normal conditions, malfunctions and other processes common to geothermal plant operation. The image in Figure 34 shows a screen shot of the training simulator control panel for the Fuji 30 MW turbine generator at Svartsengi (Magnússon, 2003). From this screen, the main systems that can be monitored and controlled are:
Oil system, Vacuum system, Turbine governor controller, Steam pressure controller, Power controller, Excitation system, Synchronisation, Vibration and temperature monitoring, Alarm panel.
Considering that NEVLEC plant operators have extensive experience in monitoring and controlling plant mechanical and electrical processes similar to those mentioned above, it is predictable that the adaptation and transition to geothermal plant operation would be a smooth and rapid process, facilitated by OTS and on-site plant training where possible.
FIGURE 34: Screenshot of training simulator for Fuji 30 MW turbine generator at Svartsengi geothermal power plant, Iceland (Magnússon, 2003)

Kelly 362 Report 17
7. OTHER SYSTEM DESIGN CONSIDERATIONS 7.1 The life-cycle of a control system Control system life cycles are influenced by continuous changes in technology. These changes affect primarily the SCADA systems as they are linked to information technology systems such as PCs and servers which are often customized on the foundation of commercial software such as the Windows operating systems. Such operating systems are often upgraded for improvements in functionality and often to address security issues that may be discovered after initial deployment. At the automation level, however, there is more consistency. But OEM’s do offer firmware upgrades according to emerging market technological demands. Most modern MTU, RTU and PLC equipment are designed as intelligent electronic devices (IED) which support multiple communication protocols and are built with sufficient memory and processing power to accommodate future firmware upgrades that may become necessary. The active life time at the automation level normally averages 10-15 years, different to the 5-7 years at the operational and monitoring levels (HMI, SCADA). For a geothermal plant with a lifetime exceeding 30 years, a control system upgrade would occur at least once during the plant’s lifetime. The life cycle of such a control system can be divided into the following four phases, as illustrated through Figure 35. Each of these phases is highly dependent upon market evolution and OEM developmental trends.
Active: the product is marketed and developed further; Classic: The product is maintained and developed to a very limited degree; Limited: Service and support for the product is available, but may be hard to find; price of spare
parts increases sharply; Expired: Ad-hoc service, if part fails, no service may be available (Magnússon, 2003).
7.1.1 The importance of purchasing products of recent design Purchasing automation products in the classical or limited life cycle stages would require replacement within 5-10 years. This would incur significant costs to the investor before returns have been realised on the initial purchase. Investment in products of recent design allows for a longer product useful lifetime and long term return on the investment. 7.1.2 The importance of purchasing products with strong market position Products originating from OEM’s with a strong market position tend to be of better quality, have a longer life cycle and tend to be better supported, in comparison to those originating from an OEM with a small market share. Also, products that are well utilised and have a significant and positive market history make excellent choices for investment. The market position should, therefore, be carefully considered when choosing key control system components. 7.2 Technical specs for geothermal IPP In order for NEVLEC to ensure a reliable and secure power supply to its customer base, it is necessary that guidelines for plant equipment and power quality be established for all suppliers. There are several mechanical operational considerations, such as turbine corrosion which depends on geothermal fluid
FIGURE 35: Diagram showing typical product lifecycle (Magnússon, 2003)

Report 17 363 Kelly
composition, that are of prime importance. Such will not be discussed in this paper. However, considering the base load operational regime of geothermal power plants, special emphasis must be placed on power plant protection schemes and coordination with other stations. Key specifications that should be enforced for geothermal plant equipment include:
Fault ride through (FRT) capability, Hydrogen sulphide protection, Equipment redundancies.
7.2.1 Fault ride through (FRT) capability This functionality ensures that the base loaded geothermal plant is able to remain online through nuisance or intermittent grid faults that may be sensed by the plant bus and generator protection equipment. It also requires that a generator remains connected to the grid and continues to operate in events of grid voltage dips. The turbine control system, electrical protection and critical motor controls must therefore be designed to prevent nuisance turbine trips caused indirectly by grid disturbances. In the event however of sudden loss of load due to a major grid fault, these systems must prevent the occurrence of a turbine over-speed trip. In so doing, the generator can be re-synchronised to the grid within a shorter time frame once the fault has been cleared, than if the turbine had come to a complete stop. As this project stipulates significant improvements to the network, protective devices and installation of automated protection and isolation equipment, it is expected that grid fault protection will be designed and coordinated to prevent faults of significant magnitudes from propagating to the geothermal plant bus. 7.2.2 Hydrogen sulphide (H2S) protection Hydrogen sulphide is a colourless gas that normally accounts for less than 1% of the non-condensable gasses released from the geothermal fluid. It is characterised by its ‘rotten egg’ smell and can have severe corrosive effects on electrical equipment. Metals such as copper and silver, which are highly utilised in power and communication equipment, are highly prone to corrosion by this gas. Corroded conductors in communication or power transmission systems can create high points of resistance that lead to power system failures due to loss of the control signal or under voltage (Karani, 2008). The Nevis geothermal project is yet to be built. Therefore, it is necessary that proper protection against corrosion of sensitive equipment in the power generation and control processes be included in the plant design. The IPP must ensure the following:
Ventilation systems for rooms housing indoor electrical equipment must include H2S filtration. Such rooms must also include air quality monitoring systems and alarms that would indicate if H2S levels are increasing. Such rooms should also be positively pressurized.
Generators are sealed and surroundings ventilated with positively pressurized filtered air. Equipment located in the plant and geothermal field should have glands and seals to prevent
corrosive gas from entering the systems. Electrical junction boxes should be supplied with filtered air.
Copper conductors should be tin coated to provide high H2S resistance, especially for equipment to be used in the geothermal field device communication network. Printed circuit boards should be conformal coated against H2S corrosion.
Where possible, utilise corrosion resistant materials such as aluminium, stainless steel and other alloys.

Kelly 364 Report 17
8. DISCUSSION 8.1 Benefits of geothermal development In addition to gaining a reliable cost effective power supply, there are other benefits to be gained from geothermal exploitation on Nevis. Geothermal is a reliable source of power which is not easily impacted by weather phenomena or by seasonal variations, hence, a geothermal plant can operate continuously in good or adverse weather. Nevis is one of the Caribbean islands in the hurricane belt. Since the commissioning of the wind-farm, there have been several instances when the plant had to be taken offline and turbines lowered to the ground due to approaching tropical storms and hurricanes. During this period, diesel fuel consumption at the PPS returned to pre-wind-farm integration levels. As Nevis does not produce oil, all fossil fuels and lubricants used in the power generation and transport sectors have to be imported. Such dependency on imports introduces the risk of a shortage in the supply in instances of disruptions to supply and transportation processes. Presently, fuels are transported to Nevis via oil tankers. In an event of natural or manmade (such as industrial action) disasters interrupting such shipments, the island could experience a fuel shortage which would eventually render the Prospect power station inoperable and cripple the electric infrastructure of the island. As electricity supply can be considered a fundamental requirement for the proper functioning of the various socio-economic elements of a country, the effect of such a fuel shortage would be far reaching. A geothermal plant, therefore, presents a more reliable energy resource that would consistently provide a secure power supply. As the resource is inherent to the island, the risk of a shortage in the energy supply, as associated with imported fossil fuels, is significantly stymied. 8.2 Frame work for geothermal development Figure 36 outlines the sequential stages of a geothermal power plant development process and realistic timeline. As slim hole wells have already confirmed the availability of the geothermal resource in Spring Hill Nevis, it is expected that the next stage of the project would follow through initial production drilling and then finalization on project design. The decision to construct the power plant would then follow design finalization. Figure 36, however, demonstrates that the time frame from confirmation of the drilling stage to plant commissioning and operation can average 6 years or more.
In light of the fact that confirmation drilling was completed in 2008 in Nevis, it could be estimated that power plant construction should be in the advanced stages by 2014, providing initial production drilling and plant design starts in late 2012 into early 2013. Considerations would, therefore, have to be given
FIGURE 36: Stepwise strategy for geothermal development (modified from Steingrímsson, 2009)

Report 17 365 Kelly
for a time frame for deployment of the new proposed control system linking all power generation sites in Nevis. A stepwise approach (Figure 37) would be best for this deployment, considering that significant network upgrades and redesign would be necessary to implement the proposed system. 8.3 Investment costs Exploitation of geothermal resources is a costly process. To develop a field for power generation, the cost is on the order 3-6 million USD per MW installed, depending on the properties (mainly temperature) of the field being developed (Steingrímsson, 2009). These cost estimates however are relative to large geothermal plant developments. Smaller sized geothermal plants such as being discussed in this report tend to incur higher investment cost per MW installed (see also Cross and Freeman 2009). In light of such high investment cost, a project developer would manipulate their financial model and expected time frame for return on investment to establish a base energy cost for MWh sales. Plant operation and reliability is then taken into consideration, as downtime significantly reduces income. The geothermal IPP would, therefore, deem it financially beneficial to structure plant operation and dispatch to optimize the plant load factor. 8.4 External demand and interconnection
The possibility of geothermal development in Nevis and other Caribbean islands has raised the discussion of a Caribbean interconnection. This report has already mentioned the proposed power transmission line from Nevis to St. Kitts which would be made a reality if geothermal power is proven sustainable. According to the World Bank report (Nexant, 2010), it is expected that both Puerto Rico and St. Kitts will be interconnected to the Nevis geothermal power supply, requiring 30 and 400 MW of power, respectively. Though Nevis island geothermal resources are estimated to be abundant, the small island size limits the development of a single geothermal field. The spacing of geothermal production wells and re-injection wells must be sufficient to prevent cooling of the reservoir. Due to this limitation, it is therefore unlikely that geothermal power plants with a total capacity approximating several hundred megawatts will be built on Nevis. If power demands increase according to the World Bank predictions, it would be necessary for geothermal power plants to be constructed at other locations such as Nevis 2 and 3, as shown in Figure 1. In spite of the geothermal resource being based in Nevis, the exportation of electrical power outside of the federation of St. Kitts and Nevis would not be controlled by NEVLEC but by the IPP. Hence, such power transmission systems have not been considered in this report. However, the expandability requirement, stated in Section 4.1.6 for the proposed control system, ensures that further distribution of geothermal generation can be easily integrated if necessary.
FIGURE 37: Geothermal developmental stages (Steingrímsson 2009)

Kelly 366 Report 17
9. SUMMARY AND CONCLUSIONS Nevis, in commonality with other developing nations, is seeking to exploit its inherent renewable energy resources mainly in the form of wind and geothermal power development. In carrying out such exploitations, the island would obtain a reliable, secure electricity supply that is also cost effective. The reduction in electricity cost and proposed elimination of the existing fuel surcharge would enhance the purchasing power and disposable income available to the average Nevisian household. It is also expected that the availability of cheaper electricity would attract industries and foreign investments which could change the island economy from being solely tourism based. Such socio-economic benefits resulting from harnessing available renewable energy resources are in keeping with the United Nation’s developmental goals. Considering, however, that the island presently lacks the necessary capital and human resources to develop its geothermal resource, it is most likely that such projects would be made available to IPP’s for development. There is a present need for standards and operational codes to be established for IPP’s wish to develop and operate geothermal plants in Nevis. Experience with the existing wind-farm has also highlighted the immediate need for establishment of a grid code and regulations regarding power quality and performance for renewable energy IPP’s wishing to connect to the NEVLEC grid. With the view that Nevis island power demand and the customer base of NEVLEC are given priority to reaping the benefits of the expected cost effective, reliable electricity, it is incumbent on NEVLEC to assume a proactive approach by assessing the existing power generation and distribution infrastructure and proposing improvements to meet future demands, especially due to the addition of a geothermal power plant. This report has made a step in the direction of making such an assessment and proposing improvements with the view of providing the island with the best electric power quality and reliability possible. Key to such improvements would be upgrading the existing distribution network infrastructure and the inclusion of automated protective and control devices that would offer a range of operation and control options to NEVLEC system operators and maintenance personnel. Emphasis has been placed on several technical and non-technical requirements for a geothermal power plant and ultimately the report has proposed a unified system of operation and control of all generation and distribution infrastructures under the central command of the Nevis Electricity Company Ltd. This unique wind-diesel geothermal mix operating on a small island of a varying diurnal load profile, presents a unique challenge for power dispatch. By utilising system models and wind forecasting techniques, however, the optimal economic system dispatch model has been derived, resulting in a 5 MW geothermal base load and wind-diesel peaking operation. The existing uneven load profile of the island limits the size of the geothermal plant. The models have indicated a size exceeding 5 MW results in a geothermal plant load which is not the most economical or technically sound dispatch. It is expected, however, that as the island demand grows, these models would have to change and the base load plant size increased. Exportation of power to neighbouring islands would rapidly change the dynamics of such plant sizing. But as clearly stated in this report, such exportation should only be considered after sustainable operation of a geothermal plant powering Nevis has been ascertained. By deploying smart grid intelligent electronic devices at consumer locations to encourage variations in energy usage patterns, the island load profile can be flattened which can subsequently result in greater exploitation of wind and geothermal power. As existing network problems have been identified, such as fault propagation that can be potentially problematic to geothermal plant operation, it is highly recommended that NEVLEC seek to make improvements before the geothermal plant is commissioned in the future. However, it is not expected

Report 17 367 Kelly
that such improvements and changes would be implemented overnight. Therefore, a well-structured assessment and subsequent deployment plan would be necessary. Imperative to the success of a future geothermal power project in Nevis would be the development of the available human resources on the island, to provide skilled persons to fill key positions. To date, the training of 2 NEVLEC staff at the United Nations Geothermal Training Programme in Iceland is indicative that Nevis has commenced taking positive steps in this regard. Such steps herald the likelihood of geothermal power generation commencing in Nevis in the near future.
ACKNOWLEDGEMENTS My gratitude must first be expressed to the United Nations University Geothermal Programme (UNU-GTP) and the Icelandic government for providing this opportunity to have been immersed in a diverse educational and cultural experience. Special thanks go to the UNU-GTP director, Mr. Ingvar Birgir Fridleifsson, deputy director, Mr. Lúdvík S. Georgsson and the staff members, Mr. Ingimar G. Haraldsson, Ms. Thórhildur Ísberg, Mr. Markus A.G. Wilde, and Ms. Frída Ómarsdóttir for their continuous assistance and support throughout the six months programme. This report would not have been possible without the assistance of my supervisor, Jóhann Thór Magnússon and I must express much thanks to him for his dedication and indefatigable assistance throughout the project. I must also thank my family and co-workers at NEVLEC, for their providence and support with this project. Special thanks to the Chairman of NEVLEC, Mr. Ernie Stapleton, and the general manager, Mr. Cartwright Farrell, for their approval of my attending this training programme. Also, thanks to Peter Watson for his help with this report. All in all, without the help of God nothing would have been possible and to Him I give thanks.
REFERENCES ABB, 2012: Auto recloser and feeder protection and control device. ABB.
AETS, 2006: Dominica geothermal project and interconnection with neighbouring islands. Assessment and cost-benefit analysis. Application Euroéenne de Technologies et de Services - AETS, ppt presentation.
Belhomme, R., White, S., Hatziargyriou, N., Tsikalakis, A., Lefebvre, D., Ranchin, T., Fesquet, F., Arnold, G., Tselepis, S., Neris, A., Degner, T., and Taylor, P., 2005: Distributed generation on European islands and weak grids – Public Report. Project DISPOWER, EDF Electricité de France, 89 pp.
Broadwin Technology, Inc., 2012: WebAccess Network Architecture. Broadwin Technology, Inc., CA, USA, webpage: www.broadwin.com/network.htm.
Controlmanuals.com, 2012: Automation, SCADA systems. Controlmanuals.com, webpage: www.controlmanuals.com.
Cross, J., and Freeman, J., 2009: 2008 geothermal technologies market report. NREL report TP-6A2-46022; DOE/GO-102009-2864.

Kelly 368 Report 17
DiPippo, 2012: Geothermal power plants. Principles, applications, case studies and environmental impact (3rd ed.). Butterworth Heineman, Elsevier, Oxford, UK, 624 pp.
Karani, T.W., 2008: Improved operations and reliability by upgrading Olkaria 1 control system and installing remote monitoring and control system for Olkaria 1 and 2 geothermal power plants in Kenya. Report 21 in: Geothermal training in Iceland 2008. UNU-GTP Iceland, 331-363.
Machowski, J., Bialek, J.W., and Bumby, J.R., 2008: Power system dynamics-stability and control (2nd ed.). John Wiley & Sons - IEEE Press, NY, 15-17 pp.
Magnússon, J.Th., 2003: Operational simulators and automatic control systems. In: Fridleifsson, I.B., and Gunnarsson, M.V. (eds.), Lectures on sustainable use and operating policy for geothermal resources. UNU-GTP, Iceland, publ. 1, 185-194.
McDonald, J.D., 2006: Smart grid applications, standards development and recent deployments. GE Energy T&D, 4 pp.
Nexant, 2010: Caribbean regional electricity generation, interconnection and fuels supply strategy (final report). World Bank, report submitted by Nexant, 427 pp.
Powner, D.A., 2011: Electricity grid modernization: Progress being made on cybersecurity guidelines, but key challenges remain to be addressed. Diane Publishing Co., Darby, PA, USA, 50 pp.
Steingrímsson, B., 2009: Geothermal exploration and development from a hot spring to utilization. Papers presented at “Short Course on Surface Exploration for Geothermal Resources” organized by UNU-GTP and LaGeo, Santa Tecla, El Salvador, 8 pp.
APPENDIX I: Existing protection and control devices for proposed system integration
Location Device OEM Function No. Communication
protocol supported
Prospect power station
generator 7
Ethertrack IO Gateway
Sixnet IO concentrator
(RTU) 1 Modbus
Sixtrack IPM open controller
Sixnet Process control,
SCADA 1 Modbus
Digital synchronous load controller
(DSLC) Woodward
Generator synchronisation and
load control 1 Modbus
Static voltage regulator
Basler Electric
Voltage regulation 1 Analog
2301 speed controller Woodward Engine speed
governor 1 Analog
Generator protection unit 2000R
ABB Generator fault
protection 1 Modbus
Transformer protect unit 2000R
ABB Transformer fault
protection 1 Modbus
SCADA software Citect Generator process control and data
acquisition 1 Modbus

Report 17 369 Kelly
Location Device OEM Function No.Communication
protocol supported
Prospect power station
generator 8
Generator protection relay
VAMP 210
Vassa Electronics
O/C, S/C, OV, RP EF, OF, UF, UR,
UL 1
IEC 60870-5-103, IEC 61850, DNP 3.0, Modbus
TCP, Modbus RTU, Profibus DP, TCP / IP,
SPA-bus slave
Generator diff current protection
relay VAMP 265
Vassa Electronics
D/C 1
IEC 60870-5-103, IEC 61850, DNP 3.0, Modbus
TCP, Modbus RTU, Profibus DP, TCP / IP,
SPA-bus slave
Power monitoring unit VMAC 260
Vassa Electronics
Generator power monitoring
1
IEC 60870-5-103, IEC 61850, DNP 3.0, Modbus
TCP, Modbus RTU, Profibus DP, TCP / IP,
SPA-bus slave Unitrol 1000
automatic voltage regulator
ABB Voltage regulation 1 Modbus
723 Governor WoodwardGenerator speed
control 1
Modbus ASCII/RTU, LONTalk
PLCs Modicon Generator process
control 1 Modbus
Wartsila operator interface system
(WOIS) Wartsila HMI/SCADA 1 Modbus
Prospect power station
substation
Unigear VD4 Switchgear
ABB Isolation and
control 12 Analog
SPAJ 141 C protection relay
ABB OC & EF protection 5 SPA-bus slave
SPAF 140C ABB
Frequency measurement,
under-frequency load shedding
2 SPA-bus slave
Power monitoring unit VMAC 260
Vassa Electronics
Bus section power monitoring
2
IEC 60870-5-103, IEC 61850, DNP 3.0, Modbus
TCP, Modbus RTU, Profibus DP, TCP / IP,
SPA-bus slave
SPAU 320C1 ABB Bus section protection
2 SPA-bus slave
Prometer CEWE
InstrumentsKWH and KVARH
meter 7 Modbus
WindWatt wind-farm
Micom P127 Areva Protection relay 1 DNP3 IEC 60870-5 Switch Gear Eaton Holec Isolation 1 Analog
ET200 simatic Siemens RTU 9 DNP3 IEC 60870-5 S7-300 simatic Siemens RTU 9 DNP3 IEC 60870-5
PLC Siemens Control logic 9 DNP3 IEC 60870-5
SCADA Vergnet Eolien
Wind-farm control 1 Cp 342-5 FO profibus net