power quality monitoring: key component of comprehensive
TRANSCRIPT

Daniel Sabin, P.E., M.Eng., IEEE FellowPrincipal Engineer & Software Architect
Boston, Massachusetts, [email protected] |+1-978-927-8755
Power Quality Monitoring:Key Component of Comprehensive Power System Monitoring
1
2© 2016 Electrotek Concepts, Inc. All rights reserved.
Global Power Technology
3© 2016 Electrotek Concepts, Inc. All rights reserved.
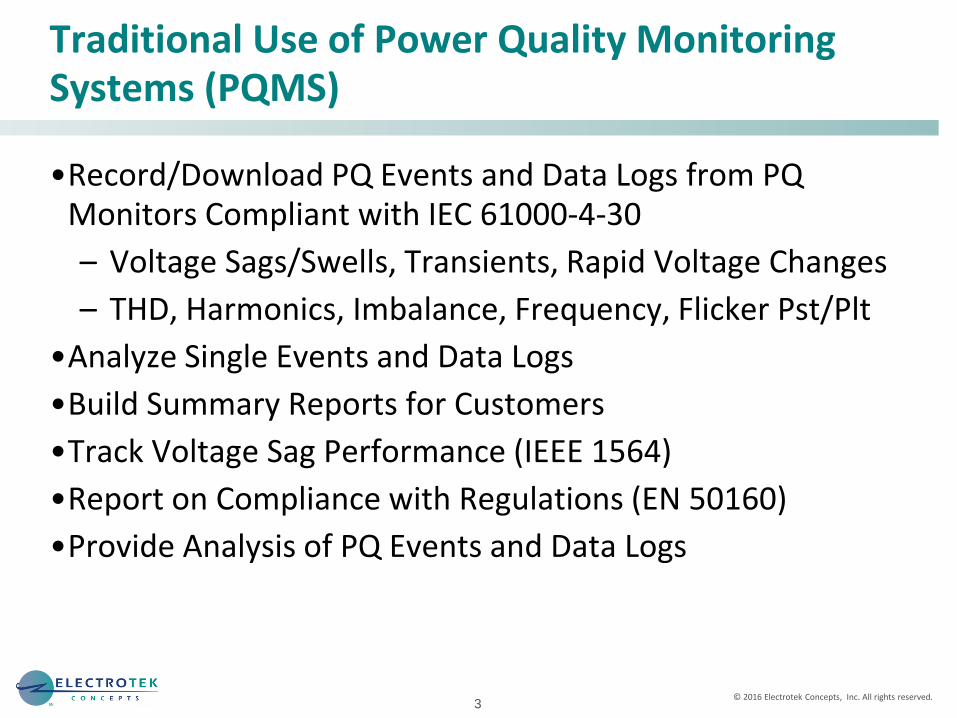
Traditional Use of Power Quality Monitoring Systems (PQMS)
•Record/Download PQ Events and Data Logs from PQ Monitors Compliant with IEC 61000-4-30
– Voltage Sags/Swells, Transients, Rapid Voltage Changes
– THD, Harmonics, Imbalance, Frequency, Flicker Pst/Plt
•Analyze Single Events and Data Logs
•Build Summary Reports for Customers
•Track Voltage Sag Performance (IEEE 1564)
•Report on Compliance with Regulations (EN 50160)
•Provide Analysis of PQ Events and Data Logs

4© 2016 Electrotek Concepts, Inc. All rights reserved.
Expanded Use of Power Quality Monitoring Systems (PQMS)
•Integrated Monitoring of Power Quality Monitors, Microprocessor Relays, Digital Fault Recorders, Recloser Controllers, Capacitor Controllers, and More
•Integration with SCADA or OMS
•Fault Analysis
•Incipient Fault Detection
•Automated Fault Location for Permanent and Momentary Faults
•Automated Capacitor Analysis
•Notification and Reporting using Statistical Process Control

Dranetz DataNode 5530 Monitors
PQViewDatabases
MicrosoftSQL Server
HTTP via RAS
Dranetz DataNode 61000 Monitors
InfoNode Servers
Proprietary Dialup PQNodeData FilesDranetz PQNode 8010
Monitors
InfoNode Servers
InfoNode Servers
MMS via WAN
File Share
HTTPvia LAN
LAN
Schneider ElectricION Meters
HTTP via Frame Relay
ION Server
Download ServerSEL and GE Relays COMTRADE
Files
FileShare
HTTPvia LAN
HTTPvia LAN
ECC PI ServerSCADA RTU Sensors
PI SDK
LAN
Frame Relay
GE XA/21

6© 2016 Electrotek Concepts, Inc. All rights reserved.
Area SubstationTransformer
Primary Feeders Secondary Network
A
B
C
Single Line to Ground Fault
• PQ Monitors at Low Side of Many Area Substation Transformers
• Digital Relay Data Available at 20% of Primary Feeders
7© 2016 Electrotek Concepts, Inc. All rights reserved.
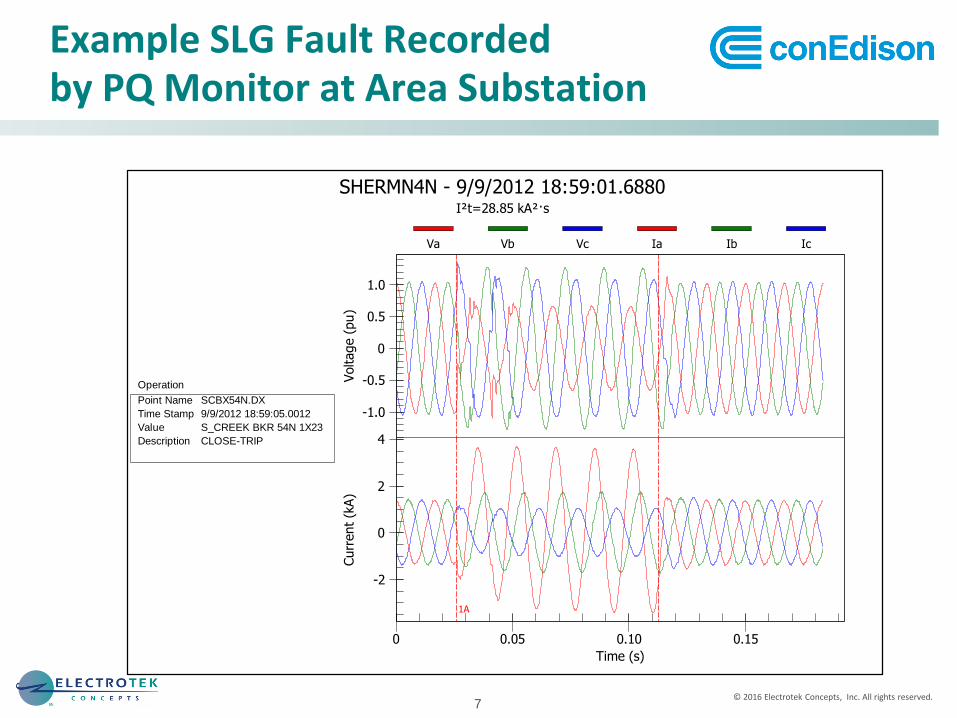
Example SLG Fault Recordedby PQ Monitor at Area Substation
1A
-1.0
-0.5
0
0.5
1.0
-2
0
2
4
0 0.05 0.10 0.15
SHERMN4N - 9/9/2012 18:59:01.6880I²t=28.85 kA²·s
Operation
Point Name SCBX54N.DX
Time Stamp 9/9/2012 18:59:05.0012
Value S_CREEK BKR 54N 1X23
Description CLOSE-TRIP
Voltage (
pu)
Curr
ent
(kA)
Time (s)
Va Vb Vc Ia Ib Ic

8© 2016 Electrotek Concepts, Inc. All rights reserved.
Reactance-to-Fault Calculationsfor PQ Measurement at Substation
1A 0.7469 (k1=3.800)
0.8
1.0
1.2
0
1
2
1.0
1.5
2.0
0.02 0.04 0.06 0.08 0.10 0.12 0.14 0.16 0.18
SHERMN4N - 9/9/2012 18:59:01.6880Voltage, Current, and Reactance Values
Voltage (
pu)
Curr
ent
(kA)
React
ance
(Ω
)
Time (s)
Va Vb Vc V0 V1 V2 Ia Ib Ic XTF

9© 2016 Electrotek Concepts, Inc. All rights reserved.
Predicted Location of Fault

10© 2016 Electrotek Concepts, Inc. All rights reserved.
Visualized Location of Fault
11© 2016 Electrotek Concepts, Inc. All rights reserved.
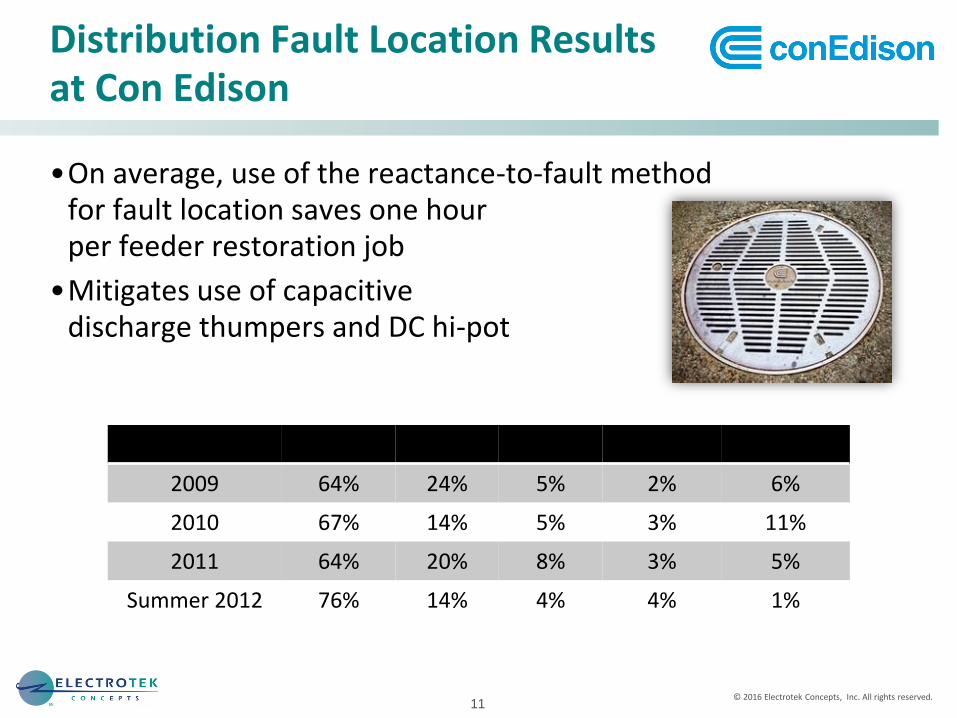
Distribution Fault Location Resultsat Con Edison
•On average, use of the reactance-to-fault methodfor fault location saves one hourper feeder restoration job
•Mitigates use of capacitivedischarge thumpers and DC hi-pot
Year 0-1 MH 1-3 MH 3-5 MH 5-10 MH > 10 MH
2009 64% 24% 5% 2% 6%
2010 67% 14% 5% 3% 11%
2011 64% 20% 8% 3% 5%
Summer 2012 76% 14% 4% 4% 1%

12© 2016 Electrotek Concepts, Inc. All rights reserved.
Incipient Subcycle Fault LocationUsing Time-Domain Estimation
-1.0
-0.5
0
0.5
1.0
-3
-2
-1
0
0.35 0.40 0.45 0.50 0.55
Subcycle Incipient Fault
Voltage (
pu)
Curr
ent
(kA)
Time (s)
Va Vb Vc Ia Ib Ic
Estimated XTF: 0.3235 Ω
Actual XTF: 0.3221 Ω
-1.0
-0.5
0
0.5
1.0
-5
0
5
10
0.35 0.40 0.45 0.50 0.55 0.60 0.65 0.70 0.75
Subsequent Permanent Fault
Voltage (
pu)
Curr
ent
(kA)
Time (s)
Va Vb Vc Ia Ib Ic
13© 2016 Electrotek Concepts, Inc. All rights reserved.
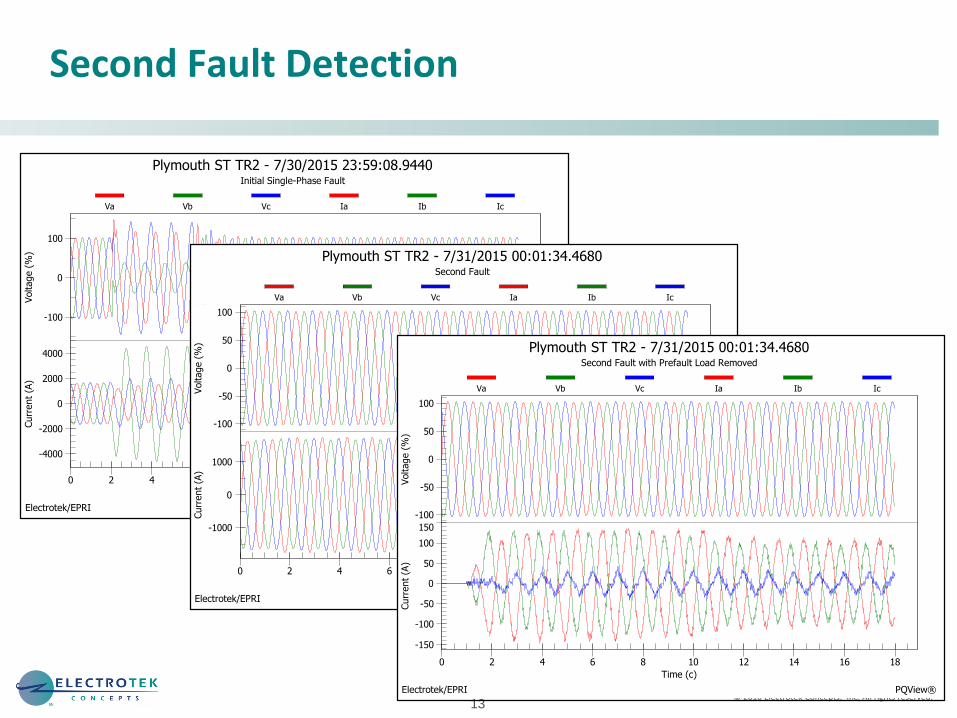
Second Fault Detection
-100
0
100
-4000
-2000
0
2000
4000
0 2 4 6 8 10 12 14 16 18 20 22
Plymouth ST TR2 - 7/30/2015 23:59:08.9440Initial Single-Phase Fault
Electrotek/EPRI PQView®
Voltage (
%)
Curr
ent
(A)
Time (c)
Va Vb Vc Ia Ib Ic
-100
-50
0
50
100
-1000
0
1000
0 2 4 6 8 10 12 14 16 18
Plymouth ST TR2 - 7/31/2015 00:01:34.4680Second Fault
Electrotek/EPRI PQView®
Voltage (
%)
Curr
ent
(A)
Time (c)
Va Vb Vc Ia Ib Ic
-100
-50
0
50
100
-150
-100
-50
0
50
100
150
0 2 4 6 8 10 12 14 16 18
Plymouth ST TR2 - 7/31/2015 00:01:34.4680Second Fault with Prefault Load Removed
Electrotek/EPRI PQView®
Voltage (
%)
Curr
ent
(A)
Time (c)
Va Vb Vc Ia Ib Ic

14© 2016 Electrotek Concepts, Inc. All rights reserved.
Using SCADA and Power QualityMeasurements Together
VVC
VVC-M
AN
MAN
-VVC
VVC-M
AN
MAN
-VVC
VVC-M
AN
MAN
-CM
VM
CM
VM
-MAN
MAN
-VVC
VVC-C
MVM
CM
VM
-MAN
MAN
-CM
VM
CM
VM
-VVC
VVC-M
AN
13.4
13.6
13.8
14.0
-200
0
200
100
150
200
5 Sun
Jun 2011
6 Mon 7 Tue 8 Wed 9 Thu 10 Fri 11 Sat 12 Sun
Substation A
Con Edison® PQView®
kV
VM
W
Time
Station PI.LE1VOLT Scheduled Voltage Max Voltage Min Voltage
SCADA Voltage Deviation Voltage Deviation LCL Voltage Deviation UCL LE1LODWX
5.01% UCL-LCL
Process Control Violation

15© 2016 Electrotek Concepts, Inc. All rights reserved.
Data Integration at Hydro Ottawa
ION Server
ION Meters
Broadband Ethernet Connections
ION EnterpriseDatabase Server
PQViewDatabase
SCADAServers
RTUs OSISoft PISystem Server

16© 2016 Electrotek Concepts, Inc. All rights reserved.
-10000
0
10000
-500
0
500
0 1 2 3 4 5 6 7 8 9 10
HO_Ellwood.T1e - 15/01/2013 11:37:41.1145Duration: 9.437s
Electrotek/EPRI PQView®
Event ID = 288312 System Event ID = 51733
Voltage (
V)
Curr
ent
(A)
Time (s)
Va Vb Vc Ia Ib Ic
Analyzing Capacitor Performance
•Capacitor Switching anomaly when new capacitor bank was put in service Operated 70 times in 10 seconds
-100
0
100
-500
0
500
1.55 1.60 1.65 1.70 1.75 1.80 1.85 1.90 1.95 2.00
HO_Ellwood.T2e - 15/01/2013 11:37:38.9792Duration: 9.437s
Electrotek/EPRI PQView®
Event ID = 288314 System Event ID = 51733 Reference Cycle = 738056
Voltage (
%)
Curr
ent
(A)
Time (s)
Va Vb Vc Ia Ib Ic
0.86
0.88
0.90
0.92
0.94
0.96
0.98
1.00
1.02
1.04
1.06
1.08
1.55 1.60 1.65 1.70 1.75 1.80 1.85 1.90 1.95 2.00
HO_Ellwood.T2e - 15/01/2013 11:37:38.9792Total Power Factor
ΔPFa=-0.001469 PF ΔPFb=0.0006440 PF ΔPFc=-0.0004120 PF ΔPFtotal=-0.0004854 PF
Electrotek/EPRI PQView®
Tota
l Pow
er F
acto
r (p
u)
Time (s)
PFtotal

17© 2016 Electrotek Concepts, Inc. All rights reserved.
Automated Capacitor Analysis
-100
-50
0
50
100
-0.5
0
0.5
0 0.02 0.04 0.06 0.08
Joslyn Closing Analysis
Electrotek/EPRI PQView®
Cap Name CAP_1A CIS
Operation OUT-INSERVIC
Channel Time Status
Va 0.7417 ms Synchronous
Vb 0.5516 ms Synchronous
Vc 0.7417 ms Synchronous
Voltage (
%)
Curr
ent
(kA)
Time (s)
Va Vb Vc Ia Ib Ic
-100
-50
0
50
100
-1.0
-0.5
0
0.5
0 0.02 0.04 0.06 0.08
Capacitor Analysis
Electrotek/EPRI PQView®
Cap Name
Operation
Directivity Downline
Directivity Confidence Very High
Magnification No
Peak Voltage 124.9 %
ΔQA -0.7552 Mvar
ΔQB -0.7812 Mvar
ΔQC -0.7689 Mvar
ΔQTotal -2.305 Mvar
ΔPFA 7.21%
ΔPFB 5.42%
ΔPFC 6.29%
ΔVTHDA 0.27%
ΔVTHDB 0.26%
ΔVTHDC 0.30%
Resonant Frequency 565.5 Hz
Voltage (
%)
Curr
ent
(kA)
Time (s)
Va Vb Vc Ia Ib Ic
18© 2016 Electrotek Concepts, Inc. All rights reserved.
-100
-50
0
50
100
-400
-200
0
200
400
0 0.005 0.010 0.015 0.020 0.025 0.030
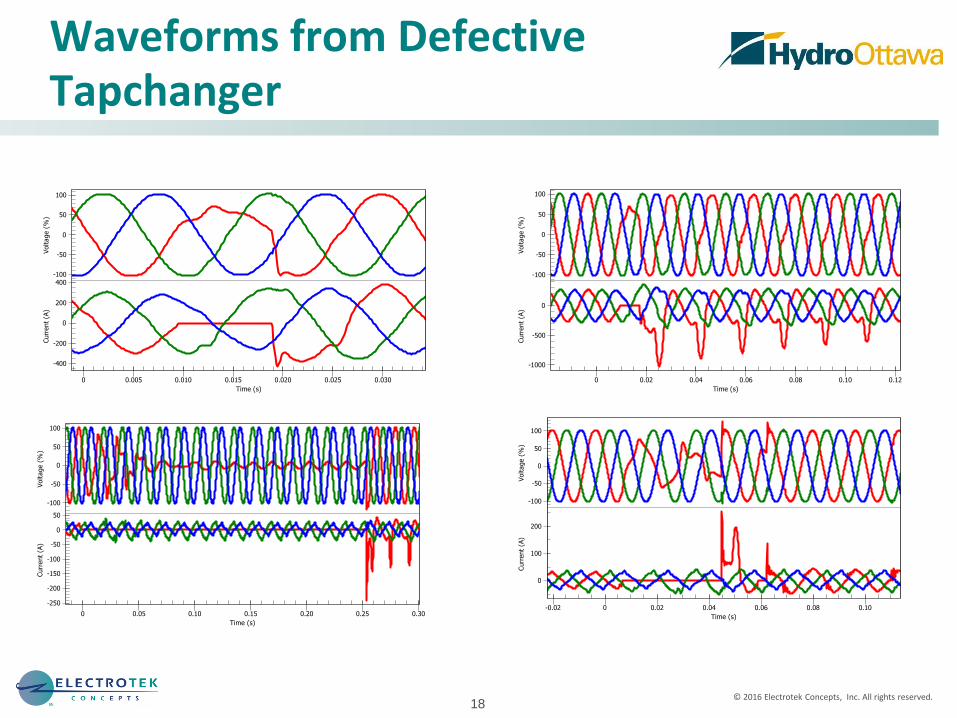
Transformer 1 - 21/04/2010 06:13:41.1825
Hydro Ottawa - Technical Services PQView®
Voltage (
%)
Curr
ent
(A)
Time (s)
Va Vb Vc Ia Ib Ic
-100
-50
0
50
100
-1000
-500
0
0 0.02 0.04 0.06 0.08 0.10 0.12
Transformer 1 - 22/04/2010 02:04:12.5558
Hydro Ottawa - Technical Services PQView®
Voltage (
%)
Curr
ent
(A)
Time (s)
Va Vb Vc Ia Ib Ic
-100
-50
0
50
100
-250
-200
-150
-100
-50
0
50
0 0.05 0.10 0.15 0.20 0.25 0.30
Transformer 1 - 25/04/2010 01:51:28.2487
Hydro Ottawa - Technical Services PQView®
Voltage (
%)
Curr
ent
(A)
Time (s)
Va Vb Vc Ia Ib Ic
-100
-50
0
50
100
0
100
200
-0.02 0 0.02 0.04 0.06 0.08 0.10
Transformer 1 - 25/04/2010 11:50:35.5390
Hydro Ottawa - Technical Services PQView®
Voltage (
%)
Curr
ent
(A)
Time (s)
Va Vb Vc Ia Ib Ic
Waveforms from DefectiveTapchanger
19© 2016 Electrotek Concepts, Inc. All rights reserved.
0
0.2
0.4
0.6
0.8
8 Thu
Apr 2010
15 Thu 22 Thu
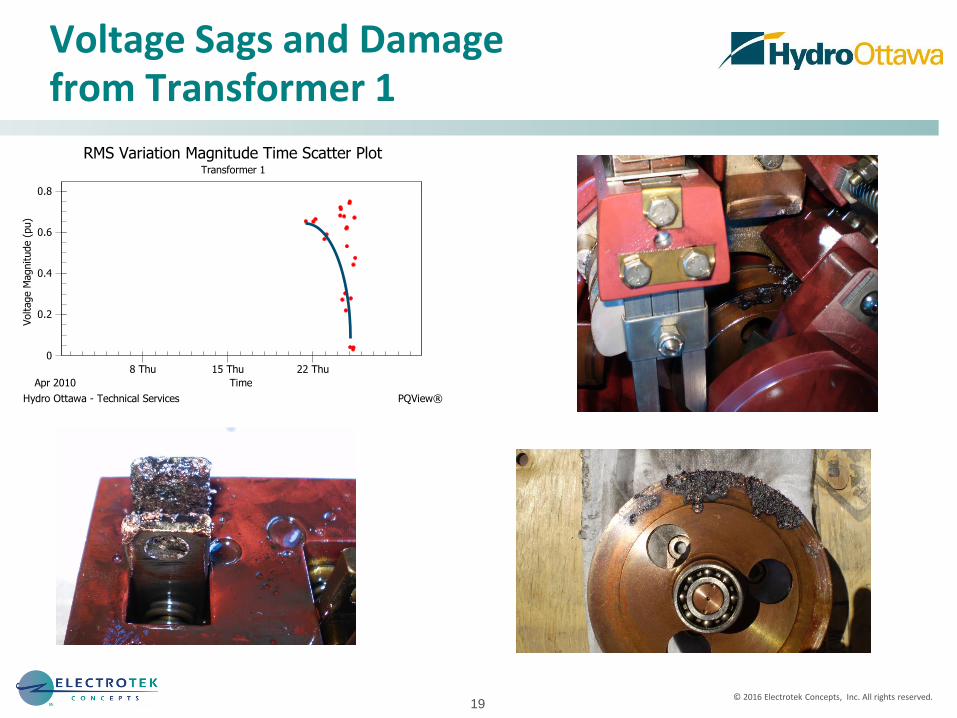
RMS Variation Magnitude Time Scatter PlotTransformer 1
Hydro Ottawa - Technical Services PQView®
Voltage M
agnitude (
pu)
Time
Voltage Sags and Damagefrom Transformer 1

20© 2016 Electrotek Concepts, Inc. All rights reserved.
90
95
100
105
110
2 Mon
Jan 2012
3 Tue 4 Wed 5 Thu
Transformer 3 - V RMS AB, V RMS BC, V RMS CAFrom 31/03/2010 12:00:00 PM to 15/01/2012
Hydro Ottawa - Technical Services PQView®
Time
Min[V RMS AB] (%) Avg[V RMS AB] (%) Max[V RMS AB] (%)
Min[V RMS BC] (%) Avg[V RMS BC] (%) Max[V RMS BC] (%)
Min[V RMS CA] (%) Avg[V RMS CA] (%) Max[V RMS CA] (%)
0
100
200
300
1 Sun
Jan 2012
2 Mon 3 Tue 4 Wed 5 Thu 6 Fri
Transformer 3 - I RMS A, I RMS B, I RMS CFrom 31/03/2010 12:00:00 PM to 15/01/2012
Hydro Ottawa - Technical Services PQView®
Time
Min[I RMS A] (A) Avg[I RMS A] (A) Max[I RMS A] (A) Min[I RMS B] (A)
Avg[I RMS B] (A) Max[I RMS B] (A) Min[I RMS C] (A) Avg[I RMS C] (A)
Max[I RMS C] (A)
No Voltage Sags at Transformer 2
• There were no sags or transient events recorded during this period.
• Voltage Trend data showed a frequent number of minor rms voltage changes that were not associated with current inrush or faults.
• Transformer was taken out of service and inspected and damage was found.

21© 2016 Electrotek Concepts, Inc. All rights reserved.
Transformer 2 Tapchanger Damage

22© 2016 Electrotek Concepts, Inc. All rights reserved.
Transformer 1 Transformer 2
Transformer 3
0
1
2
3
4
5
6
7
8
15 Thu
Apr 2010
22 Thu
Transformer 1 - Plt A, Plt B, Plt CFrom 31/03/2010 12:00:00 PM to 15/01/2012
Hydro Ottawa - Technical Services PQView®
Time
Plt A Plt B Plt C
0
0.5
1.0
1.5
2.0
2.5
3.0
8 Mon
Aug 2011
15 Mon 22 Mon
Transformer 2 - Plt A, Plt B, Plt CFrom 31/03/2010 12:00:00 PM to 15/01/2012
Hydro Ottawa - Technical Services PQView®
Time
Plt A Plt B Plt C
0
0.2
0.4
0.6
0.8
1.0
1.2
1.4
15 Thu
Dec 2011
22 Thu 1 Sun 8 Sun 15 Sun
Transformer 3 - Plt A, Plt B, Plt CFrom 31/03/2010 12:00:00 PM to 15/01/2012
Hydro Ottawa - Technical Services PQView®
Time
Plt A Plt B Plt C
Pst and Plt flicker data identified
the start of the serious damage to
the tapchanger within hours on all
three transformers.
Voltage Plt Flicker Trendsat Transformer 3
23© 2016 Electrotek Concepts, Inc. All rights reserved.
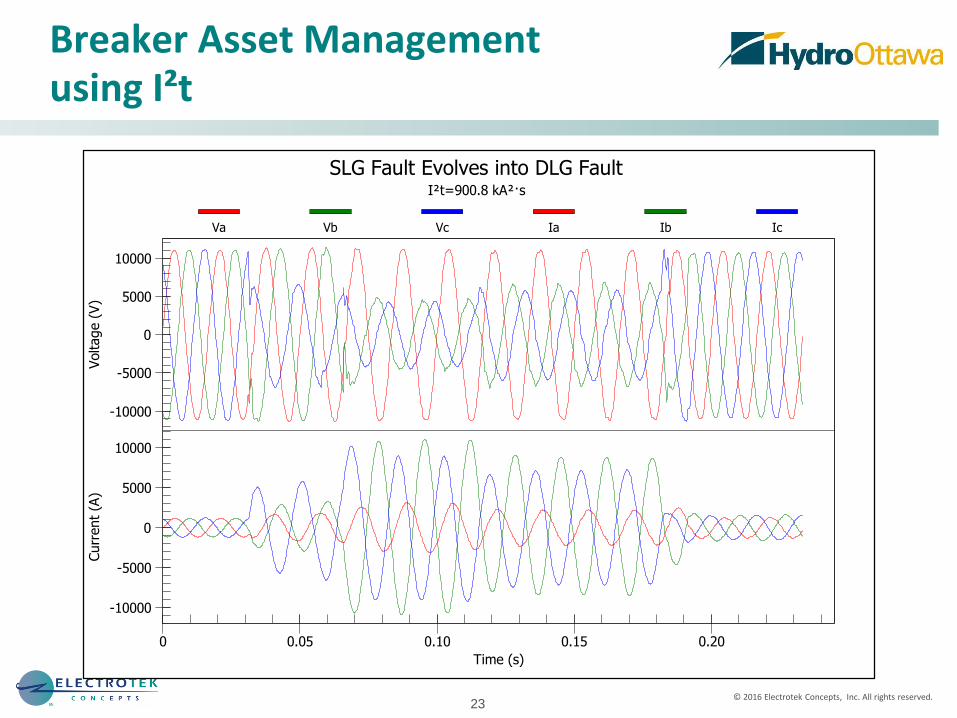
Breaker Asset Managementusing I²t
-10000
-5000
0
5000
10000
-10000
-5000
0
5000
10000
0 0.05 0.10 0.15 0.20
SLG Fault Evolves into DLG FaultI²t=900.8 kA²·s
Voltage (
V)
Curr
ent
(A)
Time (s)
Va Vb Vc Ia Ib Ic

24© 2016 Electrotek Concepts, Inc. All rights reserved.
Future Trend: Comprehensive Power Quality Monitoring Systems
•Integrated Monitoring of Many Types of IEDs– IEEE 1159.3 PQDIF
– IEEE C37.111-2013/IEC 60255-24:2013 COMTRADE
– IEC 61850
•Single-Event Analysis– IEEE 1159, IEEE 1564
•Site-Site and System Indices– IEEE 1564, 1453, 519
•Automated Summaries & Compliance Reporting– EN 50160, IEC 62749
•Fault Analysis & Fault Location– IEEE C37.114-2014
•Real-Time and Historical Data Analytics– IEEE Working Group on Power
Quality Data Analytics
•Device Asset Management