power quality fundamentals and monitoring ross m. ignall systems applications manager, dranetz-bmi...
TRANSCRIPT

Power Quality Fundamentals and Monitoring
Ross M. Ignall
Systems Applications Manager, Dranetz-BMI
What We Will Cover…
- Defining Power Quality and Reliability
- PQ References & Fundamentals
- Monitoring, Measuring High Reliability
Facilities
- Case Studies
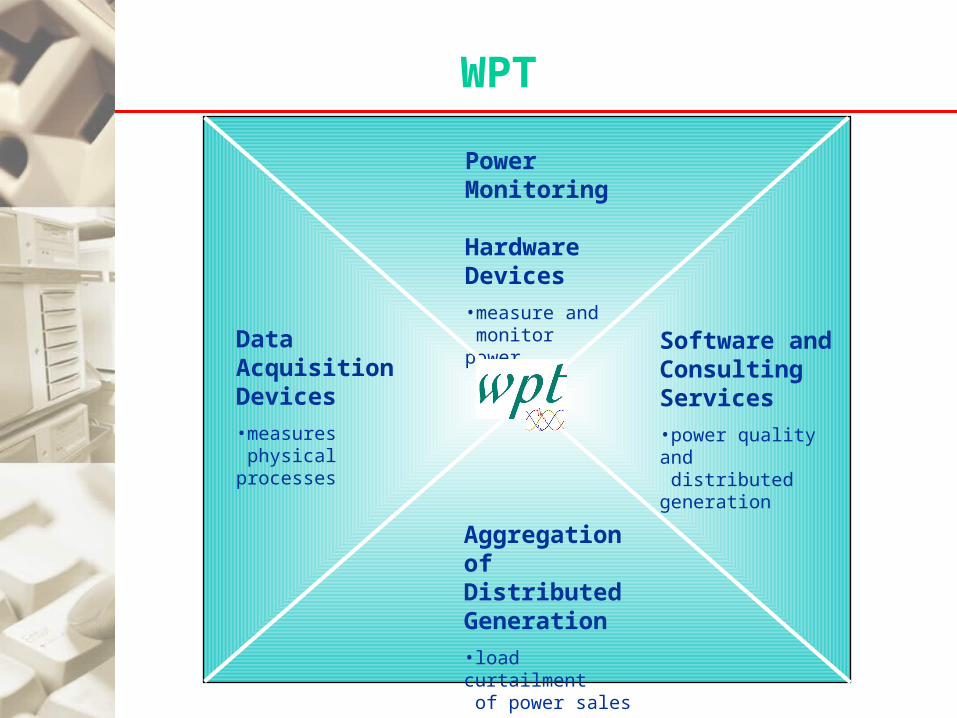
WPT
Power Monitoring Hardware Devices
•measure and monitor power
Aggregation of Distributed Generation
•load curtailment of power sales
Data Acquisition Devices
•measures physical processes
Software andConsulting Services
•power quality and distributed generation

Defining Power Quality & ReliabilityDefining Power Quality & Reliability

What is a Power Quality Problem?
“Any occurrence manifested in voltage,
current, or frequency deviations that
results in failure or mis-operation
of end-use equipment.”
What Does That Mean?
It’s dependant on your susceptibility.
Given the quality of supply do I have
to worry about problems with my
equipment or systems?
What You Should Be Asking…
What is my susceptibility
to power problems?
What is my economic exposure
to such problems?
$$$$

Types Of Power Quality Problems

Who’s Problem Is It?
Neighbor8% Other
3%Customer 12%
Utility17%
Natural60%
Customer’s Perspective*
* Georgia Power Survey

Who’s Problem Is It?
Utility Perspective*
* Georgia Power Survey
Other0%
Neighbor8%
Customer25%
Utility1%
Natural66%
The Big Picture
It’s the complete
electrical environment,
not just the
quality of supply

What You Should Be Asking…
Be Proactive!
Does my power system have the
capacity for my present needs?
How about future growth?

An Analogy…
“Just because I have blank checks
doesn’t mean that I have money in
the bank to cash them”
Ron Rainville, COO, US Data Centers
Some FactoidsSome Factoids

$50 billion per year in the USA is lost as a result of power
quality breakdown.SOURCE: EPRI, 2000
Half of all computer problems and one-third of all data loss can be traced back to the power line.SOURCE: Contingency Planning Research, LAN Times
Sandia National Laboratories estimates power quality and reliability problems cost US businesses approx. $150 billion annually in lost data, materials and productivity—60% are sags
In 1999, the amount lost as a result of power quality in the US was five times the amount spent on power quality worldwide
Power Quality Factoids
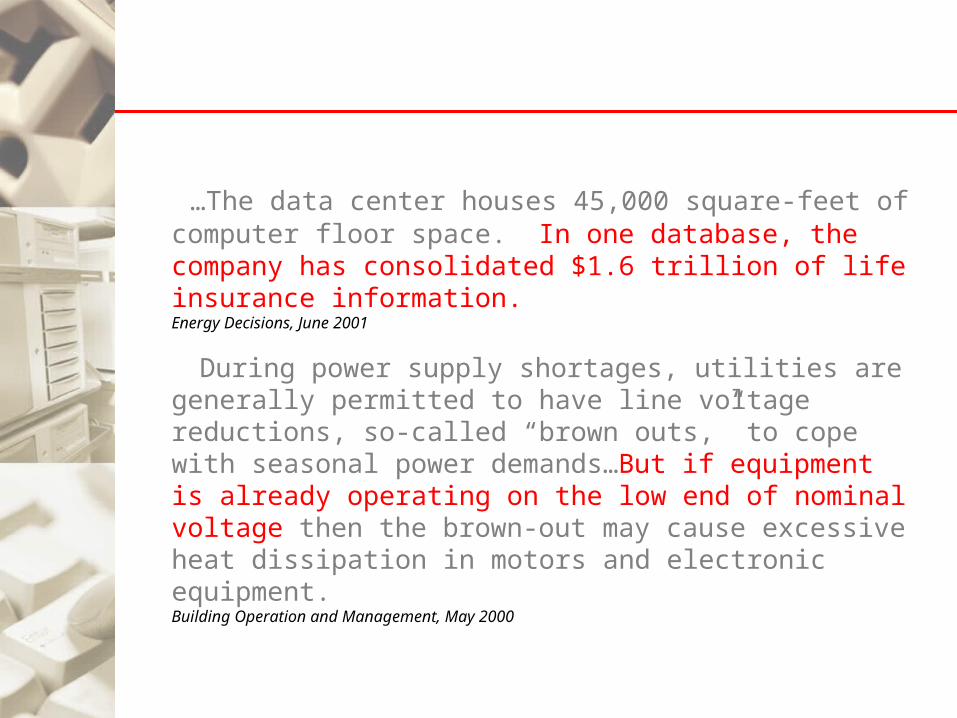
…The data center houses 45,000 square-feet of computer floor
space. In one database, the company has consolidated $1.6 trillion of life insurance information.Energy Decisions, June 2001
During power supply shortages, utilities are generally permitted to have line voltage reductions, so-called “brown outs,” to cope with seasonal power demands…But if equipment is already operating on the low end of nominal voltage then the brown-out may cause excessive heat dissipation in motors and electronic equipment. Building Operation and Management, May 2000

Power Density Factoids
Traditional data center or large office building – 20-30 W/sq. ft., Internet Data Center, on-line brokers, web hosts – 100-150 W/sq. ft.
A web-enabled Palm Pilot requires as much electricity as a refrigerator
Mark Mills
Transformation: Former 16 story Macy’s building used to consume 10 W/sq. ft. Now a telecommunications hotel that according to the utility could require 50 W/sq. ft.
NY Times, July 3, 2000

Costly Downtime!
Industry Avg cost of downtime ($/hr)
Brokerage $6,450,000Credit Card $2,600,000Pay Per View $150,000Home Shopping $113,000Catalog Sales $90,000Airline Reservations $90,000Tele-Ticket $69,000Package Shipping $28,000ATM Fees $14,400
Source: 7x24 Exchange

Introduction to Power
Quality

Power Grid Review
GENERATOR13.8kV-24kV
TRANSMISSION115k-765kV
DISTRIBUTION34.5k-138kV4k-34.5kV12,470Y/7200V CONSUMER
4160Y/2400480Y/277V208Y/120V240/120V
LOAD
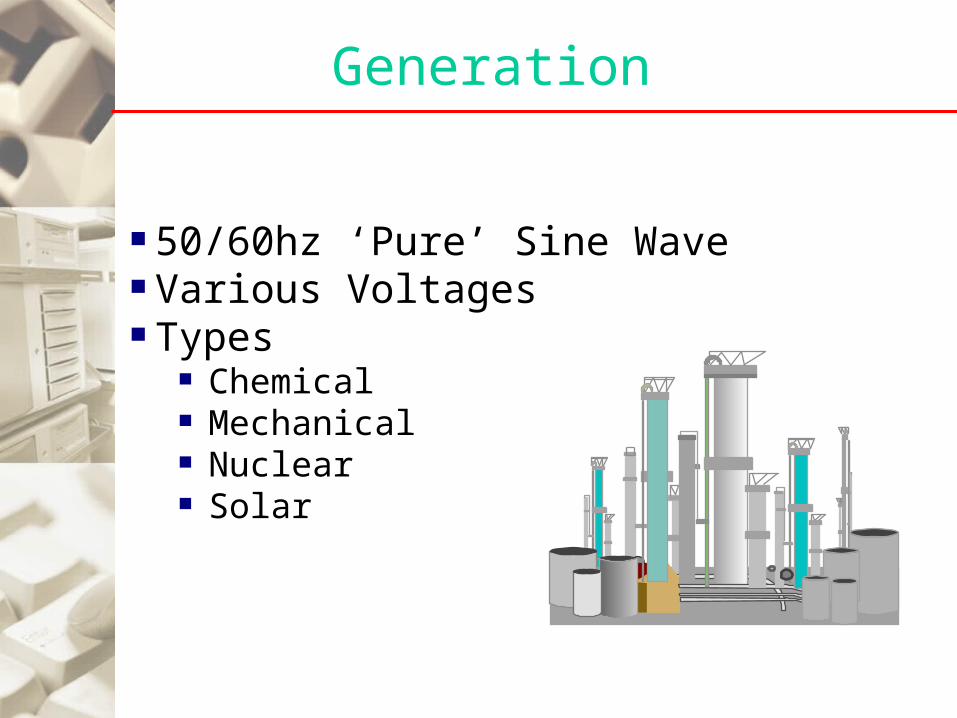
Generation
50/60hz ‘Pure’ Sine Wave Various Voltages Types
Chemical Mechanical Nuclear Solar
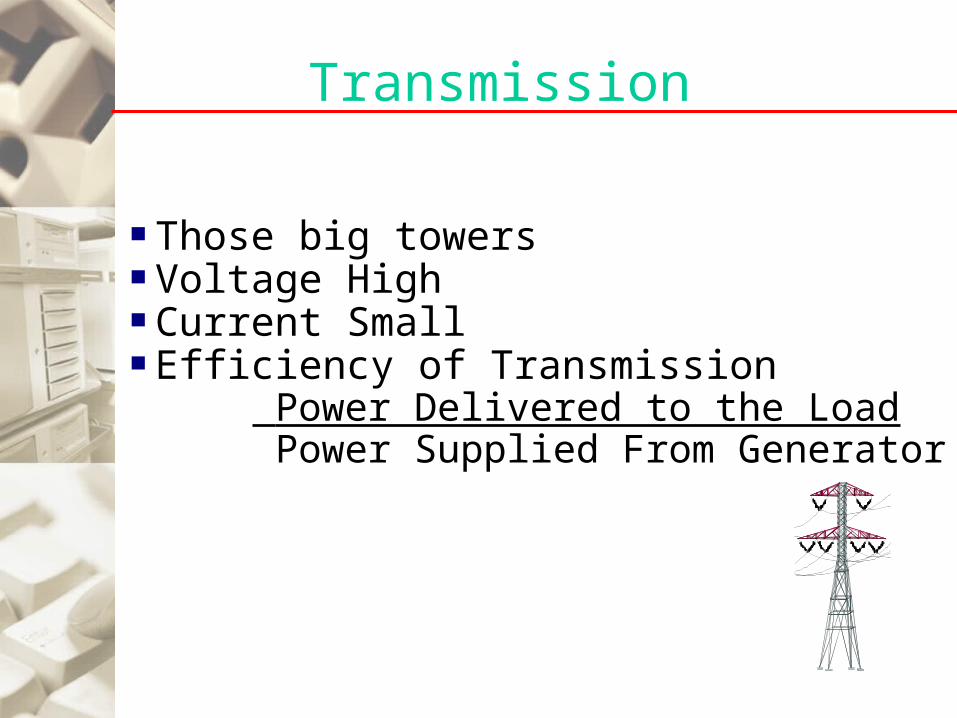
Transmission
Those big towers Voltage High Current Small Efficiency of Transmission
Power Delivered to the Load Power Supplied From Generator

Distribution
Typically 13kV Commercial/Industrial - Three Phase, 480/277V Residential - Split Phase
480V480V
480V13kV

Single Phase Circuit Diagram
LOAD
V lineIs
Vn

Can Wiring and Grounding Affect Power Quality?
“That’s one of the things about living in an old house that drives me nuts. Never enough outlets!”

ACTUAL SINGLE PHASE CIRCUIT DIAGRAM
LOAD
Vpcc Vdp V line
L2 R2L1 R1
L3 R3
L5 R5
L4 R4
L6 R6
Is
I n1l n2
I g2 l g1
Vn
Vg

Sources Of Power Problems
Referenced at the utility PCC (point of common coupling)
Utility lightning, PF correction caps, faults,
switching, other customers
Internal to the facility individual load characteristicswiringchanging loads

Power Quality
References & Terms

IEEE Standards Coordinating Committee
• SCC-22• Oversees development of all PQ standards in the
IEEE• Meet at both Summer and Winter Power
Engineering Society meetings• Coordinate standards activities• Progress reports• Avoid overlap and conflicts• Sponsors task forces to develop standards
1433 Task Force to pull together terms. IEEE & IEC

IEEE Standard 1159-1995
Definition of Terms
Monitoring Objectives
Instruments
Applications
Thresholds
Interpreting Results

IEEE 1159
• 1159.x Task Force Data Acquisition & Recorder Requirements for 1159-1995 Combination of 1159.1 & 1159.2 Coordination with IEC standards (61000-4-30 and revisions) New recommended practice to be developed by July 2001
• 1159.3 Task Force Power Quality Data Interchange Format (PQDIF) Format for the exchange of PQ and other information between
applications Developed by Electrotek Concepts

IEEE 519-1992
Recommended Practice For Harmonics Recommends Limits at the PCC
Voltage Harmonics Current Harmonics
Ongoing work to modify IEEE 519-1992 Limits for within a facility Frequency dependant

International Electrotechnical Commission (IEC)
International standards for all electrical, electronic and related technologies.
IEC Study Committee 77A – Electromagnetic Compatibility, presently 5 Working groups
SC77A/WG 1: Harmonics and other low-frequency disturbances
SC77A/WG 2 : Voltage fluctuations and other low-frequency disturbances
SC77A/WG 6 : Low frequency immunity tests SC77A/WG 8: Electromagnetic interference related
to the network frequency SC77A/WG 9: Power Quality measurement
methods

TransientsRMS Variations
Short Duration VariationsLong Duration VariationsSustained
Waveform DistortionDC OffsetHarmonicsInterharmonicsNotching
Voltage FluctuationsPower Frequency Variations
Types Of Power Quality Disturbances (as per IEEE 1159)

Transient Characteristics
High frequency "event"also called Spike, ImpulseRise time (dv/dt)Ring frequencyPoint-on-waveRelative versus Absolute amplitudeMultiple zero crossings

Transients
-200
-100
0
100
200
UnipolarPositive
Negative
NotchingOscillatory
Multiple Zero Crossings
Bipolar

Possible Causes
• PF cap energization
• Lightning
• Loose connection
• Load or source switching
• RF burst
Possible Effects
• Data corruption
• Equipment damage
• Data transmission errors
• Intermittent equipment operation
• Reduced equipment life
• Irreproducible problems
Transients

A transient power quality event has occurred on DataNode H09_5530. The event occurred at 10-16-2001 05:03:36 on phase A. Characteristics were Mag = 478.V (1.22pu), Max Deviation (Peak-to-Peak) = 271.V (0.69pu), Dur = 0.006 s (0.35 cyc.), Frequency = 1,568. Hz, Category = 3 Upstream Capacitor Switching
Power Factor Correction Capacitor Transient

RMS Voltage Variations
Instantaneous (0.5 - 30 cycles) Sag (0.1 - 0.9 pu) Swell (1.1 - 1.8 pu)
Momentary (30 cycles - 3 sec) Interruption (< 0.1 pu, 0.5 cycles - 3s) Sag Swell
Temporary (3 sec - 1 minute)

RMS Voltage Variations
-200
-150
-100
-50
0
50
100
150
200Sag Swell Interruption

SAGSOURCE GENERATED
DURATION fault clearing schemes may be series of sags (3-4)
MAGNITUDE distance from source feeder topology cause
LOAD CURRENT usually slightly higher, decrease, or zero

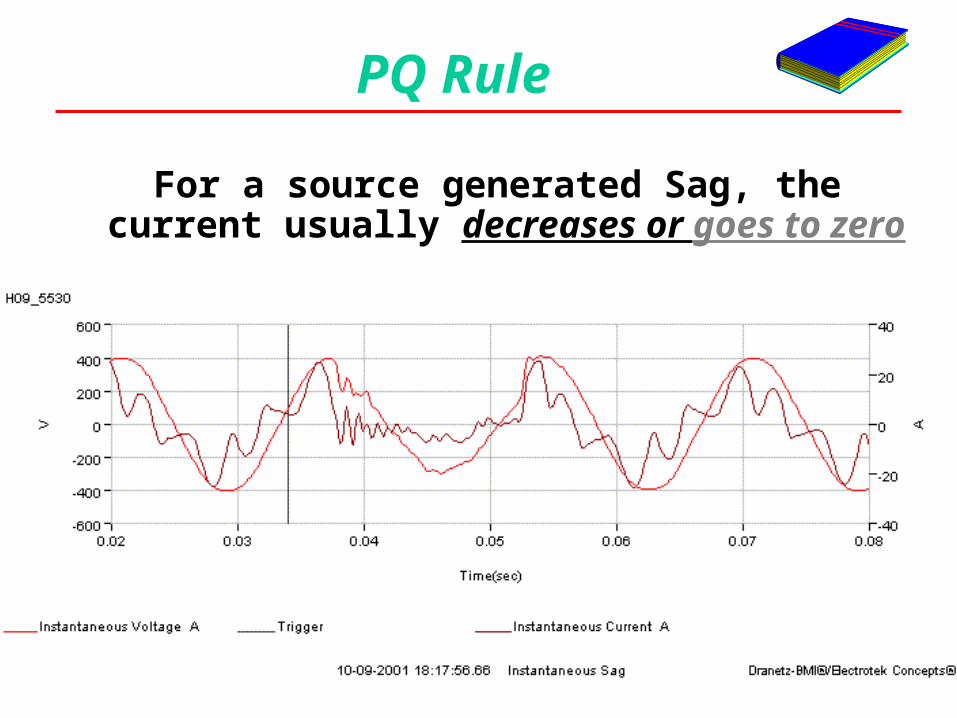
PQ Rule
For a source generated Sag, the current usually decreases or goes to zero
PQ Rule
For a source generated Sag, the current usually decreases or goes to zero
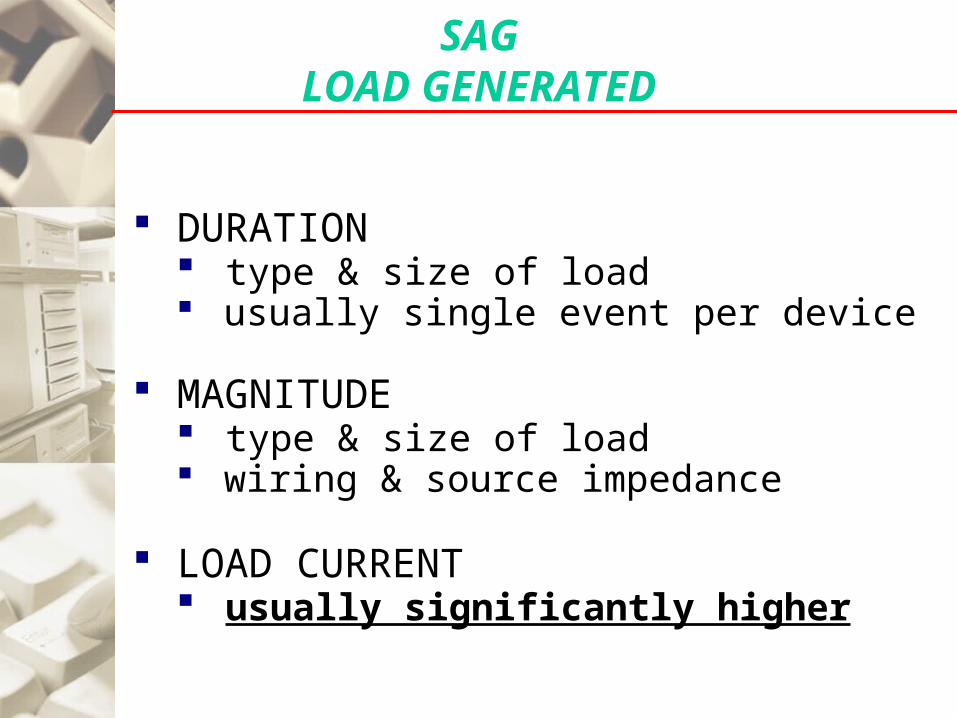
SAGLOAD GENERATED
DURATION type & size of load usually single event per device
MAGNITUDE type & size of load wiring & source impedance
LOAD CURRENT usually significantly higher

PQ Rule
For a load generated Sag, the current usually increases significantly.
09/24/00 12:09:54Threshold crossed: 2280.0 VCATEGORY: Short Duration Momentary Sag
Magnitude: 2160.0 VDuration: 2.901 sec.
CHA Volts CHB Volts CHC Volts CHD Volts CHA Amps CHB Amps CHC Amps CHD Amps
Volt
sA
mp
s
12:09:54.40 12:09:54.45 12:09:54.50 12:09:54.55 12:09:54.60 12:09:54.65
-4000
-3000
-2000
-1000
0
1000
2000
3000
4000
-2500
-2000
-1500
-1000
-500
0
500
1000
1500
2000

Motor Starting - Another Cause of Sags
Timeplot Chart
09/13/96 09:49:00.50 - 09/13/96 09:49:04.00
Min Max Median CHA Vrms 206.11 222.25 219.19 CHA Irms 1.40 847.71 207.16
CHA Vrms CHA Irms 09:49:00.5 09:49:01.0 09:49:01.5 09:49:02.0 09:49:02.5 09:49:03.0 09:49:03.5 09:49:04.0
Volts
205.0
207.5
210.0
212.5
215.0
217.5
220.0
222.5 Amps
0
100
200
300
400
500
600
700
800
900

Motor Starting – Inrush Current with decay
Waveforms
AI RMS Norm to Hi at 09/13/96 09:49:00.967
CHA Volts CHA Amps
09:49:00.8 09:49:01.0 09:49:01.2 09:49:01.4 09:49:01.6 09:49:01.8 09:49:02.0 09:49:02.2
Volts
-500
-400
-300
-200
-100
0
100
200
300
400
Amps
-2000
-1500
-1000
-500
0
500
1000
1500

SWELLS
Sudden change in load Line-to-ground fault on another phase Often precede a sag

SWELLS when Load Drops Off
10/12/01 14:44:04High Threshold: 12.0 VLow Threshold: 0.0 V
A B C D AB BC CAVrmsmin 460.9 456.9 456.7 0.161 460.9 456.9 456.7
CHA Volts CHB Volts CHC Volts CHD Volts CHA Amps CHB Amps CHC Amps CHD Amps
Vo
lts
Am
ps
14:44:04.20 14:44:04.25 14:44:04.30 14:44:04.35 14:44:04.40 14:44:04.45 14:44:04.50
-750
-500
-250
0
250
500
750
-3000
-2000
-1000
0
1000
2000
3000
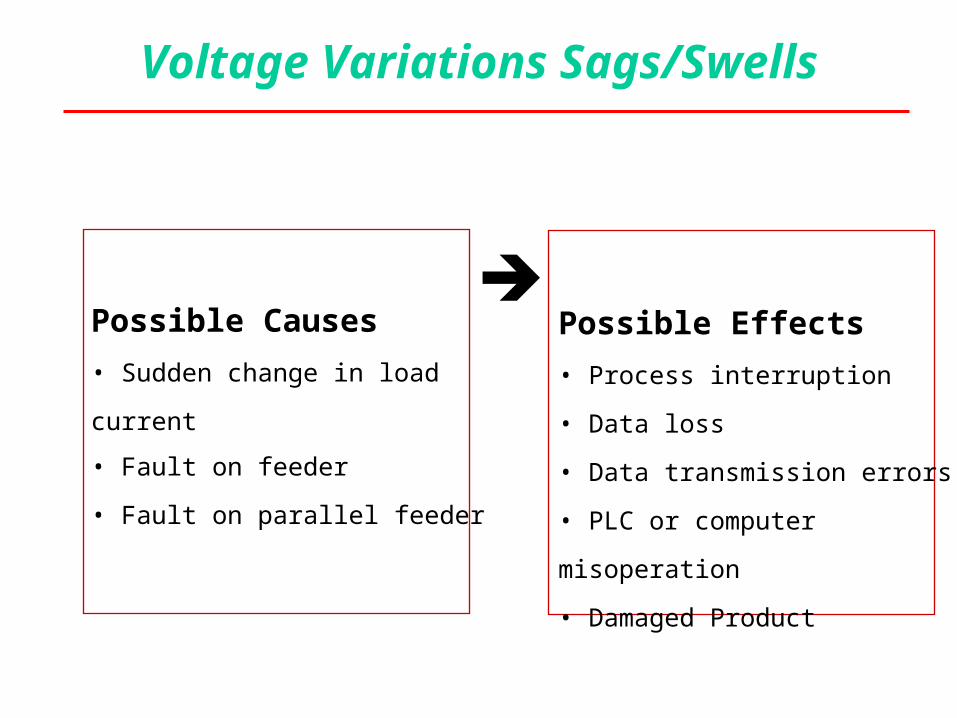
Possible Causes
• Sudden change in load current
• Fault on feeder
• Fault on parallel feeder
Possible Effects
• Process interruption
• Data loss
• Data transmission errors
• PLC or computer misoperation
• Damaged Product
Voltage Variations Sags/Swells

• CBEMA• ITIC• Equipment Susceptibility• 3-D Mag-Dur• DISDIP
Magnitude & Duration Visualization

IEEE 446 - 1995 Limits

Information Technology Industry Council (ITIC) Curve
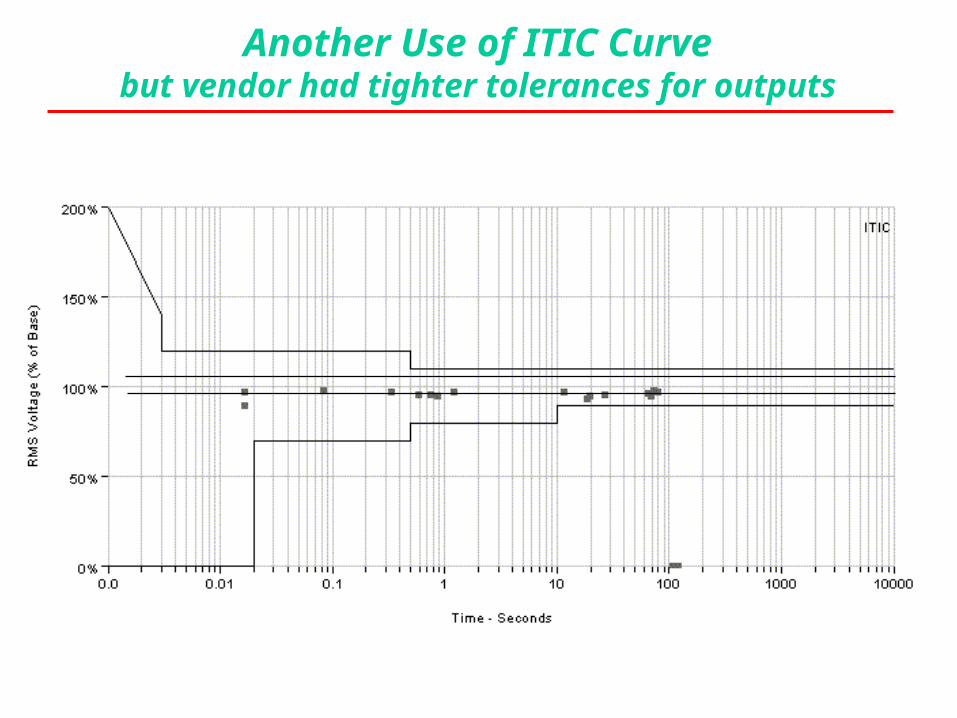
Another Use of ITIC Curvebut vendor had tighter tolerances for outputs

Another Perspective – 3D Mag-Dur Histogram
11223
4567
8910
11
Frequency
• Usually not the utility• Sources of frequency problems
Co-gen UPS Engine generator systems
• Clocks run fast

Harmonics
Event waveform/detail
Waveform event at 10/14/93 11:19:27.75
CHD Amps
11:19:27.84 11:19:27.86 11:19:27.88 11:19:27.90 11:19:27.92 11:19:27.94
Amps
-4
-3
-2
-1
0
1
2
3
4dx=00:30:08
Event waveform/detail
Total RMS: 1.44 AmpsDC Level : -0.04 Amps
Fundamental(H1) RMS: 0.48 AmpsTotal Harmonic Distortion (H02-H50): 246.72 % of FNDEven contribution (H02-H50): 73.96 % of FNDOdd contribution (H03-H49): 235.38 % of FND
Waveform event at 10/14/93 11:19:27.75
CHD Amps
Thd H02 H04 H06 H08 H10 H12 H14 H16
% of FND
0
50
100
150
200
250

An integer multiple of the fundamental frequency
Fundamental (1st harmonic) = 60hz
2nd = 120hz
3rd = 180hz
4th = 240hz
5th = 300hz
…
What is a harmonic?
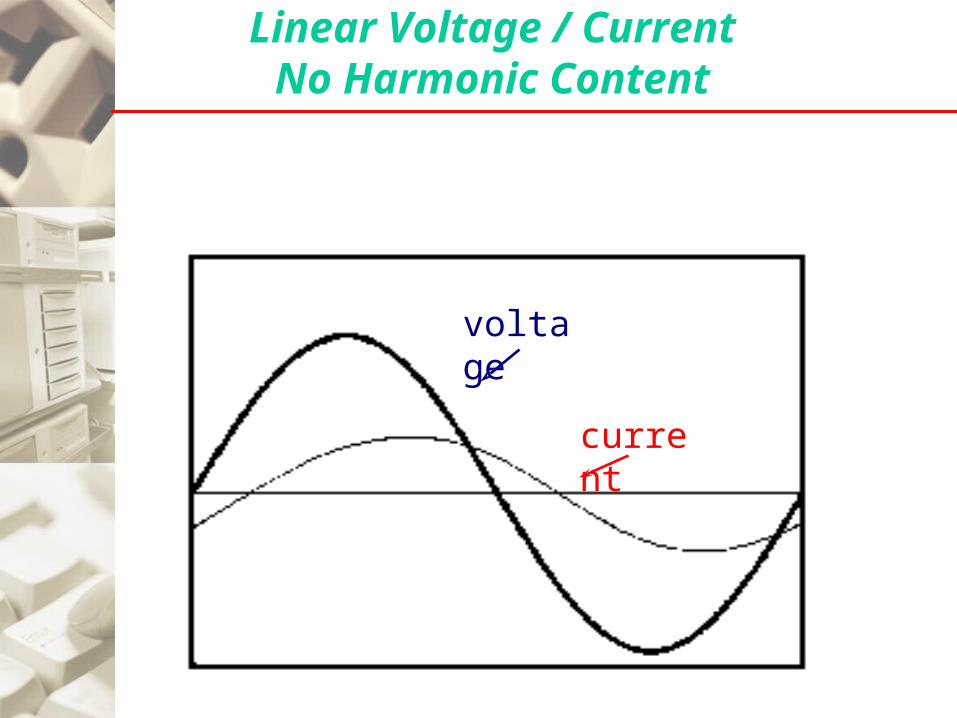
Linear Voltage / CurrentNo Harmonic Content
voltage
current
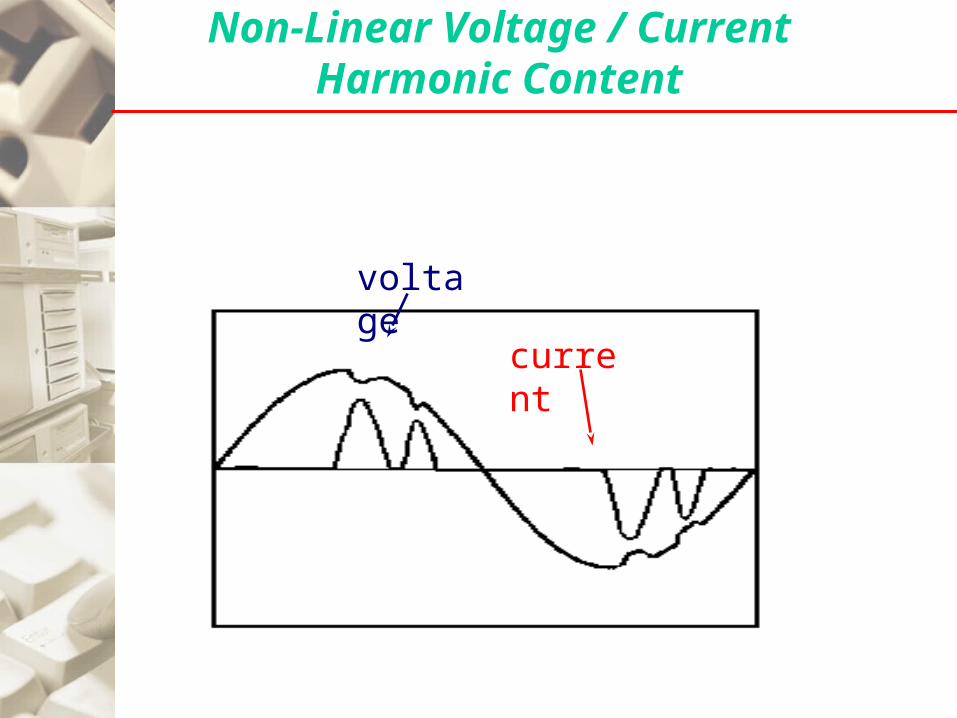
Non-Linear Voltage / CurrentHarmonic Content
voltage
current

NEC 1996: Non - Linear Load
"A load where the waveshape of the steady-state current does not follow the
waveshape of the applied voltage."
voltage
current

Harmonics
Steady state distortionPeriodic or continuous in nature
IEEE-519-1992 / US harmonics IEC 61000-3-2&3 European harmonic limits
-1.50
-1.00
-0.50
0.00
0.50
1.00
1.50
0.02 0.03 0.05 0.07 0.08
Amps
Time (Sec)

Harmonic Measurements
Total Harmonic Distortion (THD) Ratio, expressed as % of sum of all harmonics to:
Fundamental (THD) Total RMS Load Current (I TDD only)
Individual Harmonics 2, 3, 4, 5, 6…50+ Fourier Transform, FFT, DFT
Interharmonics Content between integer harmonics

Composite WaveformEvent waveform/detail
CHA Volts
05:35:31.26 05:35:31.28 05:35:31.30 05:35:31.32 05:35:31.34 05:35:31.36 05:35:31.38 05:35:31.40
Volts
-50000
-40000
-30000
-20000
-10000
0
10000
20000
30000
40000
50000

Harmonic SpectrumEvent waveform/detail
Total RMS: 24882.56 VoltsDC Level : 880.46 Volts
Fundamental(H1) RMS: 24725.89 VoltsTotal Harmonic Distortion (H02-H50): 10.60 % of FNDEven contribution (H02-H50): 7.97 % of FNDOdd contribution (H03-H49): 6.99 % of FND
CHA Volts
Thd H05 H10 H15 H20 H25 H30
% of FND
0.0
2.5
5.0
7.5
10.0
12.5

PQ Rule
Even harmonics usually do not appear in a properly operating power system.
Symmetry Positive & Negative halves the same:
Only odd harmonics.If they are different: Even & Odd
harmonics

Possible Effects
• Overload of neutral conductors
• Overload of power sources
• Low power factor
• Reduced ride-through
Possible Causes
• Rectified inputs of power supplies
• Non-symmetrical current
• Intermittent electrical noise from loose connections
Harmonics (sustained)

Electronic Loads Cause Excessive Neutral Currents
Phase A (50 Amps)
Phase B (50 Amps)
Phase C (57 Amps)
Neutral (82 Amps)
ElectronicLoads

Additive Triplen Harmonics

Equipment Susceptibility
Least Susceptible Electrical Heating
Oven Furnaces
Most Susceptible Communications Data Processing
Zero crossing Clock Circuits Transformers, Motors, other inductive loads

IEEE 519 Harmonic Limits
Limits depend on ratio of Short Circuit Current (SCC) at PCC to average Load Current of maximum demand over 1 year
For example, Isc/IL < 20, odd harm <11 = 4.0% Isc/IL 20<50, odd harm < 11 = 7.0% Isc/IL >1000, odd harm > 35 = 1.4%

IEEE 519 Harmonic Limits
Voltage Harmonic Limits depend on Bus V
For example,69Kv and below, ind. harm = 3.0%69Kv and below, THD= 5.0%
161kv and above, ind.harm = 1.0%161kv and above, THD = 1.5%

Harmonics Demo Tool
CH A CH B CH C Neutral
0 50 100 150 200 250-150
-100
-50
0
50
100
150
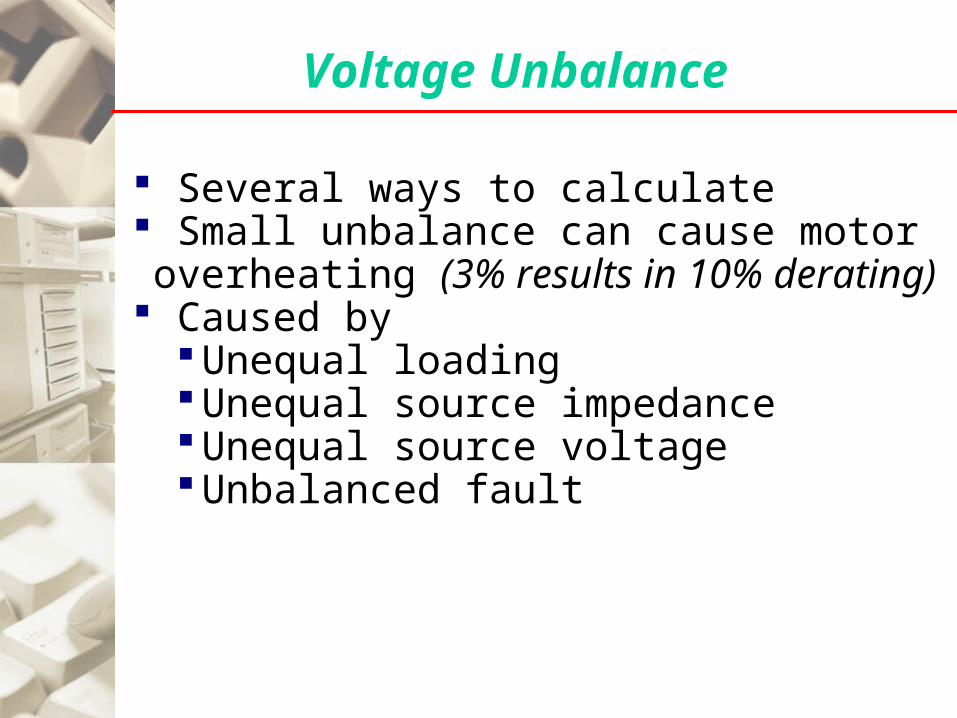
Voltage Unbalance
Several ways to calculate Small unbalance can cause motor overheating (3% results in 10% derating)
Caused byUnequal loadingUnequal source impedanceUnequal source voltageUnbalanced fault

Voltage Fluctuation
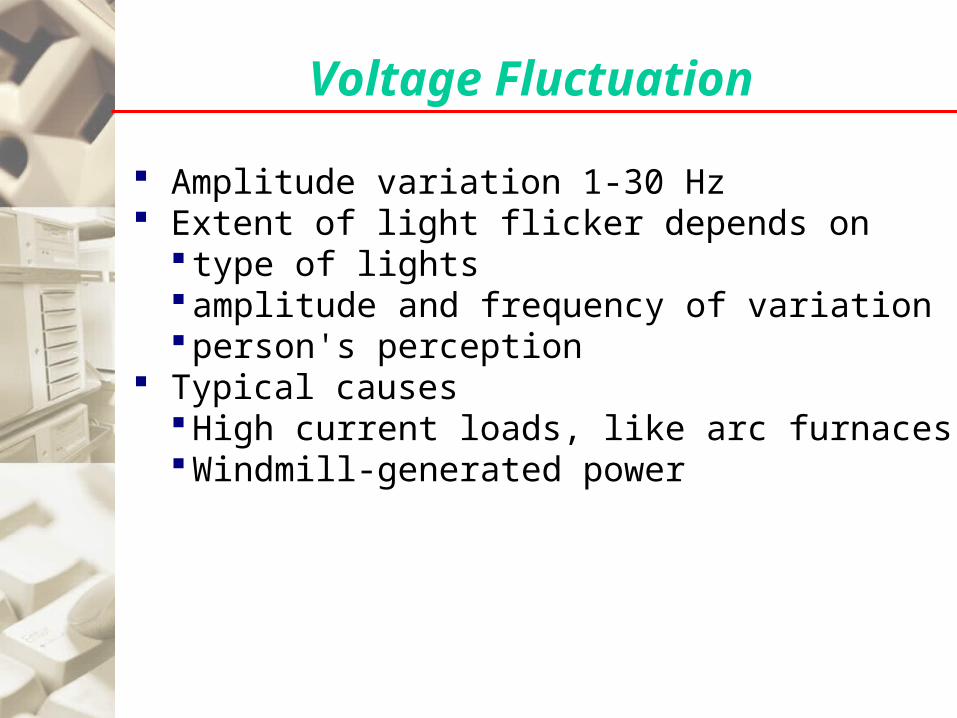
Voltage Fluctuation
Amplitude variation 1-30 Hz Extent of light flicker depends on
type of lightsamplitude and frequency of variationperson's perception
Typical causesHigh current loads, like arc furnacesWindmill-generated power

Voltage Flicker
Timeplot
02/07/2002 00:05:00
CHA VPst() CHB VPst() CHC VPst() 02/06/2002 02/08/2002 02/10/2002 02/12/2002 02/14/2002 02/16/2002 02/18/2002 02/20/2002
0.0
0.5
1.0
1.5
2.0
2.5
3.0
3.5

How Many Can You Find?

Suggested References
[1] Electrical Power Systems Quality, R.C. Dugan et al, McGraw-Hill, 1996 [2] Handbook of Power Signatures, BMI, 2nd Edition, 1993 [3] IEEE Standard 1159-1995, IEEE Recommended Practice for Monitoring Electric Power Quality [4] IEEE Standard 519-1992, IEEE Recommended Practices and Requirements for Harmonic Control in Electrical Power Systems [5] IEEE Standard 1250-1995, IEEE Guide for Service to Equipment Sensitive to Momentary Voltage Disturbances [6] IEEE Standard 446-1995, IEEE Recommended Practice for Emergency and Standby Power Systems for Industrial and Commercial Applications [7] IEEE Standard 142-1991, IEEE Recommended Practice for Grounding of Industrial and Commercial Power Systems [8] Federal Information Processing Standards Publication (FIPS PUB 94) Guideline on Electrical Power for ADP Installations

Case StudyCase Study
Laser PrinterLaser Printer
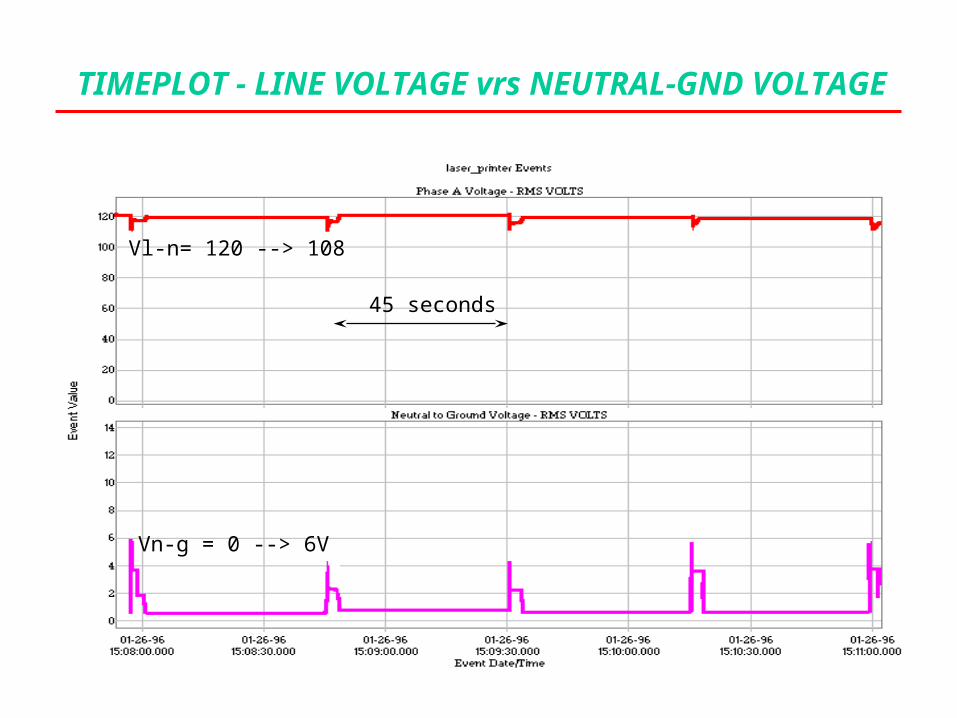
TIMEPLOT - LINE VOLTAGE vrs NEUTRAL-GND VOLTAGE
Vl-n= 120 --> 108
Vn-g = 0 --> 6V
45 seconds
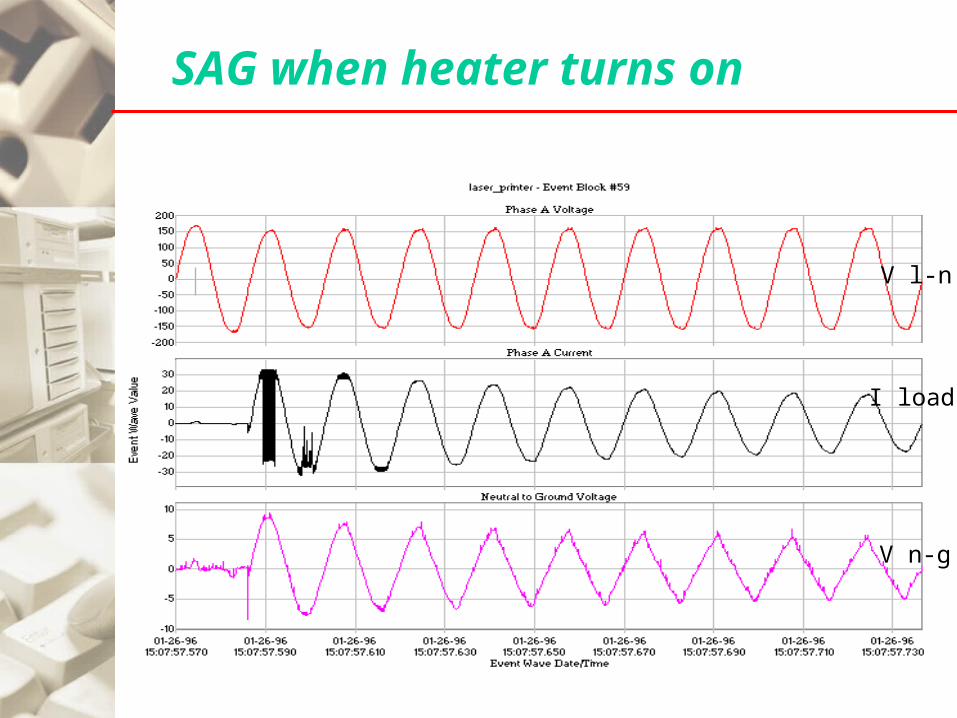
SAG when heater turns on
V l-n
I load
V n-g

Overlay Waveforms - Heater turn on
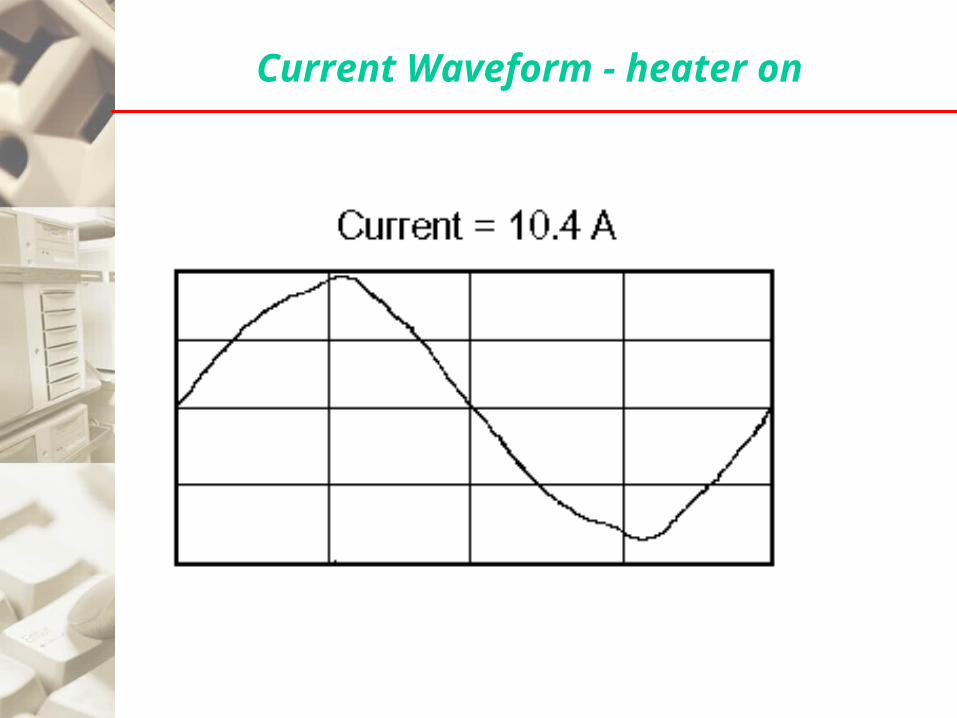
Current Waveform - heater on

HARMONIC DISTORTION - heater on
4.4%
Harmonics V l-n
Harmonics I load
Harmonics V n-g
2.3%

Waveforms when heater turns off
V l-n
I load
V n-g

Harmonic Distortion - Idle
94%
Harmonics V l-n
Harmonics V n-g
Harmonics I load
2.3%

Current With Printer Idle

EQUIVALENT CIRCUIT
121 Vac
0.47 ohms
Idle Load202 ohms
+
-
Source Impedance
I LoadV Load
Heater Load11.9 ohms
0.6A @ 121V 10.4A @ 117V
V n-g
+
-

OBSERVATIONS and PARAMETERS
Nearly Sinusoidal Current– Low Harmonic Distortion (4%)
Voltage and Current In-phase– Power Factor Near One
Flat-topping of Voltage when Idle Corresponds with Current Pulse

OBSERVATIONS and PARAMETERS
Line Voltage Negative Transient on Turn on– Corresponds with Vn-g Positive Transient
Nearly Constant Repetition Rate

SIMILAR SITUATIONS
•Coffee Pot•Coke Machine•Heat Pump

Monitoring, Measuring & Managing Monitoring, Measuring & Managing
High Reliability Facilities High Reliability Facilities

Why Monitor Your Electrical Supply?Why Monitor Your Electrical Supply?


Paradigm Shift?
You may no longer be able to rely You may no longer be able to rely on the utility to be your primary on the utility to be your primary source of power!source of power!
Be Prepared

Why Monitor Your Electrical Supply?
• Quality of supply is of paramount importance
• Huge investment in protection & mitigation is not a guarantee!
• You have a high economic exposure
• Your facility is core to your business or maybe is your business
• You already monitor other critical items
• Your electrical environment is just as important
• You need to balance your needs with available supply
• Loading, cost allocation, etc

You May Already Monitor Your Facility
• Traditional Data Center
• Building Management Systems (BMS), Human Machine Interface Software (HMI)
• Wonderware, Sitescan, ALC, Datatrax, etc
• Via Bacnet, Lonworks, Incomm, modbus, etc
• Internet Data Center
• Network Operations Center (NOC)
• HP Open View, etc
• Via SNMP

What You May Already Monitor
• Traditional Data Center
• UPS - On Bypass, other alarms
• Traditionally do not measure quality
• Sub Metering
• HVAC, Fire, Security
• Internet Data Center
• Network/System Health
• HVAC, Fire, Security
• Electrical Supply is often overlooked
• Quality of supply, Energy/cost allocation
• Power monitoring can interface with existing systems for single point alarming, logging, etc…

Approaches to Power Monitoring
Reactive — Forensic, after the fact.
Proactive — Anticipate system dynamics
Be Proactive!
Reactive Approach
• Problem Solving, hopefully you’ll find it!
• Portable instrumentation typically used

Proactive Approach
• Permanently installed monitoring systems
• Anticipate the future – on-line when trouble occurs
• Monitor system dynamics
• Preventive Maintenance, Trending, identify
equipment deteriorationBe Proactive!

Power Quality vs. Power Flow
• Power Quality Monitoring - Quality of SupplyQuality of Supply
• Monitor for harmful disturbances, harmonics, etc• Microsecond, Sub-Cycle Measurements• In close accordance with IEEE 1159 & IEC
• Power Flow Monitoring - How much, cost, when & where?How much, cost, when & where?
• Energy & Demand, Measured over seconds• Be Careful! False sense of security
• Blind to common PQ problems
Use a PQ instrument for PQ monitoring!

Comprehensive Power Monitoring
• Combined Power Quality and Flow
• Monitor PQ at critical locations• Utility service, UPS, PDU’s, loads• Energy provided along with PQ
• Monitor Energy at less critical locations & individual loads
• Loading• Sub Metering• Cost Allocation, etc…

Emerging Technologies
• Reduced Cost
• Web monitoring • Networked systems• Native web access
• Maximize Assets• Sharing of information among systems and groups within the organization
• Expert Systems
• Enterprise Systems• Pull together various separate systems

Enterprise Systems
• Traditional Facilities• Power monitoring system interfacing with building management, HMI or other systems• Notification, metering, trending• OPC. Modbus, e-mail
• Internet Data Center • Interface with Network Operations Center (NOC)• Notification, metering, trending• Simple Network Management Protocol (SNMP)

Expert Systems
• Reduced budgets means less people!
• Less expertise
• Analysis of Data in order to Identify Problems
• Automatic, no user intervention, results embedded in data
• Identify certain disturbances and directivity.
• Upstream or downstream
• Answers Questions Such As…
• Was that Sag from the utility or within my facility?

Expert Systems
• UPS Performance Verification
• Correlation of Input vs. Output
• Verify continued performance over time
• Proactively identify downstream problems
• Monitor UPS status via analog/contact inputs
• Remotely access UPS status signals
• Compare recorded data to UPS status

Expert Systems
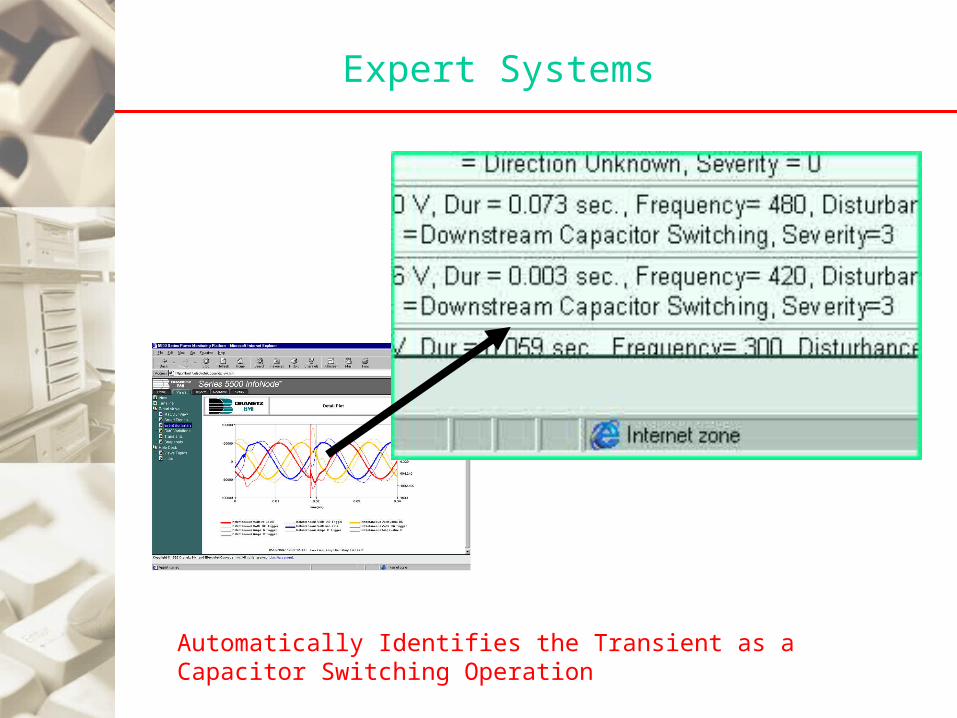
Expert Systems
Automatically Identifies the Transient as a Capacitor Switching Operation

Where To Monitor?
• Utility Service Entrance
• Evaluate your energy provider
• Monitor redundant feeds
• UPS Output
• Is your UPS working as designed?
• Evaluates critical bus as problems could be downstream
• PDU/Distribution
• Provides the ability to identify the source of a problem. Why did that breaker trip?
• Loading/Cost allocation
• Actual loads


Case StudyCase Study
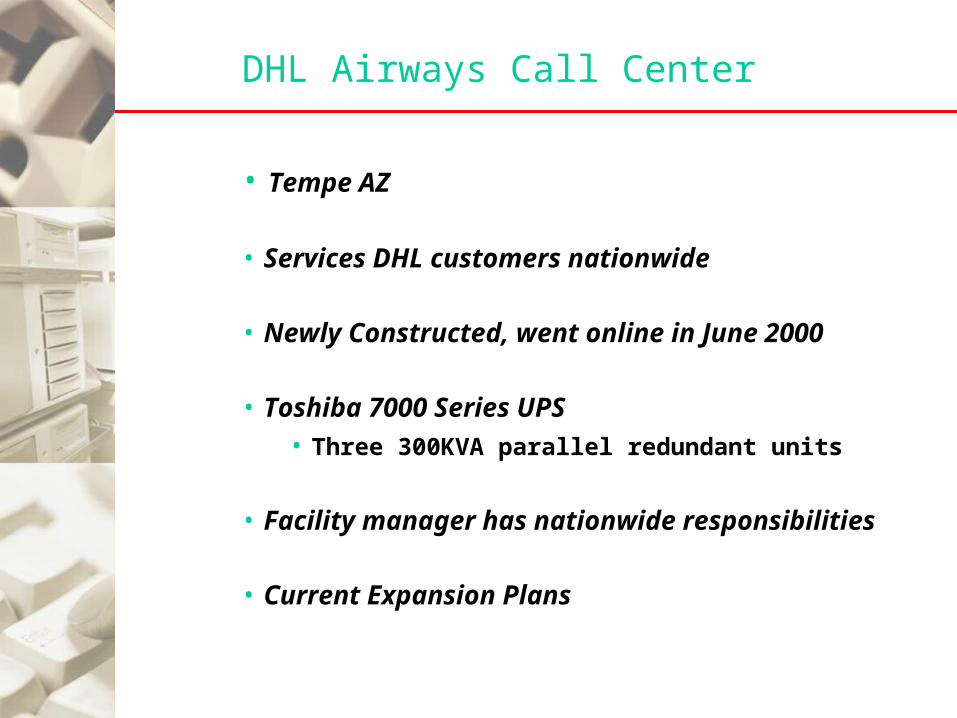
DHL Airways Call Center
• Tempe AZ
• Services DHL customers nationwide
• Newly Constructed, went online in June 2000
• Toshiba 7000 Series UPS• Three 300KVA parallel redundant units
• Facility manager has nationwide responsibilities
• Current Expansion Plans

DHL Objectives
• Benchmark performance
• Ensure future reliability
• Easily troubleshoot any problems that may occur
• Automatic notification
• Remotely monitor over DHL network
• Since the facility is new and due to its critical
nature, monitoring approach was very proactive

DHL Monitoring System
• Monitoring Points• UPS Input (Utility Supply)• UPS Output (Critical bus)
• Connected to DHL Intranet
• Dial-up modem connection
• Web browser access from anywhere within DHL
• Automatic E-mail notification
• Web browser access from anywhere with a dial-up connection


Known Problems?
• None!
• Facility operating as planned
• No Outages or other major problems identified
• No UPS Alarms

Utility Supply
50+ Disturbances in the first few months

UPS Output
No disturbances

Utility Monitoring Summary
• Uncovered problems with the utility supply• 50+ disturbances recorded over a 2 month period.
• Sags, transients, waveshape distortion
• Results reported to the utility, they did not know
• Utility investigation• Faulty relay caused the majority of the
disturbances. Corrected

UPS Output Monitoring Summary
• No disturbances on the conditioned UPS output
• Output regulated to within manufacturers specifications
• UPS mitigated many disturbances on the utility feed
• Did what they paid for
• Justified the investment

Conclusion
• Being proactive uncovered problems with the utility
supply that required correction
• Continuous monitoring proved power conditioning
equipment worked as design and to manufacturer’s
specifications. Protected loads were unaffected
• Provided justification to management for power
monitoring systems at other key facilities
• Load profiling helping to determine power requirements
of a planned expansion

Case StudyCase Study

Major Financial Institution
• New York City
• Worldwide company with several facilities in NY
& NJ• 3 UPS Modules
•2 static, 1 rotary
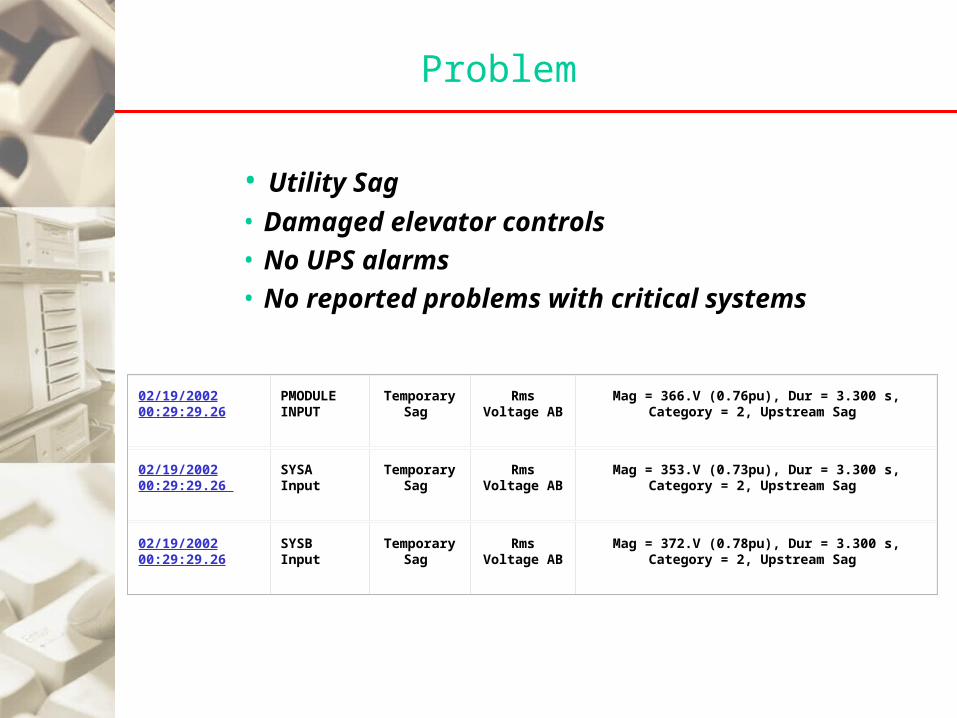
Problem
• Utility Sag
• Damaged elevator controls• No UPS alarms• No reported problems with critical systems
02/19/2002 00:29:29.26
PMODULEINPUT
Temporary Sag
Rms Voltage AB
Mag = 366.V (0.76pu), Dur = 3.300 s, Category = 2, Upstream Sag
02/19/2002 00:29:29.26
SYSA Input
Temporary Sag
Rms Voltage AB
Mag = 353.V (0.73pu), Dur = 3.300 s, Category = 2, Upstream Sag
02/19/2002 00:29:29.26
SYSB Input
Temporary Sag
Rms Voltage AB
Mag = 372.V (0.78pu), Dur = 3.300 s, Category = 2, Upstream Sag

Utility Sag
Utility Supply RMS Trend
Utility Supply Waveforms

Corresponding UPS Swell
Utility Supply
UPS Output
UPS Swell

Conclusion
• Utility sags damaged elevator controls. • Corresponding UPS Swell coincident with Utility return
to normal.• Cause of Swell being investigated…• Possible effects of Swells:
• Damaged power supplies and other devices.• Without monitoring would have never seen this. The
next time it could be worse.

Case StudyCase Study

Federal Aviation Administration
Air Route Traffic Control Center
(ARTCC)
Monitoring System

Simplified Air Traffic Flow
Tower
TRACON
ARTCCARTCCARTCC
TRACON
Tower
Your Flight

FAA’s Objectives
• Monitor critical points throughout each ARTCC
• Determine present status of each ARTCC Facility • Is the electrical supply operating within design parameters?
• Catch problems before they occur• Change approach from Reactive to Proactive
• Correlate power quality to status indicators, panel
meters, transfer switch positions, etc

FAA’s Objectives
• Benchmark long term performance in order to
improve reliability
• Compare measured parameters to simulations
• Have web browser access from anywhere within the
FAA system
• Local ARTCC personnel
• OKC Airway Operational Support (AOS) personnel

Monitoring System
• Monitor 15 points for quality of supply & energy• Utility Service• Generators• UPS’s• Key distribution points• Critical Power Centers
• In parallel monitor other data such as• Transfer switch & breaker positions• Panel meters• Misc indicators
• Web based access to each site via intranet

Initial Results
• Key points operating out of design specs
• Ex: Adjust transformer taps
• Routine maintenance not always performed
as per procedures
• Wiring inconsistent with drawings

Power Quality Fundamentals and Monitoring
Thank You!Thank You!
Questions?Questions?
Ross M. Ignall
Systems Applications Manager, Dranetz-BMI