power quality report · the client has an onsite 11kv/415v step down distribution transformer which...
TRANSCRIPT
CHK Power Quality Pty Ltd, Power quality report - Manufacturing plant, 24 Oct 2016, rev 1.00
Address: Unit 1, 3 Tollis Place, Seven Hills, NSW 2147, Sydney, Australia Telephone: +61 2 8283 6945; Fax: +61 2 8212 8105
Website: www.chkpowerquality.com.au; Enquiries: [email protected]
Get more from your
Page 1
Power quality report
Prepared for
A
Manufacturing Plant
6 May 2016
by
Dr Angelo De Francesco
Power Quality Consultant

CHK Power Quality Pty Ltd, Power quality report - Manufacturing plant, 24 Oct 2016, rev 1.00
Address: Unit 1, 3 Tollis Place, Seven Hills, NSW 2147, Sydney, Australia Telephone: +61 2 8283 6945; Fax: +61 2 8212 8105
Website: www.chkpowerquality.com.au; Enquiries: [email protected]
Get more from your
Page 2
Contents
1 EXECUTIVE SUMMARY ................................................................................................... 4
2 INTRODUCTION ............................................................................................................... 5
2.1 SITE MONITORED .............................................................................................. 5
2.2 MOTIVATION FOR MONITORING ...................................................................... 5
2.3 BACKGROUND INFORMATION ......................................................................... 5
2.4 INSTALLATION ................................................................................................... 5
3 POWER QUALITY DATA ANALYSIS ............................................................................... 7
3.1 LOGGED DATA ................................................................................................... 7
3.1.1 Data range .......................................................................................................... 7
3.1.2 Usable data set .................................................................................................. 7
3.1.3 Data aggregation ................................................................................................ 7
3.1.3.1 10 cycle time interval ................................................................................. 7
3.1.3.2 Average and Min/Max values .................................................................... 7
3.1.4 Flagging .............................................................................................................. 7
3.2 MAINS STEADY STATE VOLTAGE .................................................................... 7
3.2.1 Steady state voltage – average .......................................................................... 7
3.2.2 Steady state voltage - frequency distribution ..................................................... 8
3.2.3 Steady state voltage - Min/Max ........................................................................ 11
3.2.4 Steady state voltage – Earth voltage ............................................................... 12
3.3 MAINS POWER FREQUENCY ......................................................................... 13
3.4 UNBALANCE .................................................................................................... 14
3.5 FLICKER ........................................................................................................... 16
3.6 HARMONICS .................................................................................................... 18
3.6.1 Total harmonic distortion (THD) ....................................................................... 18
3.6.2 Harmonic spectra ............................................................................................. 19
3.7 VOLTAGE DISTURBANCES AND EVENTS ..................................................... 21
3.7.1 Mains signalling ................................................................................................ 21
3.7.2 Transients ......................................................................................................... 21
4 REFERENCES ................................................................................................................ 24
CHK Power Quality Pty Ltd, Power quality report - Manufacturing plant, 24 Oct 2016, rev 1.00
Address: Unit 1, 3 Tollis Place, Seven Hills, NSW 2147, Sydney, Australia Telephone: +61 2 8283 6945; Fax: +61 2 8212 8105
Website: www.chkpowerquality.com.au; Enquiries: [email protected]
Get more from your
Page 3
Figures Figure 1: Main distribution box (left); Sub distribution cabinet (middle); Miro installed within
the sub distribution cabinet (right) ......................................................................................... 5
Figure 2: Mains voltage – graphed over time ........................................................................ 8
Figure 3: Mains voltage – frequency distribution with flagged values .................................... 9
Figure 4: Mains voltage – frequency distribution without flagged values.............................. 10
Figure 5: Min of mains voltage – graphed over time ............................................................ 11
Figure 6: Max of mains voltage – graphed over time ........................................................... 12
Figure 7: Earth voltage – graphed over time ....................................................................... 13
Figure 8: Power frequency – graphed over time .................................................................. 14
Figure 9: Voltage Unbalance – graphed over time .............................................................. 15
Figure 10: Voltage Unbalance – graphed over time ............................................................ 16
Figure 11: Flicker PST – graphed over time ........................................................................ 17
Figure 12: Flicker PLT – graphed over time ........................................................................ 18
Figure 13: Voltage THD ...................................................................................................... 19
Figure 14: Mains voltage – frequency spectra ..................................................................... 20
Figure 15: Mains voltage transient ...................................................................................... 21
Figure 16: Mains voltage transient ...................................................................................... 22
Figure 17: Mains voltage transient ...................................................................................... 22
Figure 18: Mains voltage transient ...................................................................................... 23
Figure 19: Mains voltage transient ...................................................................................... 23

CHK Power Quality Pty Ltd, Power quality report - Manufacturing plant, 24 Oct 2016, rev 1.00
Address: Unit 1, 3 Tollis Place, Seven Hills, NSW 2147, Sydney, Australia Telephone: +61 2 8283 6945; Fax: +61 2 8212 8105
Website: www.chkpowerquality.com.au; Enquiries: [email protected]
Get more from your
Page 4
1 Executive Summary
Motivation for investigation: A recently purchased Test Instrument failed after it was plugged into a General Purpose Outlet (GPO). Findings: The average (nominal) RMS voltage measured was approximately 251V. When ignoring flagged values the voltage limits complied with the appropriate Australian Standard [1]. When considering flagged values, the maximum measured RMS voltage was 259V, which exceeds the value of 253V as provided in the Australian Standard [1]. The Test Instrument user manual refers to an upper operating line voltage which is 245V RMS. It is noteworthy that the upper limit of 245V RMS suggests that the Test Instrument is not designed to accommodate the limits of the Australian LV electricity supply and therefore not suitable to directly connect it to the GPO. All other steady state measurements are considered normal and unlikely to affect the normal operation of the Test Instrument. Transients have been observed, exhibiting repetitive surge voltage events, with the highest recorded value of 1024.3Vpk and duration of less than 52µs. It is very likely that transients were the cause of the Test Instrument failure. Recommendations: Install a device between the GPO and the Test Instrument that can simultaneously lower the nominal RMS voltage such that the upper limit does not exceed 245V RMS and suppress voltage spikes. A device of choice is the constant voltage transformer (CVT). Post implementation review: The author understands that the client has since implemented the recommendations and experienced no other issues with the Test Instrument.

CHK Power Quality Pty Ltd, Power quality report - Manufacturing plant, 24 Oct 2016, rev 1.00
Address: Unit 1, 3 Tollis Place, Seven Hills, NSW 2147, Sydney, Australia Telephone: +61 2 8283 6945; Fax: +61 2 8212 8105
Website: www.chkpowerquality.com.au; Enquiries: [email protected]
Get more from your
Page 5
2 Introduction
2.1 Site monitored
Address of the site.
2.2 Motivation for monitoring The recently purchased Test Instrument failed after it was plugged into a GPO. It is suspected that the mains supply is the culprit and has commissioned this power quality investigation, to monitor the supply voltage feeding the GPO where the instrument was connected. This report analyses the mains voltage to identify events and disturbances that can affect the normal operation of the Test Instrument. 2.3 Background information The client has an onsite 11kV/415V step down distribution transformer which feeds a number of distribution boards. The main distribution board feeds a sub distribution board located at least 10m away.
Figure 1: Main distribution box (left); Sub distribution cabinet (middle); Miro installed within the sub distribution cabinet (right)
2.4 Installation Power quality data was recorded using a Miro PQ45 power quality instrument:
Serial Number: 15749008
Calibration date: 25-02-2016
Firmware version: 0.37

CHK Power Quality Pty Ltd, Power quality report - Manufacturing plant, 24 Oct 2016, rev 1.00
Address: Unit 1, 3 Tollis Place, Seven Hills, NSW 2147, Sydney, Australia Telephone: +61 2 8283 6945; Fax: +61 2 8212 8105
Website: www.chkpowerquality.com.au; Enquiries: [email protected]
Get more from your
Page 6
The Miro PQ45 was installed within the sub distribution cabinet. Four voltage channels, phases A, B C and Earth (referenced to Neutral) were wired to the terminal blocks using tinned ends. Single phase loads are connected via a number of external general purpose outlets (GPO) which are wired back to the sub distribution cabinet.

CHK Power Quality Pty Ltd, Power quality report - Manufacturing plant, 24 Oct 2016, rev 1.00
Address: Unit 1, 3 Tollis Place, Seven Hills, NSW 2147, Sydney, Australia Telephone: +61 2 8283 6945; Fax: +61 2 8212 8105
Website: www.chkpowerquality.com.au; Enquiries: [email protected]
Get more from your
Page 7
3 Power Quality Data Analysis 3.1 Logged data Data is logged at 10 seconds (frequency only), 30 seconds, 10 minutes and 2 hour intervals. 3.1.1 Data range The full data set of logged data spans twenty one days, one hour, forty three minutes and fifty nine seconds [21 days, 1:43:59]. First record: 2016-03-15 14:45:00 Last record: 2016-04-05 15:29:00 3.1.2 Usable data set The data set contains logs of data prior and post to installation and which are effectively removed from the analysis by constricting the data set by altering the first and last records via the date filter. The entered records are: First data record: 2016-03-15: 15:37:33 Last data record: 2016-04-05: 15:24:00 3.1.3 Data aggregation 3.1.3.1 10 cycle time interval The 10-cycle time interval (200ms) is the basic measurement for supply voltage, harmonics, interharmonics and unbalance. 3.1.3.2 Average and Min/Max values The average value is equal to the aggregated value. The Min and Max values are the minimum and maximum 10-cycle values which occur during the log interval. 3.1.4 Flagging
During a dip, swell, or interruption, the measurement algorithm for other parameters (for example, frequency measurement) might produce an unreliable value. The flagging concept therefore, avoids counting a single event more than once in different parameters; for example, counting a single dip as both a dip and a frequency variation. Flagging is only triggered by dips, swells, and interruptions. The detection of dips and swells is dependent on the threshold selected by the user, and this selection will influence which data are flagged. 3.2 Mains Steady state voltage 3.2.1 Steady state voltage – average

CHK Power Quality Pty Ltd, Power quality report - Manufacturing plant, 24 Oct 2016, rev 1.00
Address: Unit 1, 3 Tollis Place, Seven Hills, NSW 2147, Sydney, Australia Telephone: +61 2 8283 6945; Fax: +61 2 8212 8105
Website: www.chkpowerquality.com.au; Enquiries: [email protected]
Get more from your
Page 8
The graph shown in figure 2 displays all aggregated voltage data (includes flagged values) logged at 10 minute intervals.
Figure 2: Mains voltage – graphed over time
Measure Min Max Delta Average
VA-RMS-AVG 246.03 256.27 10.24 251.41
VB-RMS-AVG 245.26 257.08 11.82 251.84
VC-RMS-AVG 246.11 257.14 11.03 252.01
Table 1: Steady state voltage metrics
The average RMS voltage for all three phases is just above 251V. 3.2.2 Steady state voltage - frequency distribution The frequency distribution of mains voltage (histogram) with and without flagged values, are respectively shown in figures 3 and 4 together with their steady state voltage metrics given by tables 2 and 3.
244
246
248
250
252
254
256
258
0 250 500 750 1000 1250 1500 1750 2000 2250 2500 2750 3000 3250
Main
s V
olt
ag
e (
V)
Time index
Mains Voltage (RMS) Average [10 minute intervals]
VA-RMS-AVG VB-RMS-AVG VC-RMS-AVG
257.14
245.26

CHK Power Quality Pty Ltd, Power quality report - Manufacturing plant, 24 Oct 2016, rev 1.00
Address: Unit 1, 3 Tollis Place, Seven Hills, NSW 2147, Sydney, Australia Telephone: +61 2 8283 6945; Fax: +61 2 8212 8105
Website: www.chkpowerquality.com.au; Enquiries: [email protected]
Get more from your
Page 9
Figure 3: Mains voltage – frequency distribution with flagged values
Table 2: Steady state voltage metrics

CHK Power Quality Pty Ltd, Power quality report - Manufacturing plant, 24 Oct 2016, rev 1.00
Address: Unit 1, 3 Tollis Place, Seven Hills, NSW 2147, Sydney, Australia Telephone: +61 2 8283 6945; Fax: +61 2 8212 8105
Website: www.chkpowerquality.com.au; Enquiries: [email protected]
Get more from your
Page 10
Figure 4: Mains voltage – frequency distribution without flagged values
Table 3: Steady state voltage metrics
Parameter V1% V50% V99%
Lower bound 225
Upper bound 244
LIMITS1 216 253
Table 4: Steady state voltage limits from AS 61000.3.100-2011 [1].
By inspection the metrics provided in table 3 for the histogram shown in figure 4, which excludes flagged values, fall within the limits stated in table 4 and is hence compliant with the Australian Standard [1]. According to the power quality measurement methods standard [2] flagged values should be ignored when considering voltage compliance, as the measurement cannot be relied upon. Nevertheless the author has included this information as table 2 shows that the voltage can exceed 256V, above the maximum of 253V provided in table 4.

CHK Power Quality Pty Ltd, Power quality report - Manufacturing plant, 24 Oct 2016, rev 1.00
Address: Unit 1, 3 Tollis Place, Seven Hills, NSW 2147, Sydney, Australia Telephone: +61 2 8283 6945; Fax: +61 2 8212 8105
Website: www.chkpowerquality.com.au; Enquiries: [email protected]
Get more from your
Page 11
3.2.3 Steady state voltage - Min/Max The graphs in figures 5 and 6 display the minimum and maximum aggregated voltages that occurred within the 10 minute log interval.
Figure 5: Min of mains voltage – graphed over time
Measure Min
VA-RMS-MIN 228.58
VB-RMS-MIN 229.10
VC-RMS-MIN 228.84 Table 5: Steady state voltage metrics
The minimum values are well above the minimum value of 216V as provided in table 4.
225
230
235
240
245
250
255
260
0 250 500 750 1000 1250 1500 1750 2000 2250 2500 2750 3000 3250
Main
s V
olt
ag
e (
V)
Time index
Mains Voltage (RMS) Min [10 minute intervals]
VA-RMS-MIN VB-RMS-MIN VC-RMS-MIN

CHK Power Quality Pty Ltd, Power quality report - Manufacturing plant, 24 Oct 2016, rev 1.00
Address: Unit 1, 3 Tollis Place, Seven Hills, NSW 2147, Sydney, Australia Telephone: +61 2 8283 6945; Fax: +61 2 8212 8105
Website: www.chkpowerquality.com.au; Enquiries: [email protected]
Get more from your
Page 12
Figure 6: Max of mains voltage – graphed over time
Measure Max
VA-RMS-MAX 257.86
VB-RMS-MAX 258.58
VC-RMS-MAX 258.83 Table 6: Steady state voltage metrics
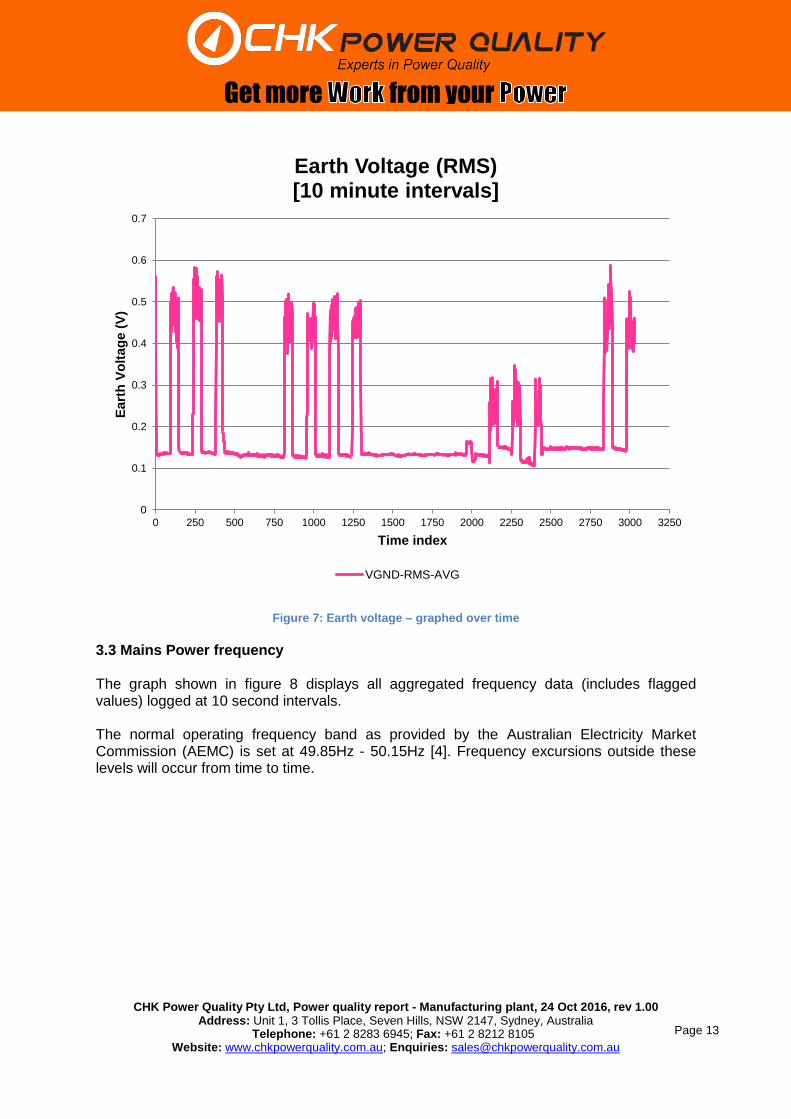
The maximum logged value is just under 259V. 3.2.4 Steady state voltage – Earth voltage Figure 7 shows the average RMS Earth voltage. The voltage is below 0.6V and is within expectation.
244
246
248
250
252
254
256
258
260
0 250 500 750 1000 1250 1500 1750 2000 2250 2500 2750 3000 3250
Main
s V
olt
ag
e (
V)
Time index
Mains Voltage (RMS) Max [10 minute intervals]
VA-RMS-MAX VB-RMS-MAX VC-RMS-MAX
CHK Power Quality Pty Ltd, Power quality report - Manufacturing plant, 24 Oct 2016, rev 1.00
Address: Unit 1, 3 Tollis Place, Seven Hills, NSW 2147, Sydney, Australia Telephone: +61 2 8283 6945; Fax: +61 2 8212 8105
Website: www.chkpowerquality.com.au; Enquiries: [email protected]
Get more from your
Page 13
Figure 7: Earth voltage – graphed over time
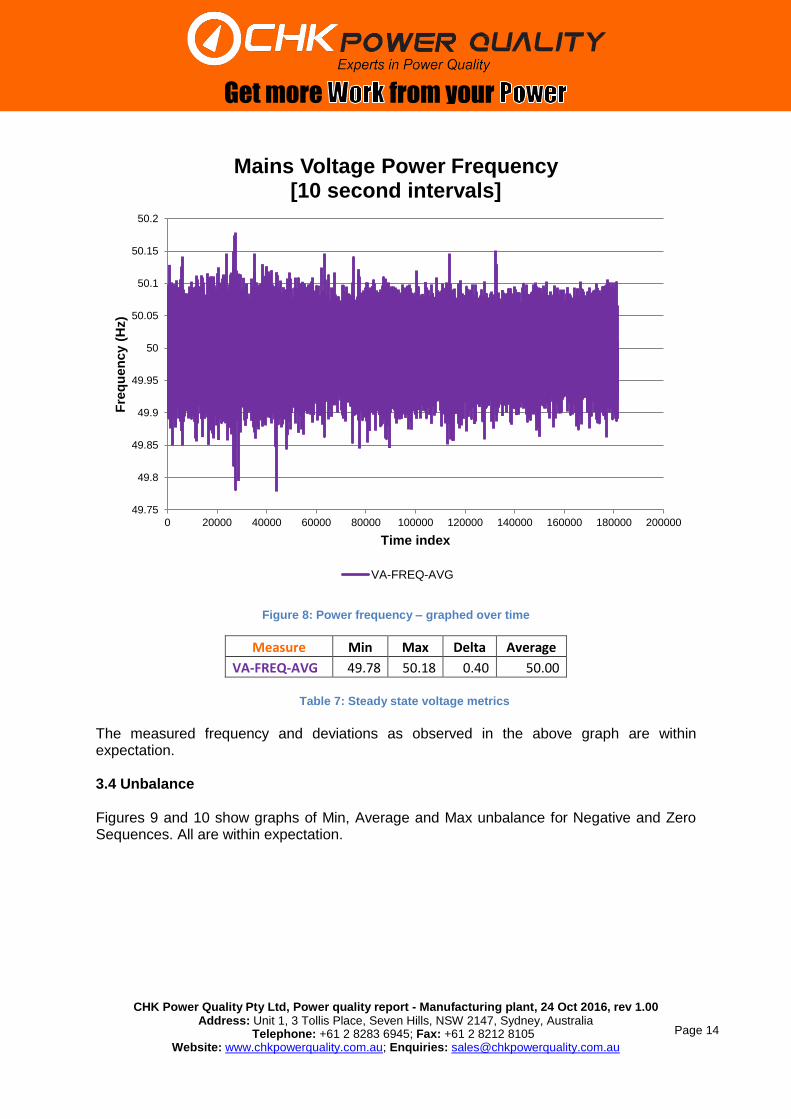
3.3 Mains Power frequency The graph shown in figure 8 displays all aggregated frequency data (includes flagged values) logged at 10 second intervals. The normal operating frequency band as provided by the Australian Electricity Market Commission (AEMC) is set at 49.85Hz - 50.15Hz [4]. Frequency excursions outside these levels will occur from time to time.
0
0.1
0.2
0.3
0.4
0.5
0.6
0.7
0 250 500 750 1000 1250 1500 1750 2000 2250 2500 2750 3000 3250
Eart
h V
olt
ag
e (
V)
Time index
Earth Voltage (RMS) [10 minute intervals]
VGND-RMS-AVG
CHK Power Quality Pty Ltd, Power quality report - Manufacturing plant, 24 Oct 2016, rev 1.00
Address: Unit 1, 3 Tollis Place, Seven Hills, NSW 2147, Sydney, Australia Telephone: +61 2 8283 6945; Fax: +61 2 8212 8105
Website: www.chkpowerquality.com.au; Enquiries: [email protected]
Get more from your
Page 14
Figure 8: Power frequency – graphed over time
Measure Min Max Delta Average
VA-FREQ-AVG 49.78 50.18 0.40 50.00
Table 7: Steady state voltage metrics
The measured frequency and deviations as observed in the above graph are within expectation. 3.4 Unbalance Figures 9 and 10 show graphs of Min, Average and Max unbalance for Negative and Zero Sequences. All are within expectation.
49.75
49.8
49.85
49.9
49.95
50
50.05
50.1
50.15
50.2
0 20000 40000 60000 80000 100000 120000 140000 160000 180000 200000
Fre
qu
en
cy (
Hz)
Time index
Mains Voltage Power Frequency [10 second intervals]
VA-FREQ-AVG

CHK Power Quality Pty Ltd, Power quality report - Manufacturing plant, 24 Oct 2016, rev 1.00
Address: Unit 1, 3 Tollis Place, Seven Hills, NSW 2147, Sydney, Australia Telephone: +61 2 8283 6945; Fax: +61 2 8212 8105
Website: www.chkpowerquality.com.au; Enquiries: [email protected]
Get more from your
Page 15
Figure 9: Voltage Unbalance – graphed over time
-0.5
0
0.5
1
1.5
2
2.5
0 500 1000 1500 2000 2500 3000 3500
Vo
ltag
e U
nb
ala
nce (
%)
Time index
Mains Voltage Unbalance Negative Sequence [10 minute intervals]
VABC-NS-MIN VABC-NS-AVG VABC-NS-MAX

CHK Power Quality Pty Ltd, Power quality report - Manufacturing plant, 24 Oct 2016, rev 1.00
Address: Unit 1, 3 Tollis Place, Seven Hills, NSW 2147, Sydney, Australia Telephone: +61 2 8283 6945; Fax: +61 2 8212 8105
Website: www.chkpowerquality.com.au; Enquiries: [email protected]
Get more from your
Page 16
Figure 10: Voltage Unbalance – graphed over time
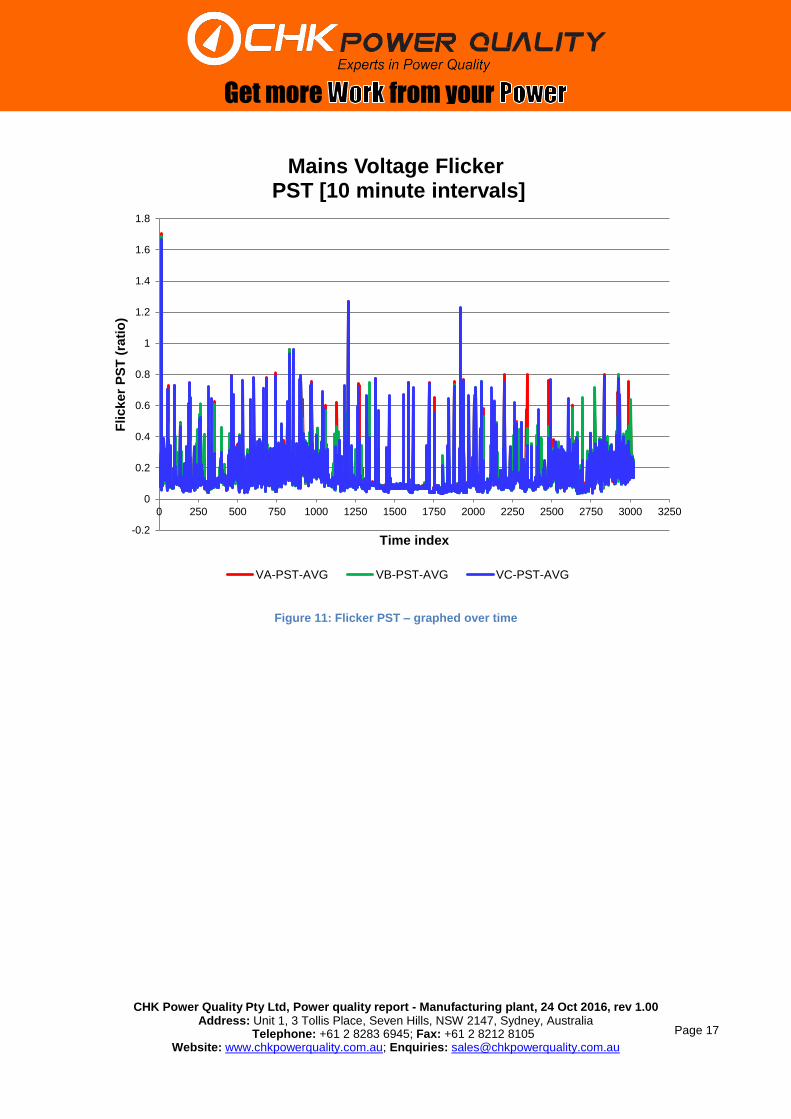
3.5 Flicker Short-term light flicker severity index, PST is based on voltage fluctuations that would annoy 50% of the population. The index is calculated every 10 minutes and normalised to a value of 1.0. During the logging period the PST only exceeded 1.0 on three occasions. Long-term light flicker severity index, PLT is based on the fact that people's tolerance to flicker over longer periods is less than for the short term. For this reason the second index is introduced. It is evaluated over a 2 hour period. It is recommended the value be less than 0.65 [5] or 0.8 [6] in low voltage systems. During the logging period the PLT only exceeded 0.65 once.
0
0.1
0.2
0.3
0.4
0.5
0.6
0.7
0 500 1000 1500 2000 2500 3000 3500
Vo
ltag
e U
nb
ala
nce (
%)
Time index
Mains Voltage Unbalance Zero Sequence [10 minute intervals]
VABC-ZS-MIN VABC-ZS-AVG VABC-ZS-MAX
CHK Power Quality Pty Ltd, Power quality report - Manufacturing plant, 24 Oct 2016, rev 1.00
Address: Unit 1, 3 Tollis Place, Seven Hills, NSW 2147, Sydney, Australia Telephone: +61 2 8283 6945; Fax: +61 2 8212 8105
Website: www.chkpowerquality.com.au; Enquiries: [email protected]
Get more from your
Page 17
Figure 11: Flicker PST – graphed over time
-0.2
0
0.2
0.4
0.6
0.8
1
1.2
1.4
1.6
1.8
0 250 500 750 1000 1250 1500 1750 2000 2250 2500 2750 3000 3250
Flicker
PS
T (
rati
o)
Time index
Mains Voltage Flicker PST [10 minute intervals]
VA-PST-AVG VB-PST-AVG VC-PST-AVG

CHK Power Quality Pty Ltd, Power quality report - Manufacturing plant, 24 Oct 2016, rev 1.00
Address: Unit 1, 3 Tollis Place, Seven Hills, NSW 2147, Sydney, Australia Telephone: +61 2 8283 6945; Fax: +61 2 8212 8105
Website: www.chkpowerquality.com.au; Enquiries: [email protected]
Get more from your
Page 18
Figure 12: Flicker PLT – graphed over time
3.6 Harmonics Voltage harmonics in the system voltage will tend to distort the voltage waveform. Voltage harmonics have been recorded to include harmonic numbers from 1 to 100. Only the significant odd harmonics up to the 49th are presented for analysis. 3.6.1 Total harmonic distortion (THD) The graph in figure 13 displays voltage THD for the logging period. The THD is defined as
1
22
3
2
2 ...
V
VVVV
n
THD
,
where n is the harmonic index or harmonic number. In this work n is equal to 49.
0
0.1
0.2
0.3
0.4
0.5
0.6
0.7
0.8
0 20 40 60 80 100 120 140 160 180 200 220 240 260 280
Flicker
PL
T (
rati
o)
Time index
Mains Voltage Flicker PLT [2 hour intervals]
VA-PLT-AVG VB-PLT-AVG VC-PLT-AVG

CHK Power Quality Pty Ltd, Power quality report - Manufacturing plant, 24 Oct 2016, rev 1.00
Address: Unit 1, 3 Tollis Place, Seven Hills, NSW 2147, Sydney, Australia Telephone: +61 2 8283 6945; Fax: +61 2 8212 8105
Website: www.chkpowerquality.com.au; Enquiries: [email protected]
Get more from your
Page 19
Figure 13: Voltage THD
Measure Max Average
VA-THD-MAX 4.27 1.70
VB-THD-MAX 4.00 1.66
VC-THD-MAX 4.32 1.68
Table 8: Steady state voltage metrics
The maximum measured THD is 4.27% which is well below the compatibility level of 8% as provided in Australian Standard [7]. 3.6.2 Harmonic spectra The total harmonic distortion for the logging period can be decomposed into the constituent harmonics to display the frequency spectra as shown in figure 14. The graph shows the maximum value as a percentage of the fundamental of all the 10 minute logged values.
0
0.5
1
1.5
2
2.5
3
3.5
4
4.5
5
0 500 1000 1500 2000 2500 3000 3500
Maxim
um
Main
s V
olt
ag
e T
HD
(%
)
Time index
Mains Voltage Total Harmonic Distortion
[10 minute intervals]
VA-THD-MAX VB-THD-MAX VC-THD-MAX

CHK Power Quality Pty Ltd, Power quality report - Manufacturing plant, 24 Oct 2016, rev 1.00
Address: Unit 1, 3 Tollis Place, Seven Hills, NSW 2147, Sydney, Australia Telephone: +61 2 8283 6945; Fax: +61 2 8212 8105
Website: www.chkpowerquality.com.au; Enquiries: [email protected]
Get more from your
Page 20
Again, the percentages fall within the compatibility levels as provided in Australian Standard [7]. It is noteworthy that:
(a) the 5th and 7th harmonics dominate the spectra, followed by the 3rd, 11th, and 9th harmonics; and that
(b) the site contains a mix of single and three phase loads including motors. Most lighting consists of fluorescent lamps.
Odd harmonics are characteristic of a single phase full bridge rectifier with a shunt capacitor filter which is readily found in all modern electronic office equipment. In this case the dominate harmonic includes the 3rd, followed by the 5th, 7th etc. Fluorescent lighting and three phase induction motors are also sources of odd harmonics containing significant harmonics at the 3rd, 5th, 7th, 9th and 11th and can explain the overall dominance by the 5th and 7th harmonics.
Figure 14: Mains voltage – frequency spectra
The local electricity distributor also superimpose signals on the 50Hz mains to automatically control/switch street lights, hot water heaters and underfloor heaters, on and off at different
0.0
0.3
0.5
0.8
1.0
1.3
1.5
1.8
2.0
2.3
1 3 5 7 9 11 13 15 17 19 21 23 25 27 29 31 33 35 37 39 41 43 45 47 49
Maxim
um
Perc
en
tag
e o
f F
un
dam
en
tal
(%)
Harmonic index
Mains Voltage (odd harmonics only) Frequency Spectra [10 minute intervals]
VA VB VC

CHK Power Quality Pty Ltd, Power quality report - Manufacturing plant, 24 Oct 2016, rev 1.00
Address: Unit 1, 3 Tollis Place, Seven Hills, NSW 2147, Sydney, Australia Telephone: +61 2 8283 6945; Fax: +61 2 8212 8105
Website: www.chkpowerquality.com.au; Enquiries: [email protected]
Get more from your
Page 21
times during the day. The signalling frequency used is in the vicinity of 750Hz which lines up with the 15th harmonic. In summary, the measured harmonics and THD are within expectation and should not significantly impact the normal operation of the Test Instrument. 3.7 Voltage disturbances and events 3.7.1 Mains signalling A typical capture of the Mains Signalling is shown in figure 15. The voltage is approximately 6Vpk and within expected values.
Figure 15: Mains voltage transient
3.7.2 Transients The analyser incorporates an anti-aliasing filter at the front end to band limit signals. This together with the sampling rate set to approximately 52µs limits the capture of fast transients. A number of transients exceeding 500Vpk were observed on all three phases and the highest are shown in figures 16 to 19. The rise and fall of each transient is contained within a 104µs timeslot, suggesting that the transients are faster than 52µs. The highest captured transient measured 1024.3Vpk and whose actual magnitude is likely to be higher for the reasons given in the paragraph above. The short duration of the transients is unlikely to significantly raise the RMS voltage.
Mains Signalling capture at 2016-03-17 23:04:37

CHK Power Quality Pty Ltd, Power quality report - Manufacturing plant, 24 Oct 2016, rev 1.00
Address: Unit 1, 3 Tollis Place, Seven Hills, NSW 2147, Sydney, Australia Telephone: +61 2 8283 6945; Fax: +61 2 8212 8105
Website: www.chkpowerquality.com.au; Enquiries: [email protected]
Get more from your
Page 22
Figure 16: Mains voltage transient
Figure 17: Mains voltage transient
Waveform capture at 2016-03-30 10:15:44 Source: Transient; Channel: VB
Waveform capture at 2016-03-31 11:25:07 Source: Transient; Channel: VB

CHK Power Quality Pty Ltd, Power quality report - Manufacturing plant, 24 Oct 2016, rev 1.00
Address: Unit 1, 3 Tollis Place, Seven Hills, NSW 2147, Sydney, Australia Telephone: +61 2 8283 6945; Fax: +61 2 8212 8105
Website: www.chkpowerquality.com.au; Enquiries: [email protected]
Get more from your
Page 23
Figure 18: Mains voltage transient
Figure 19: Mains voltage transient
Waveform capture at 2016-04-04 15:28:48 Source: Transient; Channel: VA
Waveform capture at 2016-04-05 09:49:09 Source: Transient; Channel: VC
CHK Power Quality Pty Ltd, Power quality report - Manufacturing plant, 24 Oct 2016, rev 1.00
Address: Unit 1, 3 Tollis Place, Seven Hills, NSW 2147, Sydney, Australia Telephone: +61 2 8283 6945; Fax: +61 2 8212 8105
Website: www.chkpowerquality.com.au; Enquiries: [email protected]
Get more from your
Page 24
4 References [1] AS 61000.3.100-2011, Electromagnetic compatibility (EMC), Part 3.100: Limits – Steady state voltage limits in public electricity systems. [2] IEC 61000-4-30; AS/NZ 61000.4.30:2012, Electromagnetic compatibility (EMC), Part 4.30: Test and measurement techniques - Power quality measurement methods. [3] “Test Instrument operating & maintenance manual, December 12, 2011. [4] “Application of Frequency Operating Standards During Periods of Supply Scarcity”, Part C application of rules terms; Reliability panel AEMC (Australian Energy Market commission); (15 April 2009). [5] IEC 61000-3-3:1995, Electromagnetic compatibility (EMC) – Part 3: Limits – Section 3: Limitation of Voltage Fluctuations and Flicker in Low-voltage Supply Systems for Equipment with Rated Current ≤16A. [6] AS/NZS 61000.3.7:2001, “Electromagnetic compatibility (EMC) Part 3.7: Limits – Assessment of emission limits for fluctuating loads in MV and HV power systems”, Australian Standards, 2001. [7] ”Electromagnetic compatibility (EMC) - Limits - Assessment of emission limits for the connection of distorting installations to MV, HV and EHV power systems”, TR IEC 61000.3.6:2012, section 4.1; (24 April 2012).