power - ibef · ... please visit july 2017 power . ... route in the power segment and renewable...
TRANSCRIPT
For updated information, please visit www.ibef.org July 2017
POWER

Table of Content
Executive Summary……………….….…….3
Advantage India…………………..….……..4
Market Overview …………………….……..6
Strategies Adopted………….….…..……..17
Growth Drivers…………………….............19
Opportunities…….……….......……………29
Industry Associations………..…………...40
Success Stories……………....………..…35
Useful Information………..........………….42

For updated information, please visit www.ibef.org Power 3
EXECUTIVE SUMMARY
India is the third largest producer and fourth largest consumer of electricity in the world, with the installed
power capacity reaching 330.3 GW by June 2017. The country also has the fifth largest installed capacity in
the world.
Third largest producer
and fourth largest
consumer globally
Source: Make in India website, Ministry of New and Renewable Energy, IEA, CEA (Central Electricity Authority), Aranca Research, Assorted articles
Notes: TWh - Terawatt Hours, GW – Gigawatt,
The government targets capacity addition of 88.5 GW under the 12th Five-Year Plan (2012–17) and around
100 GW under the 13th Five-Year Plan (2017–22)
Investments of around US$ 250 billion are planned for the power sector during the 12th Plan Five-Year Plan.
In June 2017, the government announced intentions to set up an asset reconstruction company for handling
the stressed assets in power sector. This would also help in the transfer of stressed power generation assets
of stalled power projects, which would then be auctioned.
Large-scale government
initiated expansion
plans
Wind energy is estimated to contribute 60 GW, followed by solar power at 100 GW by 2022.
The target for renewable energy has been increased to 175 GW by 2022.
Robust growth in
renewables
100 per cent FDI is allowed under the automatic route in the power segment and renewable energy. Favourable policy
environment

Power
ADVANTAGE INDIA
For updated information, please visit www.ibef.org Power 5
ADVANTAGE INDIA
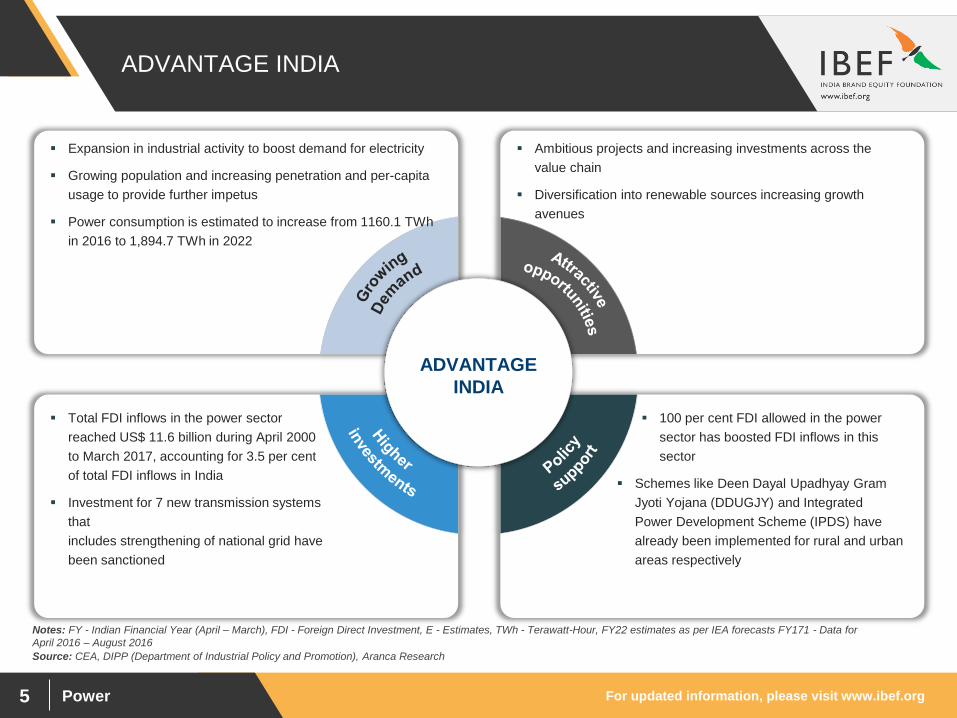
Expansion in industrial activity to boost demand for electricity
Growing population and increasing penetration and per-capita
usage to provide further impetus
Power consumption is estimated to increase from 1160.1 TWh
in 2016 to 1,894.7 TWh in 2022
Ambitious projects and increasing investments across the
value chain
Diversification into renewable sources increasing growth
avenues
Total FDI inflows in the power sector
reached US$ 11.6 billion during April 2000
to March 2017, accounting for 3.5 per cent
of total FDI inflows in India
Investment for 7 new transmission systems
that
includes strengthening of national grid have
been sanctioned
100 per cent FDI allowed in the power
sector has boosted FDI inflows in this
sector
Schemes like Deen Dayal Upadhyay Gram
Jyoti Yojana (DDUGJY) and Integrated
Power Development Scheme (IPDS) have
already been implemented for rural and urban
areas respectively
ADVANTAGE
INDIA
Source: CEA, DIPP (Department of Industrial Policy and Promotion), Aranca Research
Notes: FY - Indian Financial Year (April – March), FDI - Foreign Direct Investment, E - Estimates, TWh - Terawatt-Hour, FY22 estimates as per IEA forecasts FY171 - Data for
April 2016 – August 2016

Power
MARKET OVERVIEW

For updated information, please visit www.ibef.org Power 7
EVOLUTION OF THE INDIAN POWER SECTOR
Source: MNRE, Corporate Catalyst India, IFLR, Aranca Research
Electricity (Supply) Act 1948
Establishment of semi-
autonomous State Electricity
Boards (SEBs)
Legislative and policy initiatives (1991)
Private sector participation in generation
Fast-track clearing mechanism of private investment proposals
Electricity Regulatory Commissions Act (1998) for establishing Central
and State Electricity Regulatory Commissions and rationalisation of
tariffs
Industrial Policy Resolution (1956)
Generation and distribution of power
under state ownership
Power losses, subsidies,
infrastructure bottlenecks and
resource constraints
Electricity Act (2003)
National Tariff Policy (2006)
New renewable energy policy have been announced
Amendments made in Electricity Act so as to create competition
Implementation of Deen Dayal Upadhyay Gram Jyoti Yojana (DDUGJY) and
Integrated Power Development Scheme for rural and urban areas respectively
Implementation of Ujwal DISCOM Assurance Yojana (UDAY) which would enable
electrification to all villages and tracking it using the Grameen Vidyutikaran App
Amendment in National Tariff Policy (2016) has been made, wherein government
is focusing more on sustainable utilisation of renewable energy resources
Before 1956
Introductory
Stage
1956–1991
Nationalisation
Stage
1991–2003
Liberalisation
Era
2003 onwards
Growth
Era

For updated information, please visit www.ibef.org Power 8
INDIA AMONG TOP FOUR POWER PRODUCERS AND
CONSUMERS
6015
4327
1423
1088 1013
653 643
0
1,000
2,000
3,000
4,000
5,000
6,000
7,000
China US India Russia Japan Germany Canada
Note: TWh - Terawatt Hours Figures mentioned in the graph is as per latest data available
With a production of 1,423 TWh, India is the third largest producer
and the third largest consumer of electricity in the world.
Although power generation has grown more than 100-fold since
independence, growth in demand has been even higher due to
accelerating economic activity.
Visakhapatnam port traffic (million tonnes) World’s leading electricity producers in 2016 (TWh)
Source: Enerdata, Aranca Research,

For updated information, please visit www.ibef.org Power 9
POWER GENERATION HAS GROWN RAPIDLY OVER
THE YEARS
77
1.6
81
1.1
87
6.9
91
2.1
96
7.2
10
48
.7
11
07
.8
11
60
.1
30
7.7
0
0
200
400
600
800
1,000
1,200
1,400
FY10 FY11 FY12 FY13 FY14 FY15 FY16 FY17 FY18
Source: BP Statistical Review, Ministry of Power, Aranca Research;
With electricity production of 1,160.1 BU in India in FY17, the country
witnessed growth of around 4.72 per cent over the previous fiscal
year.
Over FY10–FY17, electricity production in India grew at a CAGR of
7.03 per cent.
The 12th Five Year Plan projects that, total domestic energy
production would reach 844 million tonnes of oil equivalent (MTOE)
by 2021–22.
Visakhapatnam port traffic (million tonnes) Electricity production in India (BU)
CAGR 7.03%
Notes: FY - Indian Financial Year (April-March), BU – Billion Unit, 1 - Data up to June 2017
1

For updated information, please visit www.ibef.org Power 10
SOURCES OF POWER WITH SHARES IN TOTAL
INSTALLED CAPACITY … (1/2)
Thermal
India has large reserves of coal. By the end of June 2017, total installed coal capacity
in India stood at 194,552.9 MW.
With a large swathe of rivers and water bodies, India has enormous potential for hydropower; the 12th Five-
Year Plan (2012–17) includes additional 30GW of hydroelectric power generation. In FY17 (till March 2017),
India has 44.4 GW of hydro power generating capacity
Hydro
Wind energy is the largest renewable energy source in India; projects like the Jawaharlal Nehru National Solar
Mission (aims to generate 20,000 MW of solar power by 2022) are creating a positive environment among
investors keen to exploit India’s potential. There are plans to set up four solar power plants of 1GW each
Renewable
As of March 2017, India has 5.72 GW of net electricity generation capacity using nuclear fuels (across 20
reactors) and aims to increase it to 45 GW by 2020; with one of the world’s largest reserves of thorium, India
has a huge potential in nuclear energy
Nuclear
India’s proven natural gas capacity measure about 25,185.4 as on 30th June 2017
13.5%
17.7%
2.1%
Coal
Gas
69.2%
Source: Ministry of Coal, NHPC, CEA, BP Statistical Review 2015, Corporate Catalyst India, Indian Power Sector, Ministry of Power, Aranca Research
Notes: MW - Megawatt, GW - Gigawatt
For updated information, please visit www.ibef.org Power 11
SOURCES OF POWER WITH SHARES IN TOTAL
INSTALLED CAPACITY … (2/2)
220.58
44.61
58.30
6.78
0
50
100
150
200
250
Thermal Hydro Renewables Nuclear
Source: Ministry of Coal, NHPC,Central Electricity Authority (CEA), Corporate Catalyst India, Aranca Research
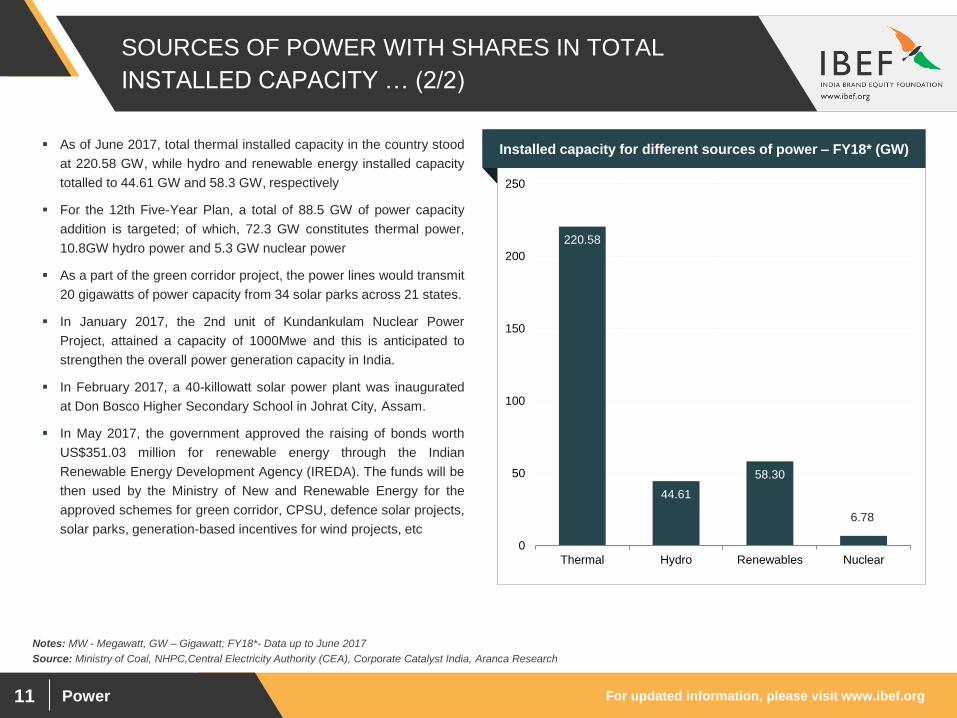
As of June 2017, total thermal installed capacity in the country stood
at 220.58 GW, while hydro and renewable energy installed capacity
totalled to 44.61 GW and 58.3 GW, respectively
For the 12th Five-Year Plan, a total of 88.5 GW of power capacity
addition is targeted; of which, 72.3 GW constitutes thermal power,
10.8GW hydro power and 5.3 GW nuclear power
As a part of the green corridor project, the power lines would transmit
20 gigawatts of power capacity from 34 solar parks across 21 states.
In January 2017, the 2nd unit of Kundankulam Nuclear Power
Project, attained a capacity of 1000Mwe and this is anticipated to
strengthen the overall power generation capacity in India.
In February 2017, a 40-killowatt solar power plant was inaugurated
at Don Bosco Higher Secondary School in Johrat City, Assam.
In May 2017, the government approved the raising of bonds worth
US$351.03 million for renewable energy through the Indian
Renewable Energy Development Agency (IREDA). The funds will be
then used by the Ministry of New and Renewable Energy for the
approved schemes for green corridor, CPSU, defence solar projects,
solar parks, generation-based incentives for wind projects, etc
Visakhapatnam port traffic (million tonnes) Installed capacity for different sources of power – FY18* (GW)
Notes: MW - Megawatt, GW – Gigawatt; FY18*- Data up to June 2017

For updated information, please visit www.ibef.org Power 12
GENERATION CAPACITY HAS INCREASED AT A
HEALTHY PACE … (1/2)
13
2.3
14
3.1
14
8
15
9.4
17
3.6
19
9.9
22
3.3
23
7.7
27
2.5
28
0.3
32
6.8
4
0
50
100
150
200
250
300
350
FY
07
FY
08
FY
09
FY
10
FY
11
FY
12
FY
13
FY
14
FY
15
FY
16
FY
17
Source: CEA (Central Electricity Authority), Aranca Research
Note: GW - Gigawatt, CAGR - Compound Annual Growth Rate; FY18* - data upto June 207
Installed capacity increased steadily over the years, posting a CAGR
of 10.57 per cent in FY09–17
As of June 2017, energy generation from conventional sources stood
at 307.7 billion units (BU).
Visakhapatnam port traffic (million tonnes) Installed electricity generation capacity (GW)
CAGR 10.57%

For updated information, please visit www.ibef.org Power 13
GENERATION CAPACITY HAS INCREASED AT A
HEALTHY PACE … (2/2)
86
34
.7
7.8
3.9
13
1.6
39
24
.5
4.8
21
8.3
2
44
.47
57
.26
6.7
8
0
50
100
150
200
250
Thermal Hydro Renewable Nuclear
End of 10th Year Plan End of 11th Year Plan
End of 12th Year Plan
Source: :CEA, Aranca Research, India Solar Handbook 2017
Note: CAGR - Compound Annual Growth Rate; * - According to the India Solar Handbook 2017 released by Bridge to India (BTI),
Among the different sources of power in India, the CAGR in installed
capacity over FY07–FY17 was
• 10.57 per cent for thermal power
• 22.06 per cent for renewable energy, the fastest among all
sources of power
• 2.51 per cent for hydro power
• 5.68 per cent for nuclear power
India is expected to become the third biggest solar market across the
globe in 2017, with 8.8 gigawatt (GW) of capacity addition projected
for the year ahead.* Moreover, the country’s solar capacity is
expected to reach 18.7GW by 2017, which is about 5 per cent of
global solar capacity.
Visakhapatnam port traffic (million tonnes) Comparison of installed capacity (GW)

For updated information, please visit www.ibef.org Power 14
MAJOR PLAYERS IN THE POWER SECTOR
Source: Company websites, News articles, Industry sources, Aranca Research
Company Indian company
NTPC is the largest power producer in India and is also the sixth largest thermal power producer in the world, with
installed capacity of 47.17 GW (including JVs). By 2032, NTPC plans to reach 128,000 MW of power capacity.
Coal-based power accounts for more than 84.7 per cent of the total capacity
It has also diversified into hydro power, coal mining, power equipment manufacturing, oil and gas exploration,
power trading and distribution
Tata Power is India’s largest integrated power company, with significant presence in solar, hydro, wind and
geothermal energy space. The company accounts for 52 per cent of total generation capacity in the private sector.
The company has an installed capacity of 10,463 MW in FY17. By 2022, the company plans to increase the
generating capacity to 18 GW, distribution networks by 4 GW and energy resources by 25 million tonnes per
annum.
The company has more than 35,000 MW of power generation capacity, both operational and under development.
Reliance Power has an operational power generation capacity of 6 GW. As of FY17, Reliance Power will double
the capacity of its Rosa power plant in Uttar Pradesh to 2,400 MW and Butibori power plant in Maharashtra to
1,200 MW
In FY15, the company accounted for a generation performance of 1048 billion units.
CESC Limited is a vertically integrated player engaged in coal mining and generation and distribution of power. It
owns and operates 3 thermal power plants generating 1225 MW of power. These are Budge Budge Generating
Station (750 MW), Southern Generating Station (135 MW) and Titagarh Generating Station (240 MW)
NHPC is the largest hydro power utility in India, with an installed capacity of 6.5 GW; it has drawn up a massive
capacity expansion plan of adding 6.7 GW by 2017
NHPC is constructing 9 projects, aggregating an installed capacity of 4.2 GW. NHPC added 1.9 GW and 1.1 GW
during the 10th and 11th Plan periods, respectively
For updated information, please visit www.ibef.org Power 15
MAJOR PLAYERS IN THE POWER SECTOR … (2/2)
Source: Company websites, News articles, Aranca Research
Company Indian company
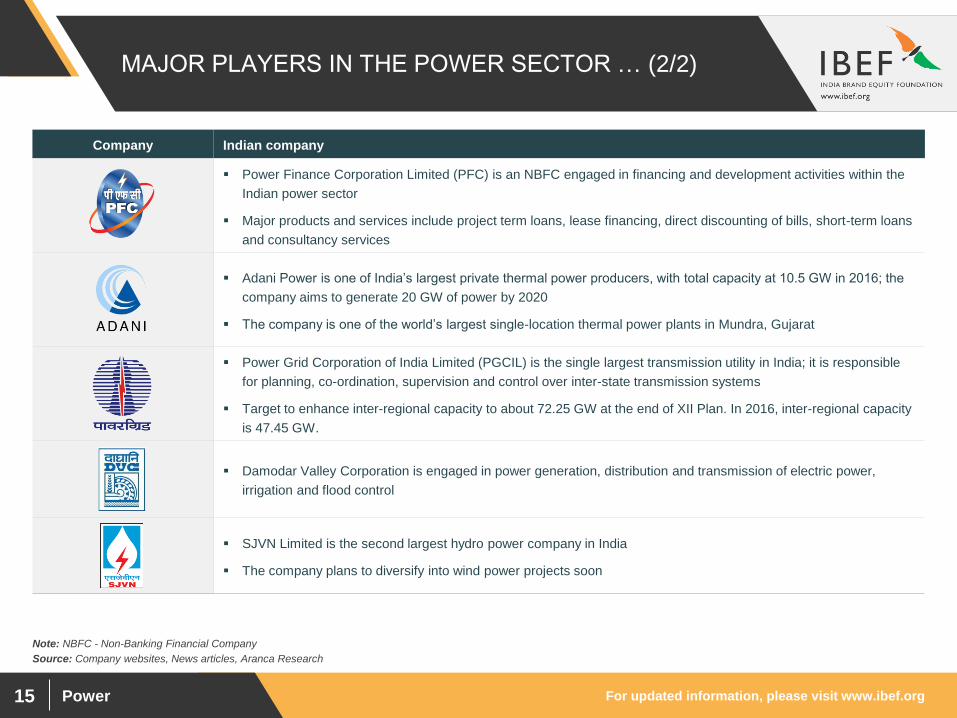
Power Finance Corporation Limited (PFC) is an NBFC engaged in financing and development activities within the
Indian power sector
Major products and services include project term loans, lease financing, direct discounting of bills, short-term loans
and consultancy services
Adani Power is one of India’s largest private thermal power producers, with total capacity at 10.5 GW in 2016; the
company aims to generate 20 GW of power by 2020
The company is one of the world’s largest single-location thermal power plants in Mundra, Gujarat
Power Grid Corporation of India Limited (PGCIL) is the single largest transmission utility in India; it is responsible
for planning, co-ordination, supervision and control over inter-state transmission systems
Target to enhance inter-regional capacity to about 72.25 GW at the end of XII Plan. In 2016, inter-regional capacity
is 47.45 GW.
Damodar Valley Corporation is engaged in power generation, distribution and transmission of electric power,
irrigation and flood control
SJVN Limited is the second largest hydro power company in India
The company plans to diversify into wind power projects soon
Note: NBFC - Non-Banking Financial Company

For updated information, please visit www.ibef.org Power 16
Porter’s Five Forces Framework Analysis
Bargaining power of suppliers is high
as presence of bigger players block
the new entrants
Bargaining Power of Suppliers
Does not have any substitutes
Threat of Substitutes
Rivalry is not intense due to oligopoly
structure
In India, the projected demand is
already above the supply levels
Competitive rivalry is expected to
increase due to government
encouraging private players to enter
the sector
Competitive Rivalry
Capital intensive nature of the
industry makes it difficult for new
entrants
Regulatory approvals, land remain a
major problem
Threat of New Entrants
Medium, as for retail consumers,
government sometimes interferes to
regulate prices. However, prices are
not regulated for industrial customers
Bargaining Power of Buyers
Positive Impact
Neutral Impact
Negative Impact
Source: Aranca Research
Power
STRATEGIES
ADOPTED

For updated information, please visit www.ibef.org Power 18
STRATEGIES ADOPTED
Source: Aranca Research
Power companies are now looking at securing adequate supplies of fuel by targeting not only domestic but
also overseas resources
Reliance Power already has coal reserves in Indonesia
Essar Power have captive coal mines in Indonesia from which it extracts coal for power plants in India
Government has enabled the power utilities for swapping their coal supplies with the nearest sources so as to
save miscellaneous costs and decongest the rail network
Acquiring sources of
fuel supply
Companies are using multiple-generation technologies based on a project’s requirement
Companies such as NTPC and Reliance Power already have coal-fired, gas-fired and hydroelectric capacity
This helps them diversify, reduces dependence on a single source
Diversifying generation
technologies
Most of the companies are now looking to sell their carbon credits to generate additional revenue by
employing supercritical technology
Additional revenue
streams
Launch of smart grid mission with 14 DISCOMS as a pilot
Smart metering for high – end users of electricity
Under Union Budget 2017, government approved the 'Pradhan Mantri Gramin Digital Saksharta Abhiyan'
(PMGDISHA) for 6 crore rural households
Digital India
Companies are developing captive coal fields to reduce price volatility and ensure uninterrupted supply of fuel
to control generation cost
Most of the power companies are now located near energy source. This helps minimise costs of fuel transport
Control generation costs

Power
GROWTH DRIVERS

For updated information, please visit www.ibef.org Power 20
INDUSTRIAL EXPANSION AND STRONG GDP
GROWTH DRIVING POWER DEMAND … (1/2)
38% 38% 38% 39% 39%
45% 44% 44%
58%
44%
0%
10%
20%
30%
40%
50%
60%
70%
2007 2008 2009 2010 2011 2012 2013 2014 2015 2016
Source: Aranca Research,Ministry of Statistics and Program Implementation
Note: TWh - Terawatt Hours, RGGVY - Rajiv Gandhi Grameen Vidyutikaran Yojana, CEA
Multiple drivers (industrial expansion, growing per-capita incomes)
are leading to growth in power demand; this is set to continue in the
coming years
• During FY16-17, GDP growth is likely to average 7.1 per cent
• India is set to become a global manufacturing hub with
investments across the value chain
India’s power demand is expected to rise up to 1,905 TWh by FY22
Visakhapatnam port traffic (million tonnes) Share of electricity consumption in industrial sector

For updated information, please visit www.ibef.org Power 21
INDUSTRIAL EXPANSION AND STRONG GDP
GROWTH DRIVING POWER DEMAND … (2/2)
42
8.6
0
67
1.9
0
71
7.0
0
73
3.5
0
77
8.6
0
81
8.7
0
88
3.6
0
91
4.4
1
95
7.0
0
1,0
10
.00
1,0
75
.00
0
200
400
600
800
1,000
1,200
2006 2007 2008 2009 2010 2011 2012 2013 2014 2015 2016
Source: CEA, Aranca Research
Note: RGGVY - Rajiv Gandhi Grameen Vidyutikaran Yojana P : Provisional
98 GW of generation capacity was added during FY11-16; future
investments will benefit from strong demand fundamentals, policy
support and increasing government focus on infrastructure
During the 12th Plan, Government of India planned for capacity
addition of 1,18,537 MW, which includes 88,537 MW through
conventional sources and 30,000 MW through renewable sources,
by 2016-17
Per capita electricity consumption in the country grew at a CAGR of
9.63 per cent, during FY06-FY16, reaching 1075 KWh in FY16
Visakhapatnam port traffic (million tonnes) Per-capita electricity consumption (KWh)
CAGR 9.63%

For updated information, please visit www.ibef.org Power 22
POLICY SUPPORT AIDING GROWTH IN THE SECTOR
Adequate return on investment to companies engaged in power generation, transmission and distribution
Uniform guidelines to SERCs for fixing tariffs
Assured electricity to consumers at reasonable and competitive rates
National Tariff Policy,
2006
Launch of the UMPP scheme through tariff-based competitive bidding
Ease of land possession, provision of fuel, water and necessary clearances for enhancing investor confidence
Ultra Mega Power
Projects (UMPPs)
R-APDRP was launched by Ministry of Power with the purpose of reducing AT&T losses up to 15 per cent by
upgradation of transmission and distribution network
Linking disbursement of central government funds (to states), with actual reduction in transmission and
distribution losses. Sanctioned projects of more than US$ 5.8 billion
R-APDRP
Fuel supply agreement with Coal India Ltd will ensure the availability of coal for power companies over the
long term Fuel Supply Agreement
Elimination of licensing for electricity generation projects
Increased competition through international competitive bidding
Demarcation of transmission as a separate activity
Electricity Act, 2003
Source: Ministry of Power, Aranca Research
Notes: R-APDRP - Restructured Accelerated Power Development and Reform Programme SERC - State Electricity Regulatory Commission, AT&T - American Telephone and Telegraph
Systems

For updated information, please visit www.ibef.org Power 23
POLICY SUPPORT AIDING GROWTH IN THE SECTOR
This Scheme used for promoting generation of electricity from renewable energy sources
Allows Power Producers to sell renewable energy generated electricity to an off – taker at a pre – determined
tariff for a given period of time
Feed – in Tariff
The National Tariff Policy for Electricity was amended by the Union Government on 20 January, 2016
The policy aims to achieve the objectives of UDAY scheme
Special focus on renewable energy has been laid. In order to promote use of renewable energy, solar
Renewable Purchase Obligation (RPO) is proposed to increase to 8 per cent by 2022
National Tariff Policy
(2016)
In April 2017, the Indian Government approved the proposal of the Ministry of Power for signing of an MoU for
establishment of the BIMSTEC Grid Interconnection. The MoU will be signed at the upcoming 3rd BIMSTEC
Energy Ministers’ Meeting.
The BIMSTEC is an international organisation involving a group of South Asia and South-East Asia countries,
namely, Bangladesh, India, Myanmar, Sri Lanka, Thailand, Bhutan and Nepal.
BIMSTEC Trans-Power
Exchange and
Development Project
Provide electricity to all areas
Prepared in consultation with state governments, CEA, and other stakeholders
Supply of reliable and quality power in an efficient manner and reasonable rates
National Electricity Policy
Source: Ministry of Power, Aranca Research
Notes: R-APDRP - Restructured Accelerated Power Development and Reform Programme SERC - State Electricity Regulatory Commission, AT&T - American Telephone and Telegraph
Systems, UDAY – Ujwal DISCOM Assurance Yojana

For updated information, please visit www.ibef.org Power 24
RECENT POLICIES ADOPTED
Replacing nationwide street lights with LED lights
Plan to save 10 per cent energy that would light up 11 crore lives
Replacing 1 crore bulbs in Delhi within one year
Energy Conservation
Campaign
In August 2014, Government had launched the policy with an investment of US$ 128 million
Funds energy efficient electrical appliances
National Mission on
Enhanced Energy
Efficiency
Implementation of 2 schemes – Deen Dayal Upadhyay Gram Jyoti Yojana (DDUGJY) and Integrated Power
Development Scheme (IPDS) for rural and urban areas
Implementation of a new scheme – Ujwal DISCOM Assurance Yojana (UDAY) which would enable
electrification for all villages by reducing losses through programmes that involve public participation
Power to the people
In February 2017, India Ratings and Research (Ind-Ra) assigned UP Power Corporation (UPPCL)’s proposed
US$ 1.48 billion bond a provisional ‘IND AA(SO)’ rating. This makes it India’s 1st state government revenue-
supported bond
Ujwal Discoms
Assurance Yojana
(UDAY)
In order to meet the peak load shortages and grid stability, spinning reserves have been created Spinning Reserve
Source: Ministry of Power, Various News articles, Aranca Research
The National Tariff Policy for Electricity was amended by the Union Government on 20 January, 2016, and
aims to achieve the objectives of UDAY scheme
Special focus on renewable energy has been laid. In order to promote use of renewable energy, solar
Renewable Purchase Obligation (RPO) is proposed to increase to 8 per cent by 2022
National Tariff Policy
(2016)

For updated information, please visit www.ibef.org Power 25
INCREASING INVESTMENTS: FDI INFLOWS AND KEY
DEALS … (1/3)
46
27
59
00
72
99
78
34
89
00
85
47
10
,47
6.1
5
11
,58
9.1
3
0
2,000
4,000
6,000
8,000
10,000
12,000
14,000
FY10 FY11 FY12 FY13 FY14 FY15 FY16 FY17
Source: DIPP, Aranca Research
Power is one of the key sectors attracting FDI inflows into India
From April 2000 to March 2017, India recorded FDI of US$ 5.18
billion in non-conventional energy sector. New and renewable energy
sector witnessed maximum power generation capacity addition,
since 2000.
Power sector accounted for 3.49 per cent of total inflows till March
2017
Cumulative FDI inflows into the sector in April’00–March’17 were
US$ 11.59 billion
Visakhapatnam port traffic (million tonnes) FDI inflows into the power sector (US$ million)
For updated information, please visit www.ibef.org Power 26
INCREASING INVESTMENTS: FDI INFLOWS AND KEY
DEALS … (2/3)
Source: Thomson One Banker, Industry News, VC Circle, Aranca Research
Note: FDI - Foreign Direct Investment, PE - Private Equity, Thomson One Banker
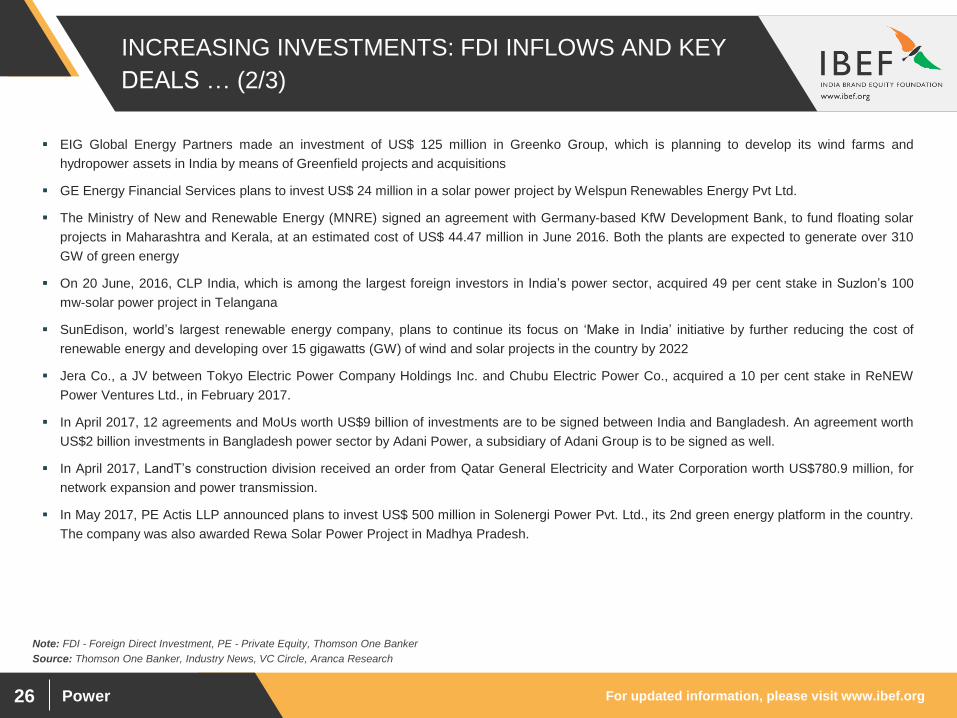
EIG Global Energy Partners made an investment of US$ 125 million in Greenko Group, which is planning to develop its wind farms and
hydropower assets in India by means of Greenfield projects and acquisitions
GE Energy Financial Services plans to invest US$ 24 million in a solar power project by Welspun Renewables Energy Pvt Ltd.
The Ministry of New and Renewable Energy (MNRE) signed an agreement with Germany-based KfW Development Bank, to fund floating solar
projects in Maharashtra and Kerala, at an estimated cost of US$ 44.47 million in June 2016. Both the plants are expected to generate over 310
GW of green energy
On 20 June, 2016, CLP India, which is among the largest foreign investors in India’s power sector, acquired 49 per cent stake in Suzlon’s 100
mw-solar power project in Telangana
SunEdison, world’s largest renewable energy company, plans to continue its focus on ‘Make in India’ initiative by further reducing the cost of
renewable energy and developing over 15 gigawatts (GW) of wind and solar projects in the country by 2022
Jera Co., a JV between Tokyo Electric Power Company Holdings Inc. and Chubu Electric Power Co., acquired a 10 per cent stake in ReNEW
Power Ventures Ltd., in February 2017.
In April 2017, 12 agreements and MoUs worth US$9 billion of investments are to be signed between India and Bangladesh. An agreement worth
US$2 billion investments in Bangladesh power sector by Adani Power, a subsidiary of Adani Group is to be signed as well.
In April 2017, LandT’s construction division received an order from Qatar General Electricity and Water Corporation worth US$780.9 million, for
network expansion and power transmission.
In May 2017, PE Actis LLP announced plans to invest US$ 500 million in Solenergi Power Pvt. Ltd., its 2nd green energy platform in the country.
The company was also awarded Rewa Solar Power Project in Madhya Pradesh.

For updated information, please visit www.ibef.org Power 27
INCREASING INVESTMENTS: FDI INFLOWS AND KEY
DEALS … (3/3)
Private Equity deals
Acquirer Target Deal date Value (US$ mn)
Tata Power Welspun Energy 14 June 2016 1,528
Suzlon Energy
Gale Solarfarms Pvt. Ltd, Tornado
Solarfarms Pvt. Ltd, Abha Solarfarms
Pvt. Ltd, Aalok Solarfarms Pvt. Ltd and
Shreyas Solarfarms Pvt. Ltd.
21 April 2016 -
GIC Greenko Group plc August 2015 255
EIG Global Energy Partners Greenko Group October 2014 125
Standard Chartered Private Equity Ltd Sterlite Power Grid Ventures Ltd 07 July 2014 83.4
ADB, Goldman Sachs, Global Environment Fund ReNew Wind Power Pvt Ltd 03 July 2014 140
ADB, DEG Welspun Renewables June 2014 85
IDFC GMR Energy 24 Feb 2014 -
Consortium led by Deutsche Investitions, FE Clean
Energy Group and IFC NSL Renewable Power Pvt Ltd 29 April 2013 60.0
Ascent Capital Advisors India Pvt Ltd, VenturEast,
Draper Fisher Jurvetson Intl. Bharat Light and Power Pvt Ltd 22 January 2013 18.6
GSPC Distribution Networks Ltd Gujarat Gas Co Ltd 3 October 2012 674.2
Foundation Capital; Helion Venture Partners Azure Power India Pvt Ltd 7 September 2012 8.0
Source: Thomson One Banker, Industry News, VC Circle, Aranca Research
Note: FDI - Foreign Direct Investment, PE - Private Equity, Thomson One Banker

Power
OPPORTUNITIES

For updated information, please visit www.ibef.org Power 29
POWER GENERATION: OVERALL FUNDAMENTALS
WILL REMAIN STRONG … (1/2)
690.59
1,174.07
1,348.40
1,894.70
0
200
400
600
800
1,000
1,200
1,400
1,600
1,800
2,000
2007 2015 2017 2022
Source: International Energy Agency (IEA), CEA, Demand estimates based on IEA forecasts, Aranca Researc
Notes: TWh - Terawatt Hour, CAGR - Compounded Annual Growth Rate E- Estimated
Demand for electricity is expected to increase at a CAGR of 7 per
cent to 1,894.7 TWh over FY07–22
Current production levels are not enough to meet demand; annual
demand outstrips supply by about 7.5 per cent
All India per capita consumption of electricity is expected to reach
1348 TWh by FY17
Various reforms being undertaken by the government are positively
impacting India's power sector. In wake of the surging domestic coal
production, the country’s power sector is becoming increasingly
stable.
Visakhapatnam port traffic (million tonnes) Electricity demand forecast (TWh)
CAGR 7.00%

For updated information, please visit www.ibef.org Power 30
POWER GENERATION: OVERALL FUNDAMENTALS
WILL REMAIN STRONG … (2/2)
16.42 19.01
21.13
54.96
88.54
100
0
20
40
60
80
100
120
8th 9th 10th 11th 12th 13th
Source: Business Standard, Capacity addition estimates by CEA, Aranca Research
Note: TWh - Terawatt-hour
The government is targeting capacity addition of around 88.54 GW
under the 12th (2012–17) and around 100 GW under the 13th
(2017–22) Five-Year Plan
The expected investments in the power sector during the 12th Plan
(2012–17) is US$ 250 billion
There is a tangible shift in policy focus on the sources of power. The
government is keen on promotion of hydro, renewable and gas-
based projects, as well as adoption of clean coal technology
In March 2017, Bhoruka Power Corp. announced its plans to raise
US$ 120 million, to increase their hydro and wind renewable energy
capacity to 1 gigawatt by 2020.
Visakhapatnam port traffic (million tonnes) Addition to generation capacity under
Five-Year Plans (GW)

For updated information, please visit www.ibef.org Power 31
INDIAN POWER SECTOR: MARKET WITH ENORMOUS
GROWTH POTENTIAL
91
97
10
4
11
0
11
6
12
3
13
0 1
41
14
8
15
0
10
9
11
0 11
9
12
2 13
0
13
5
13
6 1
48
15
3
15
9.5
4
11.9
12.7
9.8
10.6
9
4.5 4.7
3.2
1.6
0
2
4
6
8
10
12
14
0
20
40
60
80
100
120
140
160
180
FY08 FY09 FY10 FY11 FY12 FY13 FY14 FY15 FY16 FY17
Source: NTPC presentation, CEA, Aranca Research
Note: KWh – Kilo Watt Hour, GW - Gigawatt Hour,
The per-capita electricity consumption of India stood at 1000 KWh in
FY15, lower than the global average of 2,803 KWh, representing
huge potential for growth
The addition of approximately 106 GW to the existing capacity is
expected to boost GDP growth to 8 per cent by FY17
The peak power requirement by the country in FY17 stood at
159.54GW
To meet the rising electricity demand, the Central Government plans
to expedite market opportunity of US$ 14.94 billion for power
transmission.
Visakhapatnam port traffic (million tonnes) Addition to generation capacity under Five-Year Plans (GW)

For updated information, please visit www.ibef.org Power 32
RENEWABLE ENERGY IS FAST EMERGING AS A
MAJOR SOURCE OF POWER
305
97 80 79
48 47
440
0
50
100
150
200
250
300
350
400
450
500
China Brazil US Canada Russia India Rest ofworld
Source: Renewables 2015 Global Status Report (REN21), Aranca Research, CEA
Notes: TWh - Tera Watt Hour; GW – Gigawatt Figures mentioned in the graph is as per latest data available
Wind energy is the largest source of renewable energy in India; it accounts
for an estimated 64.77 per cent of total installed capacity (24.7 GW). There
are plans to double wind power generation capacity to 20 GW by 2022.
Biomass is the 2nd largest source of renewable energy, accounting for ~12
per cent of total installed capacity in renewable energy. There is a strong
upside potential in biomass in the coming years.
In May 2017, India’s solar power tariffs fell to a new low of US$ 0.038 per
unit during the auction of a 250 megawatt capacity at Bhadla in Rajasthan.
This bid was placed by South Africa’s Phelan Energy Group and Avaada
Power to win contracts to build capacities of 50MW and 100MW,
respectively, at Adani Renewable Energy Park Rajasthan Ltd.
In February 2017, low solar tariffs tendered in India at auction, is expected
to catalyse green investments and help in reducing the dependency on
fossils fuels.
On account of anticipated decline in solar panel prices, due to supply glut in
international market, solar power prices in India are estimated to fall by
2018.
In March 2017, the Power Ministry has launched an application named -
GARV-II, to provide real time data related to rural electrification regarding all
un-electrified villages in India.
Declining solar power prices as compared to thermal power has prompted
the government to switch to the renewable energy resources. Three coal
power projects have been shelved in Odisha, Gujarat and Uttar Pradesh due
to low rate of renewable solar energy at US$0.038 / kWh.
Visakhapatnam port traffic (million tonnes) Hydro power generation capacity at the end of 2016(GW)

For updated information, please visit www.ibef.org Power 33
STRONG UPWARD MOMENTUM IN NUCLEAR ENERGY
LIKELY IN MEDIUM TO LONG TERM
6.78
20
0
5
10
15
20
25
2017 2020E
Source: Ministry of New and Renewable Energy, Business Monitor International, CEA, Aranca Research
Note: GW – Gigawatt, Mwe - Megawatt Electric, PHWR - Pressurised Heavy Water Reactors, BWR - Boling Water Reactors, E – Estimates
Currently, the country has net installed capacity of 5.8 GW, using
nuclear fuels, across 20 reactors. Of the 20 reactors, 18 are
Pressurised Heavy Water Reactors (PHWR) and 2 are Boiling Water
Reactors (BWR)
The government aims to quadruple India’s nuclear power generation
capacity to 20 GW by 2020;
Nuclear Power Corporation of India Limited (NPCIL) plans to
construct 5 nuclear energy parks with a capacity of 10,000 Mwe
The Kudankulam Atomic power project, Tamil Nadu, by NPCIL is
expected to start operating by 2016-17 with an installed capacity of
1000 MW.
Unit II of Kudankulam plant has started functioning in May 2016 with
an installed capacity of 1000 MW. The Kudankulam nuclear power
plant’s 2nd unit attained criticality on 10th July, 2016
As estimated by Nuclear Power Corporation of India, the plant would
start generating 400 MW in 45 days, after attaining criticality.
Visakhapatnam port traffic (million tonnes) Nuclear energy installed capacity in India (GW)
CAGR 36.3%

Power
SUCCESS STORIES

For updated information, please visit www.ibef.org Power 35
TATA POWER: SURGING AHEAD IN THE PRIVATE
SECTOR … (1/2)
3.81 4
4.26
5.55
6.08 5.91
5.50 5.70
4.38
0
1
2
3
4
5
6
7
2009 2010 2011 2012 2013 2014 2015 2016 2017
Source: Company website, Annual Reports, Economic Times, Aranca Research
Note: MW - Megawatt
In FY17 Tata power’s revenue reached US$ 4.38 billion from US$ 3.81
billion in FY09.
In FY16, the company has an installed generation capacity of 10.0GW
in India and is present in all segments of power sector
The thermal power generation capacity stands at 7.6 GW, while clean
energy generation such as hydro, solar and wind stands at 1.2 GW
The company is developing its 1st 4 GW Ultra Mega Power Project at
Mundra (Gujarat) based on supercritical technology
Its international presence includes a 30 per cent stake in coal mines
and a geothermal project in Indonesia and a hydro project in Bhutan in
partnership with The Royal Government of Bhutan
The company is eyeing the clean energy segment; it acquired stakes in
2 Australian companies in the sector in October 2014
Tata Power’s defense engineering unit is planning to invest around
US$ 83.3 million in Vemagal, Kolar district.
Visakhapatnam port traffic (million tonnes) Revenue (US$ billion)

For updated information, please visit www.ibef.org Power 36
TATA POWER: SURGING AHEAD IN THE PRIVATE
SECTOR … (2/2)
2,7
85
2,9
77
3,1
27
5,2
97
8,5
21
8,5
84
8,7
26
9,1
83
10
,46
3
0
2,000
4,000
6,000
8,000
10,000
12,000
2009 2010 2011 2012 2013 2014 2015 2016 2017
The company estimates its installed capacity to expand fivefold in
the next 5 years to 25 GW
Recognising the enormous potential in renewable energy, the
company intends to increase the share of renewable sources to 25
per cent of its total generating capacity in the near future
In the year 2014, the company acquired a 39.2 MW wind farm at
Jamnagar in Gujarat and commissioned a 25-MW solar power
project at Palaswadi in Maharashtra
As of FY17, the company has an installed capacity of 10,463 MW
In comparison to FY16, the company’s generation capacity
increased by 13.94 per cent in FY17
The company being first independent power producer in India has
been awarded with OHSAS 18001:2007 certification for its wind
operations
In March 2017, Tata Power entered into partnership with Nokia, to
modernise electrical grids with advanced communication network.
Tata Power Delhi Distribution Ltd. was allowed access to internet
protocol/multiprotocol label switching network to support
management of electrical grids in Delhi, by Nokia.
Visakhapatnam port traffic (million tonnes) Installed capacity in Mega Watts (MW)
Source: Company website, Company Presentation
Note: MW - Megawatt, CAGR - Compounded Annual Growth Rate
For updated information, please visit www.ibef.org Power 37
RELIANCE POWER: ON A GROWTH TRAJECTORY …
(1/2)
4.3
7
23
1.2
1
43
0.7
2
90
7.1
2
84
8.0
7
1,1
36
.82
1,6
30
.02
1,4
76
.29
14
4.2
2
16
6.6
9
18
4.8
9
18
6.2
4
17
0.3
2
17
0.5
9
20
8.0
6
17
2.2
0
200
400
600
800
1,000
1,200
1,400
1,600
1,800
2010 2011 2012 2013 2014 2015 2016 2017
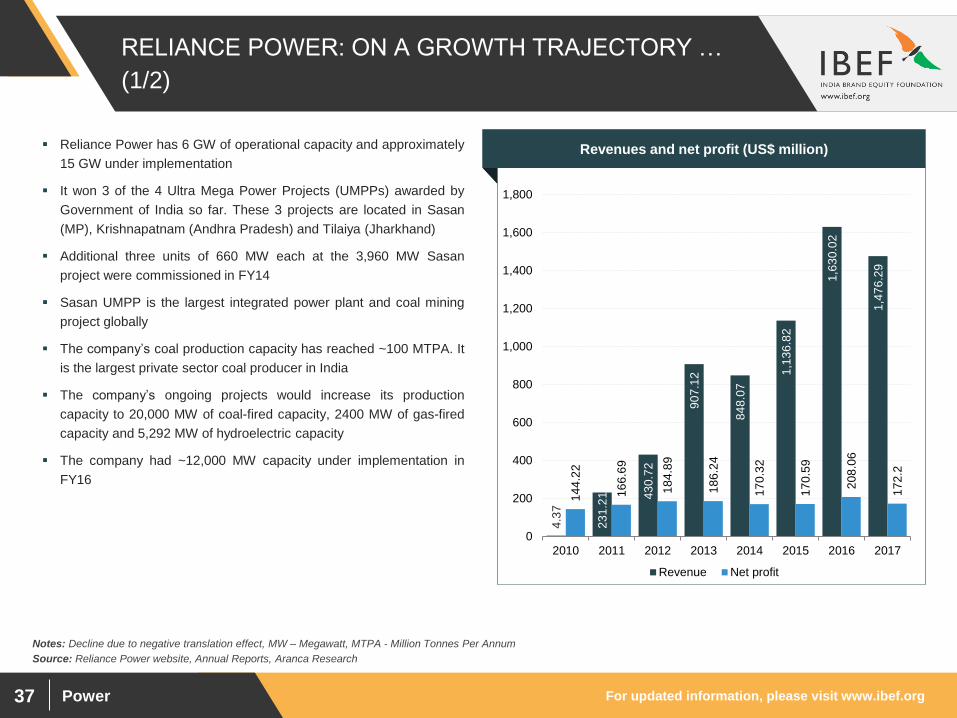
Revenue Net profit
Source: Reliance Power website, Annual Reports, Aranca Research
Notes: Decline due to negative translation effect, MW – Megawatt, MTPA - Million Tonnes Per Annum
Reliance Power has 6 GW of operational capacity and approximately
15 GW under implementation
It won 3 of the 4 Ultra Mega Power Projects (UMPPs) awarded by
Government of India so far. These 3 projects are located in Sasan
(MP), Krishnapatnam (Andhra Pradesh) and Tilaiya (Jharkhand)
Additional three units of 660 MW each at the 3,960 MW Sasan
project were commissioned in FY14
Sasan UMPP is the largest integrated power plant and coal mining
project globally
The company’s coal production capacity has reached ~100 MTPA. It
is the largest private sector coal producer in India
The company’s ongoing projects would increase its production
capacity to 20,000 MW of coal-fired capacity, 2400 MW of gas-fired
capacity and 5,292 MW of hydroelectric capacity
The company had ~12,000 MW capacity under implementation in
FY16
Visakhapatnam port traffic (million tonnes) Revenues and net profit (US$ million)
For updated information, please visit www.ibef.org Power 38
RELIANCE POWER: ON A GROWTH TRAJECTORY …
(2/2)
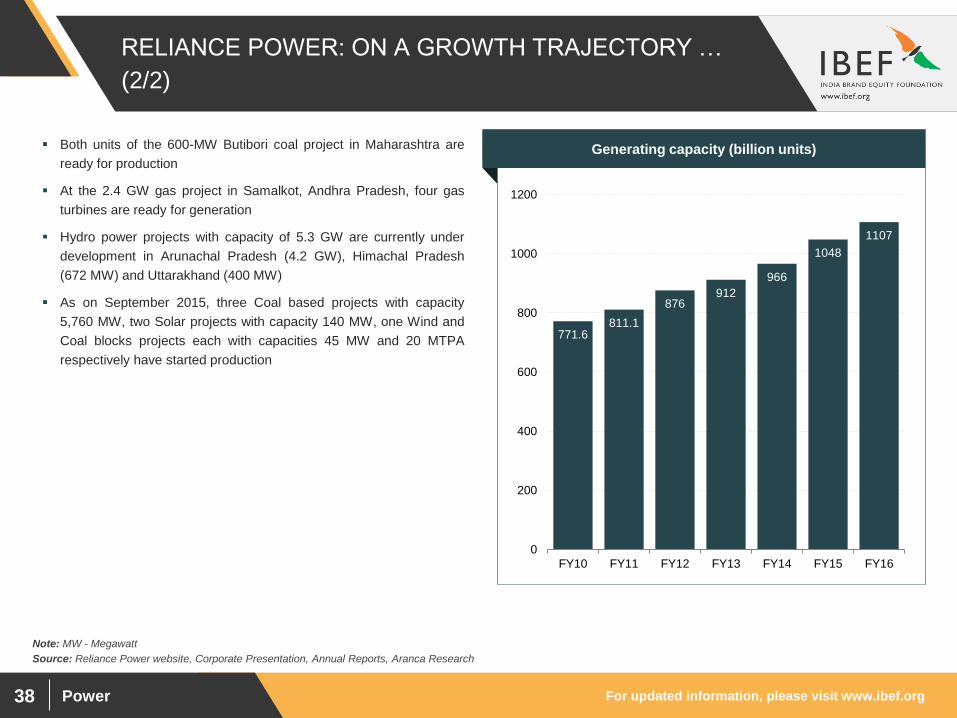
771.6 811.1
876 912
966
1048
1107
0
200
400
600
800
1000
1200
FY10 FY11 FY12 FY13 FY14 FY15 FY16
Source: Reliance Power website, Corporate Presentation, Annual Reports, Aranca Research
Note: MW - Megawatt
Both units of the 600-MW Butibori coal project in Maharashtra are
ready for production
At the 2.4 GW gas project in Samalkot, Andhra Pradesh, four gas
turbines are ready for generation
Hydro power projects with capacity of 5.3 GW are currently under
development in Arunachal Pradesh (4.2 GW), Himachal Pradesh
(672 MW) and Uttarakhand (400 MW)
As on September 2015, three Coal based projects with capacity
5,760 MW, two Solar projects with capacity 140 MW, one Wind and
Coal blocks projects each with capacities 45 MW and 20 MTPA
respectively have started production
Visakhapatnam port traffic (million tonnes) Generating capacity (billion units)

Power
KEY INDUSTRY
ASSOCIATIONS
For updated information, please visit www.ibef.org Power 40
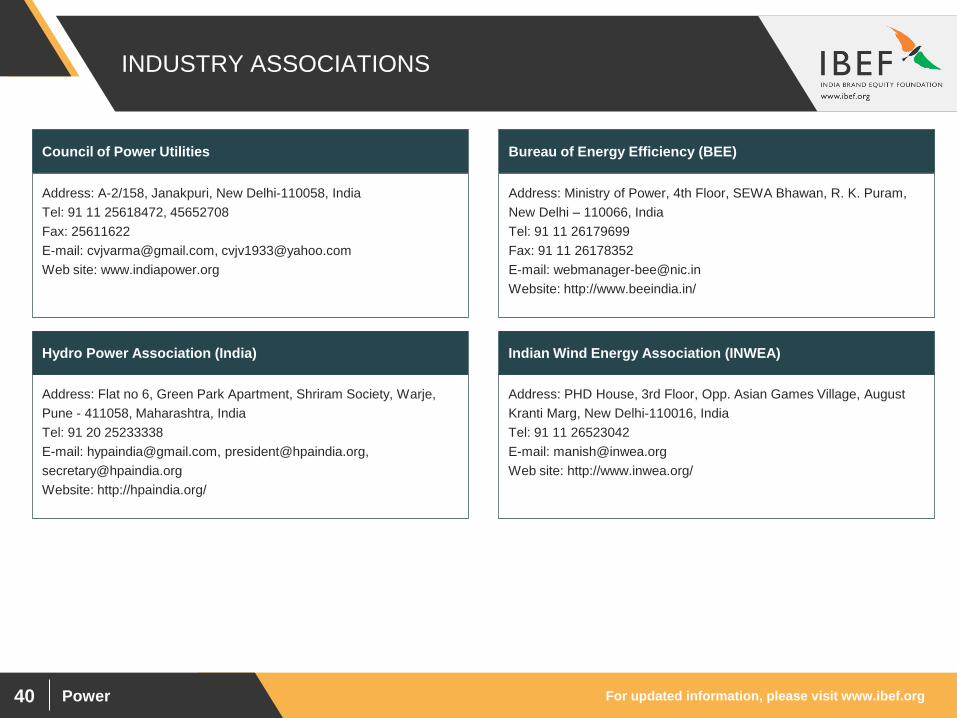
INDUSTRY ASSOCIATIONS
Address: A-2/158, Janakpuri, New Delhi-110058, India
Tel: 91 11 25618472, 45652708
Fax: 25611622
E-mail: [email protected], [email protected]
Web site: www.indiapower.org
Council of Power Utilities
Address: Flat no 6, Green Park Apartment, Shriram Society, Warje,
Pune - 411058, Maharashtra, India
Tel: 91 20 25233338
E-mail: [email protected], [email protected],
Website: http://hpaindia.org/
Hydro Power Association (India)
Address: Ministry of Power, 4th Floor, SEWA Bhawan, R. K. Puram,
New Delhi – 110066, India
Tel: 91 11 26179699
Fax: 91 11 26178352
E-mail: [email protected]
Website: http://www.beeindia.in/
Bureau of Energy Efficiency (BEE)
Address: PHD House, 3rd Floor, Opp. Asian Games Village, August
Kranti Marg, New Delhi-110016, India
Tel: 91 11 26523042
E-mail: [email protected]
Web site: http://www.inwea.org/
Indian Wind Energy Association (INWEA)
Power
USEFUL
INFORMATION

For updated information, please visit www.ibef.org Power 42
GLOSSARY
CAGR: Compound Annual Growth Rate
FDI: Foreign Direct Investment
FY: Indian Financial Year (April to March)
• So FY10 implies April 2009 to March 2010
GW: Gigawatt
MandA: Merger and Acquisition
MW: Megawatt
NBFC: Non-Banking Financial Company
PE: Private Equity
PLF: Plant Load Factor
RandD: Research and Development
R-APDRP: Restructured Accelerated Power Development and Reform Programme
TandD: Transmission and Distribution
TWh: Terawatt-Hour
RGGVY: Rajiv Gandhi Grameen Vidyutikaran Yojana
US$ : US Dollar
Wherever applicable, numbers have been rounded off to the nearest whole number
For updated information, please visit www.ibef.org Power 43
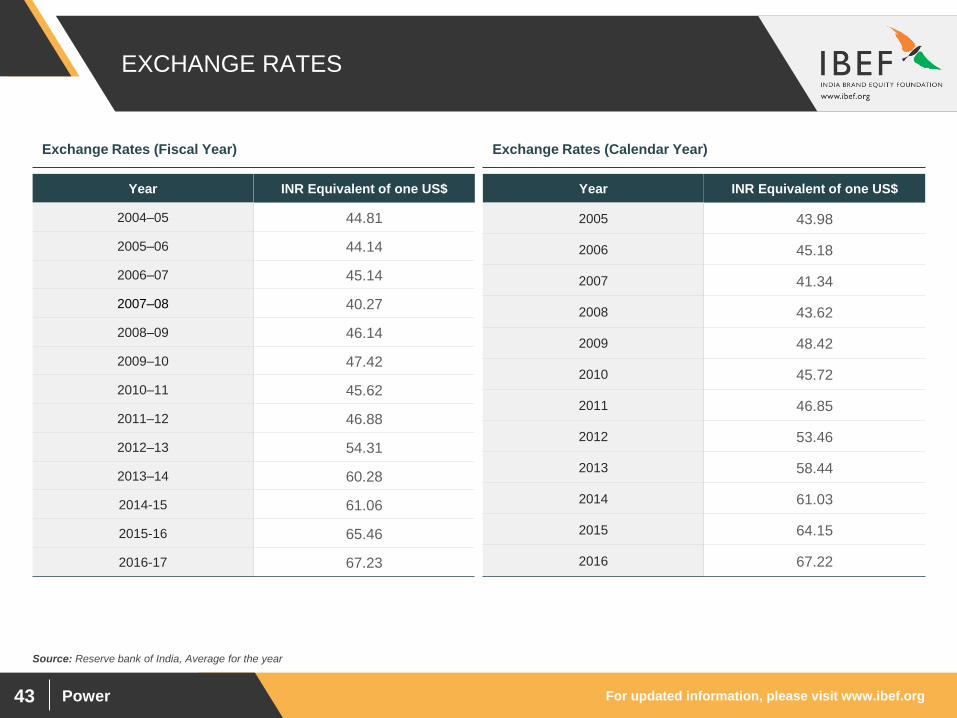
EXCHANGE RATES
Year INR Equivalent of one US$
2004–05 44.81
2005–06 44.14
2006–07 45.14
2007–08 40.27
2008–09 46.14
2009–10 47.42
2010–11 45.62
2011–12 46.88
2012–13 54.31
2013–14 60.28
2014-15 61.06
2015-16 65.46
2016-17 67.23
Year INR Equivalent of one US$
2005 43.98
2006 45.18
2007 41.34
2008 43.62
2009 48.42
2010 45.72
2011 46.85
2012 53.46
2013 58.44
2014 61.03
2015 64.15
2016 67.22
Exchange Rates (Fiscal Year) Exchange Rates (Calendar Year)
Source: Reserve bank of India, Average for the year

For updated information, please visit www.ibef.org Power 44
DISCLAIMER
India Brand Equity Foundation (IBEF) engaged Aranca to prepare this presentation and the same has been prepared by Aranca in consultation
with IBEF.
All rights reserved. All copyright in this presentation and related works is solely and exclusively owned by IBEF. The same may not be reproduced,
wholly or in part in any material form (including photocopying or storing it in any medium by electronic means and whether or not transiently or
incidentally to some other use of this presentation), modified or in any manner communicated to any third party except with the written approval
of IBEF.
This presentation is for information purposes only. While due care has been taken during the compilation of this presentation to ensure that the
information is accurate to the best of Aranca and IBEF’s knowledge and belief, the content is not to be construed in any manner whatsoever as a
substitute for professional advice.
Aranca and IBEF neither recommend nor endorse any specific products or services that may have been mentioned in this presentation and nor do
they assume any liability or responsibility for the outcome of decisions taken as a result of any reliance placed on this presentation.
Neither Aranca nor IBEF shall be liable for any direct or indirect damages that may arise due to any act or omission on the part of the user due to any
reliance placed or guidance taken from any portion of this presentation.