power generation integrated in burners for industrial/commercia l ... · industrial/commercia l...
TRANSCRIPT

E n e r g y R e s e a r c h a n d D e v e l o p m e n t D i v i s i o n F I N A L P R O J E C T R E P O R T
POWER GENERATION INTEGRATED IN BURNERS FOR INDUSTRIAL/COMMERCIAL PACKAGED BOILERS Appendix
DECE MBER 2008 CE C-500-2013-133-AP
Prepared for: California Energy Commission Prepared by: CMC Engineering
PREPARED BY: Primary Author(s): Carlo Castaldini CMC Engineering Santa Clara, CA Contract Number: 500-10-009 Prepared for: California Energy Commission Avtar Bining Contract Manager Fernando Pina Office Manager Energy Systems Research Office Laurie ten Hope Deputy Director ENERGY RESEARCH AND DEVELOPMENT DIVISION Robert P. Oglesby Executive Director
DISCLAIMER This report was prepared as the result of work sponsored by the California Energy Commission. It does not necessarily represent the views of the Energy Commission, its employees or the State of California. The Energy Commission, the State of California, its employees, contractors and subcontractors make no warranty, express or implied, and assume no legal liability for the information in this report; nor does any party represent that the uses of this information will not infringe upon privately owned rights. This report has not been approved or disapproved by the California Energy Commission nor has the California Energy Commission passed upon the accuracy or adequacy of the information in this report.
ACKNOWLEDGEMENTS
The authors are grateful to the California Energy Commission for their support of this project and to the Calnetix Power Solutions (CPS), Incorporated located in Stuart, Florida (formerly Elliott Microturbines), a wholly owned company of Calnetix in Cerrito, California for their support in the development of a low nitrogen oxide (NOx) silo combustor in cooperation with this project and with the Lawrence Berkeley National Laboratory (LBNL). We also wish to acknowledge Coen Company in Woodland, California, a wholly owned company of John Zink in Tulsa, Oklahoma, for their participation as the key hardware developer and system integrator of the combined heat and power (CHP) burner assembly, and Hitachi Global Storage Technologies (HGST), Incorporated in San Jose, California for agreeing to host the field test demonstration of this new integrated CHP technology. The following individuals were key contributors to the project and are gratefully acknowledged:
• Mr. Carlo Castaldini, President (CMCE, Inc., d.b.a. CMC-Engineering)
• Dr. David Littlejohn. Staff Scientist (LBNL)
• Dr. Robert Cheng, Staff Scientist (LBNL)
• Mr. Steve Londerville, Senior Project Manager (Coen Company, J. Zink)
• Mr. Vladimir Lifshits, Senior Staff Engineer (Coen Company, J. Zink)
• Mr. David Dewis,, (Calnetix)
• Mr. Tony Hartzheim, V.P Engineering (Calnetix Power Solutions (CPS))
• Mr. Gordon Watson, (Engineer – Site Mechanical Systems, Hitachi GST)
i

PREFACE
The California Energy Commission Energy Research and Development Division supports public interest energy research and development that will help improve the quality of life in California by bringing environmentally safe, affordable, and reliable energy services and products to the marketplace.
The Energy Research and Development Division conducts public interest research, development, and demonstration (RD&D) projects to benefit California.
The Energy Research and Development Division strives to conduct the most promising public interest energy research by partnering with RD&D entities, including individuals, businesses, utilities, and public or private research institutions.
Energy Research and Development Division funding efforts are focused on the following RD&D program areas:
• Buildings End-Use Energy Efficiency
• Energy Innovations Small Grants
• Energy-Related Environmental Research
• Energy Systems Integration
• Environmentally Preferred Advanced Generation
• Industrial/Agricultural/Water End-Use Energy Efficiency
• Renewable Energy Technologies
• Transportation
Power Generation Integrated in Burners for Packaged Industrial/Commercial Boilers is the final report for the Power Generation Integrated in Burners for Packaged Industrial / Commercial Boilers project (contract number 500-03-037) conducted by CMC-Engineering. The information from this project contributes to Energy Research and Development Environmentally Preferred Advanced Generation Program.
For more information about the Energy Research and Development Division, please visit the Energy Commission’s website at www.energy.ca.gov/research/ or contact the Energy Commission at 916-327-1551.
ii

ABSTRACT
Conventional microturbine-based combined heat and power systems consist principally of a recuperated microturbine coupled with a hot water heat exchanger. Their applications are mostly limited to commercial sites where hot water can be utilized. Overall combined heat and power efficiency is about 70 percent. A simple-cycle microturbine integrated with an industrial packaged boiler where the high quality steam production is the primary method for microturbine waste heat recovery has the potential for over 80 percent combined heat and power efficiency while providing added economic and operational benefits to industrial boiler owners. But they must comply with the California Air Resources Board 2007 distributed generation emission requirements as well as meet local air permit levels.
The purpose of this project was to develop and demonstrate a novel combined heat and power package that integrated a simple-cycle 80 kilowatt electrical microturbine with a gas-fired ultra-low nitrogen oxide burner boiler. The package was designed to: (1) achieve maximum overall electrical and thermal efficiency; (2) meet California Air Resources Board 2007 distributed generation emission requirements; (3) meet local air permit limits for industrial boilers; (4) reduce the carbon footprint; and (5) minimize the cost of small-scale combined heat and power systems to promote the adoption of microturbine-based combined heat and power in industrial and commercial plants.
The combined heat and power technology achieved all its technical objectives and was successfully demonstrated for the first time on an industrial boiler. The microturbine achieved nitrogen oxides significantly below the California Air Resource Board 2007 distributed generation emission limits with about 82.7 percent combined heat and power efficiency. Overall nitrogen oxide emissions from the boiler were reduced by more than 50 percent. Carbon dioxide reduction was 0.17 to 0.27 tons per megawatt hour relative to central power stations, helping to mitigate global climate change impacts.
Keywords: Industrial boilers, commercial boilers, low-NOx industrial burners, microturbine generators (MTG), combined heat and power (CHP), distributed generation (DG), distributed energy resources (DER)
Please use the following citation for this report:
Castaldini, Carlo. (CMC Engineering). 2008. Power Generation Integrated in Burners for Packaged Industrial/Commercial Boilers. California Energy Commission. Publication Number: CEC-500-2013-133-AP.
iii

TABLE OF CONTENTS
Acknowledgements ................................................................................................................................... i
PREFACE ................................................................................................................................................... ii
ABSTRACT .............................................................................................................................................. iii
TABLE OF CONTENTS ......................................................................................................................... iv
APPENDIX A: Power Generation Integrated In Burners For Industrial/Commercial Packaged Boilers ...................................................................................................................................................... A-1
iv

APPENDIX A: Power Generation Integrated In Burners For Industrial/Commercial Packaged Boilers
A-1

Arnold Schwarzenegger
Governor
POWER GENERATION INTEGRATED IN BURNERS FOR
INDUSTRIAL/COMMERCIAL PACKAGED BOILERS
APPENDIX A
PIER
FINA
L PRO
JECT
REP
ORT
Prepared For: California Energy Commission Public Interest Energy Research Program
Prepared By: CMC-Engineering
May 2010 CEC-500-2013-133-AP


Prepared By: CMC-Engineering Carlo Castaldini Santa Clara, California 95051 Commission Contract No. 500-03-037
Prepared For:
Public Interest Energy Research (PIER) Program California Energy Commission
Avtar Bining, Ph.D. Contract Manager Environmentally Preferred Advanced Generation
Mike Gravely Office Manager Energy Systems Research Martha Krebs, Ph.D. PIER Director Thom Kelly, Ph.D. Deputy Director ENERGY RESEARCH & DEVELOPMENT DIVISION Melissa Jones Executive Director
DISCLAIMER This report was prepared as the result of work sponsored by the California Energy Commission. It does not necessarily represent the views of the Energy Commission, its employees or the State of California. The Energy Commission, the State of California, its employees, contractors and subcontractors make no warrant, express or implied, and assume no legal liability for the information in this report; nor does any party represent that the uses of this information will not infringe upon privately owned rights. This report has not been approved or disapproved by the California Energy Commission nor has the California Energy Commission passed upon the accuracy or adequacy of the information in this report.

NOTE
For further information about CMC-Engineering, call CMC-Engineering at 408-314-0382 or e-mail: [email protected].
CMCE, Inc is a registered California Corporation doing business as CMC-Engineering in Santa Clara, California

Preface
The California Energy Commission’s Public Interest Energy Research (PIER) Program supports public interest energy research and development that will help improve the quality of life in California by bringing environmentally safe, affordable, and reliable energy services and products to the marketplace.
The PIER Program conducts public interest research, development, and demonstration (RD&D) projects to benefit California.
The PIER Program strives to conduct the most promising public interest energy research by partnering with RD&D entities, including individuals, businesses, utilities, and public or private research institutions.
PIER funding efforts are focused on the following RD&D program areas:
• Buildings End-Use Energy Efficiency
• Energy Innovations Small Grants
• Energy-Related Environmental Research
• Energy Systems Integration
• Environmentally Preferred Advanced Generation
• Industrial/Agricultural/Water End-Use Energy Efficiency
• Renewable Energy Technologies
• Transportation
•
Power Generation Integrated in Burners for Packaged Industrial/Commercial Boilers – Appendix A is the final report for the Power Generation Integrated in Burners for Packaged Industrial / Commercial Boilers project (contract number 500-03-037) conducted by CMC-Engineering. The information from this project contributes to PIER’s Environmentally Preferred Advanced Generation Program.
For more information about the PIER Program, please visit the Energy Commission’s website at www.energy.ca.gov/research/ or contact the Energy Commission at 916-654-4878.
A-i

A-ii

TABLE OF CONTENTS
1.0 Appendix A ............................................................................................................................. 1
1.1. Task 2 - Select Coen Burner and Windbox Assembly ................................................... 2
1.1.1. Performance Objectives ............................................................................................ 2
1.1.2. Microturbine Selection .............................................................................................. 6
1.1.3. Windbox Selection ..................................................................................................... 8
1.1.4. Industrial Burner Selection ..................................................................................... 10
1.2. Task 3 - Develop FluentTM Model of Windbox Assembly ........................................... 12
1.2.1. Air Blower Discharge Location .............................................................................. 12
1.2.2. Interface with Windbox and TEG Distribution Bustle ....................................... 17
1.3. Task 4 - Perform Engineering Analyses ........................................................................ 20
1.4. Task 5 - Integrate MTG Controls and Burner Controls ............................................... 27
1.5. Task 6 - Engineer Insulation and Acoustic Control ..................................................... 32
1.6. Task 7 - CHP Prototype System Design ........................................................................ 35
1.7. Task 8 - LSB for Elliott Microturbine ............................................................................. 36
1.8. Task 9 - Assemble and Pretest a LSB Combustor at LBNL ........................................ 45
1.9. Task 10 - Fabricate, Assemble and Install a Test Unit ................................................. 53
1.10. Task 11 - Develop Test Plan for Prototype Unit ........................................................... 57
1.11. Task 12 - Perform Prototype Testing ............................................................................. 61
1.11.1. Final Silo Design Testing ........................................................................................ 61
1.11.2. Prototype CHP Testing ........................................................................................... 69
1.12. Task 13 - Standard Arrangement ................................................................................... 73
1.13. Task 14 - Develop Costing ............................................................................................... 75
1.14. Task 15 - Secure Field Host Site ...................................................................................... 83
1.15. Task 16 - Fabricate, Install, and Checkout Field Test Unit ......................................... 86
1.16. Task 17 – Develop Field Test Plan .................................................................................. 91
A-iii

1.16.1. CHP System Description ........................................................................................ 93
1.16.2. Test Matrix ................................................................................................................ 95
1.16.3. Measurements and Calculations ........................................................................... 98
1.16.4. Instrumentation ........................................................................................................ 98
1.16.5. Data Analysis and Reporting ................................................................................. 99
1.17. Task 18 – Perform Field Testing ................................................................................... 104
1.17.1. Emissions Data ....................................................................................................... 104
1.17.2. Efficiency Data ....................................................................................................... 106
1.18. Task 19 – Technologies Transfer Activities ................................................................. 108
1.18.1. Second International DER Conference, Napa, CA, December 9, 2006 ........... 109
1.18.2. Second International DER Conference, Napa, CA December 2006 ................ 121
1.18.3. Presentation Abstracts .......................................................................................... 133
1.19. Task 20 – Production Readiness Plan .......................................................................... 147
A-iv

LIST OF FIGURES
Figure A-1 Windbox Temperature versus Firing Rate of Boiler .............................................. 4
Figure A-2 Bowman Simple Cycle Microturbine Package ...................................................... 7
Figure A-3 Conventional Annular Combustor ......................................................................... 7
Figure A-4 Baseline NOx Emissions Profile for Unmodified TA-80 MTG ............................ 8
Figure A-5 Coen Fyr-CompakTM Windbox and Blower Configuration ................................. 9
Figure A-6 Velocity Vectors for First CFD Configuration .................................................... 13
Figure A-7 Temperature Profile in the Windbox with Hot MTG Exhaust ............................. 13
Figure A-8 Velocity Vectors with Baffle Plate at Vanes Outlet ............................................. 14
Figure A-9 Air Flow Distribution Around the ULN Burner................................................... 14
Figure A-10 Excess O2 Distribution Around the ULN Burner .............................................. 15
Figure A-11 Gas Temperature Distribution Around the ULN Burner ................................... 15
Figure A-12 Mixer Plenum Geometry A - Mixer Inside Windbox ........................................ 16
Figure A-13 Mixer Plenum Geometry B - Mixer Inside Windbox ........................................ 16
Figure A-14 Mixer A - Temperature Distribution at Burner Exit - 100% Load ..................... 17
Figure A-15 Turbine Exhaust Gas - All Flows ....................................................................... 18
Figure A-16 Mixer Temperature Profile - Full Boiler Load ................................................... 18
Figure A-17 Mixer O2 Distribution - Full Boiler Load .......................................................... 19
Figure A-18 Mixer O2 Distribution - 75% Boiler Load ......................................................... 19
Figure A-19 Mixer B Temperature Distribution at Burner Exit - 100% Load ....................... 20
Figure A-20 Preliminary CHP Process Flow Diagram ........................................................... 22
Figure A-21 Depiction of First CHP Prototype with MTG Air Intake Inside Windbox ........ 35
Figure A-22 Silo Combustor Components: Housing and Liner on the Left, Mixer, Nozzle and Shroud on the Right ................................................................................................................ 37
Figure A-23 Pressure Drop for Air Flow through Combustor ................................................ 38
Figure A-24 Pressure Drop for Fuel Flow .............................................................................. 39
Figure A-25 Ring Used in Prototype Combustor for Controlling Secondary Air Flow ......... 40
Figure A-26 Corrected NOx Emissions at Ambient Combustor Inlet Conditions ................. 40
A-v

Figure A-27 Fully Assembled Combustor with Igniter Installed (top-center) ....................... 41
Figure A-28 Combustor Components (top to bottom): Housing, Liner, Premixer Swirler, Secondary Air Blocking Plate, Shroud ................................................................................... 41
Figure A-29 End View of the Swirler Assembly Showing the Swirler Vanes, Center Plate, and Center Pilot....................................................................................................................... 42
Figure A-30 Prototype Fuel Premixer Fuel Spoke Orientation .............................................. 43
Figure A-31 Effect of Pilot Orifice Size on NOx Emissions .................................................. 44
Figure A-32 Schematic of the Fuel Feed Arrangement for Testing ....................................... 44
Figure A-33 NOx versus Equivalence Ratio for the Final Silo Combustor Design ............... 45
Figure A-34 Silo Combustor Operating in Normal Mode (Left) and with Pilot Fuel (right) . 45
Figure A-35 Design and Fabricated Turbine Housing ............................................................ 47
Figure A-36 Contoured Liner Exit and Connecting Flange.................................................... 47
Figure A-37 Schematic of Fully Assembled MTG and Silo Combustor ................................ 47
Figure A-38 Test Cell Setup of the 80 kWe MTG with New Silo Combustor ....................... 48
Figure A-39 Silo Combustor Mounted to Microturbine on Test Stand .................................. 48
Figure A-40 Corrected NOx Emissions from Prototype Tests ............................................... 51
Figure A-41 Thermal Paint Detail on Combustor Shroud after Tests .................................... 52
Figure A-42 Results of Thermal Paint Tests on Combustor Shroud, Liner and Scroll Components ............................................................................................................................ 53
Figure A-43 Coen Firetube Test Boiler Equipped with ULN BUrner.................................... 54
Figure A-44 Prototype CHP Test Setup.................................................................................. 55
Figure A-45 ULN Burner Internals and TEG Channeling Pipes ............................................ 55
Figure A-46 Windbox View of Microturbine Windbox Connection Opening ....................... 56
Figure A-47 Power Electronics Cabinet (top left), Gas Compressor (top right), and Load Bank for Prototype Assembly and Testing ............................................................................. 56
Figure A-48 Schematic of the CHP System and Test Locations ............................................ 57
Figure A-49 Increased Dimension of Second Prototype Combustor with Simplified Fuel Feed................................................................................................................................................. 62
Figure A-50 End View of First (left) and Second Combustor Designs .................................. 62
Figure A-51 Assembled Combustor Outside Housing ........................................................... 63
A-vi

Figure A-52 LBNL Low-Swirl Combustor Showing Premix Fuel Spokes (left) Inline with Swirler Blades (Right) ............................................................................................................ 64
Figure A-53 NOx Emissions Measured with Second Combustor Design .............................. 65
Figure A-54 CO Emissions with Final Design Silo Combustor ............................................. 66
Figure A-55 Microturbine Exhaust Temperature during Tests ............................................... 66
Figure A-56 Excess O2 in Microturbine Exhaust ................................................................... 67
Figure A-57 Test Results of Final Combustor Design............................................................ 68
Figure A-58 Diagram of Prototype Test Setup - Side View ................................................... 70
Figure A-59 Diagram of Test Setup - Front View .................................................................. 71
Figure A-60 Diagram of Test Setup - Side View with Boiler and Windbox .......................... 72
Figure A-61 Microturbine Cabinet Design ............................................................................. 77
Figure A-62 Prototype Burner with Microturbine Assembly (Left: Front View; Right: Section A-A) ........................................................................................................................... 78
Figure A-63 Prototype Burner with Microturbine Assembly - Side View ............................. 79
Figure A-64 Boiler Installation Equipment Arrangement ...................................................... 79
Figure A-65 Simple Payback Versus Cost of Electricity........................................................ 81
Figure A-66 Conventional Watertube Boiler Configuration .................................................. 84
Figure A-67 Unit 3 Boiler Nameplate .................................................................................... 84
Figure A-68. Pre-Retrofit Burner Setup on Unit 3 ................................................................. 85
Figure A-69 View of Unit 3 Pre-Retrofit Windbox and BMS ............................................... 85
Figure A-70 Side Views of Pre-retrofit Burner and FGR Duct .............................................. 86
Figure A-71 View of QLNTM Burner with Microturbine Bustle .......................................... 88
Figure A-72 View of QLN Burner from Boiler Furnace ........................................................ 88
Figure A-73 Installed Microturbine Cabinet........................................................................... 89
Figure A-74 View of Completed Retrofit ............................................................................... 89
Figure A-75 Schematic of Field CHP System ........................................................................ 94
Figure A-76 CHP System Boundaries for Testing ................................................................. 94
Figure A-77 Windbox O2 as a Function of FGR Rate ........................................................... 95
A-vii

Figure A-78 Sample of Emissions and CHP Efficiency Reporting Format ......................... 103
Figure A-79 CHP NOx Emissions ........................................................................................ 106
Figure A-80 Variations in CHP Efficiency with Boiler Excess Combustion Air ................. 107
LIST OF TABLES
Table A-1 Maximum Capacity for Unrecuperated Microturbine in Windbox Assembly for CHP Design Steam Generatorsa ................................................................................................ 3
Table A-2 CHP Performance Objectives - MTG Thermal Performance .................................. 4
Table A-3 CHP Performance Objectives - Boiler Thermal Performance ................................. 5
Table A-4 CHP Performance Objectives - CHP Thermal Performance ................................... 6
Table A-5 Baseline Emission Test Data with Original Combustor .......................................... 8
Table A-6 Coen's Standard Fyr-Compak Windbox Specifications .......................................... 9
Table A-7 Coen ULN Technologies for Gas-Fired Industrial Watertube Boilers .................. 11
Table A-8 Calculated Pressure Drop for Each Mixing Configuration ................................... 20
Table A-9 Energy and Mass Flows for Steam Boiler at Full Load ........................................ 22
Table A-10 Energy and Mass Flows for Steam Boiler at 75% Load ...................................... 23
Table A-11 Energy and Mass Flows for Steam Boiler at 50% Load ...................................... 24
Table A-12 Energy and Mass Flows for Steam Boiler at 25% Load ...................................... 26
Table A-13 Insulation Requirements ...................................................................................... 33
Table A-14 Heat Losses in the Windbox and CHP Efficiencies at Different Loads .............. 34
Table A-15 Noise Analysis Results ........................................................................................ 34
Table A-16 Design Parameters for First Prototype Silo Combustor ...................................... 49
Table A-17 Test Conditions for Prototype Combustion Tests................................................ 50
Table A-18 Test Measurement Parameters and Accuracy ...................................................... 59
Table A-19 Test Matrix for Preliminary CHP ........................................................................ 60
Table A-20 Revised Combustor Operating Conditions .......................................................... 64
Table A-21 Test Cell Results - Second Prototype Combustor (March 2006) ........................ 65
Table A-22 Microturbine Emissions During Prototype CHP Testing .................................... 73
A-viii

Table A-23 Boiler Operating Conditions with Unrecuperated 80 kWe CHP Arrangement and Coen DeltaNOxTM Burner..................................................................................................... 74
Table A-24 Cost Estimate for 1-- kWe Microturbine Installation .......................................... 80
Table A-25 Cost and Payback for CHP System ..................................................................... 81
Table A-26 Estimate of Cost Savings for Host Site ............................................................... 87
Table A-27 Summary of Emissions and Performance Measurements ................................... 91
Table A-28 Summary of BAAQMD Air Permit for Host Site ............................................... 92
Table A-29 CHP NOx Emissions ........................................................................................... 97
Table A-30 Test Matrix .......................................................................................................... 98
Table A-31 List of Performance Measurements and Data Sheets .......................................... 99
Table A-32 Acceptable Measurement Variability for Steady State Operation..................... 100
Table A-33 Continuous Emissions Data Recording ............................................................. 101
Table A-34 Summary of Emissions ...................................................................................... 104
Table A-35 Summary of Performance and Emissions Data ................................................. 105
Table A-36 CHP Efficiency at 80 kWe Output .................................................................... 106
Table A-37 Overall CHP Performance ................................................................................. 107
A-ix


A-xi

1.0 Appendix A The following 19 sections provide technical detail of the work performed in support of discussions presented in Section 3. The tasks are presented in sequence from Task 2 to Task 20. The work performed in each task relates to the five project phases discussed in Chapter 3 in the following manner:
1. Development and Testing of a Low-NOx Silo Combustor • Task 8. LSB for Elliott Microturbine • Task 9. Assemble and Pretest a LSB Combustor at LBNL • Task 12. Perform Prototype Testing – Silo Combustor 2. Design and Fabrication of a Microturbine-Burner Interface • Task 2. Select Coen Burner, Microturbine and Windbox Assembly • Task 3. Develop FluentTM Model of Windbox Assembly • Task 4. Perform Engineering Analyses • Task 5. Integrated MTG Controls and Burner Controls • Task 6. Engineer Insulation and Acoustic Control • Task 7. CHP Prototype Design • Task 10. Fabricate, Assemble and Install a Test Unit 3. Integrated CHP System Assembly • Task 11. Develop Test Plan for Prototype Unit • Task 12. Perform Prototype Testing – CHP Configuration • Task 13. Standard Arrangement • Task 14. Develop Costing 4. Field Installation and Demonstration Testing • Task 15. Secure Host Site • Task 16. Fabricate, Install and Checkout Field Test Unit • Task 17. Draft Field Test Plan • Task 18. Perform Field Testing 5. Project Support Activities • Task 19. Technology transfer activities • Task 20. Production Readiness Plan .
A-1

1.1. Task 2 - Select Coen Burner and Windbox Assembly The three key hardware components of the combined heat and power (CHP) assembly are the microturbine, the windbox, and the industrial burner. Auxiliary components also include the microturbine generator (MTG) power electronics (PE), the fuel gas compressor, and the industrial burner management system (BMS).
The objectives of this Task included:
1. Prepare a list of performance objectives and operational attributes 2. Prepare an outline of the burner hardware requirements that are compatible with
performance objectives of the proposed CHP 3. Select likely configuration for MTG, including combustor arrangement 4. Select burner control systems that w ill need adaptation and integration with the
MTG 5. Make selection of optimum burner/ windbox based on necessary modifications, key
performance objectives and cost 6. Prepare a burner/ w indbox selection report w ith the following key findings:
• The likely configuration for the MTG, including combustor arrangement • The selected burner control system and discussion of the factors that led to
the this selection over alternatives • The selection of the burner/ w indbox and discussion of the factors that led to
this selection over alternatives
List of accomplishments included:
• Definition of design and performance attributes • Selection of the windbox and MTG hardware • Identification of ultra low NOx (ULN) burner candidates for optimum CHP
configuration • Development of preliminary process flow diagram
The following subsections highlight the work performed toward these objectives and major conclusions reached in the selection of key hardware and initial CHP configuration.
1.1.1. Performance Objectives The initial effort of Task 2 addressed the performance specifications drawn from preliminary design and equipment assembly consideration that permit the recovery of waste heat from the microturbine and consider critical design aspects of boiler part-load operating requirements and combustion air mixing requirements, as well as windbox pressure drop. A key aspect of this design is the relative firing capacity of the MTG and the industrial burner. This is important as the burner air will be supplied in part by the MTG exhaust and the burner must retain load following capability for all practical industrial applications.
A-2

Table A-1 shows the matching of microturbine generating capacity with the boiler steam generating capacity. These specifications are based on the ability of the boiler to operate at ¼ capacity with still a 1/1 ratio of air supplied by the combustion air fan and by the MTG. This ratio is considered the minimum amount for this initial demonstration because it represents the most likely industrial application where part-load operation of industrial boilers and requirement for windbox temperature cooling are the key design considerations. In addition, the ratio considers the requirements for mixing the turbine exhaust with fresh combustion air and the temperature increase of the air to the UNL burner. The latter has implications on the size of the windbox and its pressure drop. The temperature increase in the windbox is based on the use of an unrecuperated MTG, which will have an exhaust temperature in excess of 1,0500oF. The selection of an unrecuperated MTG is fundamental to the objectives of simplifying the CHP assembly, reducing its cost and maximizing heat recovery by the boiler furnace.
Table A-1 Maximum Capacity for Unrecuperated Microturbine in Windbox Assembly for CHP Design Steam Generatorsa
Boiler Steam Output, 1000 lb/hr ULN Burner Firing Rate
MMBtu/hr (HHV)
Microturbine Generator Size, kWe
80 100 165
60 72 100
40 50 80
20 25 50
a- Turbine size based on boiler turndown of 75%. For greater turndown, required turbine derate. Shaded numbers indicate the planned prototype testing sizes for Coen test yard
Package boilers typically have an upper range of 120,000 pounds per hour (lb/hr) or about 150 million British Thermal Units per hour (MMBtu/hr) heat input. Few units can go up to 300 MMBtu/hr. Therefore, the planned demonstration was based on the retrofit of a Coen modified-ULN burner on a boiler with a maximum steam generating capacity of about 40,000-lb/hr - firing capacity of less than 50 MMBtu/hr. At ¼ firing rate of 12.5 MMBtu/hr, the combustion air fan supplies a near equivalent amount of fresh air as that found in the MTG exhaust. The retrofit of a smaller size boiler was also considered possible if the operation of the boiler is not subject to 75% turndown considered in this analysis, or if turbine exhaust gas (TEG) is not premixed in the windbox. This is more likely for installations that have several spare boilers where steam load can be modulated by shutting down boilers rather than lowering each boiler firing rate.
When the 1,050 F turbine exhaust gas (TEG) is allowed to mix within the windbox with incoming ULN blower air, the windbox temperature will vary according to the trend shown in Figure A-1 from boiler full steaming capacity to its ¼ load turndown. For smaller boilers
A-3

or boilers subject to significant load turndown, windbox insulation will be necessary with this CHP integration approach. The project team also considered the option of channeling the TEG directly into the burner to eliminate mixing in the windbox and thus prevent the requirement for windbox insulation. This option relies specifically on selected Coen burner designs and operating requirements.
Tables A-2 to A-4 list the performance objectives of the key CHP components, the MTG and the boiler windbox/burner assembly, for an 80 kWe MTG coupled with a 50 MMBtu/hr industrial burner.
Figure A-1 Windbox Temperature versus Firing Rate of Boiler
Table A-2 CHP Performance Objectives - MTG Thermal Performance
MICROTURBINE All Btus are on HHV basis Target Efficiency
- NG Fuel to Combustor MMBtu/hr 2.12
kWt 621
- NG Fuel Compressor Input MMBtu/hr 0.018
kWt 5.2
- Total Energy Input MMBtu/hr 2.14
kWt 627
- Generator Output MMBtu/hr 0.273 12.8%
kWe 80
- Turbine Exhaust MMBtu/hr 1.71 80.2%
kWt 503
- Generator Coolant MMBtu/hr 0.031 1.4%
kWt 9.0
- Radiant Losses (Elect+MTG) MMBtu/hr 0.18 5.5%
kWt 35
- Total Energy Output & Losses MMBtu/hr 2.14 98.4%
kWt 626 0
050
100150200250300350400450500
0 10 20 30 40 50 60
Boiler Firing Capaciity, MMBtu/hr
Win
dbox
Tem
pera
ture
A-4

The specifications highlight the heat input to the MTG and boiler. These in turn specify the mass flow rates as well as the temperatures, and thus the impacts on pressure drop, power output and efficiencies.
The heat input to the unrecuperated microturbine is about 2.12 MMBtu/hr (high heating value (HHV)). The only other energy needs for the microturbine is from the fuel gas compressor. The energy required by the fuel compressor is based on specifications from Bowman Power, the original MTG supplier for the project. On the output side, the generator only produces 80 kilowatt electrical (kWe) of power, which converts to 0.273 MMBtu/hr, corresponding to a simple cycle (unrecuperated) efficiency of about 14.5 percent (%) on a low heating value (LHV) basis. About 85.5% of the heat input to the turbine escapes as heat in the exhaust. This 1.61 MMBtu/hr is recoverable in the boiler with an efficiency equivalent to that of the boiler. Additional losses are due to the generator coolant and radiant losses from the hot turbine surfaces. These losses can also be recovered and they count as credits toward the needed heat input to the boiler.
Table A-3 CHP Performance Objectives - Boiler Thermal Performance
BOILER Firing Rate
50 MMBtu/hr
Fuel to ULN Burner MMBtu/hr 48.1
kWt 14085
Turbine Exhaust MMBtu/hr 1.56
kWt 457
Radiant Losses from MTG MMBtu/hr 0.108
kWt 32
Air Blower MMBtu/hr 0.109
kWt 32
Feedwater Pump MMBtu/hr 0.0232
kWt 6.80
Total Energy Input MMBtu/hr 49.9 0
kWt 14612 0
Steam Output MMBtu/hr 43.0 86.3% 13.7%
kWt 12603
Stack Losses MMBtu/hr 5.47 10.7% 89.3%
kWt 1603
Radiant Losses (boiler) MMBtu/hr 0.994 1.5% 98.5%
kWt 291
Boiler Blowdown MMBtu/hr 0.398 0.8% 99.2%
kWt 117
- Total Boiler Energy Balance MMBtu/hr 49.9 99.3% 0.7%
kWt 14614 0
A-5

The heat to the boiler consists of the fuel to the Coen ULN burner, the available heat credits from the MTG and the additional energy required to run the auxiliaries, such as the air blower and feedwater pump. Typically, energy used by auxiliaries is not counted in a boiler efficiency calculation, as we have done here. Therefore, the calculated boiler efficiency is slightly lower than that specified by the vendor. The selected boiler for the prototype demonstration is a Hurst firetube with a heat input capacity of 50 MMBtu/hr (HHV), or 48.1 MMBtu/hr when adjusted by the MTG exhaust heat value. Because of the available turbine credits, the burner requires only 48.1 MMBtu/hr of heat, 96% of the heat required. The air blower and feedwater pump energy are parasitic and thus they do not appear in the output. The air blower energy requirements account for any additional flue gas recirculation needed for ULN emission performance. The stack losses are based on a boiler efficiency of 81% (HHV basis), or about 89% LHV. The 81% was based on the manufacturer specifications. Thus the stack losses from the boiler translate to 5.47 MMBtu/hr (LHV) with minor additional losses for radiant heat and blowdown.
Table A-4 CHP Performance Objectives - CHP Thermal Performance
CHP SYSTEM %MTG %Boiler - Total Heat In MMBtu/hr 50.33 4.2% 95.8%
kWt 14750 CHP Efficiency 86.0%
Note that, in this arrangement, the MTG accounts for about 4.3% of the total fuel used in the CHP assembly. Under these relative heat input conditions, the overall CHP system efficiency approaches that of the boiler. The overall CHP efficiency is based on the total fuel used divided into the net energy output. When calculated on a HHV basis, the CHP efficiency is at about 86% LHV.
1.1.2. Microturbine Selection The project selected a simple cycle MTG supplied by Bowman. The reason for this selection was the availability of an unrecuperated design that can be readily converted to fire with a new combustor system. Since this selection, Bowman entered into receivership and was replaced by Elliott Energy Systems, Inc (EESI) of Stuart, FL. This change did not constitute a material change to the project as EESI was the supplier of MTG equipment to Bowman.
Figure A-2 shows the simple cycle MTG package as was shipped to CMCE. Operation of the MTG requires the placement of an air filter and a silencer at the air compressor inlet, illustrated to the left of the photo. The manufacturer supplied cabinet includes sound insulation to maintain noise levels from the MTG below 80 dba at 2 meters. The microturbine and generator were removed from this package and shipped to EESI for baseline testing to confirm emission levels with original annular combustor illustrated in Figure A-3. The MTG combustor supplied by EESI is an annular partial oxidation combustor with secondary staged air for burnout. In addition EESI upgraded the oil tank to a more recent design and replaced the generator. Table A-5 and Figure A-4 shows the baseline emission profile over the load on the engine using the conventional partial oxidation
A-6
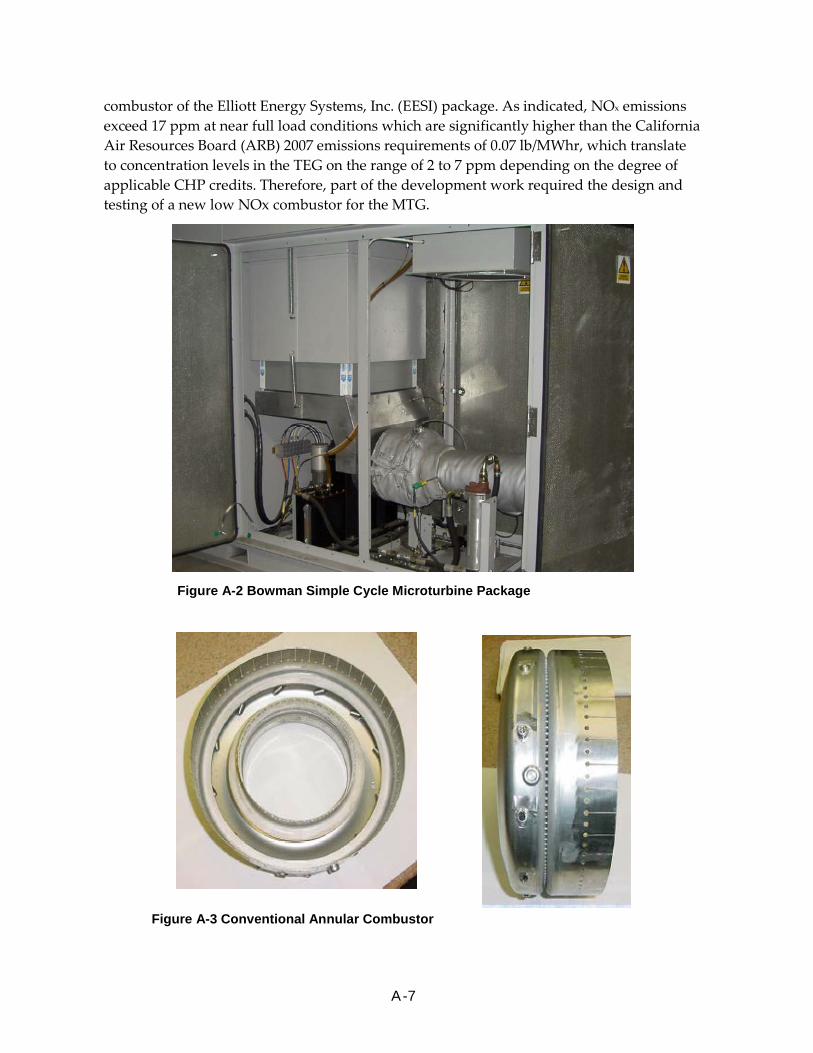
combustor of the Elliott Energy Systems, Inc. (EESI) package. As indicated, NOx emissions exceed 17 ppm at near full load conditions which are significantly higher than the California Air Resources Board (ARB) 2007 emissions requirements of 0.07 lb/MWhr, which translate to concentration levels in the TEG on the range of 2 to 7 ppm depending on the degree of applicable CHP credits. Therefore, part of the development work required the design and testing of a new low NOx combustor for the MTG.
Figure A-2 Bowman Simple Cycle Microturbine Package
Figure A-3 Conventional Annular Combustor
A-7

Table A-5 Baseline Emission Test Data with Original Combustor
Power (kWe)
EGT (Deg F)
O2 (%)
CO (ppm)
NOx (ppm)
NO/NO2 CO (ppm at 15% O2)
NOx (ppm at 15% O2)
0.5 655.7 17.9 16 7.5 6.6/08 31.1 14.6
20.8 716 17.4 43 13.7 12/1.7 73.1 23.3
40.5 815.3 16.9 162 17.8 16.5/1.1 238.1 26.2
60.6 923 16.3 199 17.2 16.5/0.5 255.8 22.1
75.7 1020.2 15.8 166 15 13.8/1.3 192.6 17.4
Figure A-4 Baseline NOx Emissions Profile for Unmodified TA-80 MTG
1.1.3. Windbox Selection The project focused on the use of Coen’s Fyr-CompakTM windbox illustrated in the front- and side-view drawings of FigureA-5. This windbox design has been standard with Coen’s commercial burner sales and therefore it is widely used in industry with currently over 3000 boiler installations throughout the U.S, Canada and Mexico. The design is offered in four typical sizes depending on the firing rate of the burner, as shown in Table A-6. This windbox design provides some attractive features for the CHP integrated package. First, it can be easily retrofit to existing boilers and provides important cavity space for the integration of the hot sections of the MTG and the mixing the TEG with fresh combustion air
A-8

from the air blower. The Fyr-CompakTM is used with a variety of Coen-designed burners, each targeted to the primary fuel used by the boiler and the emission regulations applicable to the site.
Figure A-5 Coen Fyr-CompakTM Windbox and Blower Configuration
Table A-6 Coen's Standard Fyr-Compak Windbox Specifications
Design Specification Fan Housing WxD, in. Burner Windbox WxH, in. 230-WB 47 x 16 48 x 48 250-WB 60 x 20 68 x 68 260-WB 65 x 20 70 x 70 270-WB 60 x 30 76 x 76
The”notch” between the windbox and the fan housing allows for placement of the boiler steam drum (for watertubes) and associated piping, which normally extend past the end of the boiler. For firetubes, there is no need for the “notch” because firetube have no external drum. Coen has selected the fan housing arrangement with the notch for the demonstration
A-9

of the prototype CHP for this project because of the targeted watertube boiler market that is dominant with Coen’s industrial burner sales. Right below the top flange, marking the top of the windbox and the location of the fan assembly, Coen places a set of combustion air vanes that, coupled with another set of vanes at the fan inlet, allow for control of combustion air flow to the burner during part load operation. Consequently, the fan employed operates with a constant speed motor. Final selection of windbox arrangement is reserved to the requirements of the host facility selected for the demonstration testing of the CHP technology.
1.1.4. Industrial Burner Selection Table A-7 lists current Coen commercial family of gas-fired low NOx burners for industrial boilers. Coen selects the appropriate burners depending on the market and NOx regulations and performance requirements specific to the site. The FIRTM burner was developed by GTI (formerly GRI) and is licensed to Coen. Because of the limited experience with the FIRTM burner and the relatively high pressure drop compared to other ULN design, much of the CHP design effort focused primarily with each of the remaining three burner designs, DeltaNOxTM ULN, QLNTM ULN, and QLNTM. The project moved to engineering evaluations of the MTG with each of these ULN types, although final ULN burner selection hinges more on the permitted NOx emission levels and other requirements specific to the host site selected for the demonstration.
The DeltaNOxTM offers a desirable combination of low-pressure drop and NOx performance. In fact, this burner has had applications on the reburning of gas turbine exhaust in conventional CHP applications, where low-pressure drop is important to the power generation of the prime mover. This burner requires a longer windbox because of its flue gas recirculation (FGR) and premix combustion design. One key aspect of ULN burner operation with TEG from the MTG is the ability to mix the TEG and incoming fresh air from the blower. This is to ensure that the ULN burner sees an even concentration of excess O2 and gas velocity distribution to maintain stable combustion at lean conditions needed for low-NOx operation. In a conventional FGR system, Coen achieves this by channeling the FGR gas directly to the inlet to the blower.
The QLNTM and QLN-ULNTM burners were designed to achieve ULN performance with reduced FGR requirements. This is important from an operating cost perspective and can offer a market advantage. One key design aspect of the QLNTM is the requirement for selective areas of targeted FGR rates, for example toward the six premixed axial spuds slots. In a CHP configuration, this will entail channeling the TEG toward these spuds using a properly design manifold. The high temperature, vitiated air from the microturbine can match the FGR needs of the QLNTM premixed slots while providing additional flame stability. The QLN burner was considered as potentially good candidate for the CHP demonstration because the FGR provided with the TEG ould significantly reduce or eliminate the need for any external FGR thus achieving even greater overall CHP efficiency
A-10

Table A-7 Coen ULN Technologies for Gas-Fired Industrial Watertube Boilers
DeltaNOxTM ULN NOx capability = 9 ppm Required FGR at full firing rate = 40% Pressure drop (incl. FYRTM) w indbox = 6-in Preheated air = Yes Notes: Most versatile
QLNTM ULN NOx capability = 9 ppm Required FGR at full firing rate =20% Pressure drop (incl. FYRTM) w indbox = 8 in Preheated air = Yes Notes: Limited in furnace cross-section and space heat release
QLNTM
NOx capability = 15 ppm Required FGR at full firing rate = 0% Pressure drop (incl. FYRTM) w indbox = 8 in Preheated air = Yes Notes: Limited in furnace cross-section and space heat release
FIRTM NOx capability = 9 ppm Required FGR at full firing rate = 5-10% Pressure drop (incl. FYRTM) w indbox = 10-in Preheated air = Yes Notes: Limited cross-section; not fully tested, low turndown; High pressure drop
A-11

1.2. Task 3 - Develop FluentTM Model of Windbox Assembly The objectives of this task were to:
• Develop a computational fluid dynamics (CFD) model using FluentTM
• Analyze several preliminary key component arrangements in the CHP
• Develop flow patterns and heat transfer profiles
• Identify optimum configuration and hardware requirements
The accomplishments for this task included:
• Coen prepared a CFD model evaluating two separate MTG integration configurations
• Conducted analyses of key Parameters that influence the operation of Coen’s ULN burners
• Selected optimum configuration based on results of the FluentTM-based analyses
• Prepared a task report summarizing the findings
The key factor for the CHP design was the placement of the unrecuperated MTG, or at a minimum the hot side of the MTG, within the windbox configuration so to achieve a good balance between simplicity of design, recovery of all waste heat from the MTG, and effectiveness in mixing hot TEG with the incoming fresh air from the burner blower. Because the exhaust from the MTG represents a source of increased in temperature and dilution of oxygen partial pressure in the ULN burner mix, it was important to maintain adequate distribution not only to optimize NOx formation within the ULN but also to maximize its benefits on operational flexibility of the ULN, especially at its lowest NOx operational settings.
For this analysis, two TEG-windbox interface configurations were evaluated and the selection between these two was based on the adequacy of the mixing at the ULN burner inlet.
1.2.1. Air Blower Discharge Location The first of these configurations placed the MTG at the outlet of the blower, ahead of the flow controlling vanes, just downstream of the ULN burner air blower discharge. Figures A-6 to A-8 show the configuration and the temperature and velocity profiles at the critical burner inlet face. A baffle plate in the model was added to improve the distribution of the TEG and mixing. Figures A-9 to A-11 show the deviation from the mean in the air flow, the temperature, and the all important excess oxygen, at the ULN burner inlet. The results indicated that the variations were most likely excessive and any modifications to the burner, i.e., the addition of other baffle plates increased the pressure drop and reduced the overall efficiency of the blower.
A-12
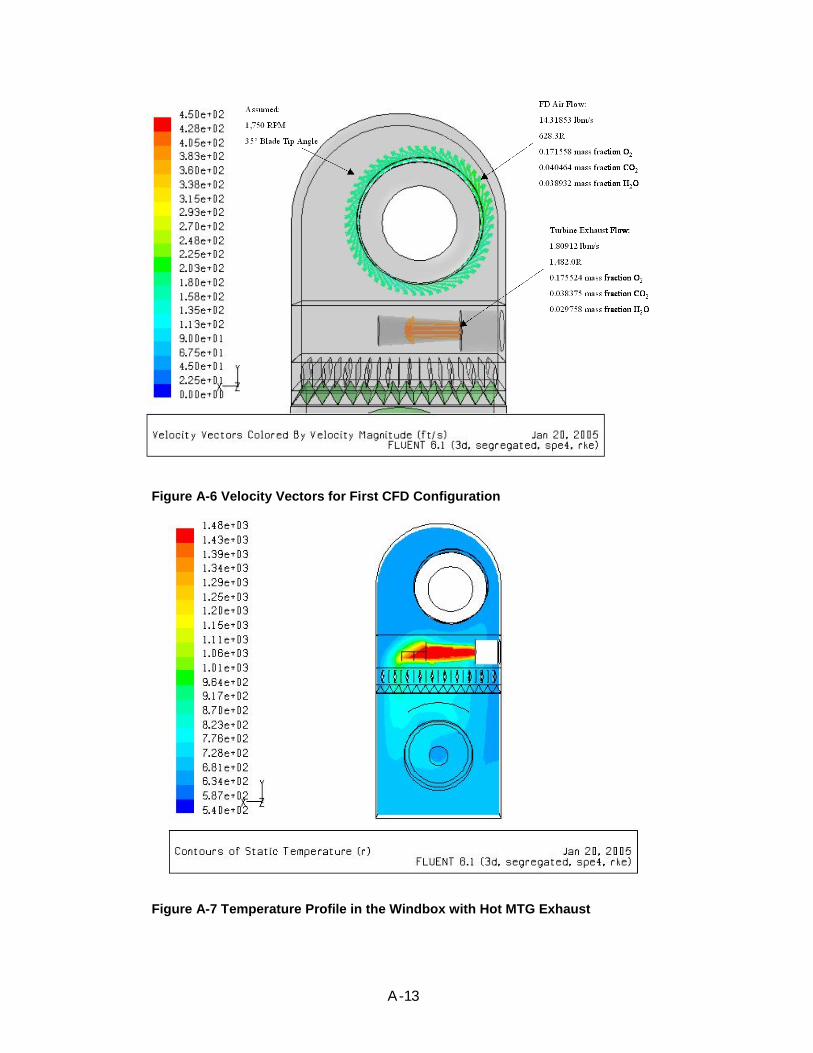
Figure A-6 Velocity Vectors for First CFD Configuration
Figure A-7 Temperature Profile in the Windbox with Hot MTG Exhaust
A-13

Figure A-8 Velocity Vectors with Baffle Plate at Vanes Outlet
Burner Annulus Mass Distribution
90%
92%94%
96%98%
100%
102%104%
106%108%
110%
-180 -135 -90 -45 0 45 90 135 180
CW Angle from 12:00 (Viewed from Furnace)
Flow
/ A
vera
ge F
low
Baseline w/Baffle
Figure A-9 Air Flow Distribution Around the ULN Burner
A-14

Burner Annulus O2 Distribution
90%
92%94%
96%
98%100%
102%
104%
106%108%
110%
-180 -135 -90 -45 0 45 90 135 180
CW Angle from 12:00 (Viewed from Furnace)
lbm
/s O
2 / A
vera
ge lb
m/s
O2
Baseline w/Baffle
Figure A-10 Excess O2 Distribution Around the ULN Burner
Burner Annulus Temperature Distribution
600
620
640660
680
700
720
740760
780
800
-180 -135 -90 -45 0 45 90 135 180
CW Angle from 12:00 (Viewed from Furnace)
Gas
Tem
pera
ture
(Ran
kine
)
Baseline w/Baffle
Figure A-11 Gas Temperature Distribution Around the ULN Burner
Therefore, a second configuration was considered in the analysis. For this configuration a gas distribution manifold was placed in the windbox ahead of the burner, with the exhaust
A-15

from the MTG channeled into the manifold so to provide more targeted and even flow around the circumference of the ULN burner. Figures A-12 and A-13 illustrate the manifold and gas injectors designs evaluated. An additional advantage of this approach is that the hot MTG exhaust gas is kept inside the manifold resulting in lower windbox temperatures and more targeted injection near the burner exit to maintain more stable combustion. The lowered temperatures in the windbox improve the boiler load turndown capability which can be important for some installations that do not have spare boilers. The plenums are similar with the exception of directional channeling of the TEG toward the burner entrance.
Figure A-12 Mixer Plenum Geometry A - Mixer Inside Windbox
Figure A-13 Mixer Plenum Geometry B - Mixer Inside Windbox
A-16

1.2.2. Interface with Windbox and TEG Distribution Bustle Figures A-14 through A-19 illustrate the results of the CFD modeling for this second approach. Figure 60 shows the high temperature of the TEG as it enters the distribution plenum located inside the windbox. The TEG temperature translates to a temperature profile of about 640 F to 730 F at the burner inlet as illustrated in Figure A-15. The oxygen content of the TEG is illustrated in Figures A-16 and A-17 prior to being rapidly mixed with the incoming fresh air from the blower. Table A-8 indicates that the MTG exhaust will see a total back pressure in the range of 5.4 to 5.8 inches of water. Although this back pressure does not represent an operational difficulty, it will translate to a small loss in MTG power output of about 3-5 kWe. To compensate for this generating loss, additional fuel can be added to the silo combustor. This incremental fuel will increase the equivalence ratio in a fully premixed silo combustor which could potentially increase NOx emissions.
Overall, good temperature and excess O2 distributions are reflected in the model. This is evident by a deviation of about less than 100 F and less than 0.02 percentage points for the excess O2. Also, Table A-8 indicates an overall lower impact on flow resistance, which is important for minimizing energy consumption. Therefore, the project selected this arrangement based on the results of this CFD modeling effort. The use of the manifold (bustle) for the TEG lends itself to the selection of the QLNTM for the final demonstration testing provided the site requirements are consistent with this selection.
731 R Max (+38R)
641 R Min (-52R)
693 R Average
731 R Max (+38R)
641 R Min (-52R)
693 R Average
Figure A-14 Mixer A - Temperature Distribution at Burner Exit - 100% Load
A-17

Figure A-15 Turbine Exhaust Gas - All Flows
Figure A-16 Mixer Temperature Profile - Full Boiler Load
A-18
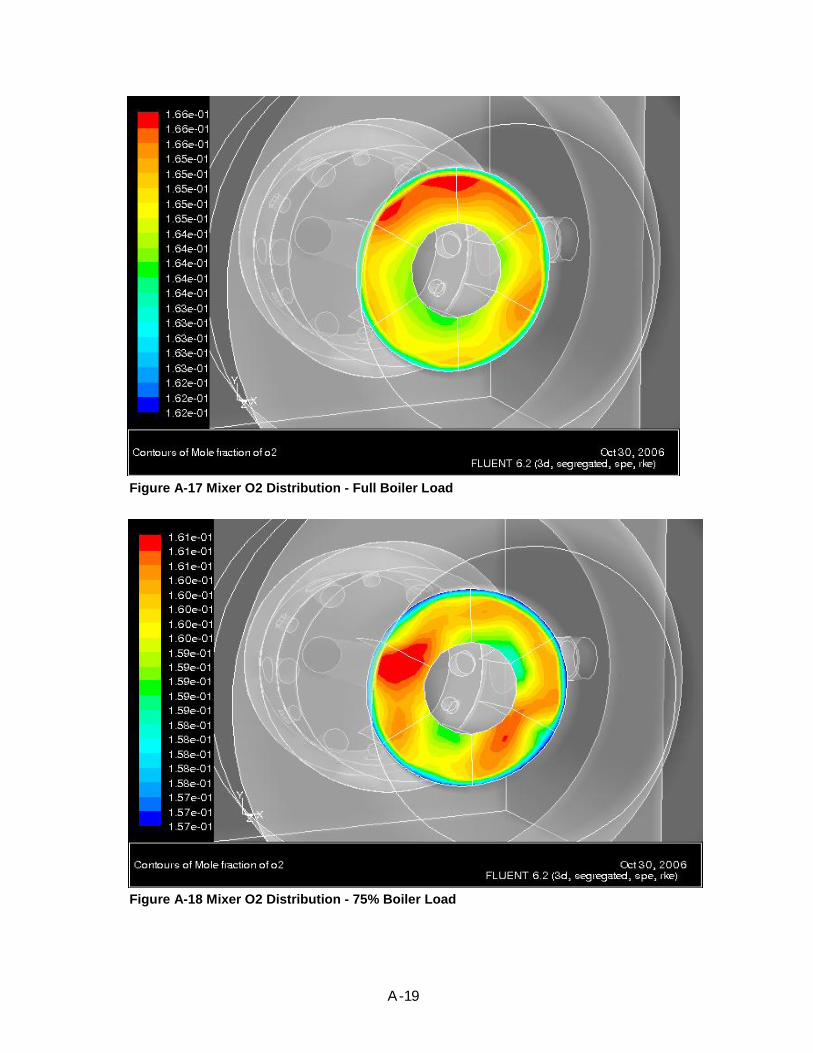
Figure A-17 Mixer O2 Distribution - Full Boiler Load
Figure A-18 Mixer O2 Distribution - 75% Boiler Load
A-19
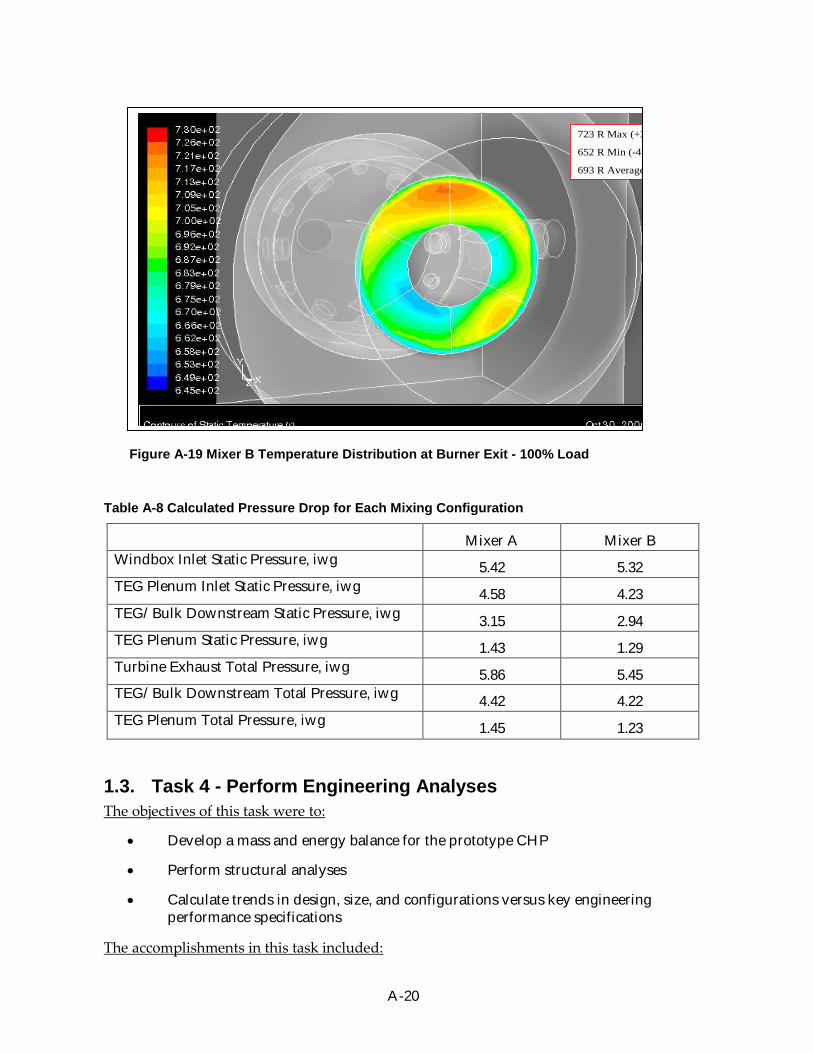
Figure A-19 Mixer B Temperature Distribution at Burner Exit - 100% Load
Table A-8 Calculated Pressure Drop for Each Mixing Configuration
Mixer A Mixer B Windbox Inlet Static Pressure, iwg 5.42 5.32 TEG Plenum Inlet Static Pressure, iwg 4.58 4.23 TEG/ Bulk Downstream Static Pressure, iwg 3.15 2.94 TEG Plenum Static Pressure, iwg 1.43 1.29 Turbine Exhaust Total Pressure, iwg 5.86 5.45 TEG/ Bulk Downstream Total Pressure, iwg 4.42 4.22 TEG Plenum Total Pressure, iwg 1.45 1.23
1.3. Task 4 - Perform Engineering Analyses The objectives of this task were to:
• Develop a mass and energy balance for the prototype CHP
• Perform structural analyses
• Calculate trends in design, size, and configurations versus key engineering performance specifications
The accomplishments in this task included:
723 R Max (+3
652 R Min (-4
693 R Average
723 R Max (+3
652 R Min (-4
693 R Average
A-20

• An analysis of the energy and mass balance based on probable arrangements to include recovery of all latent waste heat from the MTG exhaust as well as recovery of waste heat from convective losses
• Evaluated the probable CHP system assembly configuration to ensure consistency with conventional ULN burner retrofits
• Considered enclosure requirements for hot sections of MTG
• Prepared an engineering analysis report
Figure A-20 illustrates the CHP process flow diagram. Tables A-9 to A-12 summarize the heat and mass flows at each selected location in the process for four boiler firing rates and constant MTG power output. The data are for an 80 kWe simple-cycle microturbine exhausting to an industrial ULN burner rated at 50 MMBtu/hr heat input. The process illustrates how all the waste heat, including the heat normally dissipated by the cooling oil in the MTG is recovered within the windbox via a heat exchanger located in the combustion air intake. In its final configuration, the oil coolant heat exchanger was relocated to the microturbine air inlet.
In this arrangement, the MTG will use about 4.5% of the total fuel use by the CHP while providing 80 kWe of gross power. Net power output will be approximately 74 kWe because of the requirement for gas compression and power electronics. When considering that the boiler will use approximately 50 kWe of power, the net outflow to the plant will be an additional 24 kWe that can be used to power other equipment within the industrial complex. When all the waste heat from the MTG is recovered, the overall CHP efficiency will approach the efficiency of the boiler at each boiler load condition. Most units at or below this firing capacity are packaged firetubes and smaller watertubes that produce 150 to 250 psig saturated steam. These boilers, operating with 10-15 percent excess air and a stack temperature of 300-350 F, will have a thermal efficiency of about 80-85% percent calculated by the heat loss method of the American Society of Mechanical Engineers (ASME) power test codes (PTC) 4.1. A 150 psig 20,000 lb/hr boiler would require 22-25 MMBtu/hr heat input. The net generating output from the EESI MTG T-80 would be approximately 74 kWe.
The initial design of locating the water-air heat exchanger in the windbox was abandoned because the cooling requirements for the water would be hampered by the increased windbox temperature that results with recirculated flue gas for NOx control. This is because the part load operation of the boiler will impose more stringent requirements on the CHP assembly because of the reduced cooling effects of less fresh air mixing with the microturbine exhaust and less air flowing over the water-air radiator. Furthermore, the original two-heat exchanger design for the oil cooling system was replaced with one oil-air heat exchanger The new heat exchanger is similar to a automobile radiator, much like the one already used in current Elliott/ (Calnetix Power Solutions (CPS) microturbines.
A-21

Figure A-20 Preliminary CHP Process Flow Diagram
Table A-9 Energy and Mass Flows for Steam Boiler at Full Load
3
7
7
1
18
19
20
17
16
6
13
10
12
11
8
5
14
15
9
4
Generator
OilTank
Oil-H2OHeatEx
Burner
Windbox Inlet Air-H2O Heat xch.
Blower
Boiler
MTGElectr.Cabinet
2
18a
A-22

100% Boiler Load
Tot. Flow Nat Gas Temp Press Enthalpy Heat O2 CO2 NOx H2O NOx
Loc ID lb/hr lb/hr F psia Btu/lb Mbtu/hr lb/hr lb/hr lb/hr lb/hr lb/Mbtu
1 Gas Compressor Inlet 97.6 97.6 70 19.7 21739 2.12
2 Gas Compressor Outlet 97.6 97.6 343.3 78.8 21887 2.14
3 MTG Air Compressor Inlet 5209 70 14.7 0 0 1214
4 MTG Air Compressor Outlet/Turbine Inlet 5209 199 58.8 31.0 0.16 1214
5 MTG Turbine Outlet 5306 1060 14.73 263.7 1.40 833.1 269.5 0.051 217.0 0.024
6 MTG Cooling Oil Outlet 158
7 MTG Cooling Oil Inlet 130
8 Air-H2O Heat Exch. Water Inlet 1844 130 98 1844
9 Air-H2O Heat Exch. Water Outlet 1844 120 88 1844
10 Fresh Air Blower Inlet 37721 70 8789
11 Cabinet Cooling Air Outlet/Blower Inlet 3562 118 14.7 11.5 0.0409 832.8 22.3
12 Blower Inlet Total Air 41283 70 9619
13 Heat Exchanger Air Outlet 41283 72.4
14 Total Burner Blower Outlet 53178 76.9
15 Mixed Air and Gas Turbine Outlet 58484 190 264 1.40 833 270 0.051 217
16 Burner Fuel Inlet 2142 2142 70 16.7 21162 45.33
17 Burner Outlet/Boiler Inlet 60626 2800 0.0083 748 45.33 1002 6218 0.504 4894 0.011
18 Boiler Stack Outlet 48731 1002 6218 1 4894 0.011
18a FGR Rte to Blower 11895 300 0.0083 55.2 0.657 1002 6218 0.504 4894
19 Boiler Water Inlet 44439 180 140 44439
20 Boiler Steam Outlet 44439 350 140 44439 Table A-10 Energy and Mass Flows for Steam Boiler at 75% Load
A-23

Tot. Flow Nat Gas Temp Press Enthalpy Heat O2 CO2 NOx H2OLoc ID lb/hr lb/hr F psia Btu/lb Mbtu/hr lb/hr lb/hr lb/hr lb/hr
1 Gas Compressor Inlet 97.6 97.6 70 19.7 21739 2.12
2 Gas Compressor Outlet 97.6 97.6 343.3 78.8 21887 2.14
3 MTG Air Compressor Inlet 5209 70 14.7 0 0 1214
4MTG Air Compressor Outlet/Turbine Inlet 5209 199 58.8 31.0 0.16 1214
5 MTG Turbine Outlet 5306 1060 14.73 263.7 1.40 833.1 269.5 0.051 217.0
6 MTG Cooling Oil Outlet 158
7 MTG Cooling Oil Inlet 130
8 Air-H2O Heat Exch. Water Inlet 1844 130 98 1844
9 Air-H2O Heat Exch. Water Outlet 1844 120 88 1844
10 Fresh Air Blower Inlet 27142 70 6324
11Cabinet Cooling Air Outlet/Blower Inlet 3562 118 14.7 11.5 0.0409 832.8 22.3
12 Blower Inlet Total Air 30704 70 7154
13 Heat Exchanger Air Outlet 30704 72.4
14 Total Burner Blower Outlet 39669 76.9
15 Mixed Air and Gas Turbine Outlet 44975 230 264 1.40 833 270 0.051 217
16 Burner Fuel Inlet 1593 1593 70 16.7 21162 33.72
17 Burner Outlet/Boiler Inlet 46568 2800 0.0083 724 33.72 742 4694 0.388 3696
18 Boiler Stack Outlet 37603 742 4694 0 369618a FGR Rte to Blower 8965 300 0.0083 55.2 0.495 742 4694 0.388 3696
19 Boiler Water Inlet 33055 180 140 3305520 Boiler Steam Outlet 33055 350 140 33055
Table A-11 Energy and Mass Flows for Steam Boiler at 50% Load
A-24

50% Boiler Load
Tot. Flow Nat Gas Temp Press Enthalpy Heat O2 CO2 NOx H2O NOx
Loc ID lb/hr lb/hr F psia Btu/lb Mbtu/hr lb/hr lb/hr lb/hr lb/hr lb/Mbtu1 Gas Compressor Inlet 97.6 97.6 70 19.7 21739 2.122 Gas Compressor Outlet 97.6 97.6 343.3 78.8 21887 2.14
3 MTG Air Compressor Inlet 5209 70 14.7 0 0 1214
4 MTG Air Compressor Outlet/Turbine Inlet 5209 199 58.8 31.0 0.16 1214
5 MTG Turbine Outlet 5306 1060 14.73 263.7 1.40 833.1 269.5 0.051 217.0 0.024
6 MTG Cooling Oil Outlet 158
7 MTG Cooling Oil Inlet 130
8 Air-H2O Heat Exch. Water Inlet 1844 130 98 1844
9 Air-H2O Heat Exch. Water Outlet 1844 120 88 1844
10 Fresh Air Blower Inlet 16563 70 3859
11 Cabinet Cooling Air Outlet/Blower Inlet 3562 118 14.7 11.5 0.0409 832.8 22.3
12 Blower Inlet Total Air 20125 70 4689
13 Heat Exchanger Air Outlet 20125 72.4
14 Total Burner Blower Outlet 26159 76.9
15 Mixed Air and Gas Turbine Outlet 31466 305 264 1.40 833 270 0.051 217
16 Burner Fuel Inlet 1045 1045 70 16.7 21162 22.10
17 Burner Outlet/Boiler Inlet 32510 2800 0.0083 680 22.10 482 3170 0.272 2498 0.012
18 Boiler Stack Outlet 26476 482 3170 0 2498 0.012
18a FGR Rte to Blower 6034 300 0.0083 55.2 0.333 482 3170 0.272 2498
19 Boiler Water Inlet 21671 180 140 21671
20 Boiler Steam Outlet 21671 350 140 21671
A-25

Table A-12 Energy and Mass Flows for Steam Boiler at 25% Load
25% Boiler Load
Tot. Flow Nat Gas Temp Press Enthalpy Heat O2 CO2 NOx H2O NOx
Loc ID lb/hr lb/hr F psia Btu/lb Mbtu/hr lb/hr lb/hr lb/hr lb/hr lb/Mbtu
1 Gas Compressor Inlet 97.6 97.6 70 19.7 21739 2.12
2 Gas Compressor Outlet 97.6 97.6 343.3 78.8 21887 2.14
3 MTG Air Compressor Inlet 5209 70 14.7 0 0 1214
4 MTG Air Compressor Outlet/Turbine Inlet 5209 199 58.8 31.0 0.16 1214
5 MTG Turbine Outlet 5306 1060 14.73 263.7 1.40 833.1 269.5 0.051 217.0 0.024
6 MTG Cooling Oil Outlet 158
7 MTG Cooling Oil Inlet 130
8 Air-H2O Heat Exch. Water Inlet 1844 130 98 1844
9 Air-H2O Heat Exch. Water Outlet 1844 120 88 1844
10 Fresh Air Blower Inlet 5984 70 1394
11 Cabinet Cooling Air Outlet/Blower Inlet 3562 118 14.7 11.5 0.0409 832.8 22.3
12 Blower Inlet Total Air 9546 70 2224
13 Heat Exchanger Air Outlet 9546 72.4
14 Total Burner Blower Outlet 12650 76.9
15 Mixed Air and Gas Turbine Outlet 17956 485 264 1.40 833 270 0.051 217
16 Burner Fuel Inlet 496 496 70 16.7 21162 10.49
17 Burner Outlet/Boiler Inlet 18452 2800 0.0083 569 10.49 222 1646 0.156 1300 0.015
18 Boiler Stack Outlet 15348 222 1646 0 1300 0.015
18a FGR Rte to Blower 3104 300 0.0083 55.2 0.171 222 1646 0.156 1300
19 Boiler Water Inlet 10287 180 140 10287
A-26

The total NOx emissions from the CHP assembly was calculated to remain at or below 9-ppm corrected to 3% O2 (or level established in the site specific air permit), mainly on the strength of the QLN burner. As noted, the microturbine will use approximately 5 percent of the total gas fuel when the boiler is at full load. This will increase to about 20 percent when the boiler is at 25% load, the lower limit for steam generation on this unit. The target NOx emission level from the microturbine will be 0.051 lb/hr at 80 kWe, translating to 0.63 pounds per megawatt hour (lb/MWhr), which when coupled with the heat recovery credits of the CHP assembly will meet the 0.07 lb/MWhr established under the ARB 2007 requirements. As indicated, with 0.051 lb/hr of NOx (as NO2) released from the microturbine the overall NOx emissions from the boiler stack will be at 0.504 lb/hr corresponding to about 9 ppm. Because of part-load operation, NOx emissions will decrease to 0.156 lb/hr at 25% load, which translate to about 0.015 lb/MMBtu or 14 ppm corrected to 3% O2.
1.4. Task 5 - Integrate MTG Controls and Burner Controls The technical objectives of this task were as follows:
• Develop the logic diagrams
• Develop safety control loops
• Design an integrated control system and electronic assembly
• Fabricate the system
• Test and checkout the system
The following objectives were achieved for Task 5:
• Coen identified the control logic for operation of the MTG with and without the boiler ULN being on
• Coen prepared a Control Systems Design Report specifying all the logic and step-by-step procedures for all modes of operation for the CHP package
• A series of tests were performed to validate the operation of the ULN burner with the MTG
• A test report was prepared to summarize the CHP performance and validate the control logic
From an operator’s control viewpoint, there are two main parts to this package, an electric power generating gas turbine package and a burner/boiler package. The turbine portion consists of the following primary functional parts:
• Gas powered turbine including a compressor, combustor, the turbine itself, and an electrical generator.
• Turbine control electronics including the power electronics associated with the power generation.
A-27

• Turbine support subsystems including oil lubrication for the turbine shaft bearings and either oil, water or air cooling of the electrical generator.
The burner/boiler portion consists of the following primary functional parts:
• Combustion air and fuel system including a combustion air fan, ducting, air flow control (windbox) damper, a fuel supply regulator, fuel shutoff valves and a fuel flow control valve.
• The burner including the windbox assembly, register, the gas burner itself and the manifold system that delivers turbine exhaust into the burner.
• The boiler furnace
• The boiler including all instrumentation associated with it such as drum pressure and level safety interlocks.
Because of the integration of these two major systems, there are some additional criteria that are important to know from the operational standpoint. The turbine exhaust is directed to a manifold within the burner and provides the flue gas the burner needs to meet its emission design limits. The burner also has a separate flue gas recirculation system that it can use when the turbine is not operating. So when the burner is operating with the turbine, the burner’s flue gas recirculation system is turned down by closing down on the FGR damper.
When the turbine alone is operating, the burner’s combustion air system (the forced draft fan and the windbox damper) are still operated 1) to keep the internal burner parts from overheating on the high temperature turbine exhaust and 2) to provide cooling air for the turbine generator cooling system. When the burner is firing with the turbine off, the burner simply uses its own FGR system. However, to prevent backflow of hot furnace gases into the turbine (thru its exhaust outlet), a damper ahead of the turbine air inlet is closed and an auxiliary turbine purge air fan just downstream of that damper is operated to keep a positive pressure on the turbine, slightly higher than the furnace pressure.
The turbine may have its generator cooling system linked to the burner in the form of a heat exchanger on the combustion air inlet to the burner’s forced draft fan of turbine compressor inlet (i.e., acting as a low-temperature recuperator). When the turbine is operating, the burner will either need to be firing (and maintaining a minimum air flow per the turbine’s load requirements) or the burner’s forced draft fan will at least need to operate to provide cooling air to the heat exchanger.
Therefore, there are three principal modes of operation that the integrated control system needs to address:
• Turbine operating (with burner not firing).
• Burner firing (with turbine not operating).
• Both turbine operating and burner firing.
A-28

The following is a summary of the logic sequence integrated in the combustion control system (CCS) of Coen burner management system (BMS). Both startup and shut-down sequences are evaluated. The following lists the logic sequence for only the startup procedures.
TURBINE START-UP (BURNER NOT FIRING):
In order to start the turbine, the turbine inlet isolation damper must be proven open. The BMS normally keeps this damper open (solenoid de-energized) except for when the burner is to fire with the turbine not running. At all other times, the damper is left open.
On the burner control panel HMI, go to the MAIN screen. With the burner off and no operational mode selected, the status message will indicate “BURNER OFF - NO MODE SELECTED”. Go to the OPERATING LIMITS screen. Press the “TURBINE” select pushbutton under the “MODE SELECT” label.
The BMS will verify the turbine inlet isolation damper is open via the turbine inlet isolation damper opened switch (TIDO). With the burner not firing and this switch made, the BMS will then close the “start permit” contact to the turbine control panel to allow the turbine to start.
With the turbine “start permit” from the BMS made, start the turbine per the turbine manufacturer’s documentation.
Once the turbine is running, the turbine closes a “turbine running” contact to the BMS. Within about 2 minutes, the BMS will automatically start the forced draft (FD) fan. The CCS will position the windbox damper according to the turbine load and ambient air temperature.
BURNER START-UP (TURBINE NOT OPERATING):
Prior to starting the burner, verify that all auxiliary services that the boiler relies on are available. This will include but is not limited to a boiler feedwater supply, power for the FD fan, feedwater pump motors, etc., fuel gas supply pressure, and power available to the burner control panel. The feedwater system may also be reliant on a deaerator system being operational which may include having a supply of makeup water and pegging steam available to the deaerator.
Start the feedwater pump(s) and other required equipment.
Verify that the boiler’s drum level control is operating and preferably is in automatic mode.
Before starting the burner, verify that the Steam Pressure control is set to the desired operational state (auto or manual - see note below). This control can be found on the MAIN screen of the burner control HMI.
On the burner control panel HMI, go to the MAIN screen. With the burner off and no operational mode selected, the status message will indicate “BURNER OFF - NO MODE
A-29

SELECTED”. Go to the OPERATING LIMITS screen. Press the “GAS FIRING” select pushbutton under the “MODE SELECT” label.
Go to the MAIN screen. Verify that the “START LIMITS”, “BURNER LIMITS” and the “GAS LIMITS” indicators are highlighted. If any start or burner limit is not made, go to the OPERATING LIMITS screen to determine which limit(s) are not made. The applicable limits are listed below as well.
With the indicators noted above highlighted, the “BURNER START” pushbutton will also be highlighted in green on the MAIN screen. Press the “BURNER START” pushbutton.
When the “ACCEPT” and “CANCEL” pushbuttons become highlighted, press the “ACCEPT” pushbutton to energize the Master Fuel Trip relay (RMFT).
When the master fuel trip relay contact (RMFT) closes, the BMS will start the turbine purge fan. The status message on the MAIN screen will indicate “WAITING FOR TURBINE PURGE FAN LIMIT”.
When the turbine purge fan interlock (TPSI) is made for 5 seconds, the BMS will energize to close the turbine inlet isolation damper. The status message on the MAIN screen will indicate “WAITING FOR TURBINE INLET DAMPER TO CLOSE”.
When the turbine inlet isolation damper closed switch (TIDC) is made, the BMS will start the forced draft (FD) fan. The status message on the MAIN screen will indicate “WAITING FOR COMBUSTION AIR LIMITS”.
The combustion air limits listed below will be made when the two additional limits consisting of the FD fan starter interlock (FSI) and the low combustion air pressure switch (LCAP) are made. When the combustion air limits are made, the status message will then indicate “CONTROLS TO PURGE” and the burner light off sequence will begin.
During the pre-purge cycle, the CCS will send a 100 % output signal to the windbox damper and the FGR damper to drive them fully open.
Once the pre-purge limits listed below are made, the status message will indicate “PRE-PURGE IN PROGRESS”. Below the status message, the purge time left (in seconds) will be displayed as it counts down to zero.
When the pre-purge cycle is completed, the CCS will drive the windbox damper and the gas flow control valve to their respective light off positions. The CCS will drive the FGR damper fully closed. The status message will indicate “CONTROLS TO LIGHT-OFF”.
With the light off limits listed below made, the status message will indicate “PREPARING FOR PILOT IGNITION” during a five second pre-ignition setup time. During this time, the pilot vent valve (PVV) and main gas vent valve (GVV) will energize and close.
A-30

After the pre-ignition setup time, the status message will indicate “PILOT IGNITION IN PROGRESS”. The ignition transformer (ITX) and pilot shutoff valves (PVU & PVD) will energize. Pilot trial for ignition is ten seconds.
After the ten second trial for pilot ignition, the ignition transformer will de-energize. Pilot flame must be detected or a flame failure shutdown will occur. With flame detected, the status message will indicate “PILOT PROVING DELAY”.
Five seconds after the ignition transformer de-energizes, the gas shutoff valves (GVU & GVD) will energize and open.
When the gas fuel shutoff valves energize, the main ignition timer will start timing for a preset delay (10 seconds for gas and no. 2 oil, 15 seconds for no. 6 oil). During this time the status message will indicate “MAIN IGNITION IN PROGRESS”.
When the main ignition timer completes its timing, the pilot shutoff valves will de-energize stopping pilot fuel flow. Main flame must be detected or a flame failure shutdown will occur. The status message will indicate “MAIN IGNITION COMPLETE”.
After main flame has been established without the pilot for 15 seconds, the BMS will release control of the burner demand to the CCS. At that time, the status message will display “AUTO MODULATION - GAS FIRING”.
Go to the MAIN screen. If starting the boiler cold, manually raise the demand on the Steam Pressure control to gradually bring up the steam drum pressure according to the boiler manufacturer’s prescribed methods. Once the boiler is at or near the desired operating pressure, the Steam Pressure control can be set to auto.
TURBINE START-UP (BURNER FIRING):
With the burner firing but the turbine not operating, the turbine inlet isolation damper will be closed and the turbine purge fan will be running. The turbine will be started in this condition using the purge fan as its combustion air source. Because of this, the turbine will be held at the light off level. Also, the CCS must assure the firing rate is above a preset minimum demand so that the extra flue gas from the turbine exhaust does not cause burner instability and there is sufficient combustion air flow for the generator cooling heat exchanger.
On the burner control panel HMI, with the burner released to auto-modulation firing gas, go to the OPERATING LIMITS screen, press the “TURBINE & GAS FIRING” select pushbutton under the “MODE SELECT” label.
The BMS will verify that the turbine inlet isolation damper closed switch (TIDC) and the turbine purge fan starter interlock (TPSI) are made. With these two limits made, the BMS will close the “start permit” contact to the turbine. The CCS will activate the preset minimum demand, raising the firing rate to this level if needed.
A-31

With the turbine “start permit” from the BMS made, start the turbine per the turbine manufacturer’s documentation.
Once the turbine is running, the turbine closes a “turbine running” contact to the BMS. Immediately the CCS will start ramping closed the FGR damper.
When the CCS has fully closed the FGR damper and the BMS detects the FGR damper closed switch (FGRC), the BMS will open the turbine inlet isolation damper.
When the BMS detects that the turbine inlet isolation damper opened switch (TIDO) is made, it will shut off the turbine purge fan and at the same time release the turbine from being held at the light off level. The turbine will then be released to modulate to generate power as needed.
1.5. Task 6 - Engineer Insulation and Acoustic Control The technical objectives of this task were:
• Calculate the amount of thermal insulation needed
• Estimate the db level
• Estimate vibration and other potential harmonics
• Design acoustic and thermal insulation arrangements
• Prepare design specifications
For this task, the project team accomplished the following:
• Performed heat transfer calculations on the hot sections of the MTG exhaust and manifold inside the windbox
• Evaluated the MTG noise levels specified by the vendor and compared it to the boiler fan noise level
Table A-13 summarizes the insulation requirements for the increased windbox temperature that results from the placement of the hot portion of the microturbine in the windbox and associated hot exhaust of the simple cycle microturbine. The efficiency calculations for each system component are included in the analysis as well as the gross and net efficiency of the CHP (the latter accounts for the energy needs to compress the microturbine fuel and energy losses in the power electronics unit). Finally, the table also includes the effect of additional heat losses that will result from the increase in windbox temperature and the selected amount of windbox insulation, which was set at 0.5 inches throughout the windbox. As noted in the example of 80 kWe MTG with 50 MMBtu/hr boiler, when the boiler is at full load the windbox temperature increases to 212 F. With the selected insulation, the heat loss through the walls of the windbox amounts to approximately 0.0162 MMBtu/hr, which in the context of the overall heat input to the CHP assembly represents a very manageable amount. Thus, the net CHP efficiency does not get affected by this small amount of heat loss through the windbox.
A-32

Table A-14 summarizes the same analysis of heat loss through the windbox with selected insulation and its effect on the efficiency of the CHP assembly. As indicated above, the effect increases when the boiler load is decreased compared to the microturbine load. As indicated in Table 23, the windbox temperature increases from 212 F to 548 F when the boiler load is reduced from 100 percent to 25 percent of firing capacity. The associated heat loss through the windbox walls increases from 0.016 to 0.0419 MMBtu/hr, while the surface temperature of the windbox increases from 68 to 86 F. Note that most of the heat from the turbine exhaust is almost immediately dissipated in the boiler. However, the mixture of fresh air and turbine exhaust in the windbox will eventually reach the equilibrium levels indicated in Table A-14.
Therefore, the analysis shows that an amount of insulation of 0.5 inches in the windbox at most may be needed to maintain very low heat losses due to increased windbox temperatures and maximum CHP efficiency levels will not be affected significantly by these additional losses.
Table A-13 Insulation Requirements
MMBtu/hr kW System and Componet EfficienciesEnergy InTurbine 2.16 632 Turbine Boiler CHP net CHP w/ windbox Boiler 45.14 13231 14.9% 81.6% 81.51% 81.4% 81.4%
Turbine Energy Losses RecoveredCooling Oil 0.09 25Cooling Air 0.0409 0.001
Turbine Energy Losses Unrecovered Gas Compression 0.031 9.16Power Electronics 0.017 5.00Boiler Stack 4.59 1346
Insulation RequirementsBurner windbox temp, F 212Windbox area, ft^2 76.5Insulation Tickness, in^2 0.5Thermal Cond. Btu/hr-in/ft^2-F 0.5Heat Loss, MBtu/hr 0.016186261Outside box Temp, F 68
For the acoustic analysis, the noise levels of the microturbine (reported by the MTG vendor) were compared with the noise levels currently associated with the operation of the industrial boiler fan that supplies combustion air to the burner windbox. Table A-15 summarizes the results of this analysis. The data indicate that the level of noise anticipated from the microturbine in the selected configuration is much lower than the level of noise that the burner blower already causes. Therefore, it is anticipate that the noise will not be an issue. Preliminary checkout tests of the microturbine operation at the Coen Test Yard have
A-33

generally confirmed these results. The windbox insulation will provide adequate noise protection as well as heat insulation.
Table A-14 Heat Losses in the Windbox and CHP Efficiencies at Different Loads
Insulation Thickness = 0.5 inchesAmbient Temp = 60 F
Boiler loadPercent 100 75 50 25
MMBtu/hr burner 45.1 32.3 21.9 10.3Windbox Temp, F 212 258 344 548Out surface Temp, F 68 70 75 86Heat Loss, Mbtu/hr 0.016 0.019 0.0263 0.0419
CHP Efficiency 0.814 0.811 0.805 0.788W/ added windbox loss 0.814 0.810 0.804 0.784
Table A-15 Noise Analysis Results
Location T-80 Microturbine Octave band SPL dBA at 1M in Free Field
31.5 63 125 250 500 1K 2K 4K 8K Total dba SPL
1 40 51 56 58.4 60 64 53 46 50 67.06
2 39 56 57 59.4 62 65 55 50 55 68.61
3 37 52 56 59.4 61 60 54 49 47 66.10
4 35 56 58 59.4 62 65 55 50 54 68.64
5 37 62 64 64.4 66 72 61 56 55 74.57
6 38 52 59 68.4 72 67 65 58 64 75.45
Gas Compressor, dBA at 1 M in Free Field
1 43 61 56.4 63 63 60 57 50 68.64
2 4470 62 63.4 65 71 66 65 56 74.33
3 34 59 61.4 64 66 62 60 51 70.58
4 60 61.4 65 67 62 62 51 71.42
Fyr-Compak at 50 MMBtu/ hr with FD Fan 47.6 56 55 6063 63 64 77 77 80 82.11
Total SPL = 82.15 dBA
A-34

1.6. Task 7 - CHP Prototype System Design The following lists the objectives specific to this task:
• Prepare detailed set of line drawings and fabrication assembly drawings
• Prepare the CHP prototype system design report
The project team accomplished the following:
• Developed a first design approach and drawings based on incorporating the hot section of the MTG within the windbox
• Selected a design that allows the MTG to utilize fresh air rather than ULN burner blower supplied air
• Prepared a report on the design configuration highlighting the rationale for selected configuration
Figure A-21 shows a 3-D depiction of the integrated CHP configuration. The key aspects of this selected design are (1) the placement of the air intake section of the MTG outside the windbox, and (2) the utilization of an insulated manifold within the windbox to focus the TEG circumferentially around the ULN burner. The selection of air intake to be placed outside the windbox allows for additional combustion air supplied by the MTG and an easier access to the air filter. This brings about benefits by essentially increasing the available air supply to the burner with having to replace the existing blower in a retrofit situation.
Figure A-21 Depiction of First CHP Prototype with MTG Air Intake Inside Windbox
A-35

These preliminary drawing were further refined by enclosing all the auxiliary components for the alternator and compressor air intake into a separate cabinet. Also the hot section of the MTG was placed in an open extension to the side of the Fyr-CompakTM windbox to permit easier servicing. Finally, the manifold inside the windbox was improved to provide more uniform gas flow around the burner and thus improve the mixing with the incoming air as discussed in Section 7.3.
1.7. Task 8 - LSB for Elliott Microturbine The objectives for this task were as follows:
• Select the optimum combustor configuration
• Design the low swirl nozzle (LSN) and premix assembly based on ongoing work at Lawrence Berkeley National Laboratory (LBNL) with Solar Turbines
• Configure and fabricate components for parametric testing
• Prepare the Task Report
The following lists what was accomplished:
• Calculations were performed to determine the impact of NOx from MTG on boiler emissions and combustor performance targets for NOx levels were developed to minimize impact on ULN burner permitting
• A silo fully premix combustor was selected based on potential NOx reductions from current levels of the EESI combustor
• A new combustor was designed and fabricated and pre-tested at LBNL
LBNL had recently adapted the patented low-swirl burner (LSB) nozzle technology to Solar Turbines annular combustor. However, no prior work was performed on silo combustor for microturbines. This project provided the opportunity to adapt the LSB to a newly designed silo combustor that would accurately partition primary and bypass air flows for an EESI T80 simple cycle MTG so to achieve the lean combustion condition necessary to achieve NOx levels in the mid-single digit. Laboratory data at LBNL indicated that the equivalence ratios in the primary flame zone necessary to reach these low NOx levels would have to be on the order of 0.55 to 0.60. At these levels the adiabatic flame temperature would be low enough to maintain Thermal NOx formation at a minimum in line with the project target NOx performance.
CMC-Engineering provided design input on the configuration of the fully premixed silo combustor based on designs also used in large main-frame gas turbines. The low swirl combustor assembly design was based the thermal input requirement for the simple cycle engine, which is about 2 MMBtu/hr. Using the air and fuel flows for the engine, an initial combustor diameter of 2.5 inches was selected. The combustor housing was designed to minimize alteration of the engine form factor. Switching from the annular form of the original combustor to the silo configuration needed for the low swirl combustor does result
A-36

in significant changes to the microturbine component layout. The silo combustor directs the air from the compressor up the outside of the liner providing backside cooling for the inner combustor liner. At the top of the silo, the air splits into the combustion air flowing down the center toward the low swirl nozzle, and the secondary air which bypasses the combustion zone. The split between primary and secondary air is needed to control the primary zone equivalence ratio which in turns controls flame stability and NOx formation. The combustor assembly components are shown in Figure A-22.
Figure A-22 Silo Combustor Components: Housing and Liner on the Left, Mixer, Nozzle and Shroud on the Right
The combustion air flows through the premixer section, where a radial array of fuel spokes inject fuel into the air stream. The geometry of the spokes and orientation of the injection holes were established to provide a reasonably uniform fuel-air mix without excessive backpressure for the fuel and the combustion air. The fuel-air mix then flows into the swirler assembly. This system creates the desired flow pattern needed to generate a stable lifted flame in the flame zone downstream of the exit.
Flow tests were conducted to assess the pressure drops associated with the air flow through the combustor assembly and with the fuel flow through the premixer assembly. The pressure drop, shown in inches of water, for the air flow is quite modest as seen in Figure A-23. The total pressure of the incoming combustion air is at approximately 4 atm. The performance of the microturbine should not be adversely affected by the addition of the silo
A-37

combustor assembly, and the system may have somewhat less pressure drop than the existing design with the annular combustor.
Figure A-23 Pressure Drop for Air Flow through Combustor
Limiting the pressure drop in the fuel flow system is important because excessive backpressure will not allow the gas compressor to supply the desired amount of fuel, and the engine will not achieve its rated performance. The fuel injection spokes in the premixer assembly were designed to act as the limiting constriction in the fuel supply system so that a consistent fuel-air mixture can be obtained. The combustor for microturbine receives about 35 scfm of fuel at full power. LBNL was able to test the combustor in the laboratory with about 75% of this value. The pressure drop in the fuel system is shown in Figure A-24. The highest data points show a reasonably linear trend between flow rate and pressure. From these measurements, about 15 psi pressure drop in the fuel would be recorded when the microturbine would be operating at its rated power. The gas compressor is able to provide sufficient fuel at this pressure so that the turbine can operate at full power.
A-38

Figure A-24 Pressure Drop for Fuel Flow
The swirler was recessed from the flame zone by a distance that was sufficient to provide suitable interaction between the center non-swirling flow and the swirling flow surrounding it. The combustor flame sits above the combustor exit and is enclosed by an expanding cone shown in Figure A-22. The ignitor location is also shown in the figure. In its first design, the ignitor mounted on the right side of the shroud with the ignitor tip placed in the flow of gases coming out of the combustor. The cone was followed by a straight section to provide time for burnout of CO and unburned hydrocarbons before the exhaust mixes with the cooler secondary air.
The secondary air flows outside of the premixer and combustor assembly. The air flow split between combustion air and secondary air was initially controlled by a ring with properly sized openings (blocking plate), as shown in Figure A-25. Proper combustion air flow is necessary to achieve the desired flame equivalence ratio and NOx emissions. The secondary air provides backside cooling of the shroud that encloses the flame. It then mixes with the combustion exhaust gases downstream of the shroud. The secondary air cools the exhaust gas to a temperature that the turbine blades can tolerate. This exhaust flow from the combustor assembly is directed into an annular scroll constructed by Elliott. This unit directs the exhaust gas flow into the turbine. Some of the air from the compressor is directed
A-39

over the outside of the scroll to cool it, so not all of the air flows through the combustor assembly.
Initial testing was conducted at LBNL at atmospheric conditions without preheat. Tests results, shown in Figure A-26, demonstrated that the ignitor could light off the flame without difficulty at these conditions. NOx emissions were about 5 ppm at an equivalence ration of 0.6. The flame produced by the unit was stable and flame lean blowout occurred at equivalence ratios slightly above 0.50 without any pilot fuel flowing. A stable flame at leaner conditions can be achieved by preheating the air and/or flowing some fuel through the central pilot. Thus a flame with good stability can be achieved at the normal turbine operating conditions. Emissions were measured in the combustor exhaust in the lab with a Horiba PG-250 emission analyzer. At the operating conditions that can be achieved at the LBNL facility, NOx emissions were well into the single digit regime. Due to the air supply limitations, we were limited to a maximum air flow of about 250 scfm.
Figure A-25 Ring Used in Prototype Combustor for Controlling Secondary Air Flow
Figure A-26 Corrected NOx Emissions at Ambient Combustor Inlet Conditions
A-40

Figure A-27 illustrates the silo combustor fully assembled. On the right of the picture is the inlet gas connection and on the left the tapered liner protrudes beyond the length of the silo. When installed on the engine, the protrusion in the liner extends into a new microturbine housing that was fabricated by EESI and discussed under Task 9. The liner exit is shaped to contour the scroll section of the microturbine so that hot combustion gases can be introduced tangentially into the power turbine. Combustion air from the air compressor travels on the outside of the liner to the top of the silo before making a 180 degree turn into the primary combustion zone. On the side of the liner (top of the picture) the connection for the ignitor is visible. The ignitor feeds through the walls of the silo housing, liner, and shroud. This eliminates the need for a fragile high voltage feed-through. The separate pieces of the unassembled silo combustor are shown in Figure A-28.
Figure A-27 Fully Assembled Combustor with Igniter Installed (top-center)
Figure A-28 Combustor Components (top to bottom): Housing, Liner, Premixer Swirler, Secondary Air Blocking Plate, Shroud
A-41

The top of the picture in Figure A-28 shows the combustor housing, followed by the liner. At the bottom of the picture on the left is the LBNL LSB nozzle with the patented perforated center plate. In the lower middle is the blocking plate that controls the amount of bypass air. Finally, the exit cone, or flame shroud, of the combustor is shown on the right. All three pieces at the bottom fit in the combustor liner, which in turn fits into the housing.
A detailed view of the premixer-swirler assembly and the LSB characteristic perforated plate is shown in Figure A-29. This prototype has been flow tested at atmospheric pressure to assess its effective area. The premixer-swirler assembly was fed with air from a blower at flows from 60 to 300 standard cubic feet per minute (scfm) while the pressure upstream of the unit was recorded. The results indicated a back pressure of about 4 inches water gauge (iwg), consistent with acceptable microturbine performance. The results indicate that the effective area of the assembly is about 2.7 square inches. Although this size compares favorably with similar combustor assemblies developed for turbine applications, follow up tests at Elliott/CPS indicated that a larger effective area was necessary to achieve the targeted equivalence ratio and NOx emissions.
Figure A-29 End View of the Swirler Assembly Showing the Swirler Vanes, Center Plate, and Center Pilot
The first fuel premixer was constructed with nine radial fuel injection spokes. Flow tests on this system indicated that it did not provide sufficiently good mixing to achieve the desired flame stability and emissions. A second premixer with 16 fuel injection spokes was designed and tested. A photograph of this design is shown in Figure A-30. The space in the center of the fuel spokes is used to feed a tube for pilot fuel into the combustor exit. This premixer design was found to provide good mixing over a range of conditions and worked well with a center pilot tube in place.
A-42

Pilot fuel, approximately 5% of the total fuel used by the MTG, enters the combustion chamber via the center hole at the end of the swirler and center plate visible in Figure 67. The pilot fuel burns in a hotter diffusion flame that provides combustion stability especially at ignition and low firing rates. The holes in the center plate were fabricated to be relatively small initially so that the assembly could be tested with a relatively high swirl number. The holes in the center plate were then opened up to decrease the swirl number to the desired range (S = 0.50-0.55), within the desired range of the LSB optimum performance. This is consistent with the patented LBNL LSB design.
Figure A-30 Prototype Fuel Premixer Fuel Spoke Orientation
The combustor assembly (without the housing) was mounted in test stand at the LBNL combustion laboratory and its performance was assessed over a range of air flow rates and equivalence ratios. The air flow backpressure was measured and found to be quite similar to the original low swirl combustor configuration. Tests were conducted on the effect of the pilot orifice size on NOx emissions. The combustor was operated at an equivalence ratio of 0.6 and operated with a range of orifice sizes to determine the effect of pilot fuel on overall NOx emissions. The results are shown in Figure A-31. The emissions with no pilot flow were essentially the same as the smallest pilot fuel orifice used (0.042" diameter). The final design used the orifice diameter that is consistent with combustion stability during light-off and engine loading while also meeting NOx emissions at full generating capacity of 80 kWe. While the larger orifices produce more NOx, the overall NOx levels are still well in the single digit range.
The pilot fuel flow system was configured as shown in Figure A-32. During normal operation, the solenoid valve is closed, and pilot fuel only flows through the flow-restricting orifice (set at a diameter of 0.042"). The pilot fuel solenoid valve is opened when there is a need for additional pilot fuel to improve flame stability, such as during start-up and engine
A-43

loading operation, especially below 40 kWe. With little or no flow restriction between the solenoid valve and the pilot tube, a substantial fraction of the fuel flows through the pilot, and the flame can be stabilized at a very low overall equivalence ratio.
Figure A-31 Effect of Pilot Orifice Size on NOx Emissions
Figure A-32 Schematic of the Fuel Feed Arrangement for Testing
Using the small orifice for the pilot, the emissions were monitored over a range of equivalence ratios and are shown in Figure A-33. Corrected CO emissions were in the range of 1000 to 2000 ppm. The burnout of CO was anticipated to improve at engine conditions since, once installed in the engine, the secondary air is preheated to 400°F at the exit of the compressor. Also, any remaining CO emissions from the MTG would be burned in the ULN burner when configured in the CHP mode.
A-44

Figure A-33 NOx versus Equivalence Ratio for the Final Silo Combustor Design
During the laboratory bench-scale tests, the combustor flame was monitored visually using a metal mirror mounted about the combustor assembly in the exhaust hood. Photos of the system in operation are shown in Figure A-34. The photo on the left shows the flame at lean conditions with no pilot fuel flowing through the small orifice. The photo on the right shows operation at a very lean equivalence ratio with the pilot fuel solenoid open. The pilot-assisted flame on the right contracts to the relatively rich zone in the center, providing significantly improved stability at lean conditions.
Figure A-34 Silo Combustor Operating in Normal Mode (Left) and with Pilot Fuel (right)
1.8. Task 9 - Assemble and Pretest a LSB Combustor at LBNL The listed objectives for this task included:
A-45

• Setup test facility at LBNL
• Prepare a test plan for the LSB silo combustor
• Perform emissions and performance/ structural testing
• Prepare a test report
The original scope of work called for tests at LBNL. However, the project team secured the support of EESI for fabrication of key components, and more importantly, for tests of the silo combustor on an engine test cell to validate performance under actual operating conditions. This was highly desirable because LBNL did not posses any high pressure testing equipment and therefore compressor outlet temperatures were much lower than those the combustor would experience in an actual engine. This deviation in the project scope represents an important improvement in the success of the new silo combustor design. Because two sets of tests were performed, the first series of tests was conducted under this task, with continuation of the second series of tests completed under Task 12.
Therefore, for this task, the project accomplished the following:
• EESI designed and fabricated a new turbine housing to adapt the silo combustor
• EESI prepared the test setup at their facility in Stuart, Florida
• A test plan was developed that covered startup and emissions testing at various engine loads (from no load to 80 kWe) and for evaluation of various air splits and pilot fuel settings.
• Performance and emissions tests were performed on the test cell at EESI under focusing on the first prototype silo combustor
• A test report was prepared and submitted
EESI modified the engine to adapt the new silo combustor and provided testing at their research facilities in Stuart, Florida. Modifications required removing the original annular combustor and designing and fabricating a new turbine housing that would match with the connecting flange of the new silo combustor. Figure A-35 illustrates the design of the new turbine housing. The fabricated housing, illustrated in the photograph on the right of Figure A-35, has a flange that is matched with the silo combustor end flange, illustrated in Figure A-36. A schematic of the silo combustor connected to the EESI simple cycle MTG is shown in Figure A-37 along with a photograph of the combustor aligned with the new turbine housing. The fully assembled microturbine on the test cell at EESI is illustrated in Figures A-38 and A-39. The silo combustor has outside dimensions of approximately 2 feet in length and 6.5 inches in outside diameter, including flanges.
A-46

Figure A-35 Design and Fabricated Turbine Housing
Figure A-36 Contoured Liner Exit and Connecting Flange
Figure A-37 Schematic of Fully Assembled MTG and Silo Combustor
A-47

Figure A-38 Test Cell Setup of the 80 kWe MTG with New Silo Combustor
Figure A-39 Silo Combustor Mounted to Microturbine on Test Stand
The initial testing was performed by spinning the turbine up to starting conditions and confirming the integrity of the flow system. This was followed by tests using the normal start-up procedure for the microturbine. It was found that the engine with the low swirl combustor would light off at the normal start-up conditions, so no changes were needed in the standard start-up procedure. On occasion, some noise was observed when ramping up from the start-up conditions. It is likely that this could have been eliminated by modifying the air-fuel ratio at engine speeds slightly above the engine start-up rpm.
Two set of performance tests were performed at EESI. The first with the first prototype combustor, the second with the revised design which corrected the center flow to reduce the equivalence ratio and achieve target NOx levels and pilot fuel for stability. This section
A-48

discusses the first series of prototype tests. Optimization tests with a revised combustor are presented in Section 7.11
Tables A-16 shows the key operating conditions tested for the first prototype combustor with the smaller inner diameter and bypass blocking plates. The objectives of these tests were to determine operating performance, combustion stability, thermal stress and emission performance. All test results were successful except for NOx emissions which showed levels at full load of 80 kWe in the range of 30 to 40 ppm, corrected to 15% O2. As indicated in Table A-16, the flame equivalence ratio was calculated to be in the range of 0.78 to 0.85, much too high than the design target of 0.50 to 0.60.
Table A-16 Design Parameters for First Prototype Silo Combustor
Run Date
Backside air
sq. inch
Secondary
air
sq inch
LSC area
sq. inch
Estimated
equivalence ratio
at no load
Estimated equivalence ratio at 80
KW load
Range of air flow split to
flame
Jul 25 1.8 3.55 1.38 0.68 0.85 0.205-0.250 Jul 25 1.8 2.90 1.59 0.67 0.84 0.207-0.253 Jul 26 1.8 2.35 1.46 0.63 0.82 0.22-0.26 Jul 28 1.4 2.35 1.09 0.62 0.80 0.225-0.265 Jul 28 1.4 1.90 1.22 0.60 0.78 0.23-0.27
Table A-17 provides a summary of the emissions measured during the July 2006 tests at the EESI facility. The test engine was operated from 0 to 82 (full load) kW electrical output, the design rating on the engine. The combustor lit off easily and did not show any instabilities at operating speed. The acoustic monitor on the engine only showed signals that were associated with the engine speed (one, two, and sometimes three times the 68,000 rpm engine speed, i.e. 1130 Hz). Some rumble was noted as the engine was ramped up after light-off, and this disappeared by 20,000 rpm. As the data in Tables A-16 and A-17 indicate, the combustor was operating at higher equivalence ratios than intended due to significant amounts of air from the compressor going into the flow providing backside cooling for the scroll.
The air flow from the compressor is at the rated value when the engine is at the full rotor speed. In the prototype combustor design, the compressed air is split into three flow paths. One air path flows to cool the backside of the scroll/annular liner that receives the exhaust gas from the combustor. The rest of the air flows to the combustor, where it splits into combustion air and secondary air, as discussed above. The flow split is controlled by the effective areas of the three paths. This is complicated by the fact that the flame creates significant backpressure and decreases the effective area for combustion air upon ignition.
A-49

The blocking ring shown in Figure A-25 controlled the air split between combustion air and secondary air. The combustor achieved single digit NOx emissions at no load conditions with the first blocking plate. Additional testing demonstrated improved NOx emissions when a secondary air blocking plate was installed that directed more air to the combustion zone, and the flame equivalence ratio approached the desired operating conditions. However, the emissions at full load conditions were higher than desired with the flow splits tested, so some design modifications are needed to achieve the emission goals. The corrected NOx emissions from the first series of tests are shown in Figure A-40 Increasingly restrictive blocking plates were used in the second and third tests to increase the amount of primary combustion air.
Table A-17 Test Conditions for Prototype Combustion Tests
secondary air bypass plate # holes/dia
fuel, lbs/hr fraction of air to combustor
estimated phi
electricity out, kW
NOx, ppm @ 15% O2
16-0.50"
57 .185 .68 0 11.4 57 .185 .68 0 11.2
59.1 .195 .68 0 10 59.1 .193 .68 0 10.6 63.9 .187 .73 20 21.3 68.7 .188 .78 40 32.7 78.3 .207 .81 60 37.8 86.3 .217 .84 80 52.1
16-0.44"
58 .193 .67 0 9.4 63.5 .187 .73 20 20.5 68 .187 .78 38 31.3
78.3 .207 .81 61 37.8 88 .220 .84 82 55.1
16-0.37"
63 .223 .63 0 6.2 68 .212 .715 20 13 74 .208 .77 43 25.6 79 .212 .80 60 34.4 86 .221 .82 82.5 44
63.7 .227 .63 0 5.9 69 .207 .73 20 17
75.1 .202 .80 43 34.7 83.1 .214 .82 59.6 45.6 92 .221 .84 77.2 73.3
10-0.37"
69 .249 .62 0 5.1 78.3 .237 .725 43 14.7 81.5 .230 .76 59.7 23.2 81.5 .232 .74 59.7 21.8 68 .259 .59 0 3.8
A-50
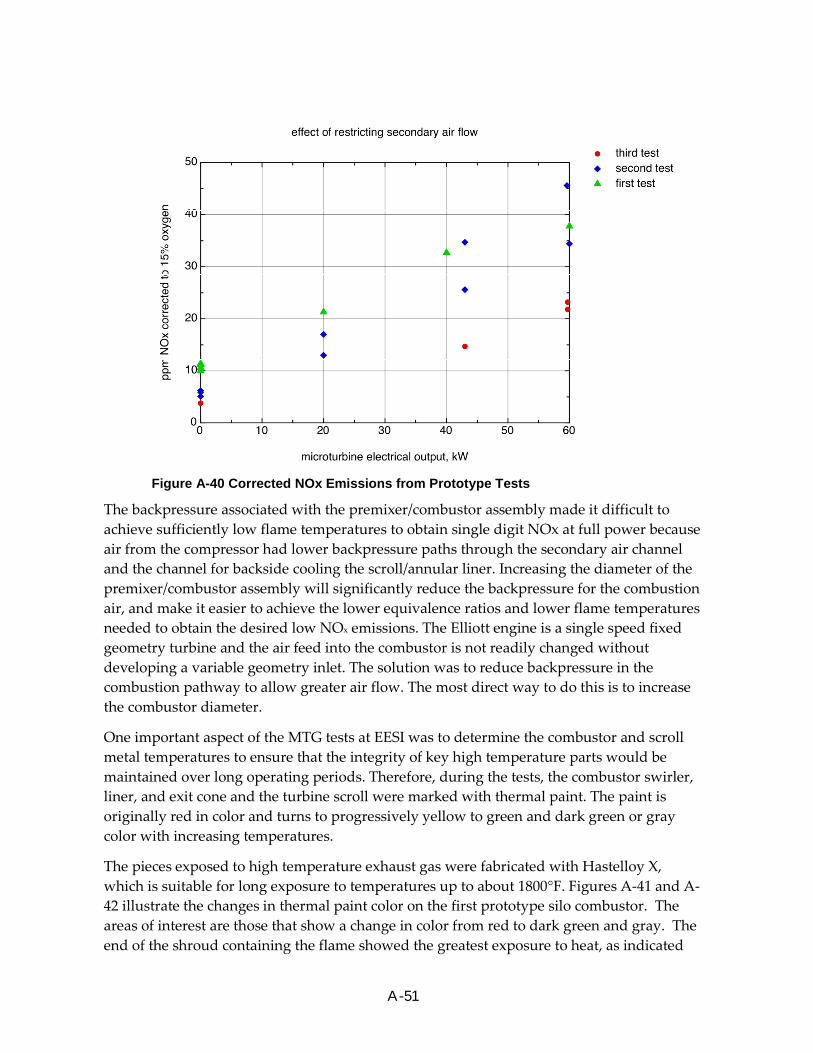
Figure A-40 Corrected NOx Emissions from Prototype Tests
The backpressure associated with the premixer/combustor assembly made it difficult to achieve sufficiently low flame temperatures to obtain single digit NOx at full power because air from the compressor had lower backpressure paths through the secondary air channel and the channel for backside cooling the scroll/annular liner. Increasing the diameter of the premixer/combustor assembly will significantly reduce the backpressure for the combustion air, and make it easier to achieve the lower equivalence ratios and lower flame temperatures needed to obtain the desired low NOx emissions. The Elliott engine is a single speed fixed geometry turbine and the air feed into the combustor is not readily changed without developing a variable geometry inlet. The solution was to reduce backpressure in the combustion pathway to allow greater air flow. The most direct way to do this is to increase the combustor diameter.
One important aspect of the MTG tests at EESI was to determine the combustor and scroll metal temperatures to ensure that the integrity of key high temperature parts would be maintained over long operating periods. Therefore, during the tests, the combustor swirler, liner, and exit cone and the turbine scroll were marked with thermal paint. The paint is originally red in color and turns to progressively yellow to green and dark green or gray color with increasing temperatures.
The pieces exposed to high temperature exhaust gas were fabricated with Hastelloy X, which is suitable for long exposure to temperatures up to about 1800°F. Figures A-41 and A-42 illustrate the changes in thermal paint color on the first prototype silo combustor. The areas of interest are those that show a change in color from red to dark green and gray. The end of the shroud containing the flame showed the greatest exposure to heat, as indicated
A-51

by the yellow, gray-green, and gray regions in Figure A-41. As indicated, peak temperatures, on the order of 1600 F were recorded from the middle to the end of the flame shroud. These paint colors indicated exposure of temperatures up to 1900°F. This was attributed to running at higher-than-anticipated equivalence ratios and flame temperatures during the testing. These temperatures were considered adequate for the high alloy steel. The cooling of this section of the shroud is expected to improve with the elimination of the bypass plate. However, the project team determined that improvement in metal temperature could readily be achieved with some redesign of the shroud, location of the ignitor, and length of the exit tube. Also, by removing the blocking plate, a more uniform cooling of the shroud and exit plate could be achieved, thus eliminating hot spots. Also, lower peak temperature is expected in the redesigned combustor as the equivalence ratio is reduced from the 0.75-0.85 range to the 0.58 range. Areas shown in yellow, which include the scroll and part of the exit surfaces of the liner and flame shroud are at very low temperatures which present no materials problems for the combustor.
Therefore, the first round of testing indicated several areas of potential improvement in the combustor design. In addition to resizing the main combustor effective area, the initial design on the ignitor system was found to take up quite a bit of space and disrupted the air flow past the shroud. The disruption of the flow of the secondary air past the shroud led to a local hot zone, illustrated by the yellowing of the metal just below it. Also the high voltage feedthrough for the ignitor is fragile and easily damaged. From discussions with the EESI engineers, it was agreed to feed the ignitor through the silo wall in a manner similar to what they use on their commercial system.
Figure A-41 Thermal Paint Detail on Combustor Shroud after Tests
The fuel feed into the premixer in the current design attaches the combustor to the end flange with three 3/8" tubes. However, the many fittings associated with the assembly created many potential leak sites. Therefore, a single feed for the main fuel and a single feed for the pilot fuel was implemented to remove some of the fittings.
A-52
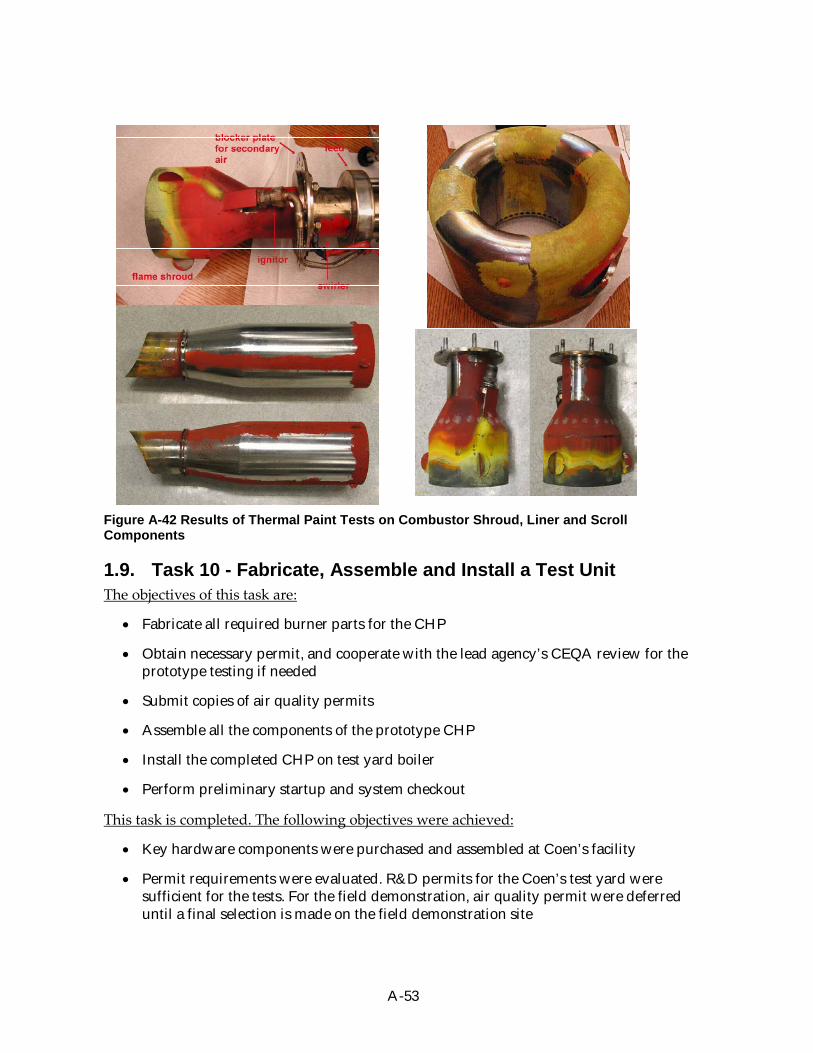
Figure A-42 Results of Thermal Paint Tests on Combustor Shroud, Liner and Scroll Components
1.9. Task 10 - Fabricate, Assemble and Install a Test Unit The objectives of this task are:
• Fabricate all required burner parts for the CHP
• Obtain necessary permit, and cooperate with the lead agency’s CEQA review for the prototype testing if needed
• Submit copies of air quality permits
• Assemble all the components of the prototype CHP
• Install the completed CHP on test yard boiler
• Perform preliminary startup and system checkout
This task is completed. The following objectives were achieved:
• Key hardware components were purchased and assembled at Coen’s facility
• Permit requirements were evaluated. R&D permits for the Coen’s test yard were sufficient for the tests. For the field demonstration, air quality permit were deferred until a final selection is made on the field demonstration site
A-53

• Equipment was assembled at Coen manufacturing plant in Woodland, California. Completion of the system awaits the shipment of the MTG and silo combustor components from EESI final tests
• Preliminary startup and performance checks were completed and supported by activities under Task 7
• A complete integrated CHP assembly was defined and assembled
Under this task, all equipment was purchased and assembled at the Coen test yard. The equipment was setup in a CHP configuration to tests the operational status and to investigate the effect of microturbine operation on emissions and operation of a Coen ULN burner. For this setup, Coen made available the test yard at the time located in Burlingame, CA. Figure A-43 is a photo of the test boiler used to configure the equipment and test fire the microturbine in a CHP configuration. The firetube boiler is rated at 45 MMBtu/hr and was equipped with the Delta-NOxTM ULN burner. The photos in Figure A-44 shows the CHP setup with the microturbine in its original cabinet located on the left and the PE unit in the forefront.
Figure A-43 Coen Firetube Test Boiler Equipped with ULN BUrner
The microturbine TEG was channeled to three radial locations to provide a more adequate distribution in the burner quarl. The photos in Figures A-45 and A-46 illustrate two of the three pipes channeling the TEG to the burner.
A-54

Figure A-44 Prototype CHP Test Setup
Figure A-45 ULN Burner Internals and TEG Channeling Pipes
The photos in Figure A-47 illustrate the power electronics (PE) cabinet purchased from EESI; the fuel gas compressor purchased from Comp-Air; and a purchased load bank to facilitate testing without interconnection to the local utility meter. The air intake was equipped with a butterfly valve that will be able to close when the MTG is not operating. This will prevent back flow of the windbox air through the MTG. Because some FGR will be used in the operation of the burner, the air inside the windbox will be vitiated and will contain some moisture from the boiler exhaust. Not allowing back flow through the MTG will also prevent condensation of the any water inside the MTG components such as turbine and combustor which could prevent ignition during MTG startup.
A-55

Figure A-46 Windbox View of Microturbine Windbox Connection Opening
Figure A-47 Power Electronics Cabinet (top left), Gas Compressor (top right), and Load Bank for Prototype Assembly and Testing
A-56

1.10. Task 11 - Develop Test Plan for Prototype Unit The objectives for this task included:
• Prepare a prototype unit test plan that includes the test matrix and test methods
Accomplishments included:
• A preliminary test plan was submitted in advance of the site selection process
The flow diagram of the entire system is schematically shown in Figure A-48. In the planned CHP configuration, the hot section of the microturbine is part of the Coen windbox assembly; only the air intake section of the microturbine assembly is located outside in order to provide fresh air to the silo combustor and to permit the independent operation of the boiler and microturbine in case one or the other needs to be down for service. In the integrated system the MTG exhaust air exits into the wind-box. In addition, the inlet air and steam burner fuel gas recirculation exhaust air are introduced into the wind-box via an inlet air fan and damper. Fuel is mixed with air and combusted in the boiler burner. The hot exhaust gas is used in a boiler to create steam.
PMG
AC
TurbineCompressor
Combustor
Fuel Control
EGT
Natural Gas Compressor
Low Pressure Natural Gas
Gas Turbine Flow Meter
kW Meter
3 Phase Inverter
kW Meter
Wind box
kW Meter
Inlet Air Fan
Boiler BurnerBoiler Fuel Flow Meter
Boiler Fuel Control
Boiler
Exhaust GasRecirculation
Exhaust
EGR ControlDamper
Boiler Exhaust Temperature, O2, CO,
NOx
Wind box Inlet Temperature
Turbine Inlet Temperature
Wind box Pressure, Temperature, O2, CO and
NOx
Ambient or Barametric Pressure
Figure A-48 Schematic of the CHP System and Test Locations
A-57

The test plan requires that the test instrumentation be of sufficient accuracy so that the maximum allowable uncertainty for measured parameters is not exceeded. The calculated uncertainty shall consider errors introduced by the sensors and any transmitters, signal conditioners, analog to digital converters and data acquisition system. Table A-18 lists specific parameter uncertainty requirements. Table A-19 shows the test matrix developed for the field testing of the final CHP prototype. The tests include measurements at various boiler loads and FGR rate to the ULN burner. The oxygen concentration in the windbox is indicative of the FGR rate from the boiler stack. Because the MTG TEG is not allowed to get mixed with fresh air in the windbox but is instead channeled directly around the burner inlet plenum, the actual FGR rates to the ULN burner are based on a combination of vitiated air from the MTG and FGR from the boiler stack. For each of the test conditions in Table A-19, the following procedures were adhered to:
• Set the natural gas inlet pressure for the MTG gas compressor to a maximum of 5 psig.
• Operate the DG product at specified electrical output, the steam burner at specified heat output and adjust the FGR to achieve the specified windbox oxygen level for not less than 15 minutes of stable operation prior to each test run.
• The data collection sample intervals shall be short enough to ensure that uncertainty limits are satisfied, but no longer than 5 seconds.
• Following verification of stabilization, record data for a duration that ensures that uncertainty limits are satisfied, but no less than 10 minutes.
• A t completion of the test run, verify that the system stability criteria specified in Table A-18 were maintained throughout the test run. If the stability criteria were not maintained, the test run must be repeated.
• Following successful completion of the test run adjust the MTG power output level, steam burner heat output or w ind box oxygen level as required in Table A-18 and repeat steps 4 and 5 until all conditions have been tested.
The level of FGR is important from the point of view that the burner needs a minimum amount of FGR to reach the very low NOx levels that are targeted in this project. The microturbine exhaust provides some of the vitiated air (air with less than 21% oxygen). When this air mixes with the blower air the oxygen level increases and the overall windbox temperature decreases. Therefore, as the burner increases in firing rate, from to 20 to 40 MMBtu/hr, the effective FGR rate to the burner decreases. Under these conditions, flue gas taken from the boiler stack will have to be recirculated in order to reach the level of FGR that is conducive to ultra low NOx levels for boiler permit. For each combination of MTG and boiler firing rate, the test includes maximum, minimum, and average oxygen contents in the windbox; where the minimum oxygen in the windbox is indicative of the maximum FGR rate needed to reach lowest NOx from the Coen Burner without incurring into any combustion instability conditions. The oxygen levels indicated in Table A-19 are only estimates and were adjusted during the tests according to the Coen burner response and NOx emission levels achieved.
A-58

Table A-18 Test Measurement Parameters and Accuracy
Parameter Units Maximum
Uncertainty Location of Instruments
MTG Power kW ±0.45% Customer electrical connection panel
FGR Blower Power kW ±1.0%
Gas Compressor Power kW ±1.0%
MTG Intake Air Temp ºC [°F] ±1.1ºC [±2ºF]
Inlet air plenum Wind box Intake Air Temp ºC [°F] ±1.1ºC [±2ºF] Steam Burner Intake Air
Temp ºC [°F] ±1.1ºC [±2ºF]
Barometric Pressure “ of Hg ±2.0% Outdoor location at test site
Wind box pressure “ of H2O ±3.0%
Exhaust Temperature ºC [°F] ±2.8ºC [±5ºF] Exhaust stack
Gas Compressor Fuel Supply Pressure
psia ±1.5% Gas compressor fuel inlet
MTG Fuel Supply Mass Flow Rate
lb/hr ±1.0%
Steam Burner Fuel Supply Mass Flow Rate
lb/hr Steam burner fuel inlet
Fuel Higher Heating Value Btu/lb ±1.0% Natural gas inlet supply line
Fuel Lower Heating Value Btu/lb ±1.0%
High-Temperature Coolant Flow Rate
gpm ±1.5%
Wind box output oxygen % TBD Wind box outlet
Wind box output CO ppm TBD
Wind box output NOx ppm TBD
Burner exhaust oxygen % TBD
Exhaust stack
Burner exhaust CO ppm TBD
Burner exhaust NOx ppm TBD
Acoustic Measurements dB ±3 dB Per ISO Std 9614 2
A-59

Table A-19 Test Matrix for Preliminary CHP
Run MTG Load (kW)
ULN Burner Load (MMBtu/ hr)
Windbox Oxygen (%)
1 Not Operating 20 21 (Max) 2 Not Operating 20 18.5 (min) 3 Not Operating 20 19 (Avg) 4 Not Operating 40 21 (Max) 5 Not Operating 40 18 (min) 6 Not Operating 40 19 (Avg) 7 Not Operating 50 21 (Max) 8 Not Operating 50 17.5 (Min) 9 Not Operating 50 18.5 (Avg) 10 No Load 20 21 (Max) 11 No Load 20 18.5 (min) 12 No Load 20 19 (Avg) 13 No Load 40 21 (Max) 14 No Load 40 18 (min) 15 No Load 40 19 (Avg) 16 No Load 50 21 (Max) 17 No Load 50 17.5 (Min) 18 No Load 50 18.5 (Avg) 19 40 20 21 (Max) 20 40 20 18.5 (min) 21 40 20 19 (Avg) 22 40 40 21 (Max) 23 40 40 18 (min) 24 40 40 19 (Avg) 25 40 50 21 (Max) 26 40 50 17.5 (Min) 27 40 50 18.5 (Avg) 28 80 20 21 (Max) 29 80 20 18.5 (min) 30 80 20 19 (Avg) 31 80 40 21 (Max) 32 80 40 18 (min) 33 80 40 19 (Avg) 34 80 50 21 (Max) 35 80 50 17.5 (Min) 36 80 50 18.5 (Avg)
A-60

1.11. Task 12 - Perform Prototype Testing The objectives of this task were:
• Conduct prototype testing of final silo combustor design
• Conduct prototype CHP testing at Coen test yard
• Monitor and record key operating conditions
• Performa all needed calculations
• Prepare a prototype test unit report
• Prepare CPR report
The accomplishments were as follows:
• A modified test unit prototype of the silo combustor was tested at EESI to improve emission performance over the first prototype according to NOx emission targets
• A CHP assembly was tested to validate equipment readiness and preliminary performance
• An evaluation of test results was completed
• CPR report was prepared and submitted
This task was utilized to complete the tests on the prototype silo combustor as well as perform preliminary CHP testing at Coen test yard.
1.11.1. Final Silo Design Testing Following a series of tests at EESI with the first prototype combustor, a new series of tests was undertaken with a revised design. The first premixed-swirler (identifiable with thermal paint) was found to have too high of equivalence ratio in the primary flame which led to higher than acceptable NOx emissions. This was due to the miscalculated effective diameter. The resulting high equivalence ratio (insufficient combustion air in the primary flame zone) was the result of too large a bypass cross-section and too small of a swirler cross-section. In fact, measured NOx levels indicated that the equivalence ratio in the flame of this initial beta version was on the order of 0.75-0.80 compared to target of 0.55 to 0.60. Although great combustion stability was observed during the tests, NOx emissions were too high for the project target. Therefore, a second swirler was fabricated following a recalculation of the bypass and primary air split necessary to achieve the target range in equivalence ratio. The larger diameter swirler allows more air flow to the flame zone and a longer shroud was designed to improve CO burnout. Additional improvements were made to the fuel feed to simplify the split between the center pilot and the premixed feed spokes with one fitting for the main fuel flow and another fitting for the pilot. The second and final combustor design has a swirler assembly that was enlarged from 2.5 to 3.0 inches in diameter to allow for more combustion air to enter the primary flame zone thus pushing the equivalence ratio
A-61

down to levels needed for sub 5 ppm NOx. Figures A-49 and A-50 compare the new combustor with its earlier version placed adjacent to the liner and silo assembly.
Figure A-49 Increased Dimension of Second Prototype Combustor with Simplified Fuel Feed
Figure A-50 End View of First (left) and Second Combustor Designs
Since the diameters of the swirler and the shroud were increased from the original prototype, the cross section of the channel for secondary air inside the liner decreased. The intent was to reduce the need for secondary air blocking plates to control the air flow split.
A-62

Blocking plates for the secondary flow path, illustrated in Figure A-51, were fabricated and the combustor was operated both with and without a blocking plate in place. A satisfactory flow split was achieved without the need for a blocking plate. Therefore, the blocking plate was removed from the final combustor design.
Figure A-51 Assembled Combustor Outside Housing
Final configuration of the split between primary and secondary air required confirmation during engine tests at EESI. The views of the combustor assembly and fuel spokes in Figure A-52 show that the fuel injection spokes are in line with the vanes of the swirler to minimize backpressure. The hole for the pilot tube appears offset because the camera was not directly over the assembly when the photograph was taken. The main fuel will flow through a single tube to the fuel distribution channel.
In summary, the following changes were incorporated into the revised combustor:
• Diameter of the swirler assembly increased to 3.0 inches
• Combustor shroud extended
• Shroud cooling holes moved downstream
• Additional positioning tabs added to shroud to improve cooling
• Ignitor repositioned for less flow interference and less heating of the tip
• Fuel feed simplified
• Liner shape modified to allow for a longer shroud
A-63

Table A-20 provides an estimate of the effective areas of the three paths for the air from the compressor, and the estimated equivalence ratio of the combustor at various load settings. The implemented changes in the diameter of the central core with much reduced bypass area indicate that the new equivalence ratio should fall in the range of 0.38 to 0.58. The equivalence ratio for the no-load condition, 0.38, is much to low to ensure successful light-off and stable combustion. Therefore, the performance of the pilot fuel at these conditions was evaluated to ensure that adequate flame stability was maintained throughout the load range on the engine.
Figure A-52 LBNL Low-Swirl Combustor Showing Premix Fuel Spokes (left) Inline with Swirler Blades (Right)
Table A-20 Revised Combustor Operating Conditions
total air, lb/sec
scroll air area, sq.
in.
sec. air area, sq.
in.
comb. air area, sq. in.
fuel flow, lb/hr
elec. power, kW
phi
1.9 1.3 1.1 1.4 58 0 0.376 1.9 1.3 1.1 1.4 67 20 0.434 1.9 1.3 1.1 1.4 74 40 0.479 1.9 1.3 1.1 1.4 82 60 0.531 1.9 1.3 1.1 1.4 89 80 0.577
Table A-21 summarizes the test results. Figures A-53 through A-56 show the key emissions and engine performance data. Tests were performed with pilot on and off and with and without a blocking plate to restrict bypass (secondary) air flow. Tests indicated that the pilot is necessary to obtain stable combustion at fuel feed rates commensurate with 50 percent capacity (40 kWe) or below. This is necessary because the equivalence ratio in the primary flame zone was too lean to provide a stable flame. Above 40 kWe, the pilot can be turned off so to minimize NOx emissions. Optimum NOx emission performance was obtained with the blocking plate in to allow greater combustion air flow to the main flame zone. With this arrangement, the NOx emissions reached a low of about 7 ppm, corrected to 15% O2. As
A-64

indicated, the effect of leaving the pilot on throughout the load range is significant for NOx emissions. Because the combustor showed acceptable combustion stability without the pilot, NOx emission of 7 ppm are representative of acceptable performance.
Table A-21 Test Cell Results - Second Prototype Combustor (March 2006)
Pilot Plate kWe NOx, ppm
CO, ppm
O2, %
CHx, %
FCV, %
fuel, pph
EGT, °C
corr NOX
corr CO
off in 40 2 1877 17.8 0.23 87 427 2.4 2227 off in 60 3 1314 17.2 0.18 90 86 496 3.4 1507 off in 80 6.4 813 16.6 0.16 94 94 545 7.1 900 off out 40 2.7 1883 17.8 0.28 75 84 417 3.2 2234 off out 60 4.4 1389 17.3 0.25 77 88 484 5.1 1602 off out 80 10.8 840 16.7 0.2 80 94 540 12.0 935 on out 0 7.1 1106 18.9 0.26 70 75 8.9 1394 on out 0 7.4 1096 18.9 0.26 82 75 322 9.3 1381 on out 20 11.2 1493 18.3 0.3 72 80 13.7 1821 on out 20 10.7 1506 18.3 0.26 76 70 376 13.1 1837 on out 40 15.3 1895 17.8 0.28 73 81 416 18.2 2249 on out 40 15.3 1877 17.8 0.21 83 430 18.2 2227 on out 60 22.7 1288 17.2 0.21 73.5 87 26.0 1477 on out 60 22.3 1297 17.3 0.17 86 502 25.7 1496 on out 80 30.3 784 16.7 0.18 77.5 95.5 33.7 873
0
5
10
15
20
25
30
35
40
0 10 20 30 40 50 60 70 80 90
Generator gross output, KWe
NO
x @
15%
O2
Pilot off - Blocking Plate in
Pilot off - Blocking Plate out
Pilot on - Blocking Plate out
Figure A-53 NOx Emissions Measured with Second Combustor Design
A-65

0
500
1000
1500
2000
2500
0 10 20 30 40 50 60 70 80 90
Generator Gross Output, kWe
CO
, cor
rect
ed to
15%
Pilot off - Blocking Plate inPilot off - Blocking Plate outPilot on - Blocking Plate out
Figure A-54 CO Emissions with Final Design Silo Combustor
0
100
200
300
400
500
600
0 10 20 30 40 50 60 70 80 90
Generator Gross Output, kWe
EGT,
C
Figure A-55 Microturbine Exhaust Temperature during Tests
A-66

16
16.5
17
17.5
18
18.5
19
19.5
0 10 20 30 40 50 60 70 80 90
Generator Gross Output, kWe
O2
in th
e Ex
hous
t, %
dry
Figure A-56 Excess O2 in Microturbine Exhaust
CO emissions were measured in the range 0f 870 to 935 ppm, corrected to 15% O2 at 80 kWe and did not show any influence with respect to pilot operation or amount of secondary air bypass. In the CHP operation, CO is expected to be oxidized to CO2 by the additional fuel burning in the Coen burner. Metal temperatures were acceptable, in fact improved compared to those observed in the first series of tests due to lower adiabatic flame temperatures with lower flame equivalence ratios. However, the thermal paint data indicated that the fuel was not sufficiently evenly distributed. Careful observation of the opening area in all the fuel spokes holes showed that this total area was much larger than the single fuel feed pipe into the manifold. This disparity allowed fuel flow into the premixed zone to favor one side of the combustor. Consequently, it was decided to reduce the diameter of all the holes on the fuel spokes so that the total area would be less than the cross-sectional area of fuel feed pipe. After these modifications to the fuel spokes and the removal of the blocking plate, the final silo combustor design underwent final performance testing.
Figure A-57 illustrates the test results of the final silo combustor design with smaller holes on the fuel spokes and no blocking plate. The engine was tested throughout the load range, with increments of 20 kWe. Emissions data are plotted as a function of corrected EGT (based on ISO conditions). With the pilot was set in the “on” position up to 50 kWe for flame stability, NOx emissions ranged between 7 and 12 ppm, corrected to 15% O2. Above 50 kWe, the pilot was shut off and the flame remained stable. With the pilot in the off position, NOx emissions ranged between 1.3 and 3.1 ppm, well within the project target of <5ppm.
A-67

Figure A-57 Test Results of Final Combustor Design
A-68

1.11.2. Prototype CHP Testing A series of tests were performed at the Coen Test Yard in Burlingame to document the Delta NOxTM burner operation with the exhaust from the unrecuperated 80 kWe microturbine. Figures A-58 to A-60 show the test setup. The microturbine was left in the original package as the objectives focused principally on the impact of the exhaust on the burner stability FGR requirements and emissions. The microturbine was fired with the original Elliott partial oxidation burner as the silo combustor development was ongoing and a prototype was not available for retrofit at the time of these tests.
As the diagrams show, the hot exhaust was from the microturbine package was ducted to the side of the Fyr-CompakTM windbox and channeled to the burner with a manifold shown in Figure A-58. The manifold was used to provide adequate distribution of the hot vitiated air around the burner quarl, a requirement specified by Coen. This feature is likely to be incorporated in the integrated CHP design. An additional duct was used to connect the windbox to the microturbine air intake filter. This was deemed necessary to prevent backflow of windbox FGR trough the microturbine. When the microturbine was firing a damper closed this flow. However, some windbox air was likely being introduced to the microturbine inlet air because the windbox was pressurized and the damper was not likely to be completely sealed. This may have introduced some FGR from the boiler to the microturbine air intake with some interesting results indicated below.
Test results are summarized in Tables A-22 and A-23. Microturbine emissions, measured in the connecting duct to the windbox, indicated NOx levels in the range of 9 to 18 ppm as measure, meaning at a dilution level of 16.1 to 16.6% dry basis. This NOx levels are lower than current microturbine levels due in part to the likely effect of the FGR from the windbox. This in an interesting result as it might apply to the future integration of the microturbine air intake within the windbox. CO emissions measured from the microturbine were in line with those of the uncontrolled Elliott engine and would not represent a concern when exhausting to the boiler as CO will be fully oxidized within the Delta NOxTM flame. The exhaust from the microturbine was measured to have a temperature in the range of 534 to 559 C. This exhaust temperature will pace a limit of boiler fan turndown as the temperature in the windbox needs to be controlled in full scale application.
Table A-23 summarizes the boiler burner emissions data with coupled microturbine operation. As shown, the NOx emissions from the boiler are affected by firing rate and level of FGR introduced to the burner windbox via combustor air blower inlet. At a maximum firing rate of 37.7 MMBtu/hr, NOx emissions were measured to be 18.2 ppm with an induced FGR rate of about 30 percent. This compares to 40 ppm with no induced FGR to the Delat NOxTM. With the boiler operating at about 11 to 16 MMBtu/hr (or 5 to 8 times the heat input to the turbine), emissions from the combined system were 11 to 33 ppm corrected to 3% O2. The turbine was emitting 6 to 18 ppm (at 15% O2)
A-69

during these tests. Higher FGR rates are required to lower emissions to boiler permit levels.
Figure A-58 Diagram of Prototype Test Setup - Side View
A-70

Figure A-59 Diagram of Test Setup - Front View
A-71

Figure A-60 Diagram of Test Setup - Side View with Boiler and Windbox
A-72

Also, these test results indicated that the microturbine NOx levels do not add significantly to the overall boiler emissions and compliance with local permit levels in the range of 9-15 ppm, corrected to 15% O2, necessitate FGT rates of more than 35%, even with the vitiated hot exhaust from the microturbine. DeltaNOxTM burner operation was deemed satisfactory as combustion remained stable and turndown was not affected. With controls imposed on the microturbine and optimization of the burner operation, the project team anticipated achieving the performance goals of the project and reach 9 ppm form the CHP system.
Table A-22 Microturbine Emissions During Prototype CHP Testing Test kW Exhaust Fuel Air Oxygen NOx CO # SP Speed Gas Control Inlet Dry
Temp EGT Valve FCV TempkW RPM °C % °C % ppm ppm
5 70 68000 510 85 22.8 16.6 16 2596 80 68000 551 85.4 25 16.1 16 2417 80 68000 559 85.7 16.1 16 2108 80 68000 555 87 16.2 18 2219 80 68000 562 87.4 16.1 18 226
10 011 5 68000 335 48.7 18.5 6 1912 80 68000 534 87.3 21 16.3 12 22013 80 68000 542 91 16.3 12 22514 80 68000 538 87.1 16.3 9 37015 80 68000 538 87.1 16.3 15 235
1.12. Task 13 - Standard Arrangement The objectives of this task were as follows:
• Evaluate test yard performance
• Recommend improvements (if needed)
• Specify new set of standard arrangements
• Finalize the drawings
• Prepare a Standard Arrangement Report, including detailed line drawings, budget scope and equipment specifications
This task is still active at the time of this CPR report. The following was accomplished:
• The project team evaluated the test results from the Task 5 configuration testing at Coen test yard
A-73

Table A-23 Boiler Operating Conditions with Unrecuperated 80 kWe CHP Arrangement and Coen DeltaNOxTM Burner
Test Radial Core Spud
Axial CO NOxAug.Air DP
Aug Air O2 O2 NOx EA Augm FG R, M M Btu/hr FG R
# Spuds G as spud 6.07 Core Stack, W B, @ 3% thru Air Indu- Total Dam prpress. P P P1 P2 dry dry O2,dry burn. -ced (com p.) psig psig psig ppm ppm "w.c. "wc % % ppm % % %
5 0 29.0 7.90 39.8 54.0 #DIV/0! #DIV/0! 0.06 0 29.0 8.10 40.4 56.2 #DIV/0! #DIV/0! 0.07 0 29.0 8.00 40.1 55.1 #DIV/0! #DIV/0! 0.08 1.25 0.13 0.60 0 18.0 4.15 1.80 3.30 16.00 18.3 16.7 31.0 29.9 18.8 44
9 2.00 0.17 1.25 0 19.0 4.40 2.20 3.30 16.20 19.3 16.7 26.2 30.2 24.5 40
10 4.65 0.30 3.20 0 18.0 9.40 5.30 3.20 16.20 18.2 16.1 25.3 30.3 37.7 46
11 1.25 0.17 0.60 29 11.0 1.90 1.70 3.70 16.70 11.4 19.1 22.8 28.0 18.912 1.25 0.17 0.60 8 21.0 2.40 2.00 5.80 16.70 24.8 34.2 22.8 33.0 18.9 39
13 1.25 0.17 0.60 4 23.0 2.40 2.00 4.30 16.10 24.8 23.0 24.4 34.3 18.9 39
14 0.71 0.10 0.25 4 28.0 1.42 1.42 3.80 16.20 29.3 19.8 25.9 31.4 13.8 32
15 0.42 0.08 0.32 2 31.0 0.90 0.90 3.60 14.80 32.0 18.5 24.9 45.6 11.7 27
15 0.42 0.08 0.32 2 31.0 1.20 1.20 4.30 15.00 33.4 23.0 26.9 44.8 11.7 27
A-74

• Design improvements were made to the cabinet that houses the MTG to include safety checks such as preventing backflow when the engine is off and the boiler is firing.
• Detailed set of drawings were prepared.
The major components of the CHP assembly include: (1) the gas compressor, (2) the power electronics cabinet, (3) the MTG cabinet, (4) the windbox and burner assembly, and (5) the burner management system (BMS). The gas compressor and power electronics cabinet components are illustrated in Figure 93.
Figure A-61 illustrates a three dimensional view of the MTG cabinet. The hot section of the microturbine (shown on the back view of Figures A-61), includes the silo combustor and exhaust side of the microturbine. This section will be internal to the windbox and will thus share the combustion air supplied by the combustion air fan. In this way, the convective heat loss from the microturbine will be fully utilized within the boiler to make steam. The air intake, or cold, section of the microturbine will be physically isolated from the turbine so that the microturbine operation can also be isolated from the boiler for maintenance and one-sided operation. The cabinet will also house a heat exchanger purchased from the automotive market. The heat exchanger will be installed in the microturbine fresh air inlet to recover about 4 percent of the waste heat that is normally lost in conventional CHP installations. The impact on the capacity of the microturbine is expected to be insignificant, especially with the revised combustor because there will be plenty of air at full load to add more fuel so that capacity is retained. The minor increase in turbine exhaust will not play a role as all the waste heat in the exhaust will be recovered in the boiler.
Figures A-62 and A-63 illustrate how the microturbine cabinet will be mounted to the side of the windbox. The fully assembled CHP system for a typical industrial boiler application is illustrated in Figure A-64, showing the key major components, including the location of the gas compressor and MTG power electronics unit. The gas compressor and power electronic cabinet for the MTG can be located at a distance from the boiler, thus providing greater flexibility in the retrofit of existing units.
1.13. Task 14 - Develop Costing The objectives of this task are:
• Develop a detailed list of components
• Develop line items costing
• Compute total CHP cost based on designed prototype
• Gather cost of conventional CHP modular systems, including installation
• Perform a common-basis cost comparison
• Detail the incremental cost of DG in prototype CHP
A-75

• Detail cost of electricity from addition of DG to conventional ULN burner
• Prepare a Costing Report
The objective of this task is to develop cost estimates for the assembly CHP package that was engineered and developed during this CEC project. One of the key premises in this development was that existing small-scale (<250 kWe) microturbine-based CHP systems currently on the market are too costly and that the investment can be reduced to achieve a reasonable and more attractive payback , thus promoting the deployment of small-scale distributed generation (DG). The experience to date has indicated that many microturbine CHP currently on the market have an equipment cost in excess of $1,500/kWe and often face an additional $1,000/kWe or more in installation cost. The savings associated with these installations are often in the $40,000 to $70,000 per year depending on the spark spread, the generating capacity of the microturbine, and other factors such as scheduled and unscheduled maintenance. Therefore, for a 100 kWe microturbine generator with low-temperature heat recovery, the simple payback typically falls between 5 to 6 years, even after existing financial incentives currently available from the Self Generation Incentives Program (SGIP) from the local utilities in California.
Table A-24 lists the estimated additional costs for integrating a 100 kWe Elliott microturbine with a Coen low-NOx burner for the CHP package. The total estimated cost of a fully-installed turnkey 100-kWe CHP assembly is $163,138 or $1,631/kWe. In the near-term, the cost can be reduced with the availability of SGIP rebates, which can reduce the total installation cost to about $830/kWe. These are considered first-time costs which are likely to be reduced with further commercial development and cost savings. For example, the costs associated with software modifications to the PE and burner control systems are likely one-time costs associated with the first installation required for commercial demonstration. Furthermore, equipment supplied by Elliott will likely be lower as the new silo combustor becomes a standard commercial product.
Table A-25 summarizes the estimated cost for the operation of the microturbine in the integrated CHP system. The key costs are principally for the natural gas for the microturbine and scheduled maintenance associated with the operation of the microturbine. These costs, together with the installed cost estimates are used to calculate the anticipated simple payback for the self generation option added to the installation of a new Coen low-NOx burner. The fuel cost for the microturbine is credited for the reduction in fuel to the boiler that results from the recovery of the waste heat from the microturbine exhaust and form the other conventional convective heat losses that are recovered in the CHP design. Calculations indicate that the simple payback will be about 2.3 years without accounting for SGIP credit of $1.16 years with the SGIP credit. These paybacks are considered attractive to industry in general for new investments and therefore supportive of increased utilization of distributed self generation at industrial/commercial plants.
A-76

Figure A-61 Microturbine Cabinet Design
A-77

Figure A-62 Prototype Burner with Microturbine Assembly (Left: Front View; Right: Section A-A)
A-78

Figure A-63 Prototype Burner with Microturbine Assembly - Side View
Figure A-64 Boiler Installation Equipment Arrangement
Microturbine cabinet
Gas compressor
Power electronics
Windbox
Boiler FGR duct
Burner BMS
A-79

Figure A-65 illustrates how the simple payback changes with the cost of electricity. This information can be used to evaluate site-specific paybacks with a combination of peak and off-peak electricity rates. Some peak rates at industrial plants can reach $0.20/kWhr
Table A-24 Cost Estimate for 1-- kWe Microturbine Installation
Item Price (2007 dollars) $/kWe
Elliott supplied equipment:
Includes: TA 100 Simple-cycle microturbine engine with modified housing; low-NOx silo combustor and valves; power electronics (PE) with dual mode; gas compressor; oil system, filters and valves; electrical cables (PE to engine and PE to meter); and startup battery
105,000 $1,050
Elliott supplied parts:
Includes: Recommended spare parts; coolant oil; batteries, silo related software upgrade
$12,677 $127
Elliott field support:
Field test engineer for startup
$9,761 $98
Coen supplied equipment:
Includes: Air filter and silencer; microturbine compartment and components; sound insulation; turbine exhaust distribution manifold; additional burner controls
$20,700 $207
Coen site support and installation:
Includes: Custom engineering; microturbine package installation
$15,000 $150
Total installed CHP cost $163,138 $1,630
SGIP Rebate ($80,000) ($800)
Net cost to the user $83,138 $831
A-80

Table A-25 Cost and Payback for CHP System
Item Consumption Cost and payback
Natural gas for the microturbine
2.35 MMBtu/hr $159,470/yr
Scheduled maintenance $0.004/kWhr $3,480/yr
Total microturbine operating cost
$162,950/yr
Boiler heat recovery credit 1.97 MMBtu/hr ($134,750)/yr
Net operating cost $24,720/yr
Net power purchase savings 92 kWe ($96,050)/yr
Net plant savings $71,330/yr
Simple payback w/o SGIP credit
2.28 years
Simple payback w/ SGIP credit 1.16 years
Operating factor = 8,700 hrs/yr; Electricity cost = $0.12/kWh; Natural gas cost = $7.80/MMBtu
0
1
2
3
4
5
6
0.08 0.1 0.12 0.14
Cost of electricity $/kWh
Sim
ple
Payb
ack,
yea
rs
Without SGIP rebateWith SGIP rebate
Figure A-65 Simple Payback Versus Cost of Electricity
A-81

A-82

1.14. Task 15 - Secure Field Host Site The objectives of this task were as follows:
• Visit and propose a demonstration test at a facility
• Negotiate cost of retrofit and future equipment disposition
• Enter into an agreement w ith selected site owners
• Obtain necessary site permits
• Submit copy of air quality permits
• Investigate grid hookup requirements, if any
• Draft and execute applicable contracts and indemnification agreements
• Report all activities on a monthly basis
After evaluation of more than 10 potential candidates, the project selected the Hitachi GST plant (formerly IBM) in San Jose, California for its field demonstration of the integrated CHP system that combines a simple cycle microturbine with an industrial boiler low-NOx burner. The Hitachi plant operates six boilers at their steam plant used to provide heat for all the buildings at the site.
The plant selected Unit 3 for the retrofit demonstration. The packaged Cleaver Brooks Model D-60 watertube boiler has a nameplate steam capacity of 32,000 lb/hr at a pressure of 95 psig, corresponding to a design heat input of about 40 MMBtu/hr at full load. However, the boiler is was derated to 28,000 lb/hr. Figures A-66 illustrates the front and side views of a typical packaged, single burner, D-type watertube boiler. Figure A-67 shows the boiler nameplate. The boiler was permitted to operate at 30 ppm NOx dry corrected to 3% O2 by the Bay Area Air Quality Management District. Compliance was achieved with a 30-ppm low NOx burner supplied by Coen Company. The photographs in Figures A-68 and A-69 show front views of the pre-retrofit burner-windbox assembly. The burner has dual fuel capability with distillate fuel used strictly as a backup during natural gas curtailments.
The pre-retrofit burner utilized an external flue gas recirculation duct, illustrated in Figure A-70. Because of the retrofit rules, the BAAQMD has required that overall NOx emissions from the boiler must be reduced to 15 ppm (50% reduction from pre-retrofit levels), including any amount contributed by the microturbine. Therefore, Coen Company has selected the retrofit of a modern dual-fueled QLNTM 15-ppm burner which typically requires FGR rate of about 10% (about 5% premixed and another 5% selective) in order to achieve NOx permit levels. The premixed FGR will be introduced in the combustion fan intake, whereas the selective FGR requires an external FGR duct for injection of flue gas in targeted areas of the burner. This allows for the reuse of the windbox, combustion air blower, existing external FGR fan, existing distillate oil piping, and partial FGR ductwork. Therefore, the major hardware replacement focused on the burner and ancillary modification to the windbox to adapt the integration of the microturbine.
A-83

Figure A-66 Conventional Watertube Boiler Configuration
Figure A-67 Unit 3 Boiler Nameplate
A-84

Figure A-68. Pre-Retrofit Burner Setup on Unit 3
Figure A-69 View of Unit 3 Pre-Retrofit Windbox and BMS
A-85

Figure A-70 Side Views of Pre-retrofit Burner and FGR Duct
As part of the retrofit analysis, the project evaluated the economic benefits of the CHP installation on the selected boiler. Table A-26 summarizes the savings, which account for about $40,000 to $48,000 per year and are influenced by the cost of natural gas and electricity (spark spread)
1.15. Task 16 - Fabricate, Install, and Checkout Field Test Unit The objectives of this task are:
• Fabricate and modify hardware to site specific conditions of selected field host site
• Ship equipment to the site
• Remove old burner and install new burner CHP assembly
• Hookup power to local utility voltage panel
• Perform preliminary startup and checkout
During this task, complete construction and installation drawings were completed. Fabrication of burner and burner interface were accomplished by Coen at the J. Zink facility in Tulsa. Finally, the site was modified and the retrofit was accomplished. The retrofit included the commissioning of the microturbine and burner to demonstrate operational readiness and establish startup, operation, and shutdown procedures.
A-86

Table A-26 Estimate of Cost Savings for Host Site
Cost Element Units Estimate 1
Estimate 2
Notes
Price of natural gas $/ 1000scft 9.0 8.8 Volatile prices
Price of electricity $/ kWhr 0.105 0.120 Electricity price tied to fuel cost and time of use
Gross generating capacity
kWe 80 80
Net Generating capacity
kWe 75 75
Reduction in electricity purchases
kWh 75 75
Savings in electricity purchases
$/ hr 7.875 9.000 Will vary with time of use
Savings in electricity purchases
$/ yr 63,000 72,000 Estimate of 8,000 hrs/ yr operation
Fuel used by microturbine
scfm 34.2 34.2
Cost of microturbine fuel
$/ hr 18.5 18 Most of this fuel is used by the boiler
Cost of microturbine $/ yr 147,000 144,320 Estimate of 8,000 hrs/ yr operation
Reduction in fuel use in boiler
scfm 28.7 28.7
Reduction of cost of fuel in the boiler
$/ hr 123,984 121,229 Estimate 8,000 hrs/ yr operation
Net increase in fuel gas
scfm 5.5 5.5
Net increase in fuel cost for CHP
$/ hr 3.0 2.9
Net increase in fuel cost for CHP
$/ yr 23,616 23,091
Net plant savings with CHP
$/ yr 39,384 48,909 Electricity savings-boiler fuel reduction+MTG fuel
Figure A-71 is a photo of the QLNTM burner installed in the windbox. The bustle that was used to channel the simple cycle microturbine TEG to the premix gas spuds in the burner is visible in the foreground. The bustle was insulated with a thermal blanket to prevent excessive increase in windbox temperature. Figure A-72 provides a view of the QLNTM burner from the boiler rear view port. The locations of the six premix gas spud assemblies are visible. The hot TEG is exhausted through the six premix slots. The high temperature of the TEG provides flame stability and the vitiated air provides an FGR level of about 5% at full firing rate, higher at lower loads. In its final configuration, all the metal surfaces exposed to the hot boiler furnace are covered with refractory tiles.
A-87

Figure A-71 View of QLNTM Burner with Microturbine Bustle
Figure A-72 View of QLN Burner from Boiler Furnace
A-88

Photographs in Figures A-73 and A-74 are photographs of the completed installation. Figure A-73 shows the microturbine cabinet attached to the windbox in its final integrated configuration. Figure A-74 shows the front view of the fully retrofit boiler with BMS in the foreground and microturbine in the rear. The gas compressor and PE cabinet were located alongside the boiler in close proximity to the microturbine. The power was connected to one available spare panel on one of Hitachi’s electrical substations.
Figure A-73 Installed Microturbine Cabinet
Figure A-74 View of Completed Retrofit
A-89

A-90

1.16. Task 17 – Develop Field Test Plan The objectives of this task were to:
• Prepare a field test plan for the field demonstration at H itachi Global Storage Technologies, Inc. in San Jose, California
The goal of this task was to prepare a test plan for the validation of the performance of the CHP burner/windbox assembly at the Hitachi site in San Jose, CA. The test matrix addresses all the performance specifications and measurements of efficiency, heat loss, emissions, turndown, FGR requirements, and auxiliary power needs. This test plan is based on the emission requirements of the Air Quality Permit and the Association of State Energy Research and Technology Transfer Institutions (ASERTTI) Distributed Generation and Combined Heat and Power Field Testing Protocol
The Administrator at the BAAQMD established the emissions performance requirements under the issued operating permit. The CHP efficiency target was established under this project. Table A-27 summarizes the emissions and performance objectives for the retrofit at Hitachi. Details of the BAAQMD permit are shown in Table A-28. As indicated, NOx emissions are limited to 15 ppm dry basis corrected to 3% O2 .This level represent a 50% reduction in NOx from the existing permitted level for boiler No. 3 at Hitachi. CO emissions are limited to 50 ppm dry basis corrected to 3% O2. These levels are to be attained when both the microturbine and boiler are firing at full load design capacity. As indicated earlier, the CHP operation was designed to operate with the microturbine generating power only when the boiler is firing. This requirement is necessary in order to ensure adequate burnout of CO emissions leaving the microturbine.
Table A-27 Summary of Emissions and Performance Measurements
Emissions and Performance Measurement
Microturbine Performance
Objective
CHP Performance Objective
Key sample requirements
NOx CARB 2007 limits of 0.07 lb/ MWh in CHP mode
< 15 ppm @3% O2 Continuous emission monitors taking gas samples at the boiler stack, w ith and without the microturbine firing
CO CARB 2007 limits of 0.10 lb/ MWh in CHP mode
<50 ppm @3%O2 Continuous emission monitors taking gas samples at the boiler stack, w ith the microturbine firing
Efficiency NA >80% or approaching the efficiency of the boiler
Boiler feedwater and steam flows Boiler fuel use and flue gas flows and temperature Microturbine fuel use and compressor power use and generator power output
A-91

The following subsections present the details of the test plan.
Table A-28 Summary of BAAQMD Air Permit for Host Site
1. Microturbine Operation Owner/ operator shall not operate microturbine unless boiler is fired by the Coen ULN burner, except during source testing
2. Emissions Limits Owner/ Operator shall not operate microturbine and boiler unless the combined emissions from the microturbine and boiler do not exceed the following concentrations:
• NOx = 15 ppm @ 3% O2 • CO = 50 ppm @ 3% O2
3. Visible Particulate Emissions Visible particulate emissions from combined firing shall not exceed Ringelman 1
4. Source Testing Within 120 days of startup, the owner/ operator shall conduct the following tests:
• Combine emissions from microturbine and boiler to determine compliance with item 2
• Measurement of NOx and CO emissions from boiler only
• Measurement of NOx and CO emissions from microturbine only
5. Test Methods A ll test methods shall be pre-approved by the District’s Technical Division 7 days prior to the commencement of the tests
6. Reporting Owner/ Operator shall submit to the Manager of the District’s Source Test Section a complete test report w ithin 30 days of completion of tests
7. Compliance Enforcement Owner/ Operator shall conduct a District’s approved source tests annually for the combined emissions to determine compliance with item 2
A-92

1.16.1. CHP System Description The CHP equipment assembly incorporates the following major equipment:
• Elliott Simple Cycle 80 kWe Microturbine Generator
• Coen Industrial QLNTM Burner/ Wind-box Assembly
• A irCompacTM Natural Gas Compressor
• Watertube Packaged Boiler
The hot and colds sections of the microturbine are separated by a dividing plate which permits the hot section to be in contact with the windbox for maximum heat recovery of microturbine waste heat. The air intake to the microturbine can be isolated with an actuator-driven flapper valve to prevent windbox air from escaping into the boiler room through the microturbine. One important feature of this configuration is the turbine exhaust manifold located inside the windbox. The function of the manifold is to channel hot microturbine exhaust directly to the burner inlet. This prevents direct mixing with burner air in the windbox and thus maintains a lower windbox temperature.
Figure A-75 is a flow schematic of the CHP system. The entire system has only one exhaust point, the boiler stack. All emissions from the microturbine and boiler exhaust through this point. A portion of the flue gas from the boiler stack is recirculated to the windbox via the combustion air blower. The quantity of FGR is determined by the firing rate of the boiler and the NOx emission targets and is preprogrammed in the Coen BMS.
Figure A-76 illustrates the system boundary that defines the CHP assembly consisting of the boiler and microturbine. From this figure, the system inputs are:
• Fuel used by the Coen low NOx burner
• Fuel used by the microturbine
• A ir intake by the boiler blower
• A ir intake by the microturbine
• Power use by the microturbine gas compressor
• Power used by the boiler air blower
• Boiler feedwater
The system outputs are:
• Microturbine generator gross power
• Stack flue gas
• Boiler steam generation
A-93

All energy and mass flows into and out of the CHP are defined by this system boundary and form the basis for all emissions and efficiency performance calculations.
PMG
AC
TurbineCompressor
Combustor
Fuel Control
EGT
Natural Gas Compressor
Low Pressure Natural Gas
Gas Turbine Flow Meter
kW Meter
3 Phase Inverter
kW Meter
Wind box
kW Meter
Inlet Air Fan
Boiler BurnerBoiler Fuel Flow Meter
Boiler Fuel Control
Boiler
Exhaust GasRecirculation
Exhaust
EGR ControlDamper
Boiler Exhaust Temperature, O2, CO,
NOx
Wind box Inlet Temperature
Turbine Inlet Temperature
Wind box Pressure, Temperature, O2, CO and
NOx
Ambient or Barametric Pressure
Figure A-75 Schematic of Field CHP System
Figure A-76 CHP System Boundaries for Testing
FGR duct
Compressor power
Generator kW
Stack gas Power to blower
Combustion air to turbine
Fuel to
Boiler
Stack
Blower
Gas
Fuel to boiler
Microturbin
Combustion air to
Feedwater Steam
A-94

The excess oxygen in the windbox is indicative of the amount of flue gas recirculated from the stack to the windbox. Figure A-77 illustrates the use of windbox O2 as a surrogate for FGR rate from the boiler stack. When the microturbine is firing, however, the actual FGR rate that the burner sees is higher than the FGR shown in Figure A-77. This is because the microturbine exhaust is channeled through the manifold into the burner quarl and is therefore not mixed within the windbox. However, because the microturbine is a constant volume machine, the amount of microturbine exhaust is easily determined by the electrical generation. For a given air compressor inlet temperature, the electrical generation is also an accurate measure of the amount of natural gas burned within the silo combustor of the microturbine.
y = 49.377x225.481x + 3.2273 -
0.0%
10.0%
20.0%
30.0%
40.0%
50.0%
60.0%
10.0% 12.0% 14.0% 16.0% 18.0% 20.0% 22.0%
O2 in boiler w indbox
FGR
Rat
e
Figure A-77 Windbox O2 as a Function of FGR Rate
1.16.2. Test Matrix The objectives of the field tests for the demonstration of a novel integrated CHP system consist of:
• Document efficiency of the CHP system
• Document the overall emissions to meet compliance with air permit and CARB 2007 limits
• Document the operational flexibility and reliability of the system
The first objective requires that all energy input and output streams be measured to the boiler and the simple cycle microturbine. Energy input streams are defined by the fuel intake, the feedwater, and power consumption of the boiler air blower and gas compressor. Energy output streams are defined by useful energy, (i.e., steam from the boiler and microturbine gross power), and waste heat leaving with the boiler flue gas. For the microturbine, the useful energy is in the form of electrical power (kWe) output in alternating current of 480 volts and 60 Amps. Energy efficiency for the CHP system is calculated based on ASME Power Test Code PTC 4.1 using either the heat output/heat input or by quantifying heat losses. For the CHP system, the heat
A-95

input is defined as the total fuel intake of the boiler and microturbine. The output is then the steam generation of the boiler plus the electrical generation of the microturbine. In mathematical terms, the CHP efficiency (ε) will be defined as follows:
( )
MTGboilerfuel
MTGFeedwatersteam
in
outQQ
HHHQQ
CHP ++−==ε
Where Hsteam is the enthalpy of the steam, Hfeedwater is the enthalpy of the feedwater to the boiler, HMTG is the energy output of the microturbine (3,412*kWe), Qboilerfuel is the heat from fuel burned in the boiler, and QMTG is the heat from fuel burned by the microturbine.
Energy losses parasitic loads from the CHP system include:
• Latent and sensible heat losses from the boiler stack
• Radiative losses of the boiler (defined by ASME PTC 4.1)
• Gas compressor power requirements
• Power electronics losses
• Radiative losses from microturbine enclosure
The power conversion efficiency of the microturbine generator is reported both as gross and net. Net power conversion efficiency accounts for parasitic losses due principally to the required compression of natural gas and energy losses in the power electronics. Therefore,
MTG
MTGgrossPC Q
H=−ε
MTGnetPC Q
kWpekWckWe 3412)( ∗−−=−ε
Where kWc is the compression power and kWpe is the energy losses in the power electronics to convert generator output to 480 volts 60Hz.
Emissions are generated from the microturbine silo combustor and from the Coen low-NOx burner. All emissions are exhausted through the boiler stack. When burning natural gas, only NOx and CO emissions are typically generated in measurable quantities. NOx emissions in the stack are likely the sum of NOx formed in the silo combustor of the microturbine and NOx formed in the Coen burner. This is because little or no reduction in NOx from the microturbine is anticipated when the microturbine exhaust enters the burner flame. Table A-29 illustrates the additive effect of microturbine NOx on boiler NOx emissions. The shaded cells indicate the emission limits for the boiler and microturbine necessary to meet ARB 2007 emission
A-96
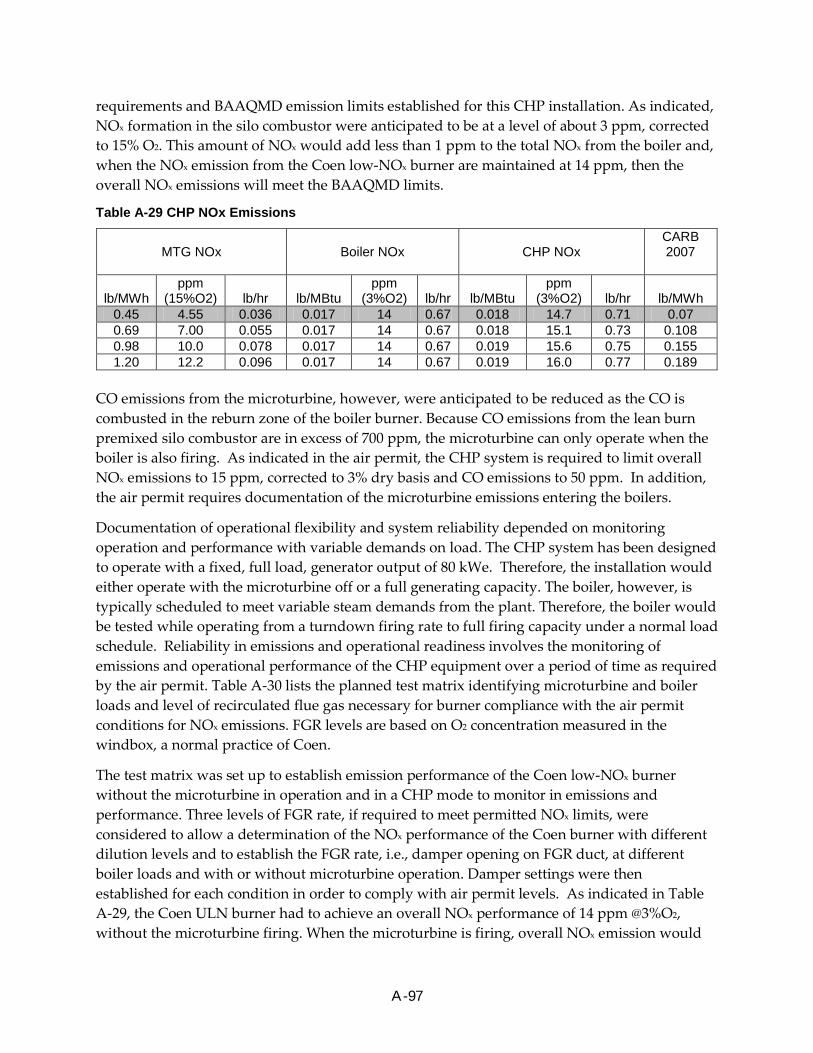
requirements and BAAQMD emission limits established for this CHP installation. As indicated, NOx formation in the silo combustor were anticipated to be at a level of about 3 ppm, corrected to 15% O2. This amount of NOx would add less than 1 ppm to the total NOx from the boiler and, when the NOx emission from the Coen low-NOx burner are maintained at 14 ppm, then the overall NOx emissions will meet the BAAQMD limits.
Table A-29 CHP NOx Emissions
MTG NOx
Boiler NOx
CHP NOx
CARB 2007
lb/MWh ppm
(15%O2) lb/hr lb/MBtu ppm
(3%O2) lb/hr lb/MBtu ppm
(3%O2) lb/hr lb/MWh 0.45 4.55 0.036 0.017 14 0.67 0.018 14.7 0.71 0.07 0.69 7.00 0.055 0.017 14 0.67 0.018 15.1 0.73 0.108 0.98 10.0 0.078 0.017 14 0.67 0.019 15.6 0.75 0.155 1.20 12.2 0.096 0.017 14 0.67 0.019 16.0 0.77 0.189
CO emissions from the microturbine, however, were anticipated to be reduced as the CO is combusted in the reburn zone of the boiler burner. Because CO emissions from the lean burn premixed silo combustor are in excess of 700 ppm, the microturbine can only operate when the boiler is also firing. As indicated in the air permit, the CHP system is required to limit overall NOx emissions to 15 ppm, corrected to 3% dry basis and CO emissions to 50 ppm. In addition, the air permit requires documentation of the microturbine emissions entering the boilers.
Documentation of operational flexibility and system reliability depended on monitoring operation and performance with variable demands on load. The CHP system has been designed to operate with a fixed, full load, generator output of 80 kWe. Therefore, the installation would either operate with the microturbine off or a full generating capacity. The boiler, however, is typically scheduled to meet variable steam demands from the plant. Therefore, the boiler would be tested while operating from a turndown firing rate to full firing capacity under a normal load schedule. Reliability in emissions and operational readiness involves the monitoring of emissions and operational performance of the CHP equipment over a period of time as required by the air permit. Table A-30 lists the planned test matrix identifying microturbine and boiler loads and level of recirculated flue gas necessary for burner compliance with the air permit conditions for NOx emissions. FGR levels are based on O2 concentration measured in the windbox, a normal practice of Coen.
The test matrix was set up to establish emission performance of the Coen low-NOx burner without the microturbine in operation and in a CHP mode to monitor in emissions and performance. Three levels of FGR rate, if required to meet permitted NOx limits, were considered to allow a determination of the NOx performance of the Coen burner with different dilution levels and to establish the FGR rate, i.e., damper opening on FGR duct, at different boiler loads and with or without microturbine operation. Damper settings were then established for each condition in order to comply with air permit levels. As indicated in Table A-29, the Coen ULN burner had to achieve an overall NOx performance of 14 ppm @3%O2, without the microturbine firing. When the microturbine is firing, overall NOx emission would
A-97

need to be maintained below 15 ppm in order to meet the District 15-ppm limit in CHP mode and also comply with the ARB 2007 emission requirements of 0.07 lb/MWhr. This necessitated that the microturbine low NOx silo combustor, developed under this project, have a NOx performance of less than 5 ppm, corrected to 15% O2.
Table A-30 Test Matrix
Run MTG Load (kW)
ULN Burner Load (MMBtu/hr)
External FGR (%)
1 Not Operating 10 As needed to meet permit NOx level 2 Not Operating 15
3 Not Operating 20 4 Not Operating 25 5 Not Operating Max 6 80 10 As needed to meet permit
NOx level 11 80 15 12 80 20 13 80 25 14 80 Max
1.16.3. Measurements and Calculations Table A-31 lists the measurements planned for each of the performance tests of Table A-30. The plant’s fuel gas totalizer will be used to measure the gas flowrate to the CHP system, i.e., gas flow to the compressor inlet for the microturbine and to the low-NOx burner for the boiler. Feedwater and steam conditions, pressure and flowrate, measured in the boiler control room and steam gauges on the boiler itself, will be used to establish the heat recovery in the boiler. Power generation from the microturbine will be recorded by the power electronics cabinet. Boiler stack measurements will be used to determine the emissions and thermal losses from the boiler. Emissions measurements with and without the microturbine on will be used to quantify the incremental NOx emissions produced by the microturbine at various boiler loads. FGR rates, if necessary, would be measured by the oxygen concentration in the windbox and would be used to establish the FGR that is required to meet air permit conditions.
These data would then be used to quantify the efficiency of the boiler, microturbine and CHP system as well as compliance with permitted emission levels. Three sets of measurements were taken at each test condition at a frequency no less than ½ hr after operating conditions were stabilized. Steady state test conditions are based on the measurements not deviating more than levels identified in Section 7.16.4.
1.16.4. Instrumentation The performance and emissions measurements relied on a combination of available plant instrumentation and test crew instrumentation. For example, all boiler operating data such as windbox conditions, fuel flow, feedwater and steam flowrates were monitored using control room monitors and plant pressure gauges and fuel flow meters. Additional instrumentation were supplemented to monitor stack temperature, windbox temperature, and windbox oxygen. The rate of FGR to the windbox, if needed, was calculated based on windbox O2 levels. Continuous emission monitors were used to measure NOx and CO concentrations in the boiler
A-98

stack as required by air permit conditions stipulating NOx limit of 15 ppm and CO limit of 50 ppm, corrected to 3% excess O2. Data were collected by the test crew for each test condition listed in Table A-30 after sufficient time passed to document the steady state operation of the microturbine and boiler. Steady state conditions were determined by monitoring the variability of the measurement over a period of ½ hr after operating conditions have been set. Table A-32 lists the acceptable variability in measurement required to establish steady state conditions. Data was recorded by the test crew.
Table A-31 List of Performance Measurements and Data Sheets
Date Time Run # Variable Units Location Value Ambient Conditions
Barometric Pressure in of Hg Ambient press gauge W/B Air Inlet Temperature F Wet/Dry bulb gauge
Gas Compressor
Inlet Gas Pressure psig Pressure gauge Outlet Gas Pressure psig Pressure gauge Power Consumption kW Gas HHV BTU/ft**3 PG&E gas data Gas LHV BTU/ft**3 PG&E gas data
Boiler and Burner
Steam flow lb/hr Boiler control room Steam pressure psig Boiler control room Feedwater pressure psig Boiler control room Fuel gas flowrate scfm Plant fuel pipe Fuel pressure psig Plant fuel pipe
MTG Inlet Temperature F Air filter inlet Power Output kW Power Electronics Fuel Flow scfm Plant fuel line
Wind Box W/B FGR Inlet Temperature F Boiler stack W/B Outlet Pressure in of water Boiler Controls Oxygen Level % Gas monitor
CHP Emissions
Exhaust Temperature F Boiler stack Oxygen Level % Boiler stack NOx Level ppm Boiler stack CO Level ppm Boiler stack
1.16.5. Data Analysis and Reporting The principal objectives of the data analysis are to: (1) calculate the emissions from the boiler and microturbine; (2) calculate the overall efficiency of the CHP package; and (3) document the operational flexibility and reliability of the system.
Table A-33 lists the format for emissions data from the boiler stack that was collected using portable continuous emission monitoring instrumentation. NOx and CO emissions, as measured at stack O2 levels, were corrected to O2 concentration of 3%, standard for boilers. The emissions were also reported based on heat input. Compliance with ARB 2007 CHP emission
A-99

requirements were based on differential in NOx emissions measured with and without the boiler firing. These emission levels were then converted to reportable lb/MWhr to validate compliance with the ARB 2007 DG emission requirements using the approved protocol for calculating CHP credits.
Table A-32 Acceptable Measurement Variability for Steady State Operation
Parameter Units Variability Instrumentation
MTG Power kW ±0.45% Power electronics panel
MTG Intake A ir Temp ºC [°F] ±1.1ºC [±2ºF] Wet and dry gas bulb
Wind box Intake A ir Temp ºC [°F] ±1.1ºC [±2ºF]
Barometric Pressure “ of Hg ±2.0% Local weather data
Wind box pressure “ of H2O ±3.0% Pressure gauge on w indbox
Feedwater pressure psig ±2.0% Line pressure gauge
Steam pressure psig ±2.0% Steam drum readout in control room
Steam flowrate lb/ hr ±2.0% Steam chart in control room
Stack Temperature ºC [°F] ±2.8ºC [±5ºF] Exhaust stack
Gas Compressor Fuel Supply Pressure psia ±1.5%
Gas line inlet pressure gauge MTG Fuel Supply Mass Flow Rate scfm ±1.0%
Boiler Burner Fuel Supply Mass Flow Rate scfm ±0.5% Inline fuel totalizer
Windbox oxygen % ±0.2% Gas sample drawn from windbox and read w ith portable O2 analyzer
Stack oxygen concentration % ±0.2% Cold gas sample drawn from stack and read with continuous emissions monitors Stack CO emissions ppm ±0.5 ppm
Stack NOx emissions ppm ±0.5 ppm
Acoustic Measurements dB ±3 dB Per ISO Std 9614 2
A-100

Table A-33 Continuous Emissions Data Recording
Boiler load
MMBtu/ hr
Boiler FGR,
%
Microturbine kW
O2
Dry %
NOx
ppm
CO
ppm 10 5 0
10 10 0
10 (max) 0
20 5 0
20 10 0
10 (max) 0
28 (max) 5 0
28 (max) 10 0
28 (max) (max) 0
10 5 80
10 10 80
10 (max) 80
20 5 80
20 10 80
10 (max) 80
28 (max) 5 80
28 (max) 10 80
28 (max) (max) 80
The following equations will be used for these evaluations:
Boiler NOx and CO corrected to standard 3% O2:
2%212%3 ONOx
NOx asmeasuredO −
=
02%212%3 −= asmeasured
OCO
CO
Conversion to lb/MBtu for stack emissions:
A-101

610xHVMn
MMBtulb A
A= where,
nA=ppm as measured (NOx or CO) x nFGx 10-6, and
)2(%762.419405.0762.4
Oxxnxn
n HCFG −
+= = moles of dry flue gas per lb of fuel
NOx Emissions from Microturbine in lb/MBtu
)()mod()( boileronlyMMBtu
lbeCHPMMBtu
lbnemicroturbiMMBtu
lb−=
Conversion of Microturbine NOx to lb/MWh
10003412/80
)( xWH
FFxnemicroturbiMMBtu
lbMWh
lb+
= ,where
FF=fuel flow in MMBtu/ hr used by the microturbine, and WH = the waste heat in the microturbine exhaust, Btu/ hr
Boiler Efficiency by heat output/heat input method ASME PTC 4.1:
Boiler
FWsB FF
HH −=ε , where
H s= enthalpy of the steam (Btu/ hr), H FW – enthalpy of the feedwater (Btu/ hr), and
FFBoiler = boiler fuel use (Btu/ hr)
Boiler Efficiency by heat loss method ASME PTC 4.1:
1)( −∗−−−= BRLHSHBB FFHHHFFε , where
HSH is the sensible heat loss in the stack; HLH is the latent heat loss in the stack; and HR is the radiation losses from the boiler
A-102

CHP Efficiency: ( )
BMTG
FWsnetBCHP FFFF
HHkW+
−+∗=
3412εε , where
kWnet= is the net microturbine generator output (minus gas compressor power), and FFMTG – fuel used by the microturbine (Btu/hr)
Net Power Conversion Efficiency
MTG
netPC FF
kW 3412∗=ε
Figure A-78 illustrates a sample of the emission reporting format which shows the NOx emissions and efficiency of the CHP system over the load range of the boiler. Peak efficiency and NOx emission performance is anticipated to be at full boiler load, as the stack losses from the boiler are the lowest at design firing rate.
0
2
4
6
8
10
12
14
16
18
20
22
24
0 5 10 15 20 25 30 35 40 45
Boiler load, MBtu/hr
CHP NOx emissions,ppm@3%O2CHP efficiency x 10
Figure A-78 Sample of Emissions and CHP Efficiency Reporting Format
A-103

1.17. Task 18 – Perform Field Testing A total of 15 tests were performed at Hitachi to determine emissions and energy efficiency performance. Table A-34 is a view of the data collected for each of these tests. Test 1 was performed with the MTG firing at capacity (with pilot flame in the off position) and the boiler offline to determine the NOx and CO emissions contributed form the MTG. Only the air combustion air blower was activated on the boiler as this is required in the permissive logic for operation of the MTG. As indicated, NOx emissions were measured at 3 ppm, dry corrected to 15% O2, whereas CO was high as anticipated. Burnout of the MTG CO emissions required that the boiler burner is firing whenever the MTG is operating. This was followed by a series of four tests with the boiler only on line and 10 tests in the CHP mode with both boiler and microturbine firing. Several boiler firing rates were tested to monitor emission compliance with and without microturbine in accordance with BAAQMD air permit limits. The following subsections summarize the results on emissions and efficiency.
1.17.1. Emissions Data Table A-35 indicates that NOx emissions were consistently lower than the permitted 15 ppm BAAQMD limits imposed for this installation with either the boiler only firing or in the CHP configuration. These NOx emissions were achieved without any external FGR from the boiler stack thanks to the design capability of the Coen QLNTM burner. Operating the microturbine did not increase NOx emission significantly as illustrated in Figure A-79. Also, CO emissions in the TEG were readily burned out and maintained well below the BAAQMD 50 ppm rule.
Table A-34 Summary of Emissions
Equipment QLN Heat Input MMBtu/ hr
MTG kW
NOx, dry ppm@3% O2
CO, dry @3% O2
Boiler Only 13.8 0 10.5 22 18.0 0 12.3 11 26.8 0 12.4 8.0 28.9 0 13.6 9.0
CHP Boiler and MTG(1)
11.9 76.2 11.8 4.9 14.3 76.2 10.6 5.4 16.5 80 11.2 3.9 19.8 80 13.5 3.9 21.8 80 12.0 3.8 23.0 80 14.5 3.1 24.0 80 13.3 3.1 14.6 80 13.5 3.2 26.5 80 13.7 2.1
A-104

Table A-35 Summary of Performance and Emissions Data Test No. 1 2 3 4 5 6 7 8 9 10 11 12 13 14 15
Boiler Steam, 1000 lb/hr 0 13,808 17,991 26,828 28,917 11,933 11,923 14,311 16,593 19,843 21,784 23,063 23,980 24,630 26,485 Boiler Control RoomSteam Press, psig 92 92 92 97 92 92 97 93 93 93 93 94 94 94 Boiler Control RoomStack Temp, F 140 385 391 393 412 378 378 385 399 416 414 435 436 442 446 Stack ThermocoupleStack O2, % wet 18.6 5.29 2.2 1.86 2.1 5.49 5.49 3.52 2.08 2.2 2.7 3.16 3.07 3.5 3.4 Testo Emission MonitorsGas Valve, % open 0 30 40 74 85 31 31 34 37 42.5 46.7 51 52 55 58 Coen BMSQLN Burner P, psig 0 0.9 2.4 8 8.2 0.9 0.9 1.6 2.4 4 4.9 5.8 6.1 6.2 6.9 Pressure dialWindbox Press, in H2O 3.5 1.3 3.4 5.7 6.7 2.5 2.5 2.5 3.5 4.8 5.8 6.3 6.6 7.2 7.6 Water ManometerWindbox Temp, F 105 91 92 94 94 124 125 126 129 126 122 124 122 121 122 ThermocoupleGas flow, 1000 SCFH 0 14.23 18.26 27.22 29.65 12.34 12.33 14.64 16.89 20.3 22.38 23.97 24.93 25.72 27.66 Pitot ConversionWindbox O2, % dry 20.6 Testo Emission MonitorsExternal FGR Rate, % 0 0 0 0 0 0 0 0 0 0 0 0 0 0 0 Windbox O2- BMS
Microturbine, kW 80 0 0 0 0 76.2 76.2 76.2 80.1 80 80 80 80.1 80 80 Elliott PE DisplayMTG Gas, 1000 SCFH 1.88 0 0 0 0 1.80 1.81 1.80 1.94 1.95 1.94 1.94 1.95 1.94 1.95 Endress Houser PitotMTG Gas Press, psig 100 0 0 0 0 89 89 90 89 89 89 89 89 89 89 Compressor Dischage DialAmbient Air, F 88 85 86 86 86 88 88 88 88 88 89 90 90 90 92 Elliott PE DisplayAmbient Air, in Hg 30.2 30.1 30.1 30.1 30.1 30.1 30.1 30.1 30.1 30.1 30.1 Elliott PE DisplayMTG Exhaust Temp, F 577 571 571 570 572 572 575 577 578 578 580 Elliott PE DisplayMTG Pilot Set off on off off off off off off off off off VisualMTG Equivalent FGR % 0 0 0 0 0
Efficiencies, % - Boiler 79.9 81.1 81.1 80.3 79.6 79.6 80.5 80.9 80.4 80.1 79.2 79.2 78.8 78.8 ASME PTC 4.1 - MTG Power Conv 14.5 14.5 14.5 14.5 14.5 14.5 14.5 14.5 14.5 14.5 14.5 Calculated - CHP 82.5 82.5 83.3 83.6 83.3 83.0 82.2 82.2 81.9 81.9 Calculated
Emissions as Measured - NOx, ppm dry 1.0 8.6 12.6 13 14 18.8 9.6 9.9 11.5 13.8 11.9 13.81 12.8 12.6 12.9 Testo Emission Monitors - CO, ppm dry 200 18 11.6 8.3 9 7 4 5 4 4 3 3 3 3 2 Testo Emission Monitors - O2, % dry 19 6.2 2.6 2.2 2.5 6.4 6.4 4.2 2.5 2.6 3.2 3.8 3.7 4.2 4.0 Testo Emission MonitorsCorrected Emissions, ppm @15% - NOx 3.0 10.5 12.3 12.4 13.6 23.2 11.8 10.6 11.2 13.5 12.0 14.5 13.3 13.5 13.7 Calculated - CO 600 22 11 8 9 8.6 4.9 5.4 3.9 3.9 3.0 3.1 3.1 3.2 2.1 Calculated
Other ConditionsCO2 9.11 11.0 11.1 10.6 8.5 8.5 9.8 10.9 11.0 10.4 10 10 9.8 9.9
ASME PTC 4.1Dry gas/lb fuel 27.2 22.6 22.3 23.4 29.0 29.0 25.3 22.8 22.6 23.9 24.8 24.8 25.3 25.0Dry Gas Heat Loss 8.46 7.16 7.12 7.93 8.74 8.74 7.80 7.36 7.70 8.06 8.89 8.90 9.23 9.21H20 Loss 10.18 10.25 10.26 10.31 10.18 10.18 10.25 10.28 10.35 10.33 10.42 10.44 10.46 10.48Rad Loss 1.5 1.5 1.5 1.5 1.5 1.5 1.5 1.5 1.5 1.5 1.5 1.5 1.5 1.5Total Losses 20.14 18.91 18.89 19.74 20.41 20.42 19.55 19.14 19.55 19.89 20.81 20.84 21.19 21.20Boiler Efficiency 79.9 81.1 81.1 80.3 79.6 79.6 80.5 80.9 80.4 80.1 79.2 79.2 78.8 78.8
Corrected to 3% O2
Condition Boiler Only
Boiler Only
Boiler Only
Measurement InstrumentationCHP CHP CHP CHPCHP CHP CHP CHPMTG
OnlyBoiler Only CHP CHP
A-105

0
2
4
6
8
10
12
14
16
- 5,000 10,000 15,000 20,000 25,000 30,000 35,000
Boiler Steam Load
Stac
k N
Ox,
ppm
@3%
O2
Boiler OnlyCHPPower (CHP)Power (Boiler Only)
Figure A-79 CHP NOx Emissions
1.17.2. Efficiency Data Table A-36 summarizes the overall CHP energy efficiency performance. The power conversion efficiency of the simple cycle microturbine was consistently 15 percent. When coupled with the waste heat recovery in the boiler, overall CHP efficiency ranged from 81.9 to 83.6 percent, varying with boiler load. This variation is the result of the effect of excess combustion air used by the boiler, as illustrated in Figure A-80, and the relative firing rates of the microturbine versus the boiler which varied with steam load.
Table A-36 CHP Efficiency at 80 kWe Output
Boiler Steam Load, 1000 lb/ hr
Boiler MTG Power Conversion Overall CHP Efficiency
11.9 79.6 14.5 82.5 14.3 80.5 14.5 83.3 16.6 80.9 14.5 83.6 19.8 80.4 14.5 83.3 21.8 80.1 14.5 83.0 23.0 79.2 14.5 82.2 24.0 79.2 14.5 82.2 24.6 78.8 14.5 81.9 26.5 78.8 14.5 81.9
Average 79.7 14.5 82.7
A-106

70.0
72.0
74.0
76.0
78.0
80.0
82.0
84.0
86.0
88.0
90.0
2 2.5 3 3.5 4 4.5 5 5.5 6 6.5 7
Boiler Stack O2, % dry
CH
P Ef
ficie
ncy,
%
Figure A-80 Variations in CHP Efficiency with Boiler Excess Combustion Air
Table A-37 compares the performance of the CHP technology against the performance targets established for this project. As indicated, emissions and efficiency exceeded performance targets, including compliance with ARB 2007 NOx and CO emission limits. The technology also provides benefits with reduced carbon footprint based on improved fuel utilization necessary for power generation with this CHP technology compared with modern central power stations.
Table A-37 Overall CHP Performance
Performance Integrated CHP Project Goal
NOx, lb/MWh 0.045 <0.07
CO, lb/MWh 0.045 <0.10
CHP Efficiency, % 82.7 >80%
Reduction in CO2 ton/MWhr 0.26 NA
A-107

1.18. Task 19 – Technologies Transfer Activities The objective of this administrative task is to attend conferences, symposia, and meetings to describe the progress of the technology development and to highlight the accomplishments and potential applications of the technology in targeted markets.
The project team participated in several technology transfer activities during the course of the project. The following is a list of technical papers and poster presentations that were prepared and published in technical journals, and proceedings:
1) Castaldini, C. and A Bining, “A Novel CHP – Microturbine Integrated with Industrial/Commercial Boilers to Mitigate Climate Change Impacts,” Poster Presentation Fifth Annual California Climate Change Conference, Sacramento, CA, September 8-10, 2008
2) Castaldini, C. and A. Bining, “Novel Microturbine CHP Installation on an Industrial Boiler,” presented at California Alliance for Distributed Energy Resources, San Diego, CA, February 1, 2008
3) Castaldini, C. and A. Bining, “Integrated Microturbine-Industrial Steam Boiler as a Clean and Efficient CHP System, Poster Presentation Fourth California Climate Change Conference, Sacramento, CA September 10-13, 2007
4) Castaldini C. and A. Bining., “Power Generation Integrated in Burners for Packaged Industrial/Commercial Boilers.” Second International DER Conference, Napa, CA, December 9, 2006
5) Castaldini, C. and A. Bining., “Power Generation Integrated in Burners for Packaged Industrial/Commercial Boilers,” International Journal of Distributed Energy Resources, Vol 3, No. 4., ps.310-312, November 2006
6) CMC-Engineering, “Integration of Microturbine-Boiler”, Poster Presentation 6th Annual Microturbine Application Workshop, San Francisco, CA, January 17-19, 2006
7) C. Castaldini, “Power Generation Integrated in Packaged Industrial/Commercial Boilers,” 6th Annual International Symposium on Distributed Energy Resources, Santa Clara, CA, September 7-9, 2005
8) Castaldini, C, S. Londerville, and H. Mak., “Power Generation Integrated in Burners for Packaged Industrial/Commercial Boilers,” GTI 2005, Orland, FL, February 1-2, 2005
The following subsections provide reprints of technical papers and selected presentation abstracts
A-108

1.18.1. Second International DER Conference, Napa, CA, December 9, 2006
POWER GENERATION INTEGRATED IN BURNERS FOR
PACKAGED INDUSTRIAL/COM M ERCIAL BOILERS
Carlo Castaldini CMC-Engineering
2900 Gordon Avenue, Suite 100, Santa Clara, CA 95051 Phone(408) 730-1300; Fax (408) 735-0564
Email: [email protected]
And
Avtar Bining California Energy Commission
1516 9th Street, Sacramento CA 95814-5512 Phone: (916) 657-2002; Fax (916) 653-6010
Email: [email protected]
Keywords: Distributed generation; microturbines; microturbine combustor; industrial burners; combined heat and power; industrial boilers ABSTRACT CMC-Engineering (CMCE, Inc) together with Coen Company, Lawrence Berkeley National Laboratory (LBNL) and Elliott Energy Systems (EES, Inc.) is developing and demonstrating new industrial burners with integrated capability for low-cost and fuel efficient distributed power generation. Under a program funded by the California Energy Commission(1) and Southern California Gas Company (SCG), CMC-Engineering and Coen will engineer, assemble and demonstrate a novel ultra low-NOx burner coupled with an Elliott Energy Systems microturbine generator modified and embedded in the windbox to generate 80-kWe of power, sufficient to render small to mid-size packaged steam generators more efficient and independent of grid power. By emphasizing thermal heat recovery the goal is to minimize capital investment for the prime mover and maximize fuel savings to make small-scale distributed generation (DG) more cost-effective and better integrated in the industrial process equipment and user practices. This paper describes the hardware selection and assembly and presents the benefits of this approach compared to more conventional distributed generation combined heat and power (CHP) systems. 1 This project is being funded by the California Energy Commission' s Public Interest Energy Research (PIER) program, and managed by Dr. Avtar Bining, Program Manager (Tel: 916-657-2002). PIER supports energy research and development that improves the quality of life in California by bringing environmentally safe, affordable, and reliable energy services and products to the
A-109

marketplace. Mr. Castaldini is the principal at CMC-Engineering, He can be reached at 408-314-0382(mobile) 1.0 INTRODUCTION In the U.S., there are about 30,000 package commercial and industrial steam boilers w ith heat input from 10 to 250 million Btu/ hr (MMBtu/ hr) that consume vast quantities of electricity to drive auxiliary equipment such as combustion air fans, flue gas recirculation (FGR) fans and pumps. Besides being vulnerable to power outages, in many parts of the country that require improvements in ambient air quality these boilers must also meet stringent emission regulations. Control of NOx emissions often requires additional investments in the form of new burners and larger fans with increased power consumption for FGR and higher pressure drop burners. The purpose of this project is to design, develop and test a commercial burner-CHP package that integrates a low-cost simple cycle (unrecuperated) 80-kWe microturbine with a gas-fired low NOx burner. Contrary to conventional CHP where the design and operation often centers on power production (i.e., maximum electrical generating efficiency), the proposed CHP will be designed around the thermal requirements of the user w ith the side benefit of low cost co-generated electricity. Thus, the technology is similar to conventional CHP systems but w ith the added innovation that the prime mover is embedded into the burner/ w indbox assembly to make future small-scale CHP-DG less costly, more compact, and more integrated into a line of industrial equipment that is familiar to the user for broader acceptance in the small industrial-commercial market. The technology that we have selected is based on the recognition that w ithout reduced capital and operating costs and maximum fuel efficiency, small-scale prime movers will have a limited role in distributed generation except in niche markets. By building the CHP around the thermal output and reducing the cost of the prime mover, more widespread DG is possible. The integration aims at reducing the footprint and cost of the CHP assembly while also maximizing the fuel efficiency, operational flexibility and acceptance of small-scale DG. Commercial and industrial steam boilers of the package design, w ith single burners, provide an ideal sink for the thermal waste heat of microturbine generators used in DG. Our planned assembly aims at the recovery of all sensible and convective waste heat from the microturbine resulting in overall fuel utilization efficiency exceeding 80%. Furthermore, the use of small-scale DG offers additional benefits that reduce the retrofit cost of new low-NOx burners while improving the operation of industrial boilers and lowering their operating cost. The development of this market has the potential for thousands of clean and efficient MWe of distributed generation while also providing significant benefits to the industrial/ commercial steam sectors. Specifically, the project w ill demonstrate the application of a compact integrated CHP assembly that can be readily retrofitted to packaged boilers and will aim to achieve:
• Overall thermal CHP efficiency of 82% • DG installed cost of less than $700/ kW • NOx and CO emissions of less than 9 ppm, corrected to 3% O2 • Load following flexibility and reliability.
A-110

2.0 NEW M ICROTURBINE COM BUSTOR
California DG certification regulation proposes that all fossil fueled DG equipment installed on or after January 1, 2007 must meet NOx emissions of 0.07 lb/ MWeh. In CHP applications the proposed DG certification regulations allow for energy credits based on the heat that can actually be captured and used for other processes [1]. Figure 2.1 illustrates how the permitted emission limits under the California DG certification program would increase with increasing levels of waste heat recovery. For example, for a microturbine exhausting to a packaged gas-fired steam boiler the proposed limit of 0.07 lb/ MWh translates to about 7 ppm corrected to 15% O2 when the boiler recovers 70% of the waste heat in the turbine exhaust. Consequently, one part of this development program required modifying an Elliott 80 kWe microturbine, in simple cycle configuration, to reduce its emissions from its typical levels of 15 to 25 ppm (dry at 15%O2) to a range of about 5 to 7 ppm. The selected approach was to replace the partial oxidation annular combustor of the current Elliott design with a fully premixed silo combustor as illustrated in Figure 2.2. The project team secured the support of the Lawrence Berkeley National Laboratory (LBNL) to adapt the low swirl premix burner into a fully premixed silo combustor [2]. The low swirl burner consists of a conventional swirler with a center perforated plate for greater flame stabilization at high velocity and low equivalence ratios. This low swirl burner was engineered and adapted to a new silo combustor design and configuration, developed in this project. This silo combustor demonstrated acceptable operational and emission performance in line with the goals of the project. Figure 2.3 illustrates the combustor being tested at EES test facility in Stuart, FL.
0
1
2
3
4
5
6
7
8
9
30% 40% 50% 60% 70%
Percent heat recovery
NO
x dr
y pp
m @
15%
O2
Figure 2.1: California NOx emission limit for CHP with the waste heat recovered as useful
heat Recent tests showed the validity of this approach in minimizing NOx emissions from microturbines. Figure 2.4 illustrates NOx emissions measured at the Elliott Energy
A-111

Systems Inc., (EESI) test cell in Stuart, Florida, from the 80-kWe microturbine equipped with the original annular combustor and from recent atmospheric tests on the new premixed silo combustor. The silo combustor is designed to operate with a pilot flame below 40 kWe and fully premixed (no pilot flame) above 40 kWe. The pilot flame is necessary at startup and initial loading to maintain flame stability at all atmospheric conditions. The microturbine operates at full load of 80 kWe during commercial operation. At full load condition, the silo combustor has achieved less than 7 ppm NOx emissions, dry corrected to 15% O2, which represents about a 65 percent reduction fro original combustor levels. Further refinements are ongoing to validate performance and monitor thermal stress and ignition reliability. Initial thermal stress analyses have indicated that the combustor is more robust and may actually improve on the durability of the current combustor design. Improved emission performance will also benefit compliance with the California 2007 emission standards for distributed generators in CHP configuration.
Figure 2.2: New silo combustor for the simple cycle Elliott 80-100 kWe microturbine
A-112

Figure 2.3: New silo combustor being tested on EES test cell NOx emissions from gas-fired industrial boilers are also regulated. In California, these levels range from 9 to 30 ppm, dry corrected to 3% O2. Flue gas recirculated (FGR) from the boiler stack (FGR), along with new low-NOx burners, is often needed to reduce emissions in order to comply with these permit limits. Normally, this FGR is supplied by the burner combustion air fan. However, the increased combustion air volume to the fan, coupled with an increase in temperature often necessitates a larger motor and results in increased energy consumption. In CHP applications, the microturbine exhaust provides vitiated air (FGR) to the industrial burner, reducing or eliminating the need for recirculated flue gas from the boiler stack. This is an important benefit to the industrial boiler owner because it makes NOx compliance more cost-effective. Figure 2.5 illustrates the equivalent FGR when an 80 kWe simple cycle microturbine exhausts to burners of different firing capacities for industrial/ commercial size steam generators.
A-113

0
5
10
15
20
25
30
0 10 20 30 40 50 60 70 80 90
Generator gross output, KWe
NO
x @
15%
O2
New silo combustor - Pilot off
New silo combustor-Pilot on
Original combustor
Figure 2.4: Reduction in NOx emissions achieved in an Elliott 80-kWe microturbine with
the implementation of a silo combustor Emissions from the microturbine in a CHP application with a boiler add to the total boiler emissions. This is an important consideration if CHP systems are permitted under existing industrial boiler regulations. Figure 2.6 illustrates how the emissions from an 80-kWe simple cycle microturbine that is CHP-certified under the proposed 2007 standard increases the overall emissions from a 50 MMBtu/ hr low-NOx industrial boiler. As shown, certification levels of 4 to 6 ppm @ 15% O2 from the microturbine increase boiler emissions by 0.5 to 0.7 ppm corrected to 3%O2 (solid lines). This increase represents about 0.5 to 7 percent net increase in boiler NOx (dashed lines), depending on the boiler low-NOx burner performance of 9 to 30 ppm. 3.0 NEW M ICROTURBINE-BURNER CHP CONFIGURATION The primary industrial burner design includes a FyrCompakTM w indbox illustrated in Figure 3.1. The FyrCompakTM is used with several burner types tailored to site-specific NOx limits of local permits. For this project, the manufacturer w ill use a modified DeltaNOxTM ULN low-NOx burner illustrated in Figure 3.2 which combines premixed technology with fuel staging and is capable of 9 ppm NOx emissions when used with up to 40 percent FGR. Requirements for recirculated flue gas from the boiler stack will be reduced because microturbine exhaust supplies vitiated air to the ULN burner.
A-114

0.0%
5.0%
10.0%
15.0%
20.0%
25.0%
30.0%
35.0%
40.0%
45.0%
0 5,000 10,000 15,000 20,000 25,000 30,000 35,000
Boiler lb steam/hr
FGR
rate
sEquivalent FGR rate
Additional FGR needed for 20% burner FGR
80 kW MTG; 2.5% O2 in boiler flue gas
Figure 2.5: Equivalent flue gas recirculation (FGR) for various boiler-microturbine
configurations
0.00.10.2
0.30.40.50.6
0.70.8
3 4 5 6Microturbine NOx, ppm dry @15% O2
ppm
incr
ease
0%2%4%6%8%10%12%14%16%18%20%
perc
ent i
ncre
ase
30 ppm boiler15 ppm boiler9 ppm boiler
Figure 2.6: Incremental increase (Solid line - ppm, Dashed line - %) in NOx emissions
with an 80-kWe simple cycle microturbine coupled with a 50 MMBtu/hr industrial packaged boiler
The integration of the microturbine with the FyrCompakTM w indbox requires several important considerations to permit the maximum benefit in efficiency and operational flexibility, including ease of maintenance and burner/ microturbine control. Figure 3.3
A-115

i l lustrates the microturbine assembly cabinet that w ill be mounted with the industrial burner w indbox. The design allows for the hot sections of the microturbine to be enclosed with the windbox for low-cost heat recovery while the air intake section is permitted to operate with filtered fresh air. The fresh air intake will increase the combustion air capacity to the industrial burner. This latter design consideration is important for many installations as it permits the microturbine to operate without any vitiated air, independently from the burner. The design will also void the need for increased air demand for combustion air volume that is typically associated with the installation of low-NOx burners that require FGR. This reduction in combustion air requirements reduces the cost of the burner installations and facilitates compliance with stringent NOx regulations for both existing and new boilers installations.
Figure 3.4 illustrates the overall configuration of a typical boiler installation with the modified Coen windbox and microturbine related components. Most of the microturbine is embedded in the windbox and will provide power to the unit as well as other important synergies and benefits to the operation of the burner. 4.0 BENEFITS AND M ARKETS A ll CHP systems provide some benefit to the users and electricity ratepayers in the state where they are installed. This is because CHP, as a whole, makes better use of fuels thus (a)reducing the dependence on dwindling resources; (b) reducing the cost of energy for industry thus making them more competitive; (c) providing greater independence from grid power; and (d) reducing the level of greenhouse gases based from reduced levels of fuel consumption. This power burner technology as a packaged CHP, thus, offers all of these benefits as well. In addition, because of the focus on integrating the power generation component into a commercial burner assembly and reducing its cost, the
Figure 3.1: FyrCompakTM windbox Figure 3.2: DentaNOxTM ULN burner
A-116

technology offers the advantages of reduced capital investment, higher overall fuel efficiencies, and reduced emissions.
Figure 3.3: Microturbine assembly for integration into the burner windbox
Figure 3.4: CHP general configuration The synergistic benefits of the proposed integrated burner-CHP system to the microturbine-based DG market can be summarized as follows: The generator:
(a) Isometric front view (b) Back view
A-117

• Reduced emissions with the use of a new silo combustor technology • Reduced capital and operating costs of generator w ithout recuperator • Available high pressure gas at some industrial installations voids need for gas
compressor • Lowest installation and maintenance cost for DG with less footprint • Maximum overall fuel efficiency • Large retrofit boiler market
The boiler:
• Boiler is better than recuperator for heat recovery • Grid-independent steam generation • Improved boiler burner low NOx operation with preheat • Reduced or elimination of FGR needs for NOx compliance • Lower cost of boiler NOx compliance without new, larger combustion air fan • Improved, more efficient boiler fan turndown operation • Rapid warm start-up for boiler
These advantages will provide greater incentives to the market place for adoption of CHP in small industrial, commercial and institutional steam generators. In its final commercial design, the power burner w ill be designed so that it is a feasible replacement of existing packaged boilers depicted in Figure 4.1. Thus, a large population of installed and operating packaged boilers, as well as sales of new packaged boilers, would benefit from adopting the CHP option. Figure 4.2 illustrates the current population of industrial/ commercial packaged boilers in the U.S. Many of these boilers represent the overall potential market for low-cost microturbine DG installations. Because ultra low-NOx technologies will be implemented in both the microturbine combustor and the burner, the CHP system will also provide incentives for replacement of higher polluting burners, for a dual benefit of reducing emissions with the addition of clean burning DG. 5.0 ACKNOWLEDGEM ENTS The authors wish to acknowledge the technical contribution of Dr. David Litteljohn of Lawrence Berkeley National Laboratory who spearheaded the integration of LBNL proprietary low swirl nozzle into a new silo combustor design developed in this program. We also wish to acknowledge the contribution of Vladimir Lifshits and Steve Londerville of Coen Company for the design of the new CHP burner-microturbine assembly and Mr. David Dewis of Elliott Energy Systems, Inc. for the engineering and testing support in integrating the new premix silo combustor in a simple cycle engine for demonstration under this program. 6.0 REFERENCES [1]. Title 17. California A ir Resources Board, “ Notice of Public Hearing to Consider
Amendments to the Distributed Generation Certification Regulation,” October 19, 2006
[2] Low Swirl Burner (LSB) is a patented burner nozzle protected under U.S patents 5,735,681; 5,879,148; and 5,516,280
A-118

Figure 4.1: Candidate industrial/commercial boiler equipment for developed CHP
010002000300040005000600070008000
Food
Paper
Chemica
ls
Refining
Primary
meta
ls
Other M
anufu
ring
Non-Man
ufactu
ring
Num
ber o
f boi
lers
Figure 4.2: Available boiler retrofit market- existing boilers in the U.S. .each with less than
100 MMBtu/hr capacity
A-119

DISCLAIMER
This paper was co-prepared by a California Energy Commission staff person. It does not necessarily represent the views of the Energy Commission or the State of California. The Energy Commission, the State of California, its employees, contractors and subcontractors make no warrant, express or implied, and assume no legal liability for the information in this paper; nor does any party represent that the uses of this information will not infringe upon privately owned rights. This paper has not been approved or disapproved by the California Energy Commission nor has the California Energy Commission passed upon the accuracy or adequacy of the information in this paper. This paper has not been approved or disapproved by the full Commission.
A-120

1.18.2. Second International DER Conference, Napa, CA December 2006
POWER GENERATION INTEGRATED IN BURNERS FOR
PACKAGED INDUSTRIAL/COM M ERCIAL BOILERS
Carlo Castaldini CMC-Engineering
2900 Gordon Avenue, Suite 100, Santa Clara, CA 95051 Phone(408) 730-1300; Fax (408) 735-0564
Email: [email protected]
And
Avtar Bining California Energy Commission
1516 9th Street, Sacramento CA 95814-5512 Phone: (916) 657-2002; Fax (916) 653-6010
Email: [email protected]
Keywords: Distributed generation; microturbines; microturbine combustor; industrial burners; combined heat and power; industrial boilers ABSTRACT CMC-Engineering (CMCE, Inc) together with Coen Company, Lawrence Berkeley National Laboratory (LBNL) and Elliott Energy Systems (EES, Inc.) is developing and demonstrating new industrial burners with integrated capability for low-cost and fuel efficient distributed power generation. Under a program funded by the California Energy Commission(1) and Southern California Gas Company (SCG), CMC-Engineering and Coen will engineer, assemble and demonstrate a novel ultra low-NOx burner coupled with an Elliott Energy Systems microturbine generator modified and embedded in the windbox to generate 80-kWe of power, sufficient to render small to mid-size packaged steam generators more efficient and independent of grid power. By emphasizing thermal heat recovery the goal is to minimize capital investment for the prime mover and maximize fuel savings to make small-scale distributed generation (DG) more cost-effective and better integrated in the industrial process equipment and user practices. This paper describes the hardware selection and assembly and presents the benefits of this approach compared to more conventional distributed generation combined heat and power (CHP) systems. 1 This project is being funded by the California Energy Commission' s Public Interest Energy Research (PIER) program, and managed by Dr. Avtar Bining, Program Manager (Tel: 916-657-2002). PIER supports energy research and development that improves the quality of life in California by bringing environmentally safe, affordable, and reliable energy services and products to the marketplace. Mr. Castaldini is the principal at CMC-Engineering, He can be reached at 408-314-0382
A-121

DISCLAIMER
This paper was co-prepared by a California Energy Commission staff person. It does not necessarily represent the views of the Energy Commission or the State of California. The Energy Commission, the State of California, its employees, contractors and subcontractors make no warrant, express or implied, and assume no legal liability for the information in this paper; nor does any party represent that the uses of this information will not infringe upon privately owned rights. This paper has not been approved or disapproved by the California Energy Commission nor has the California Energy Commission passed upon the accuracy or adequacy of the information in this paper. This paper has not been approved or disapproved by the full Commission.
1.0 NTRODUCTION In the U.S., there are about 30,000 package commercial and industrial steam boilers w ith heat input from 10 to 250 million Btu/ hr (MMBtu/ hr) that consume vast quantities of electricity to drive auxiliary equipment such as combustion air fans, flue gas recirculation (FGR) fans and pumps. Besides being vulnerable to power outages, in many parts of the country that require improvements in ambient air quality these boilers must also meet stringent emission regulations. Control of NOx emissions often requires additional investments in the form of new burners and larger fans with increased power consumption for FGR and higher pressure drop burners. The purpose of this project is to design, develop and test a commercial burner-CHP package that integrates a low-cost simple cycle (unrecuperated) 80-kWe microturbine with a gas-fired low NOx burner. Contrary to conventional CHP where the design and operation often centers on power production (i.e., maximum electrical generating efficiency), the proposed CHP will be designed around the thermal requirements of the user w ith the side benefit of low cost co-generated electricity. Thus, the technology is similar to conventional CHP systems but w ith the added innovation that the prime mover is embedded into the burner/ w indbox assembly to make future small-scale CHP-DG less costly, more compact, and more integrated into a line of industrial equipment that is familiar to the user for broader acceptance in the small industrial-commercial market. The technology that we have selected is based on the recognition that w ithout reduced capital and operating costs and maximum fuel efficiency, small-scale prime movers will have a limited role in distributed generation except in niche markets. By building the CHP around the thermal output and reducing the cost of the prime mover, more widespread DG is possible. The integration aims at reducing the footprint and cost of the CHP assembly while also maximizing the fuel efficiency, operational flexibility and acceptance of small-scale DG. Commercial and industrial steam boilers of the package design, w ith single burners, provide an ideal sink for the thermal waste heat of microturbine generators used in DG. Our planned assembly aims at the recovery of all sensible and convective waste heat from the microturbine resulting in overall fuel utilization efficiency exceeding 80%. Furthermore, the use of small-scale DG offers additional benefits that reduce the retrofit
A-122

cost of new low-NOx burners while improving the operation of industrial boilers and lowering their operating cost. The development of this market has the potential for thousands of clean and efficient MWe of distributed generation while also providing significant benefits to the industrial/ commercial steam sectors. Specifically, the project w ill demonstrate the application of a compact integrated CHP assembly that can be readily retrofitted to packaged boilers and will aim to achieve:
• Overall thermal CHP efficiency of 82% • DG installed cost of less than $700/ kW • NOx and CO emissions of less than 9 ppm, corrected to 3% O2 • Load following flexibility and reliability.
2.0 NEW M ICROTURBINE COM BUSTOR
California DG certification regulation proposes that all fossil fueled DG equipment installed on or after January 1, 2007 must meet NOx emissions of 0.07 lb/ MWeh. In CHP applications the proposed DG certification regulations allow for energy credits based on the heat that can actually be captured and used for other processes (Reference 1). Figure 2.1 illustrates how the permitted emission limits under the California DG certification program would increase with increasing levels of waste heat recovery. For example, for a microturbine exhausting to a packaged gas-fired steam boiler the proposed limit of 0.07 lb/ MWh translates to about 7 ppm corrected to 15% O2 when the boiler recovers 70% of the waste heat in the turbine exhaust. Consequently, one part of this development program required modifying an Elliott 80 kWe microturbine, in simple cycle configuration, to reduce its emissions from its typical levels of 15 to 25 ppm (dry at 15%O2) to a range of about 5 to 7 ppm. The selected approach was to replace the fuel-staged annular combustor of the current Elliott design with a fully premixed silo combustor as illustrated in Figure 2.2. The project team secured the support of the Lawrence Berkeley National Laboratory (LBNL) to adapt the low swirl premix burner2 into a fully premixed silo combustor. The low swirl burner consists of a conventional swirler with a center perforated plate for greater flame stabilization at high velocity and low equivalence ratios. This low swirl burner was engineered and adapted to a new silo combustor design and configuration, developed in this project. This silo combustor demonstrated acceptable operational and emission performance in line with the goals of the project. Figure 2.3 illustrates the combustor being tested at EES test facility in Stuart, FL.
A-123

0
1
2
3
4
5
6
7
8
9
30% 40% 50% 60% 70%
Percent heat recovery
NO
x dr
y pp
m @
15%
O2
Figure 2.1: California NOx emission limit for CHP with the waste heat recovered as useful
heat (2) Low Swirl Burner (LSB) is a patented burner nozzle protected under U.S patents 5,735,681; 5,879,148; and 5,516,280 Recent showed the validity of this approach in minimizing NOx emissions from microturbines. Figure 2.4 illustrates NOx emissions measured at the Elliott Energy Systems in Stuart, Florida, from the 80-kWe microturbine equipped with the original annular combustor and from recent atmospheric tests on the new premixed silo combustor at the LBNL facilities. As shown, we anticipate NOx emissions at 5 ppm or less at full power output.
Figure 2.2: New silo combustor for the simple cycle Elliott 80-100 kWe microturbine
A-124

Figure 2.3: New silo combustor being tested on EES test cell NOx emissions from gas-fired industrial boilers are also regulated. In California, these levels range from 9 to 30 ppm, dry corrected to 3% O2. Flue gas recirculated (FGR) from the boiler stack (FGR), along with new low-NOx burners, is often needed to reduce emissions in order to comply with these permit limits. Normally, this FGR is supplied by the burner combustion air fan. However, the increased combustion air volume to the fan, coupled with an increase in temperature often necessitates a larger motor and results in increased energy consumption. In CHP applications, the microturbine exhaust provides vitiated air (FGR) to the industrial burner, reducing or eliminating the need for recirculated flue gas from the boiler stack. This is an important benefit to the industrial boiler owner because it makes NOx compliance more cost-effective. Figure 2.5 illustrates the equivalent FGR when an 80 kWe simple cycle microturbine exhausts to burners of different firing capacities for industrial/ commercial size steam generators.
0
5
10
15
20
25
30
0 20 40 60 80 100
Power Output (kWe)
NO
x (p
pm @
15%
O2)
Original CombustorWith Premixed Silo
Figure 2.4: Reduction in NOx emissions achieved in an Elliott 80-kWe microturbine with
the implementation of a silo combustor
A-125

Emissions from the microturbine in a CHP application with a boiler add to the total boiler emissions. This is an important consideration if CHP systems are permitted under existing industrial boiler regulations. Figure 2.6 illustrates how the emissions from an 80-kWe simple cycle microturbine that is CHP-certified under the proposed 2007 standard increases the overall emissions from a 50 MMBtu/ hr low-NOx industrial boiler. As shown, certification levels of 4 to 6 ppm @ 15% O2 from the microturbine increase boiler emissions by 0.5 to 0.7 ppm corrected to 3%O2 (solid lines). This increase represents about 0.5 to 7 percent net increase in boiler NOx (dashed lines), depending on the boiler low-NOx burner performance of 9 to 30 ppm. 3.0 NEW M ICROTURBINE-BURNER CHP CONFIGURATION Coen Company, a manufacturer of low-NOx burners for package industrial/ commercial boilers, is headquartered in Woodland, California. Coen primary industrial burner design includes a FyrCompakTM windbox illustrated in Figure 3.1. The FyrCompakTM is used with several burner types tailored to site-specific NOx limits of local permits. For this project, Coen is a sub-contractor and will use a modified QLN/ ULNTM low-NOx burner illustrated in Figure 3.2 which combines premixed technology with fuel staging and is capable of 15 ppm NOx emissions without FGR and 9-ppm NOx emissions with as little as 13% FGR.
0.0%
5.0%
10.0%
15.0%
20.0%
25.0%
30.0%
35.0%
40.0%
45.0%
0 5,000 10,000 15,000 20,000 25,000 30,000 35,000
Boiler lb steam/hr
FGR
rate
s
Equivalent FGR rate
Additional FGR needed for 20% burner FGR
80 kW MTG; 2.5% O2 in boiler flue gas
Figure 2.5: Equivalent flue gas recirculation (FGR) for various boiler-microturbine
configurations
A-126

0.00.10.2
0.30.40.50.6
0.70.8
3 4 5 6Microturbine NOx, ppm dry @15% O2
ppm
incr
ease
0%2%4%6%8%10%12%14%16%18%20%
perc
ent i
ncre
ase
30 ppm boiler15 ppm boiler9 ppm boiler
Figure 2.6: Incremental increase (Solid line - ppm, Dashed line - %) in NOx emissions
with an 80-kWe simple cycle microturbine coupled with a 50 MMBtu/hr industrial packaged boiler
The integration of the microturbine with the FyrCompakTM w indbox requires several important considerations to permit the maximum benefit in efficiency and operational flexibility, including ease of maintenance and burner/ microturbine control. Figure 3.3 illustrates the microturbine assembly cabinet that w ill be mounted with the industrial burner w indbox. The design allows for the hot sections of the microturbine to be enclosed with the windbox for low-cost heat recovery while the air intake section is permitted to operate with filtered fresh air. The fresh air intake will increase the combustion air capacity to the industrial burner. This latter design consideration is important for many installations as it permits the microturbine to operate without any vitiated air, independently from the burner. The design will also void the need for increased air demand for combustion air volume that is typically associated with the installation of low-NOx burners that require FGR. This reduction in combustion air requirements reduces the cost of the burner installations and facilitates compliance with stringent NOx regulations for both existing and new boilers installations.
A-127

Figure 3.4 illustrates the overall configuration of a typical boiler installation with the modified Coen windbox and microturbine related components. Most of the microturbine is embedded in the windbox and will provide power to the unit as well as other important synergies and benefits to the operation of the burner. 4.0 BENEFITS AND M ARKETS A ll CHP systems provide some benefit to the users and electricity ratepayers in the state where they are installed. This is because CHP, as a whole, makes better use of fuels thus (a)reducing the dependence on dwindling resources; (b) reducing the cost of energy for industry thus making them more competitive; (c) providing greater independence from grid power; and (d) reducing the level of greenhouse gases based from reduced levels of fuel consumption. This power burner technology as a packaged CHP, thus, offers all of these benefits as well. In addition, because of the focus on integrating the power generation component into a commercial burner assembly and reducing its cost, the technology offers the advantages of reduced capital investment, higher overall fuel efficiencies, and reduced emissions. The synergistic benefits of the proposed integrated burner-CHP system to the microturbine-based DG market can be summarized as follows: The generator:
• Reduced emissions with the use of a new silo combustor technology • Reduced capital and operating costs of generator w ithout recuperator • Available high pressure gas at some industrial installations voids need for gas
compressor • Lowest installation and maintenance cost for DG with less footprint
Figure 3.1: FyrCompakTM windbox Figure 3.2: QLN/ULNTM burner
A-128

• Maximum overall fuel efficiency • Large retrofit boiler market
The boiler:
• Boiler is better than recuperator for heat recovery • Grid-independent steam generation • Improved boiler burner low NOx operation with preheat • Reduced or elimination of FGR needs for NOx compliance • Lower cost of boiler NOx compliance without new, larger combustion air fan • Improved, more efficient boiler fan turndown operation • Rapid warm start-up for boiler
Figure 3.3: Microturbine assembly for integration into the burner windbox
A-129

Figure 3.4: CHP general configuration These advantages will provide greater incentives to the market place for adoption of CHP in small industrial, commercial and institutional steam generators. In its final commercial design, the power burner w ill be designed so that it is a feasible replacement of existing packaged boilers depicted in Figure 4.1. Thus, a large population of installed and operating packaged boilers, as well as sales of new packaged boilers, would benefit from adopting the CHP option. Figure 4.2 illustrates the current population of industrial/ commercial packaged boilers in the U.S. Many of these boilers represent the overall potential market for low-cost microturbine DG installations. Because ultra low-NOx technologies will be implemented in both the microturbine combustor and the burner, the CHP system will also provide incentives for replacement of higher polluting burners, for a dual benefit of reducing emissions with the addition of clean burning DG. 5.0 ACKNOWLEDGEM ENTS The authors wish to acknowledge the technical contribution of Dr. David Litteljohn of Lawrence Berkeley National Laboratory who spearheaded the integration of LBNL proprietary low swirl nozzle into a new silo combustor design developed in this program. We also wish to acknowledge the contribution of Vladimir Lifshits and Steve Londerville of Coen Company for the design of the new CHP burner-microturbine assembly and Mr. David Dewis of Elliott Energy Systems, Inc. for the engineering and testing support in integrating the new premix silo combustor in a simple cycle engine for demonstration under this program. 6.0 REFERENCES 1. Title 17. California A ir Resources Board, “ Notice of Public Hearing to Consider
Amendments to the Distributed Generation Certification Regulation,” October
A-130

19, 2006
Figure 4.1: Candidate industrial/commercial boiler equipment for developed CHP
Figure 4.2: Available boiler retrofit market
010002000300040005000600070008000
Food
Paper
Chemica
ls
Refining
Primary
meta
ls
Other M
anuf
Com./inst.
steam
Exis
itng
boile
rs in
U.S
. eac
h w
ith<
100
MM
Btu/
hr c
apac
ity
A-131

A-132

1.18.3. Presentation Abstracts California Climate Change Conference, Sacramento, CA September 2007 INTEGRATED M ICROTURBINE-INDUSTRIAL STEAM BOILER AS A CLEAN AND EFFICIENT CHP SYSTEM
Submitted to the
California Climate Change Conference September 10-13, 2007 Sacramento, California
Submitted by
Carlo Castaldini CMC-Engineering
Santa Clara, CA 95051
and
Avtar Bining, PhD California Energy Commission,
Sacramento, CA 95814 The most cost-effective means of reducing the carbon footprint of American industry is to maximize the energy conversion and use efficiency of fossil fuels and, whenever possible, integrate renewable energies into the mix. The California Energy Commission through its Public Interest Energy Research (PIER) program has sponsored the development of a novel combined heat and power (CHP) assembly that combines low-cost microturbine generators w ith industrial burners for packaged steam boilers. These integrated CHP systems will have the capability of producing distributed power with overall CHP efficiencies in excess of 80 percent displacing electricity purchased from central power stations which have efficiencies in the range of 35 to 55 percent. The energy efficiency improvements will translate into CO2 emission reductions of 300 to 500 lb/ MWh. The USDOE estimates that the total power generating capacity of CHP systems with microturbines coupled with industrial boiler thermal load can range as high as 4.4 GWe. Therefore, this CHP market potential represents a total reduction in CO2 emissions of 0.6 to 1.0 million tons/ year in California, and 5.6 to 10 million tons/ year throughout the United States. The PIER project facilitates this goal by reducing the cost of the installation as well as reducing the operating cost to the user, thus providing additional incentives for the adoption of CHP in small to medium size industrial and commercial sectors. A lso, the designed assembly can provide operating benefits w ith regard to the reduction in criteria pollutants and CO2 emissions, improved part load and stand by boiler efficiencies, and grid-independent operation. This poster describes the design configuration, the energy and emission (criteria pollutants and CO2) performances, and the operational incentives of clean, efficient, low-cost microturbine-boiler CHP systems.
A-133

Fifth Annual California Climate Change Conference, Sacramento, CA September 2008
A NOVEL CHP – MICROTURBINE INTEGRATED
WITH INDUSTRIAL / COMMERICAL BOILER – TO MITIGATE CLIMATE CHANGE IMPACTS
Submitted to:
Fifth Annual California Climate Change Conference Sacramento, CA
September 8 - 10, 2008
Submitted by: Carlo Castaldini
CMCE, Inc. 2900 Gordon Ave, Suite 100, Santa Clara, CA 95051
Tel: 408-314-0382; [email protected]
and
Avtar Bining, PhD California Energy Commission
1516 - 9th Street, MS-47, Sacramento, CA 95814 Tel: (916) 657-2002; [email protected]
ABSTRACT Combined Heat and Power (CHP) is w idely recognized as one of the lowest cost options offering the greatest potential for increasing energy conservation and reducing carbon dioxide (CO2) emissions at sites burning fossil fuels to produce high quality heat and absorption cooling. However, CHP acceptance in California is poor due primarily to 5-7 years payback period resulting from mismatch of on-site thermal and power needs, low load factor and high capital investments. This poster presents results of a California Energy Commission funded ultra-clean simple-cycle 100 kWe microturbine integrated boiler CHP project. The CHP energy efficiency is up to 82% while meeting boiler and distributed generation emission standards in California w ith a small incremental investment repayable in <3 years. Retrofitting the existing 10-100 MMBtu/ hr size boilers in California w ith ultra-clean simple-cycle microturbines will potentially reduce CO2 emissions by 210,000 to 320,000 tons/ year; and thereby, mitigating the climate change impacts in California.
A-134

CADER Conference, San Diego, CA January 2008
NOVEL MICROTURBINE CHP INSTALLATION ON AN INDUSTRIAL BOILER
By
Carlo Castaldini 1 and Avtar Bining2
Industrial boilers offer an ideal heat sink for microturbines in CHP applications. This paper describes a novel simple cycle, unrecuperated, microturbine integrated with a Coen low-NOx burner that will be demonstrated on a packaged 36,000 lb steam/ hr industrial boiler located at the Hitachi heating plant in San Jose, California. The development and demonstration of this technology was undertaken under the CEC PIER program with match funds from Southern California Gas Company (SCG), Coen, and the host facility. The design of the integrated microturbine and burner assembly allows for an overall CHP efficiency exceeding 80 percent and the lowest investment and operating costs of any distributed generation system while meeting strict CARB 2007 and locally mandated boiler air permit emission limits. The microturbine employs a newly designed premixed silo combustor that reduces NOx emissions from an unrecuperated Elliott T-80 microturbine in compliance with 0.07 lb/ MWh CARB 2007 levels in CHP mode. The overall boiler NOx and CO emissions with the microturbine firing are maintained below the 15 ppm and 50 ppm limits, respectively, mandated by the Bay Area A ir Quality Management District (BAAQMD). CO2 emissions are also reduced by 1.3 lb/ lb steam via efficiency gains and voided grid power purchases.
1 Carlo Castaldini is president of CMCE, Inc. (dba CMC-Engineering), Santa Clara, California 2 Dr Avtar Bining is Program Manager at California Energy Commission PIER Program
A-135

GTI 2005, Orlando FL, February 2005
POWER GENERATION INTEGRATED IN BURNERS FOR PACKAGED INDUSTRIAL/COM M ERCIAL BOILERS
Carlo Castaldini
President CMC-Engineering
2900 Gordon Avenue, Suite 100-4 Santa Clara, CA 95051
and Steve Londerville (Coen Company)
Henry Mak (Southern California Gas Company)
ABSTRACT CMC-Engineering and Coen Company will develop and demonstrate new industrial burners with integrated capability for low-cost and fuel efficient distributed power generation. Under a program funded by the California Energy Commission(1) and Southern California Gas Company, CMC-Engineering and Coen will engineer, assemble and demonstrate a novel ultra low-NOx burner assembly with a microturbine generator embedded in the windbox to generate 80-kW of power, sufficient to render mid-size industrial/ commercial steam generators independent of grid power. By emphasizing thermal heat recovery and de-emphasizing prime mover efficiency, we have minimized capital investment and maximized fuel savings to make small-scale distributed generation (DG) most cost-effective and better integrated in the industrial process equipment and user practices. This paper describes the hardware selection and assembly and presents the benefits of this approach compared to conventional distributed generation systems. (1) A llan Ward is the Program Manager for the California Energy Commission (CEC) 7.0 INTRODUCTION
A-136

Conventional MTG-based CHP systems with exhaust reheat are the most
efficient and cleanest way of deploying small-scale DG. Current commercial CHP systems are modular in nature. They consist of a MTG package, typically equipped with costly recuperators to boost MTG efficiency, standing side by side with thermal heat recovery equipment such as an absorption chiller or steam boiler. The focus of ongoing improvements in CHP product development has emphasized boosting the performance of the prime mover without consideration to minimizing the cost and complexity of MTG, which is critical to enhancing the economic attractiveness of small industrial, commercial, and institutional DG. Our technology represents an important departure from this conventional CHP approach in that it de-emphasizes the efficiency of the MTG while letting the thermal component “take up the load” of fuel heat recovery and overall efficiency. In this way, the size, cost, and complexity of the CHP is significantly reduced while the CHP efficiency can be increased because the thermal unit always has a higher fuel utilization efficiency than prime movers. The other critical characteristic of current CHP systems is that none are truly packaged designs, except for the lower overall efficiency hot water commercial units being sold by most major prime mover vendors of small industrial, commercial or institutional CHPs for selected niche markets. Unfortunately, CHP systems without reheat of prime mover exhaust are limited in overall efficiency unless they utilize condensing heat exchangers, which introduce other important materials and operating considerations.
8.0 PROTOTYPE
CMC-Engineering and Coen Company will develop and demonstrate a CHP system that incorporates a MTG within the burner-windbox assembly used for packaged industrial, commercial, and institutional boilers. Contrary to conventional CHP where the design and operation often centers on power production, the proposed CHP will be designed around the thermal requirements of the user w ith the side benefit of co-generation of electricity. Thus, the technology is similar to conventional CHP systems but w ith the added innovation that the prime mover is embedded into the burner/ windbox assembly to make future small-scale CHP-DG less costly, more compact, and more integrated into a user-familiar product for the broader small industrial-commercial market. The IP-protected technology that we have selected recognizes that without reduced capital and operating costs and maximum thermal heat recovery, small-scale prime movers will have a limited role in distributed generation. By building the CHP around the thermal output and reducing the cost of the prime mover, more widespread DG is possible.
The initial demonstration CHP will use a Bowman/ Elliott 80-kWe MTG, also
referred to as Turbo-Alternator, that contrary to conventional CHP systems, w ill use only the core components consisting of: (a) the fuel compressor, (2) the oil-cooled air compressor and turbine assembly in its recuperated configuration, (3) a sub 5-ppm NOx burner, (4) the oil cooled generator, and (5) power control electronics. Depending on the size of the boiler, the hot exhaust and available combustion air from the MTG can be used to supply all or part of the vitiated air needed to fire the burner w ith additional
A-137

fuel (see Figures 1 and 2), such that the overall efficiency of the CHP can be maximized, approaching the thermal efficiency of the boiler itself (see Figure 3). Because mid to large industrial packaged steam generators pose the greater near-term opportunity for CHP, the proposed concept w ill integrate the 80-kW MTG with FD-fan supplemented air into one fully integrated CHP-windbox-burner assembly, dominated by thermal needs of the user rather than its power needs.
Figure 1. Relationship of boiler capacity with 80-kWe M TG in CHP mode
Tables 1, 2 and 3 illustrate the thermal performance of each component configured in the proposed CHP assembly. The MTG will be fitted in the geometry of the Coen FyrCompakTM standard windbox configuration. The power electronics will be integrated in the burner control cabinet. The overall integration is such that the foot print of the standard Coen package industrial burner assembly will not be increased. In its commercial configuration, the CHP capable burner w ill be able to be fitted to new and existing industrial boilers alike with relative ease. The selected ratios of power generation and boiler steaming capacity are such that all the power needs of the boiler auxiliaries (such as air blower w ith FGR intake or w ith separate FGR fan, feedwater pumps, etc) will be readily supplied by the MTG. Figure 4 illustrates the maximum size of the MTG in relation to the boiler nameplate firing capacity. The maximum generator size is determined by a combination of geometrical limitations of current FyrCompakTM assemblies, the turndown requirements of the boiler burner, and other factors. Within these limitations, three selected MTG sizes will be used for the development of commercial systems. In all cases, the MTG will be sufficient to provide all the power needs to render the boiler independent of the grid. This is an added incentive for certain
0
100
200
300
400
500
600
700
800
900
1000
0 5000 10000 15000 20000 25000 30000 35000
Boiler capacity, lb steam/hr
Boi
ler W
indb
ox T
empe
ratu
re, F
-200%
0%
200%
400%
600%
800%
1000%
1200%
1400%
1600%
1800%
2000%
Rat
ios
of C
ombu
stio
n A
ir or
Hea
t Inp
ut
T mix, FWindboxTemp w/FGR, FAirBoil/Air TurbHeat Boiler/ Heat Turbine
MTG= 80kWe; MTG Heat Rate = 21,500 Btu/kWh; Boiler = 150 psi steam; Fixed boiler excess O2= 2.5%; Boiler thermal efficiency = 85%
A-138

installations affected by grid power interruptions or for remote areas. Boilers w ith firing capacities greater than 150 MMBtu/ hr provide other design options because air blowers become too large to be used in traditional FyrCompakTM assemblies.
Figure 2. Equivalent FGR and FGR requirements for conventional low NOx
industrial boiler burners All CHP systems provide some benefit to the ratepayers in the state where they are installed. This is because CHP, as a whole, makes better use of fuels thus reducing the dependence on out-of-state sources of fuel; reducing the cost of energy for industry thus making it more competitive; providing greater independence from grid power; and reducing the level of pollutants based solely on reduced levels of fuel consumption. Our power burner technology, thus, offers all of these benefits as well. In addition, because of our focus on integrating the power generation component into a commercial burner assembly and reducing its cost, we offer the advantages of reduced capital investment, higher overall fuel efficiencies, and reduced emissions. These advantages will provide greater incentives to the market place for adoption of CHP in small industrial, commercial and institutional steam generators. In its final commercial design, the power burner will be designed so that it is a feasible replacement of existing packaged boiler burners. Thus, a large population of installed and operating packaged boilers, as well as sales of new packaged boilers, would benefit from adopting the CHP option. Because ultra low NOx technologies will be implemented in both the MTG combustor and the burner, the CHP system will also provide incentives for replacement of higher polluting burners, for a dual benefit of reducing emissions and addition of clean burning DG.
0.0%
5.0%
10.0%
15.0%
20.0%
25.0%
30.0%
35.0%
40.0%
45.0%
0 5000 10000 15000 20000 25000 30000 35000
Boiler lb steam/hr
FGR
rate
s
Equivalent FGR rateAdded FGR for 20% burner FGR
80 kW MTG; 2.5% O2 in boiler flue gas
A-139

Figure 3. Overall fuel efficiency of CHP with 80-kWe M TG in DG assembly with
variable size industrial boilers Therefore, the anticipated advantages of this power burner CHP system for industrial boilers can be summarized as follows:
• Seamless integration of DG into a burner equipment that users are familiar w ith • Reduced DG cost by eliminating recuperator and other auxiliaries • Potential high pressure gas supply at industrial plants • Eliminate most of installation cost by novel integrated design, w ith no increase in
overall burner foot-print • Reduced maintenance of DG by removing high maintenance components • Maximum recovery of waste heat from DG exhaust and components • Improved flame stability in the boiler at low loads • More efficient and faster boiler startup • Reduced FGR requirements • One vendor maintenance and support
79.50%
80.00%
80.50%
81.00%
81.50%
82.00%
82.50%
83.00%
83.50%
84.00%
84.50%
85.00%
0 5000 10000 15000 20000 25000 30000 35000
Boiler lb steam/hr
CH
P Ef
ficie
ncy,
%
Accounting for auxl.powerw/o aux. power
80 kW MTG - 14.6 % efficient
A-140

Table 1. M icroturbine performance objectives – Thermal performance All Btus are on LHV basis Target %Energy Losses Target LHV Used HHV MICROTURBINE - Heat Input - NG Fuel to Combustor MMBtu/hr 1.95 99.2% 2.16 kW 572 633 - NG Fuel Compressor Input MMBtu/hr 0.016 0.8% 0.016 kW 4.63 4.63 - Total Energy Input MMBtu/hr 1.97 100.0% 2.18 kW 576 638 - Heat Output - Generator Output MMBtu/hr 0.273 13.9% 86.1% 0.273 kW 80 80 - Turbine Exhaust MMBtu/hr 1.64 83.4% 16.6% 1.85 kW 481 542 - Generator Coolant MMBtu/hr 0.018 0.9% 99.1% 0.018 kW 5.4 5.4 - Radiant Losses (Elect+MTG) MMBtu/hr 0.014 0.7% 99.3% 0.014 kW 4.02 4.02 - Total Energy Output & Losses MMBtu/hr 1.95 98.9% 1.1% 2.16 kW 570 0 633
Photograph of Turbo A lternator provided by Bowman Power Systems and Elliott Power Systems
A-141

Table 2. Boiler performance objectives in CHP Configuration – Thermal Performance . Photographs provided by Coen Company of Burlingame, CA
A-142

Table 3. CHP performance objectives – total system efficiency
Figure 4. Auxiliary power needs for boiler-CHP versus commercial scale DG capability
The current arrangement calls for the placement of the generator and microturbine air filter outside of the microturbine windbox section. The placement of the generator outside the windbox is recommended because the microturbine is oil-cooled and it is safer to place any oil connections outside the windbox to prevent potential fires during unexpected leaks. Advanced microturbine designs, such as Capstone machines, have air bearings and would thus not require this cooling arrangement. Therefore, an alternate commercial design could likely not include an oil cooler and tank, further simplifying the system. The oil is currently cooled with a water-oil heat exchanger. In its current arrangement, we plan to insert a radiator heat exchanger upstream of the microturbine section to cool the water in a closed loop arrangement. Upstream and downstream of the heat exchanger, there will be perforated plates to provide more uniform
CHP SYSTEM %MTG %Boiler - Total Energy In MMBtu/hr 45.64 4.3% 95.7%
kWt 13375 - Total Useful Energy Out MMBtu/hr 40.67 0.67% 99.3%
kWt 11921
CHP Efficiency LHV === 89.1% HHV ==== 80.6%
Fuel Used to Generate Electricity MMBtu/hr 0.294kWt 86.1
Net Generator Output MMBtu/hr 0.273kWe 80
Electricity Generation Efficiency LHV === 93% HHV ==== 84.0%
A-143

flow. The pressure drop across the microturbine section and the burner windbox assembly is expected to be a maximum of about 6.5 inches of water at a full load of 50 MMBtu/ hr. 9.0 COST SAVINGS
Figure 5 illustrates the relative cost of packaged microturbine components. Fully installed costs typically average $1,500/ kW and can range up to $1,800/ kW in some cases. Because of the integration of the microturbine and ultra low-NOx combustor assembly within the burner FyrCompakTM w indbox-blower assembly, about ½ of the overall cost can be avoided, significantly improving the economic attractiveness of small-scale DG at industrial plants. It is also possible that at some plants, high pressure gas may be available. Though the supply pressure cannot always be guaranteed, some installations may avoid the need for fuel compressors, or at worst reduce the operating costs associated with supplying fuel to the microturbine.
Figure 5. Retail cost of turnkey microturbine generators(2) 10.0 M ARKET CONSIDERATIONS
Figure 6 illustrates the result of a recent market assessment of distributed generation in
combined heat and power applications. Out of a total of 11 GW of CHP-DG potential, 39% applies to system where the prime mover provides the oxidant for the boiler. Most industrial facilities that operate packaged industrial boilers that could be target for CHP-DG utilize electrical power well in excess of 75 kW. Figure 7 gives estimates of the California electricity
A-144

generation based on the retrofit of 25% of the current population of packaged single-burner boilers (market penetration) each with an 80kWe MTG coupled with Coen burner/ windbox assembly. As indicated, this level of retrofit will total about 30 MWe of DG capacity, which will be sufficient to satisfy the electricity needs of the auxiliary equipment of each boiler plus provide about 15 MWe to the power grid. Figure 8 provides estimates of the potential fuel savings associated with the generation of electricity w ith the proposed CHP assemblies versus the current mix of old Rankine plants and newer combined cycle plants based on the potential 30 MWe of CHP generating capacity coupled with industrial/ commercial steam generation. The total savings in natural gas consumption amount to about 170,000 MMBtu/ yr, or 170 million cft/ yr of fuel. Nationwide, these estimates are multiplied by a factor of about 20(1)
Figure 6. Summary Results by System Type – 11 GW Total Economic M arket Potential3
Figure 7. Estimates of DG capacity potential in California
0
1
10
100
20 40 60 100 150
10 20 40 60 100
Boiler steam capacity range, 1000 lb/hr
Pote
ntia
l CHP
gen
erat
ing
capa
city
, MW
e
10
100
1000
uels
sav
ingn
s, M
illio
n cf
t/yr
Oxidant for Central Boiler System, 39%
Industrial Air Heating, 22%
Direct Contact Water Heater,
23%
Indirect Liquid Heater, 9%
Convection Ovens for Metals Fabrication, 7%
A-145

Figure 8. Estimates of fuel savings potential in California
Only the MTG requires a gaseous fuel such as natural gas or low Btu biogas. The boiler,
in this CHP arrangement can be operated with liquid or opportunity low-Btu fuels. Combustion air preheat w ill provide added benefits for stable ignition and more complete combustion of low volatile liquid or solid fuels. Because the MTG will operate without a recuperator and, when combined with FD fan for added combustion air, w ith little and no insulation, the high temperature in the preheated vitiated air w ill have important considerations on the design of the burner and windbox assembly to meet ultra low NOx emissions and FGR needs. Redesign of the insulation and acoustic controls normally accompanying conventional MTG packaging may be necessary to prevent resonance with windbox and excessive heat losses. In addition, the integration of the MTG inside the windbox plenum will necessitate (1) redesign of the combustor, for ease of maintenance and for low NOx emissions (even with some excess CO), (2) redesign of windbox assembly to allow the framing necessary for safe MTG operation; (3) minimize pressure losses and permit effective mixing and gas distribution to the burner in a minimum transition space. References:
1. “ Analysis of the Industrial Boiler Population” . Topical Report prepared by Energy and Environmental Analysis, Inc. for Gas Research Institute, June 1996.
2. “ Assessment of Distributed Resource Technologies,” EPRI Technical Report TR-114180, Dec 1999.
3. “ Assessment of Replicable Innovative Industrial Cogeneration Applications,” Resource Dynamics Corporation, June 2001
A-146

1.19. Task 20 – Production Readiness Plan This project demonstrated the novel integration of a low-NOx simple cycle microturbine with a packaged ULN industrial size burner. The technology is ready for commercialization as a CHP retrofit on existing packaged industrial and commercial boilers ranging from 5 to 150 MMBtu/hr. CMC-Engineering secured the supply of ARB 2007 compliant simple cycle microturbines from Calnetix and supply of Coen ULN burners. The selection of ULN burner and design of the burner interface will depend on each boiler site, boiler capacity, air permit levels, and boiler operating requirements. The widespread acceptance of this technology in the industrial and commercial steam generating community will hinge principally on the successful demonstrations of this technology and the available economic benefits which are driven by the spark spread, i.e., the difference in price between electricity and natural gas fuel. As discussed in the recommendation section, California agencies can assist in the deployment of this energy saving technology by providing emissions and green house gas credits to reduce the capital investment beyond the gains achieved in this project.
CMCE, Inc., Coen and Calnetix have agreed to support the commercialization of this technology and the pursuit of CHP in the industrial boiler sector. Interested industrial users should contact CMCE, Inc. in Santa Clara, CA or Coen for a no-cost evaluation of the retrofit potential and ROI by using this CHP technology at their site
An important component of the commercialization success of this technology is the anticipated costs to upgrade the CHP components to meet the 100 kWe generating capacity of the CPS microturbine and to manufacture, install, and service the technology in industrial and commercial plants. Industry profit margins dictate the sale price of technology to the potential markets.
Table 11 lists estimates of the various costs associated with the launching of the first commercial unit. The cost estimates include remaining development and manufacturing of first complete CHP systems: These estimates are based on retrofit of a 30 MMBtu/hr boiler and include the cost of CHP components provided by CMC-Engineering, CPS and the ULN burner vendor. The cost of the ULN burner will vary significantly among different burner vendors. Therefore a range in cost is presented. Additional development is considered for the upgrade of the silo combustor dimensions to increase its firing capacity for a 100 kWe microturbine, now standard commercial unit sold by CPS.
A-147

Table 1 Estimated Development and Manufacturing Costs for Commercial CHP Systems
Cost Category Component Estimated Cost
Remaining Development
Increased capacity silo combustor for simple cycle 100 kWe CPS microturbine
$50,000
Sale of Microturbine Components
CPS supplied equipment:
• 100 kWe microturbine with new housing
• Gas compressor and power electronics
• Minor components and spare parts
$60,000
$31,000
$9,000
Manufactured Components
CMC-Engineering supplied equipment
• Low-NOx silo combustor
$10,000
• Microturbine enclosure and assembly and windbox interface
$32,000
Burner vendor components
• Coen ULN
• ST Johnson ULN
$200,000
$80,000
Installation Mechanical and electrical contractors $40,000
Startup and Commissioning
Engineering and field service contractors $24,000
Total cost of first commercial 100 kWe CHP installation $336,000 - $456,000
A-148