power generation: a continued role for coal?
TRANSCRIPT

© OECD/IEA 2014
Power Generation: A Continued Role for Coal?
Clean Coal DayTokyo, Japan
8-9 September 2015
Keith BurnardHead, Energy Supply Technology UnitInternational Energy Agency

Founded in 1974
• as an autonomous agency of the Organisation for EconomicCooperation and Development (OECD)
29 Member Countries
• Asia Pacific: Australia, Japan, Republic of Korea and New Zealand• North America: United States, Canada• Europe: Austria, Belgium, Czech Rep, Denmark, Estonia, Finland, France, Germany, Greece, Hungary, Ireland, Italy, Luxembourg, Netherlands, Norway, Poland, Portugal, Slovak Republic, Spain, Sweden, Switzerland, Turkey and United Kingdom
• European Commission also participates in the work of the IEA• Chile is in the process of accession to become a member of the IEA
Headquarters: Paris
Decision‐making Body: Governing Board
• Consists of member country representatives• Under the Governing Board, several committees are focusing on each area
Secretariat:
• Staff of around 230, mainly energy experts and statisticians from its member countries
The International Energy Agency

© OEC
D/IEA 2014
IEA 3 Es
Energy Security
•Promote diversity, efficiency and flexibility within the energy sectors of the IEA member countries. Remain prepared collectively to respond to energy emergencies. Expand international cooperation with all global players in the energy markets.
Environmental Protection
•Enhance awareness of options for addressing the climate change challenge. Promote greenhouse gas emission abatement, through enhanced energy efficiency and the use of cleaner fossil fuels. Develop more environmentally acceptable energy options.
Economic Growth
•Ensure the stable supply of energy to IEA member countries and promote free markets in order to foster economic growth.

© OEC
D/IEA 2014
4
With globally recoverable reserves of hard coal and lignite at over 1 trillion tonnes, coal is abundant and, with recoverable reserves in around 75 countries, it is widely available. Sufficient reserves of coal for over 120 years of generation at current consumption rates.
Coal is abundant and widely available
Source: IEA (2013), Resources to Reserves, OECD/IEA
Global hard coal reserves: 728 Gt Global lignite reserves: 275.5 Gt

© OEC
D/IEA 2014Coal production
0
1000
2000
3000
4000
5000
6000
7000
2000 2001 2002 2003 2004 2005 2006 2007 2008 2009 2010 2011 2012 2013
OECD Total
China
World
Mt

© OEC
D/IEA 2014Demand for coal continues to rise
If current trends continue, coal will surpass oil within the next 5 years.
0
5
10
15
20
25
30
35
40
2000
2001
2002
2003
2004
2005
2006
2007
2008
2009
2010
2011
2012
WorldOECD TotalChina
EJ
Coal28%
Oil32%
Natural gas21%
Nuclear5%
Renewables14%
Total final consumption of coal Primary energy demand mix, 2012
© OEC
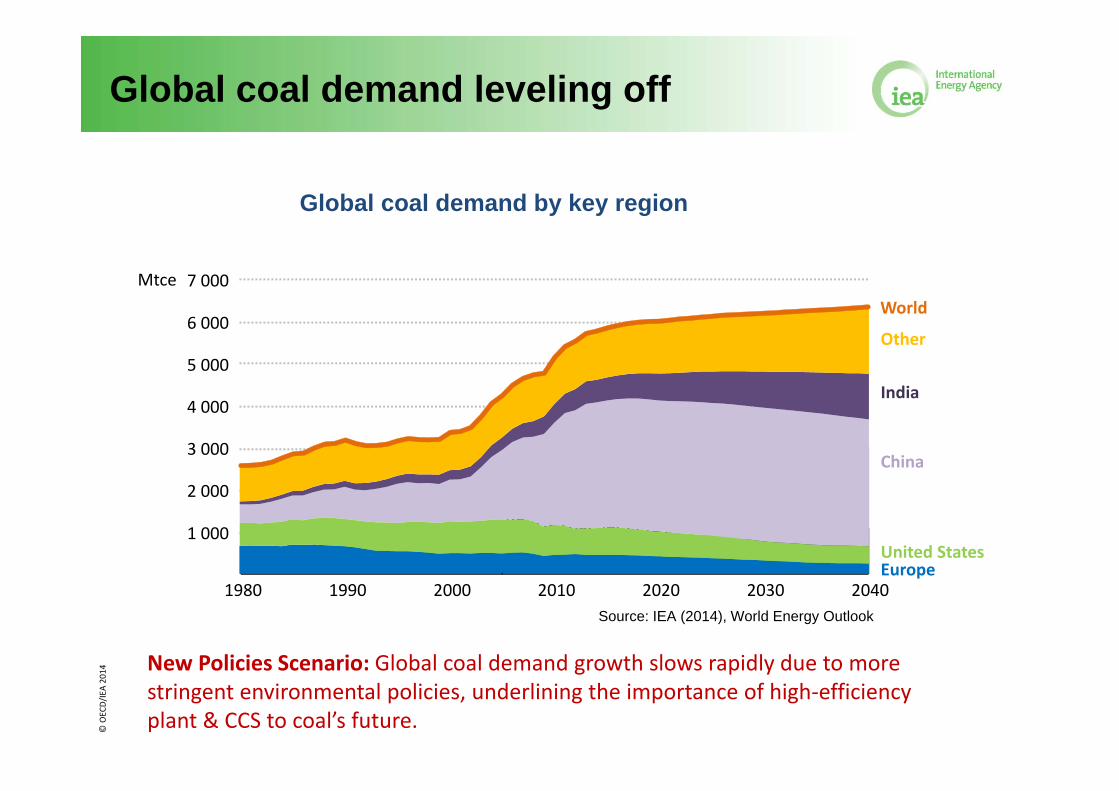
D/IEA 2014Global coal demand leveling off
India
World
1 000
2 000
3 000
4 000
5 000
6 000
7 000
1980 1990 2000 2010 2020 2030 2040
Mtce
1987: European coal demand peak2005: US coal demand peak
Chinese coal demand plateau
India: 2nd largest coal consumer by 2020
Other
India
China
United StatesEurope
Global coal demand by key region
New Policies Scenario: Global coal demand growth slows rapidly due to more stringent environmental policies, underlining the importance of high‐efficiency plant & CCS to coal’s future.
Source: IEA (2014), World Energy Outlook

© OEC
D/IEA 2014
Coal is the backbone of electricity
Opportunities to decarbonise the electricity mix exist in non‐OECD countries.
0% 20% 40% 60% 80% 100%
United States
Other OECD Americas
European Union
Other OECD
China
India
Africa
Middle East
Other developing Asia
Eastern Europe and FSU
Non‐OECD Americas
2012
Coal Oil Natural gas Biomass and waste Hydro Solar PV STE Wind Other renewables Nuclear
41%

© OEC
D/IEA 2014
Net change in power generation capacity by fuel, 2013-40
New Policies Scenario: Both coal and gas will account for almost one‐quarter of total global installed capacity by 2040. China will still be the main constructor of coal‐fired plants.
Source: IEA (2014), World Energy Outlook

© OEC
D/IEA 2014Performance drivers …
Pollutants China EU US
SO2 NewExisting
100200/4001
200400
160160/6403
NOx NewExisting
100100/2004
500/2002500/2002
117117/160/6405
PM New & Existing 30 50 22.5
Mercury NewExisting
0.030.03
‐‐
0.0010.002
Air pollution emission standards for coal-fired plants in China, EU and the US (mg/m3)
1) 400 for four provinces with high-sulphur coal2) 500 until end 2015; 200 as from 20163) 160 for plants built 1997-2005; 640 for plants built 1978-19964) 100 for plants built 2004-2011; 200 for plants built before 20045) 117 for plants built after 2005; 160 for plants built 1997-2005; 640 for plants built 1978-1996
Source: WRI (2012)
… air pollution

© OEC
D/IEA 2014
60% to 65% CO2
emissions reduction per unit of
GDP compared to
2005
Non‐fossil sources to provide 20% of primary energy mix
2030 Target
2030 Target
2012 Energy Mix
Carbon intensity trends
Performance drivers …
China’s Intended nationally determined contributions
… climate change
© OEC
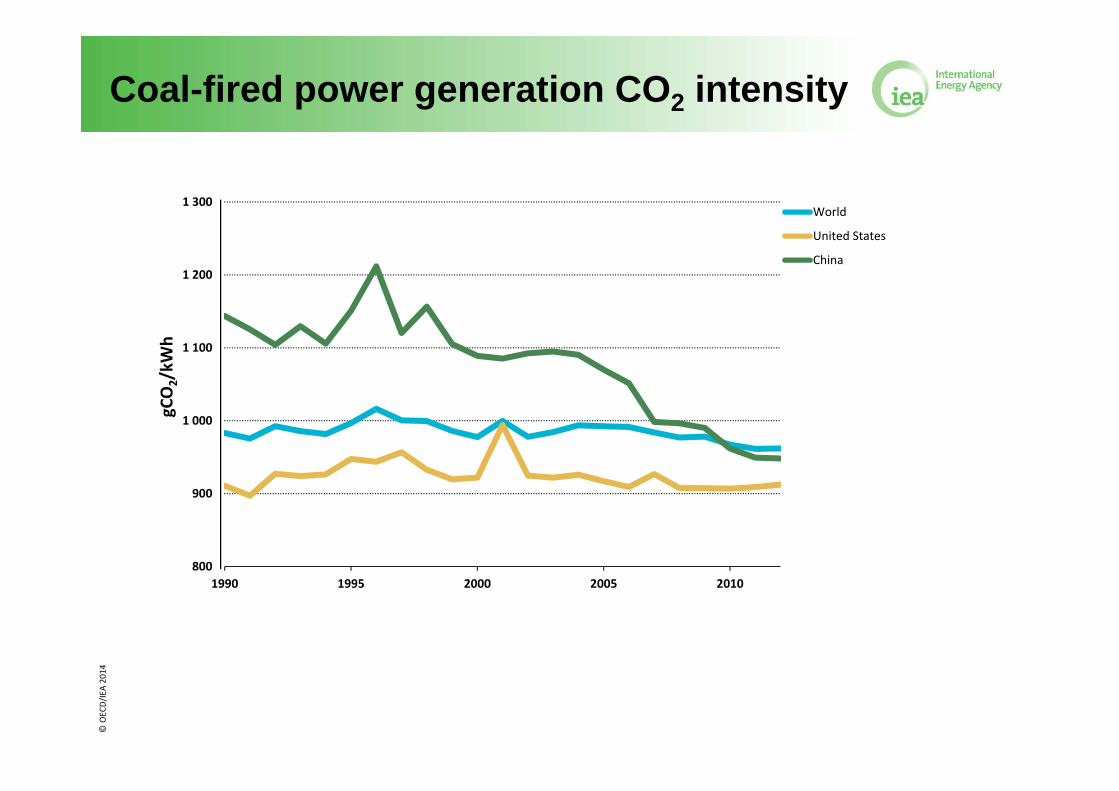
D/IEA 2014Coal-fired power generation CO2 intensity
800
900
1 000
1 100
1 200
1 300
1990 1995 2000 2005 2010
gCO2/kW
h
World
United States
China
© OEC
D/IEA 2014
0
5
10
15
20
25
30
35
40
45
0
5
10
15
20
25
30
35
40
45
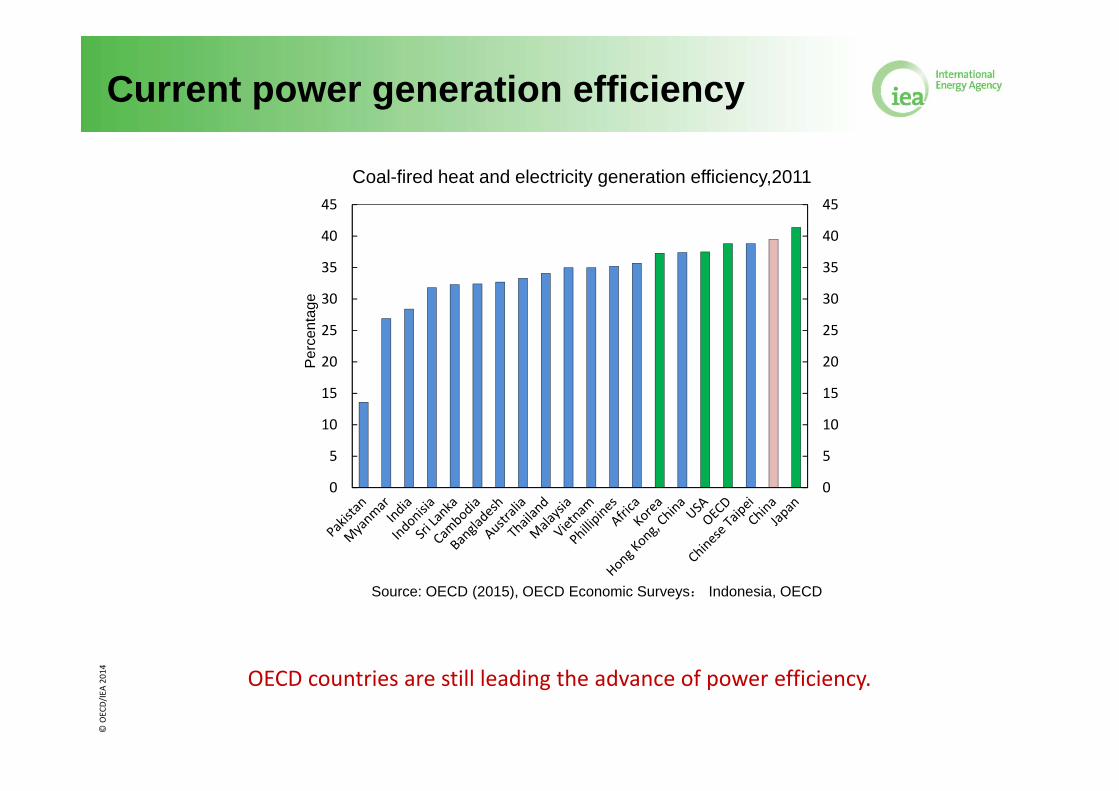
Current power generation efficiency
Per
cent
age
Coal-fired heat and electricity generation efficiency,2011
Source: OECD (2015), OECD Economic Surveys: Indonesia, OECD
OECD countries are still leading the advance of power efficiency.

© OEC
D/IEA 2014Projections on technology and efficiency
New Policies Scenario: In China, the share of generation from supercritical and high efficiency coal capacity rises from around one‐third to two‐thirds over 2011‐2035, raising average efficiency from 36% to 40%.
Source: IEA (2013), World Energy Outlook
© OEC
D/IEA 2014
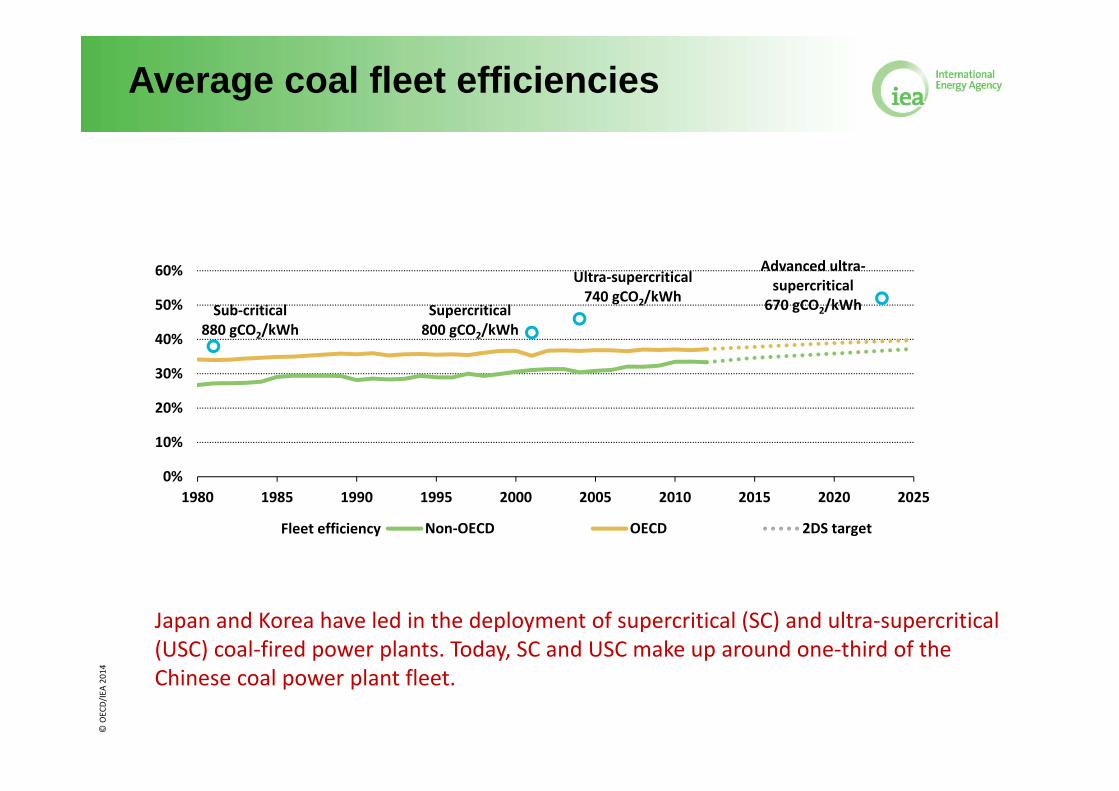
Sub‐critical 880 gCO2/kWh
Supercritical 800 gCO2/kWh
Ultra‐supercritical 740 gCO2/kWh
Advanced ultra‐supercritical
670 gCO2/kWh
0%
10%
20%
30%
40%
50%
60%
1980 1985 1990 1995 2000 2005 2010 2015 2020 2025
Non‐OECD OECD 2DS targetFleet efficiency
Average coal fleet efficiencies
Japan and Korea have led in the deployment of supercritical (SC) and ultra‐supercritical (USC) coal‐fired power plants. Today, SC and USC make up around one‐third of the Chinese coal power plant fleet.

© OEC
D/IEA 2014
Ultra‐supercritical steam conditions25 MPa, 604°C/612°C
Efficiency: >44.7% (LHV) Capacity: 4 x 1000 MWe units (4000 MWe)Coal: bituminousEmissions:NOx ≤ 100 mg/m3
SO2 ≤ 100 mg/m3
particulates ≤ 15 mg/m3
Best practice pulverised coal plants
Huaneng Yuhuan
Ultra‐supercritical steam conditions25 MPa, 600°C/610°C
Efficiency: >42% (LHV) Capacity: 2 x 600 MWe units (1200 MWe)Coal: bituminousEmissions:NOx ≤ 20 mg/m3
SO2 ≤ 6 mg/m3
particulates ≤ 1 mg/m3
Isogo New Units 1 & 2
© OEC
D/IEA 2014
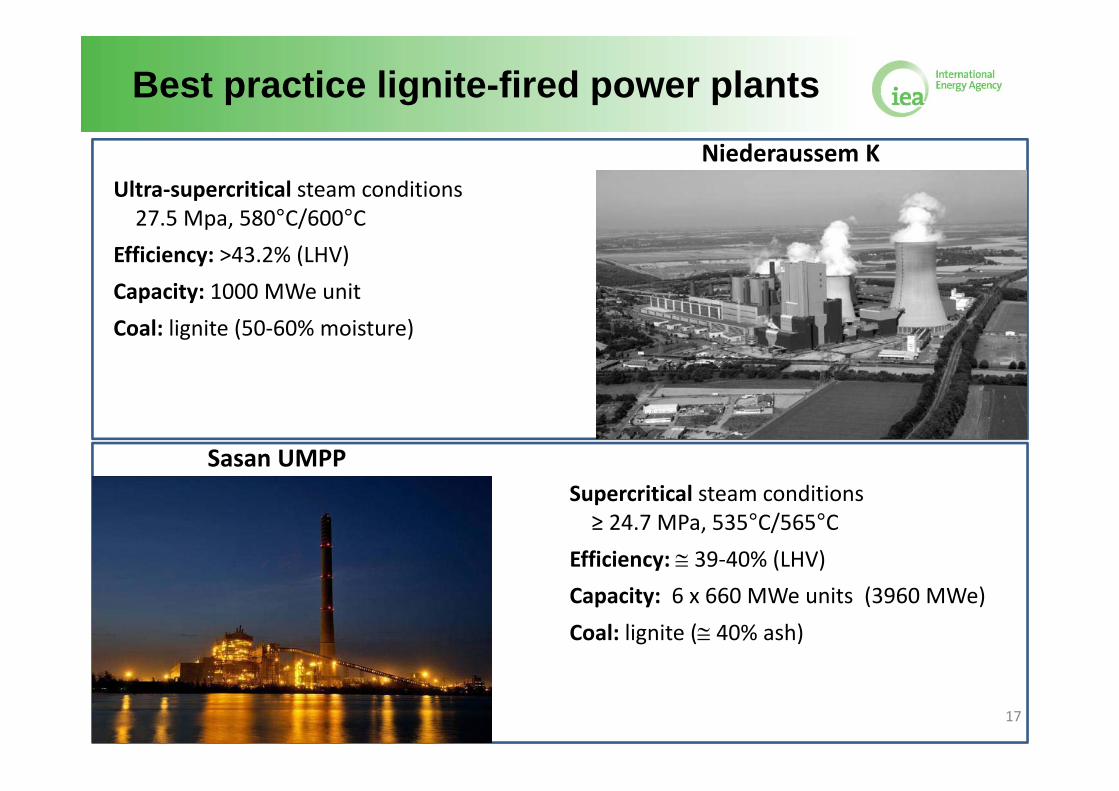
Ultra‐supercritical steam conditions27.5 Mpa, 580°C/600°C
Efficiency: >43.2% (LHV) Capacity: 1000 MWe unitCoal: lignite (50‐60% moisture)
Best practice lignite-fired power plantsNiederaussem K
17
Supercritical steam conditions≥ 24.7 MPa, 535°C/565°C
Efficiency: 39‐40% (LHV) Capacity: 6 x 660 MWe units (3960 MWe)Coal: lignite ( 40% ash)
Sasan UMPP

© OEC
D/IEA 2014Integrated gasification combined cycle
With the latest 1 500°C‐class gas turbines, efficiencies of 50% (LHV, net) may be achievable.

© OEC
D/IEA 2014
Plant began commissioning on syngas in November 2012
Capacity: 250 MW
Best practice IGCC plantsGreenGen IGCC
19
Edwardsport IGCCPlant began commissioning on syngas in June 2013
Capacity: 618 MW

© OEC
D/IEA 2014Retirements in the power sector
Power capacity by source, 2013‐2040
2013
Retirements Additions
2040
2 000
4 000
6 000
8 000
10 000
12 000GW
Renewables
Nuclear
Oil
Gas
Coal
Despite limited demand growth, OECD countries account for one‐third of capacity additions – to compensate for retirements & to decarbonise
© OEC
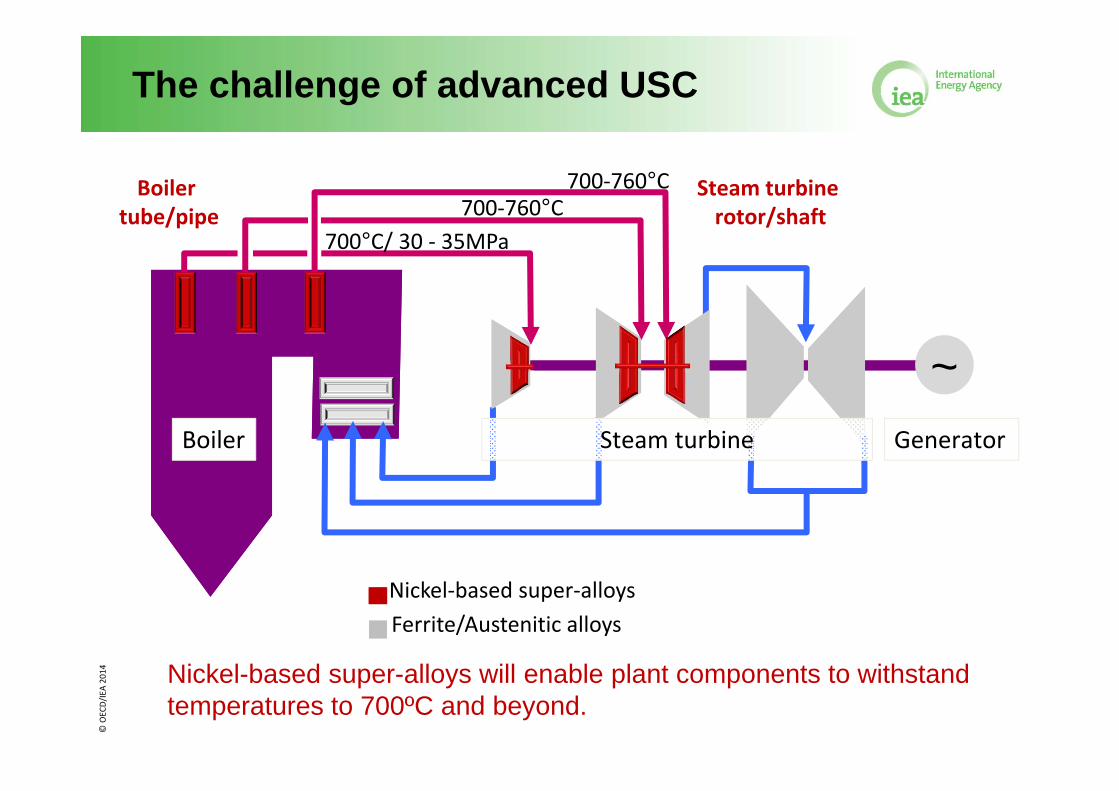
D/IEA 2014The challenge of advanced USC
Nickel-based super-alloys will enable plant components to withstand temperatures to 700ºC and beyond.
Boiler tube/pipe
Steam turbine rotor/shaft
Generator
~Boiler Steam turbine
700‐760°C
700°C/ 30 ‐ 35MPa 700‐760°C
Nickel‐based super‐alloys Ferrite/Austenitic alloys
© OEC
D/IEA 2014
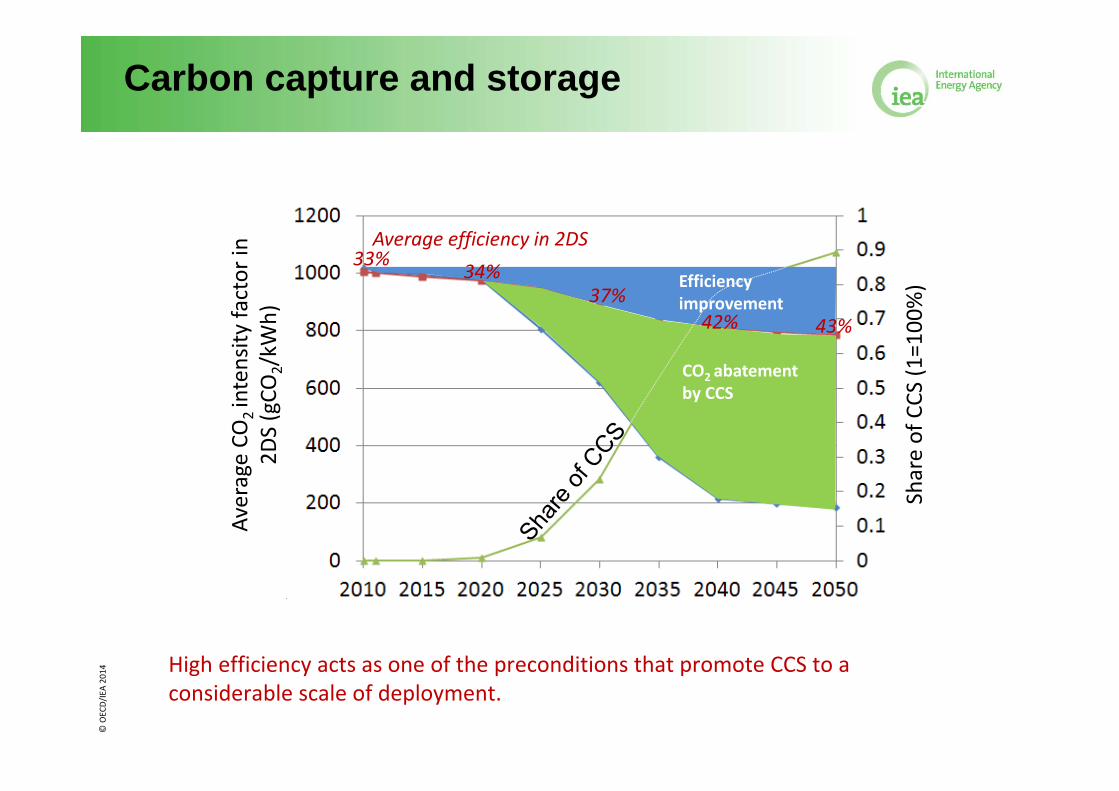
Share of CCS
(1=100%)Efficiency
improvement
CO2 abatement by CCS
Average CO
2 intensity
factor in
2D
S (gCO
2/kW
h)
33% 34%37%
42% 43%
Average efficiency in 2DS
Carbon capture and storage
High efficiency acts as one of the preconditions that promote CCS to a considerable scale of deployment.

© OEC
D/IEA 2014 Size: 110 MW Fuel: lignite Capture rate: 90% of CO2, 100% of SO2
Capture per annum: 1 million tonnes
Source: SaskPower
Boundary Dam 3: launched on 2 October 2014
First commercial power plant with capture

© OEC
D/IEA 2014
As large point sources of CO2 emissions, power generation must take the lead in emissions reduction.
In the short-to-medium term, efficiency improvements to new and existing plants bring significant benefits.
At the same time, ageing, inefficient plant must be retired.
Advanced, highly efficient coal-fired plant must be promoted.
R,D&D must continue.
For deep cuts in CO2, carbon capture and storage (CCS) has a critical role to play.
Coal can continue to have a major role ...
… but only if CO2 emissions and other environmental concerns are addressed. So,
