power demand and production per single family residence in
TRANSCRIPT

Power Demand v. Photovoltaic Generating
Capacity per Single – Family Residence in
Newburyport, MA
Presented by Dave Strohschein for GPH 903 on April 24th, 2012

Original Utility Grid

Traditional Metering
LOAD
$$$

Residential Power Generation (and Storage)

Residential Power Generation (and Storage)

Original Utility Grid

Evolving Utility Grid
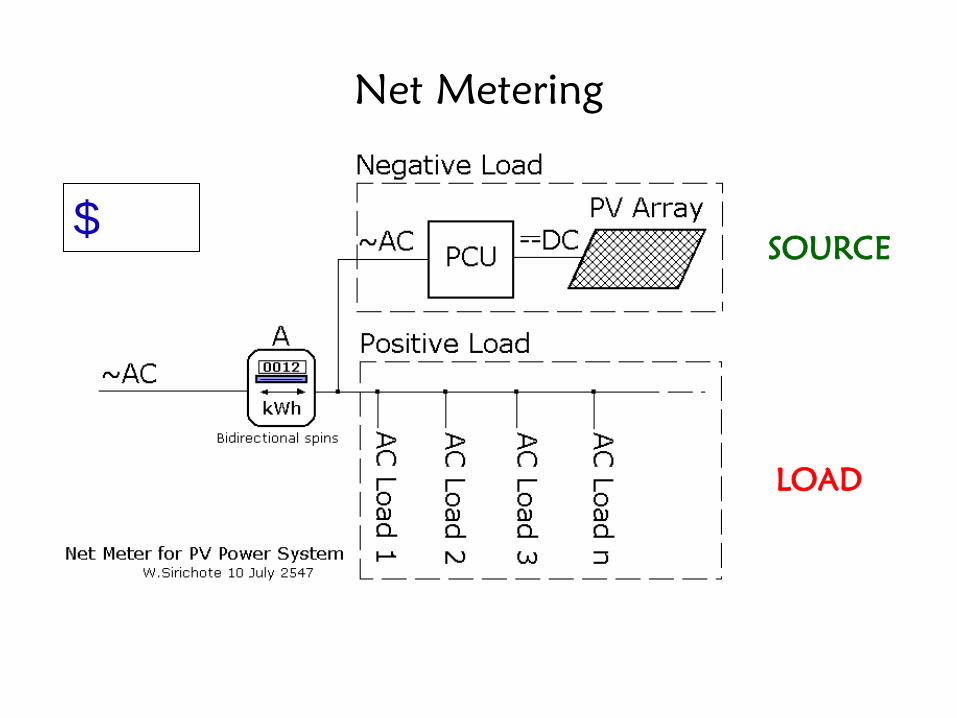
Net Metering
SOURCE
LOAD
$

Objectives (Resources)
Solar Insolation Data
Single Family Residence
Process Data

Month
ArcM
ap
No
Trees
Electri
cal
(11%)
(kWh/
Mont
h)
ArcMap
Trees
Electrical
(11%)
(kWh/Mo
nth)
PVWatts
Electrical(
11%)
(kWh/Mo
nth)
ArcMap
Tilted
Panel
No Trees
Electrical
(11%)
(kWh/Mo
nth)
ArcMap
Tilted
Panel
Trees
Electrical
(11%)
(kWh/Mo
nth)
Tilted Panel
PVWatts
Electrical(11
%)
(kWh/Mont
h)
January 438 375 713 766 655 1245
February 680 639 954 1028 966 1442
March 1344 1284 1601 1658 1583 1975
April 1865 1804 1826 1939 1875 1899
May 2432 2357 2270 2267 2198 2116
June 2502 2441 2320 2189 2137 2031
July 2461 2407 2362 2237 2187 2147
August 2133 2059 2133 2168 2093 2169
September 1483 1430 1639 1753 1690 1937
October 822 792 1201 1178 1134 1720
November 435 388 745 713 637 1222
December 310 257 620 577 477 1153
Objectives (Results)
Source of Power
Local
Grid
Electrical Power Generating Capacity per
Single – Family Residence per Month

Methods and Data (Previous Approaches)

Methods and Data (Previous Approaches)
Residential

Methods and Data (Previous Approaches)
Insolation
Electricity
Residential
Conversion
Efficiency

Methods and Data (This Work)
Insolation
Electricity
Single Family
Home
(Newburyport)
Conversion
Efficiency
Average Solar
Insolation
Average Monthly
Power Demand V.

Newburyport Single Family Parcels
Newburyport
Parcels
Single Family
Land Use
Single Family
Parcels

Single Family
Parcels
Newburyport
Orthophoto
Calculate Average Roof Area
EXCEL
Spreadsheet
Random Sampling
129 square meters / home

Newburyport Elevation Raster
Elevation Raster
Mosaic

Newburyport with 50% Trees

Solar Insolation Calculation (PVWatts)
40
km
EXCEL
Spreadsheet
40 km
NBPT No Elevation Data
Flat and Tilted Panels

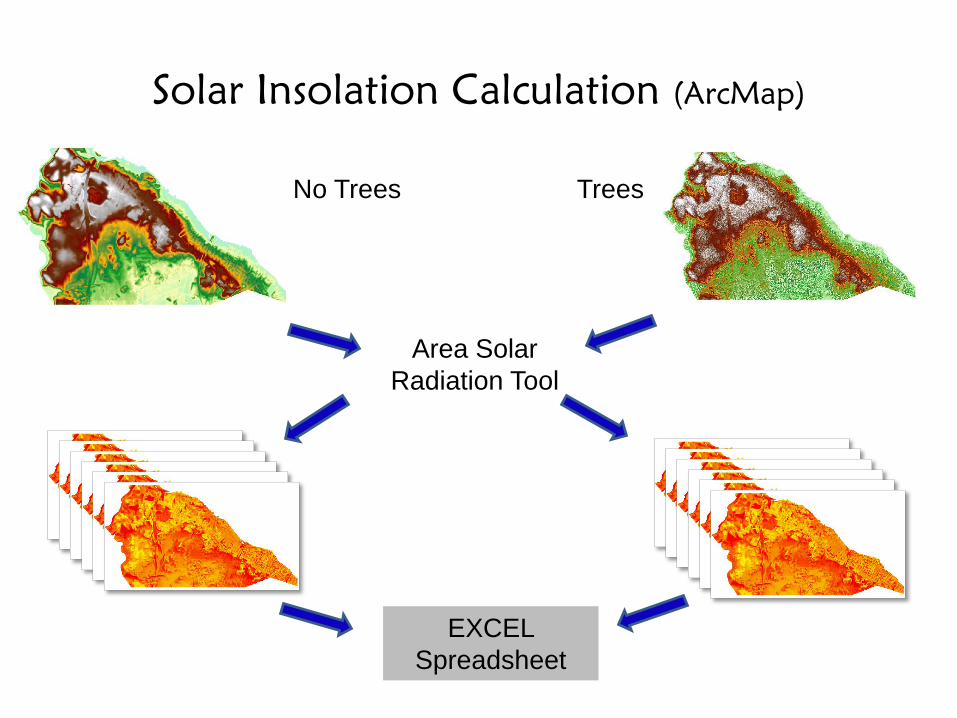
Solar Insolation Calculation (ArcMap)
No Trees
Area Solar
Radiation Tool
Trees
EXCEL
Spreadsheet

Results
Month
ArcMap
No Trees
Electrical (11%)
(kWh/Month)
ArcMap
Trees
Electrical (11%)
(kWh/Month)
PVWatts
Electrical(11%)
(kWh/Month)
ArcMap
Tilted Panel
No Trees
Electrical (11%)
(kWh/Month)
ArcMap
Tilted Panel
Trees
Electrical (11%)
(kWh/Month)
Tilted Panel
PVWatts
Electrical(11%)
(kWh/Month)
January 438 375 713 766 655 1245
February 680 639 954 1028 966 1442
March 1344 1284 1601 1658 1583 1975
April 1865 1804 1826 1939 1875 1899
May 2432 2357 2270 2267 2198 2116
June 2502 2441 2320 2189 2137 2031
July 2461 2407 2362 2237 2187 2147
August 2133 2059 2133 2168 2093 2169
September 1483 1430 1639 1753 1690 1937
October 822 792 1201 1178 1134 1720
November 435 388 745 713 637 1222
December 310 257 620 577 477 1153
667kWh Average Monthly Demand

Conclusion / Discussion
• ArcMap v. PVWatts
Weather
Panel Tilt
Topography
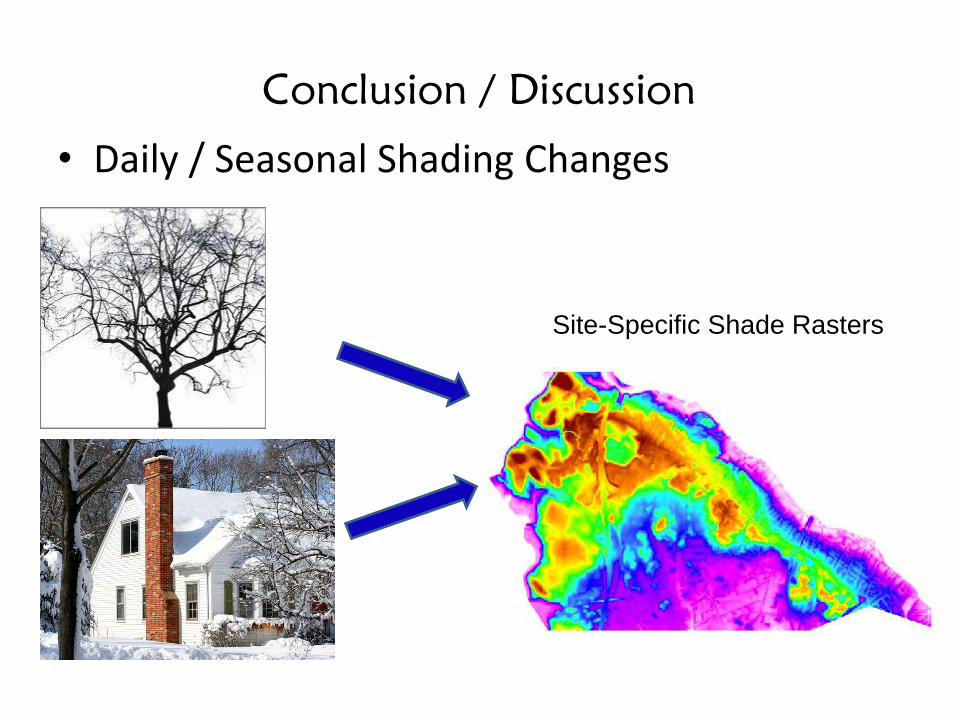
Conclusion / Discussion
• Daily / Seasonal Shading Changes
Site-Specific Shade Rasters
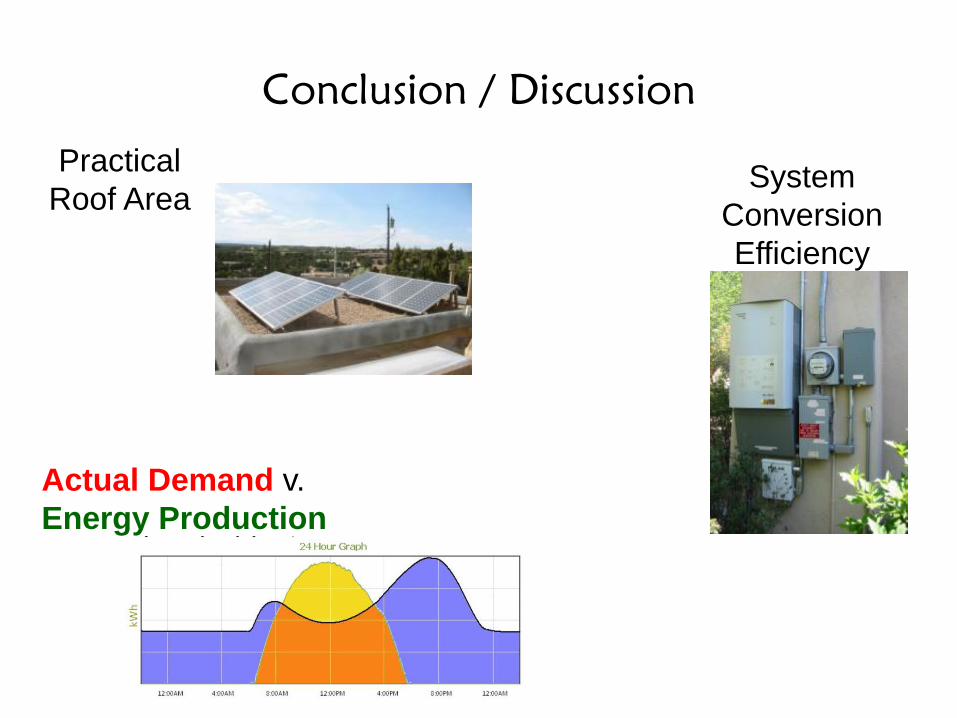
Conclusion / Discussion
Practical
Roof Area System
Conversion
Efficiency
Actual Demand v.
Energy Production

Net Metering
SOURCE
LOAD
$
Citations / Sources
http://wsgw.mass.gov/data/gispub/shape/landuse/LANDUSE2005_POLY_ESSE.exe (accessed
April 2012)
http://wsgw.mass.gov/data/gispub/dtm/d249950.exe, d253950.exe (accessed April 2012).
http://wsgw.mass.gov/data/gispub/shape/state/towns.exe (accessed April 2012).
http://wsgw.mass.gov/data/gispub/images/bwoq90s_hm_sid/249950.zip, 253950.zip (accessed
April 2012).
http://mapserve3.nrel.gov/PVWatts_Viewer/index.html (accessed April 2012).
http://wsgw.mass.gov/data/gispub/shape/parcels/par206.exe (accessed April 2012).
"A Method for Estimating the Geographical Distribution of the Available Roof Surface Area for
Large-Scale Photovoltaic Energy-Potential Evaluations." by Salvador Izquierdo, Marcos
Rodriques, Norberto Fueyo.
http://205.254.135.24/electricity/sales_revenue_price/ (accessed April 02, 2012).