power curve behaviour in energy analysis - ewea€¦ · power curve behaviour in energy analysis...
TRANSCRIPT

Power Curve Behaviour in Energy Analysis
25th June 2013 Andrew Tindal, SVP Head of Energy
Contents
Energy Analysis Lessons Learned – Where do Power Curve issues fit?
The need for more complex Power Curve models
Other Power Performance related loss factors

Energy Analysis Lessons Learned
What general lessons have we learned and which of these relate to power curve
behaviour?
We learn by seeing what really happens at operational projects
Drilling down into the detail on individual projects
Looking at aggregate results
Key refinement areas North American and European markets identified
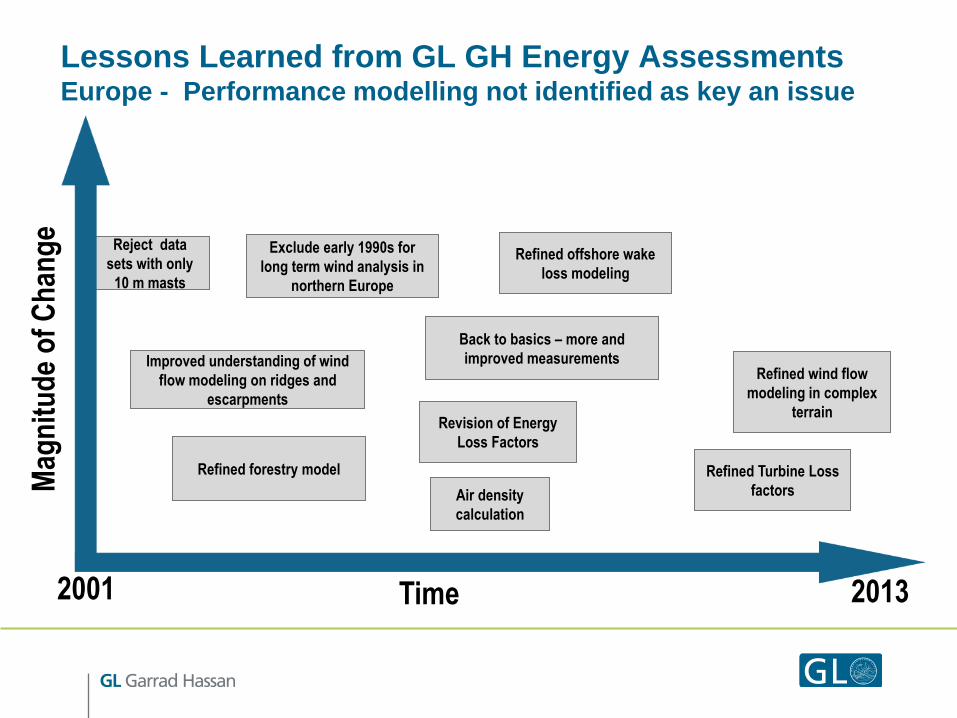
Reject data
sets with only
10 m masts
Time
Mag
nit
ud
e o
f C
han
ge
2001 2013
Improved understanding of wind
flow modeling on ridges and
escarpments
Refined forestry model
Air density
calculation
Back to basics – more and
improved measurements
Refined offshore wake
loss modeling
Revision of Energy
Loss Factors
Refined Turbine Loss
factors
Lessons Learned from GL GH Energy Assessments Europe - Performance modelling not identified as key an issue
Exclude early 1990s for
long term wind analysis in
northern Europe
Refined wind flow
modeling in complex
terrain
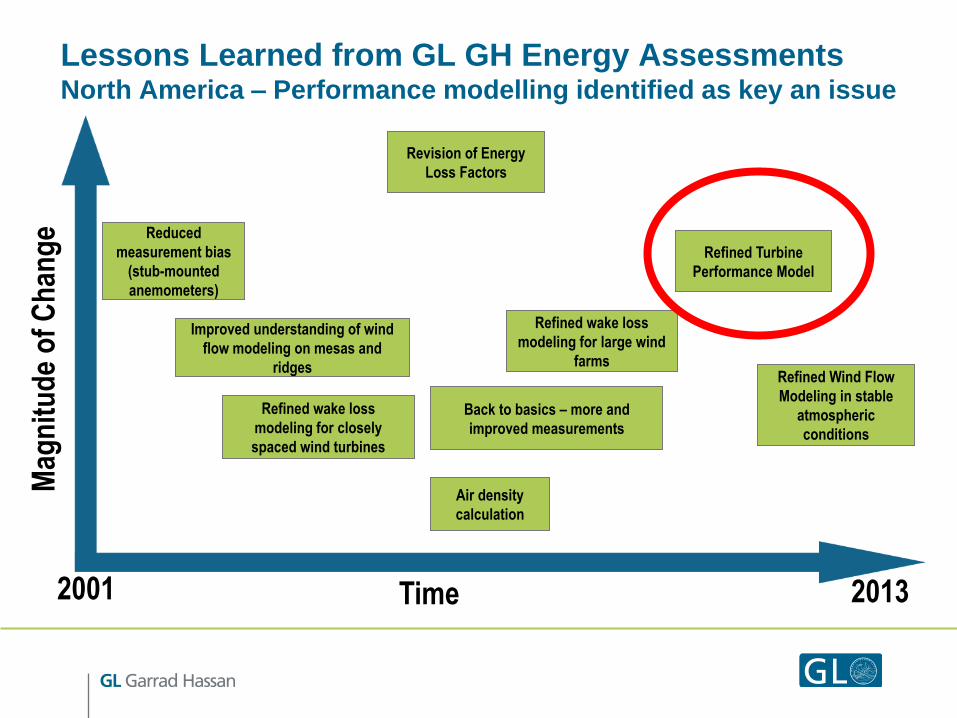
Reduced
measurement bias
(stub-mounted
anemometers)
Time
Mag
nit
ud
e o
f C
han
ge
2001 2013
Improved understanding of wind
flow modeling on mesas and
ridges
Refined wake loss
modeling for closely
spaced wind turbines
Air density
calculation
Back to basics – more and
improved measurements
Refined wake loss
modeling for large wind
farms
Revision of Energy
Loss Factors
Refined Turbine
Performance Model
Refined Wind Flow
Modeling in stable
atmospheric
conditions
Lessons Learned from GL GH Energy Assessments North America – Performance modelling identified as key an issue
20%
30%
40%
50%
60%
70%
80%
90%
7 8 9 10 11
Po
wer
[%
of
Rat
ed]
Wind Speed [m/s]
HighTIMid TI
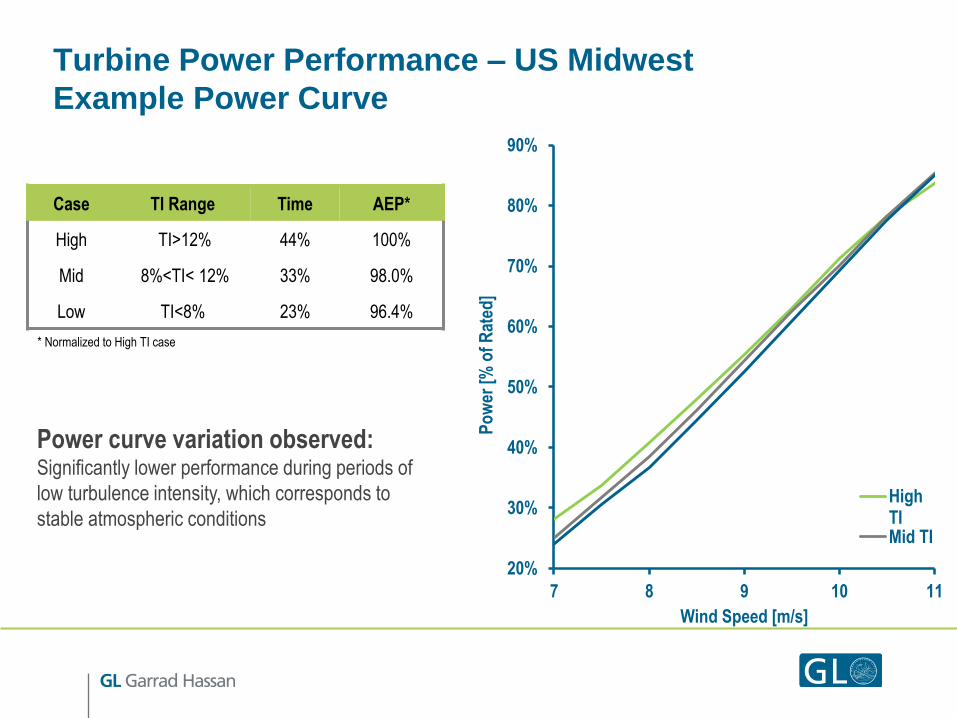
Turbine Power Performance – US Midwest
Example Power Curve
Case TI Range Time AEP*
High TI>12% 44% 100%
Mid 8%<TI< 12% 33% 98.0%
Low TI<8% 23% 96.4%
* Normalized to High TI case
Power curve variation observed: Significantly lower performance during periods of
low turbulence intensity, which corresponds to
stable atmospheric conditions
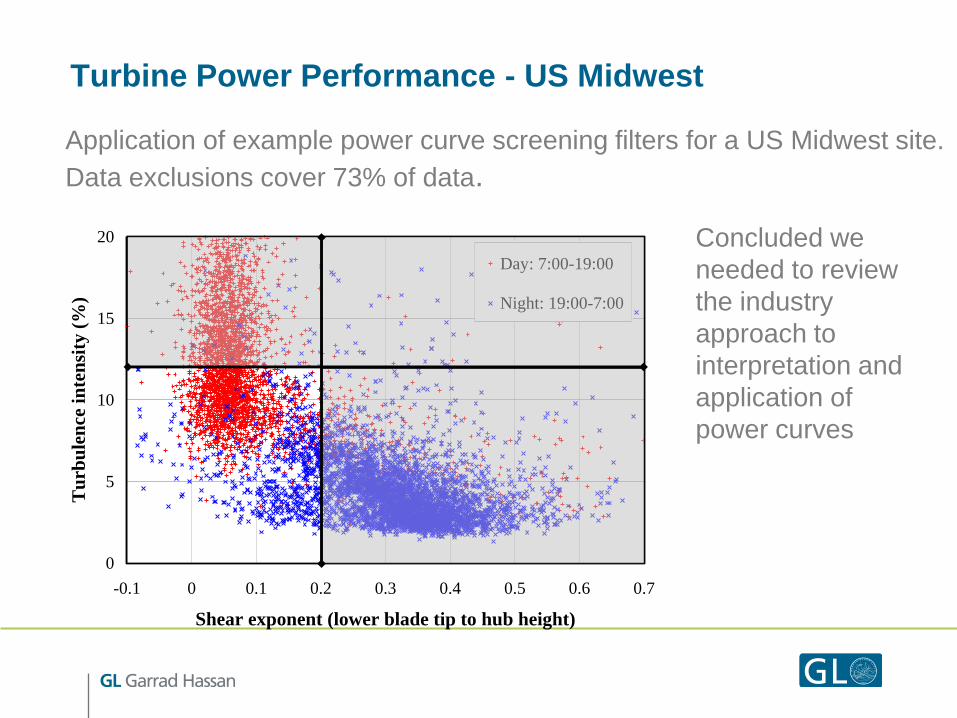
Turbine Power Performance - US Midwest
Application of example power curve screening filters for a US Midwest site.
Data exclusions cover 73% of data.
0
5
10
15
20
-0.1 0 0.1 0.2 0.3 0.4 0.5 0.6 0.7
Shear exponent (lower blade tip to hub height)
Tu
rbu
len
ce i
nte
nsi
ty (
%)
Day: 7:00-19:00
Night: 19:00-7:00
Concluded we
needed to review
the industry
approach to
interpretation and
application of
power curves
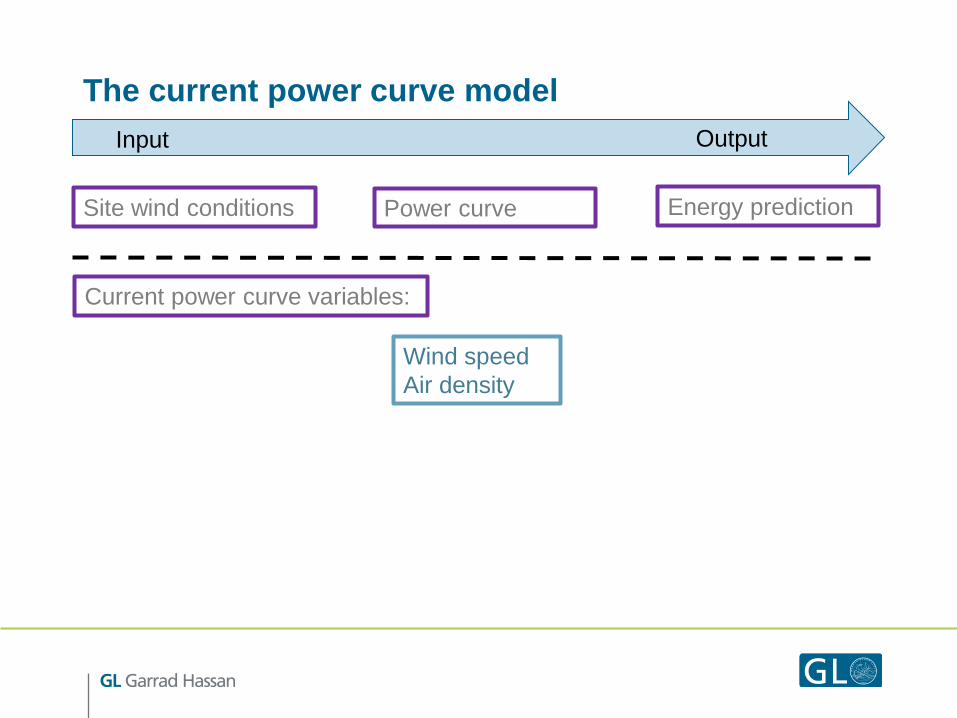
Input
The current power curve model
Wind speed
Air density
Site wind conditions Energy prediction Power curve
Current power curve variables:
Output
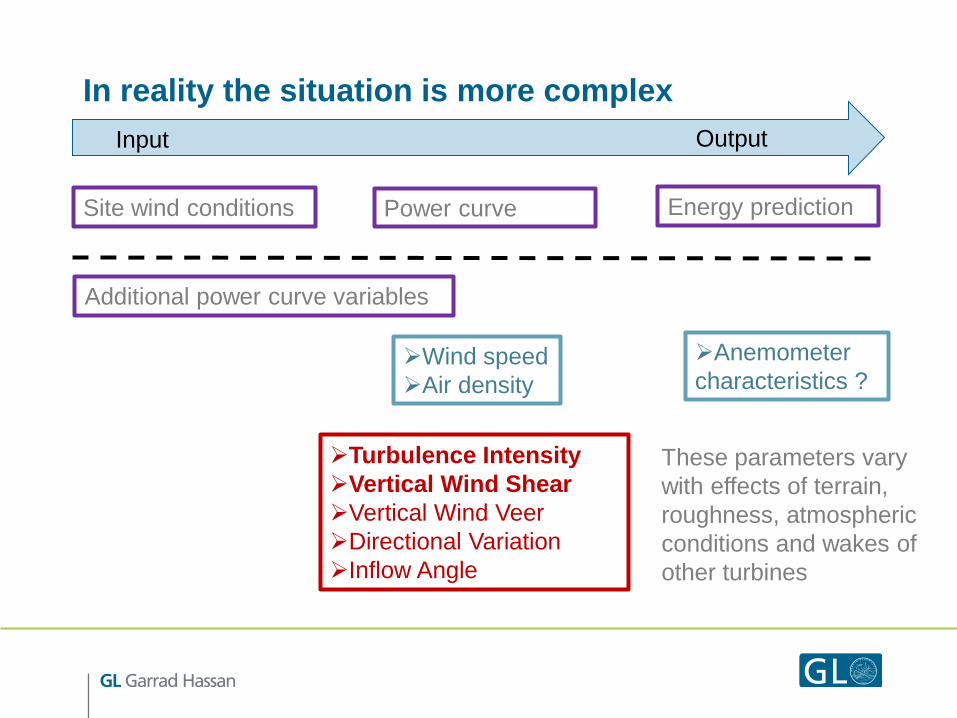
Input Output
In reality the situation is more complex
Wind speed
Air density
Site wind conditions Energy prediction Power curve
Additional power curve variables
Turbulence Intensity
Vertical Wind Shear
Vertical Wind Veer
Directional Variation
Inflow Angle
These parameters vary
with effects of terrain,
roughness, atmospheric
conditions and wakes of
other turbines
Anemometer
characteristics ?
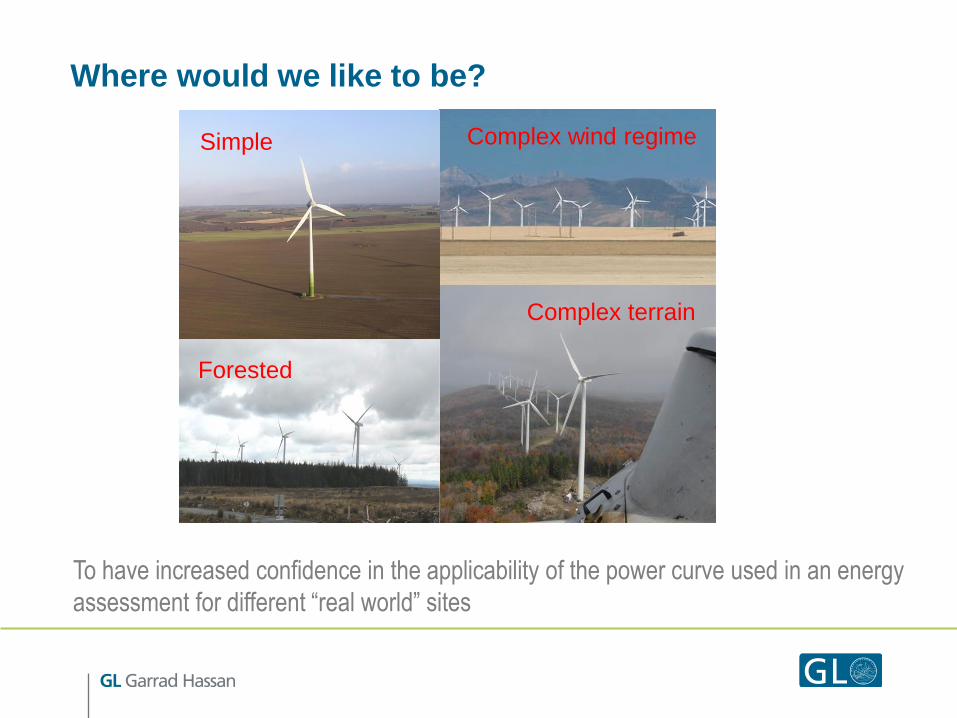
Where would we like to be?
Simple
Complex terrain
Complex wind regime
Forested
To have increased confidence in the applicability of the power curve used in an energy
assessment for different “real world” sites

What are the first steps to help refine predictions?
Increasing dialog between turbine suppliers,
developer / owners and energy analysts
Agreement of the variables to which a power
curve is sensitive
What are the roles of the Turbine Supplier, the
Developer / Owner and the Analyst?
The role of the Turbine Supplier - 1
Agreement of the variables to which a power curve is sensitive
Provide energy analysts a clear starting point for an analysis with a specific definition
of the conditions for which a sales power curve is representative
The role of the Turbine Supplier - 2
Provide a matrix / guidance allowing the power curve to be adjusted to account for site
specific conditions
Consider providing increased access to measured power curve reports

The role of the Developer / Owner
Design pre-construction measurement campaigns with Power Curve issues in mind e.g.
Measure wind speed up to tip height – with Remote Sensing
In complex terrain measure inflow angle
Include these data in tender pack
Consider including tip height Remote Sensing measurements in any contractual power
curve testing which takes place on site

The role of the Energy Analyst [Whether in a consultant, developer or turbine supplier]
Undertake analysis of site wind data and undertake
modelling to prepare inputs for power curve assessment
Receive Sales Power Curve with a full definition of the
conditions for which power curve is representative
Review whether corrections are needed and if so apply
correction models
Supply data to Turbine Supplier in tender pack if
appropriate
Input Output
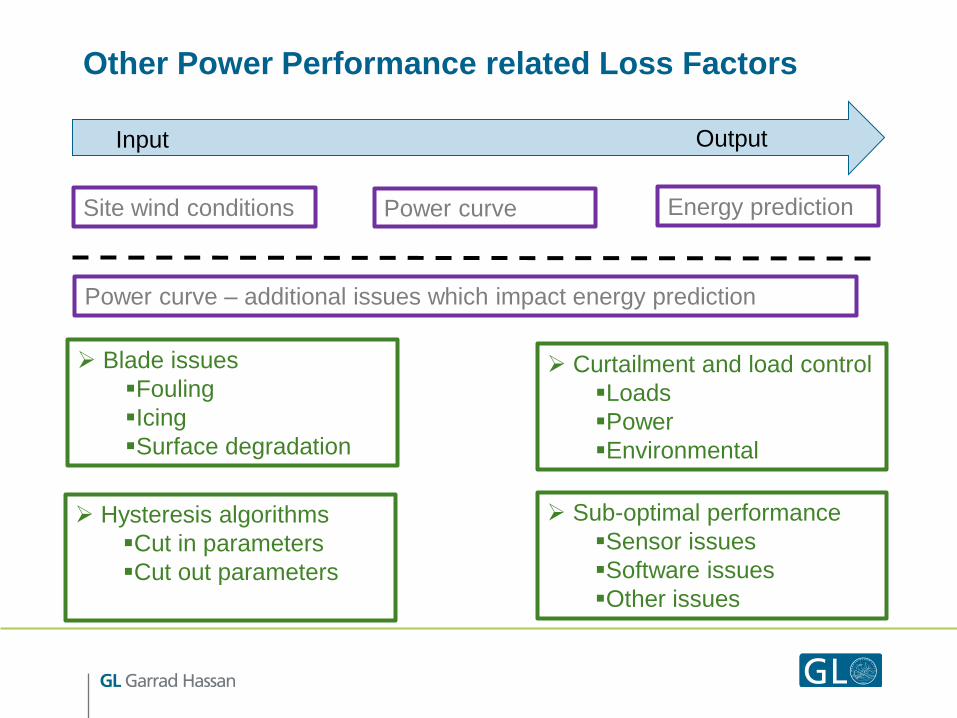
Other Power Performance related Loss Factors
Site wind conditions Energy prediction Power curve
Power curve – additional issues which impact energy prediction
Hysteresis algorithms
Cut in parameters
Cut out parameters
Sub-optimal performance
Sensor issues
Software issues
Other issues
Curtailment and load control
Loads
Power
Environmental
Blade issues
Fouling
Icing
Surface degradation
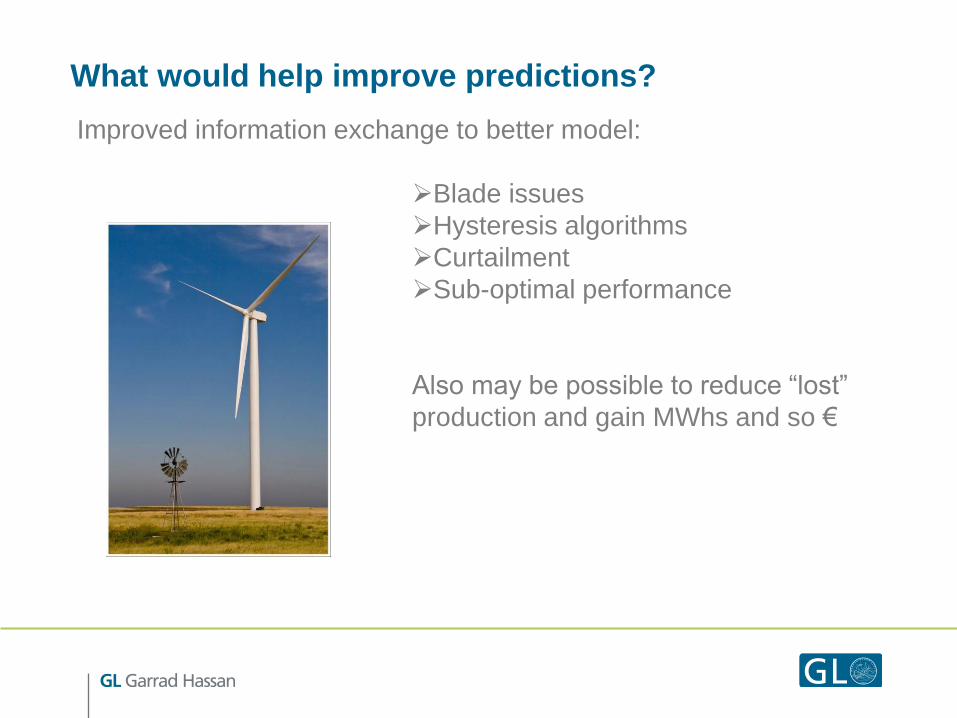
What would help improve predictions?
Improved information exchange to better model:
Blade issues
Hysteresis algorithms
Curtailment
Sub-optimal performance
Also may be possible to reduce “lost”
production and gain MWhs and so €
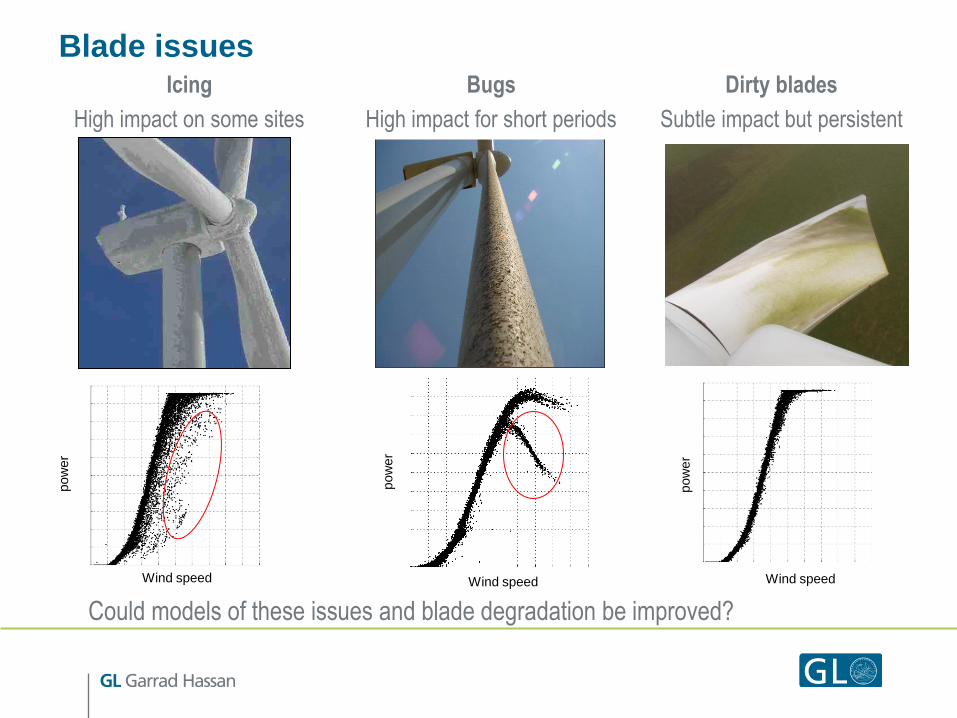
Blade issues Icing
High impact on some sites
Bugs
High impact for short periods
Dirty blades
Subtle impact but persistent
Wind speed Wind speed Wind speed
pow
er
pow
er
pow
er
Could models of these issues and blade degradation be improved?

Hysteresis algorithms
For high wind speed sites an understanding of the details of
the hysteresis algorithm can be an important input to the
analysis
Measured power curves seldom capture this so how confident
are we in our ability to model what is really happening?
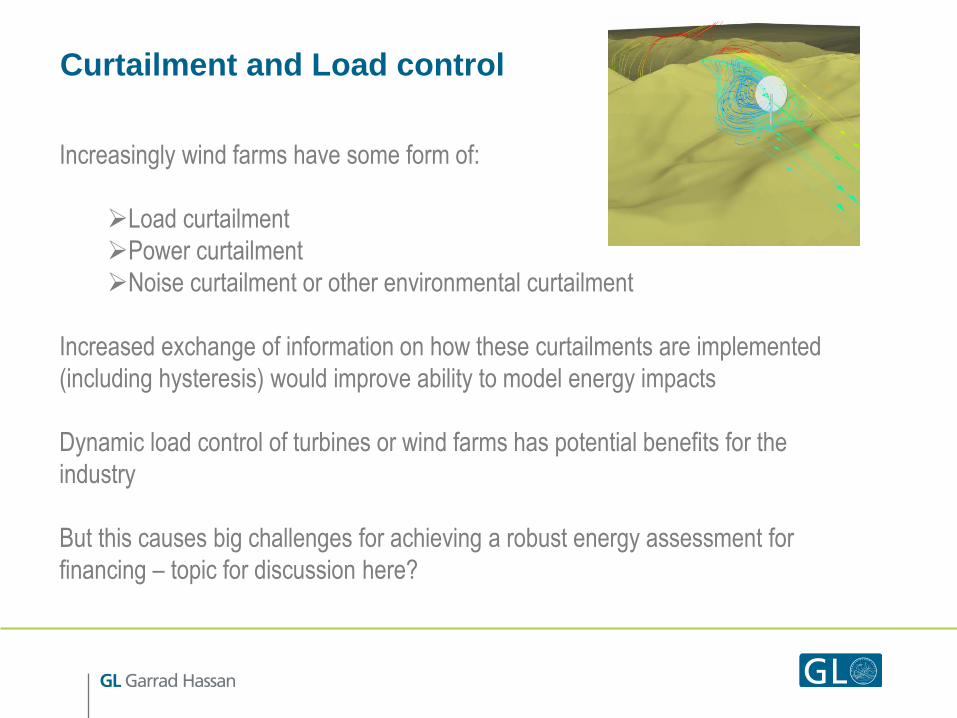
Curtailment and Load control
Increasingly wind farms have some form of:
Load curtailment
Power curtailment
Noise curtailment or other environmental curtailment
Increased exchange of information on how these curtailments are implemented
(including hysteresis) would improve ability to model energy impacts
Dynamic load control of turbines or wind farms has potential benefits for the
industry
But this causes big challenges for achieving a robust energy assessment for
financing – topic for discussion here?
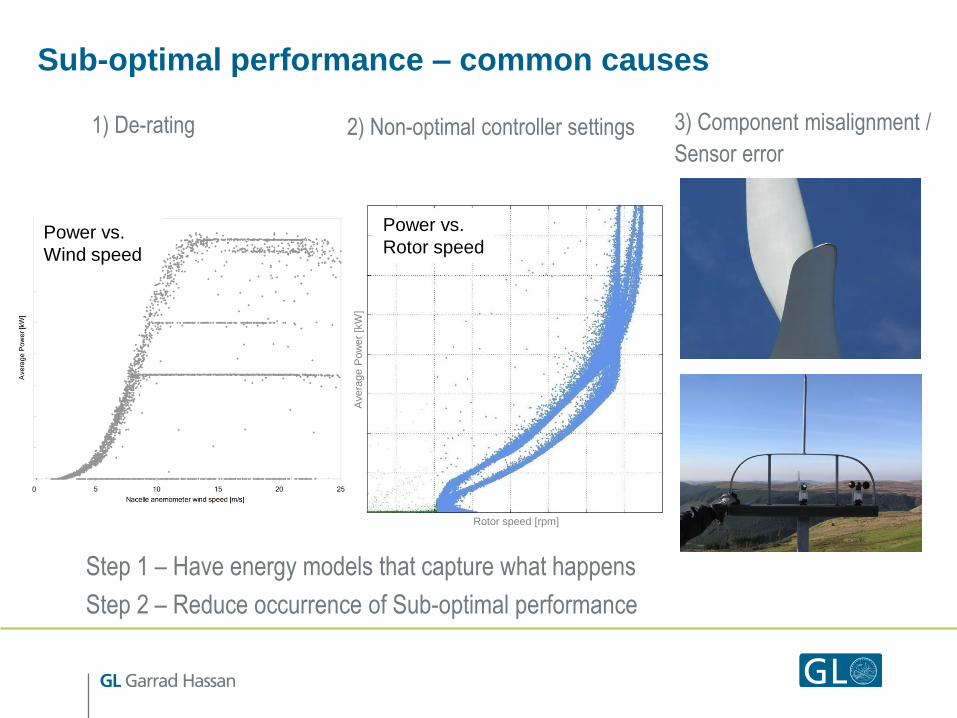
Sub-optimal performance – common causes
1) De-rating 3) Component misalignment /
Sensor error 2) Non-optimal controller settings
Power vs.
Wind speed
Power vs.
Rotor speed
Rotor speed [rpm]
Avera
ge P
ow
er
[kW
]
Step 1 – Have energy models that capture what happens
Step 2 – Reduce occurrence of Sub-optimal performance

Summary and future direction
Turbines are being deployed at sites with increasing diversity of meteorological conditions
and turbine control / wind farm control capabilities are getting more sophisticated
Increasing dialogue between Developers, Turbine Suppliers and Analysts are the way
forward to manage this increasing complexity
What do we expect in the future?
Site wind condition measurement campaigns
designed to give improving inputs to power curve
related elements of energy analysis
Increasing exchange of information on
performance information
Increasing use of time series analysis
techniques

Questions?

Back up slides (if needed) for discussion session
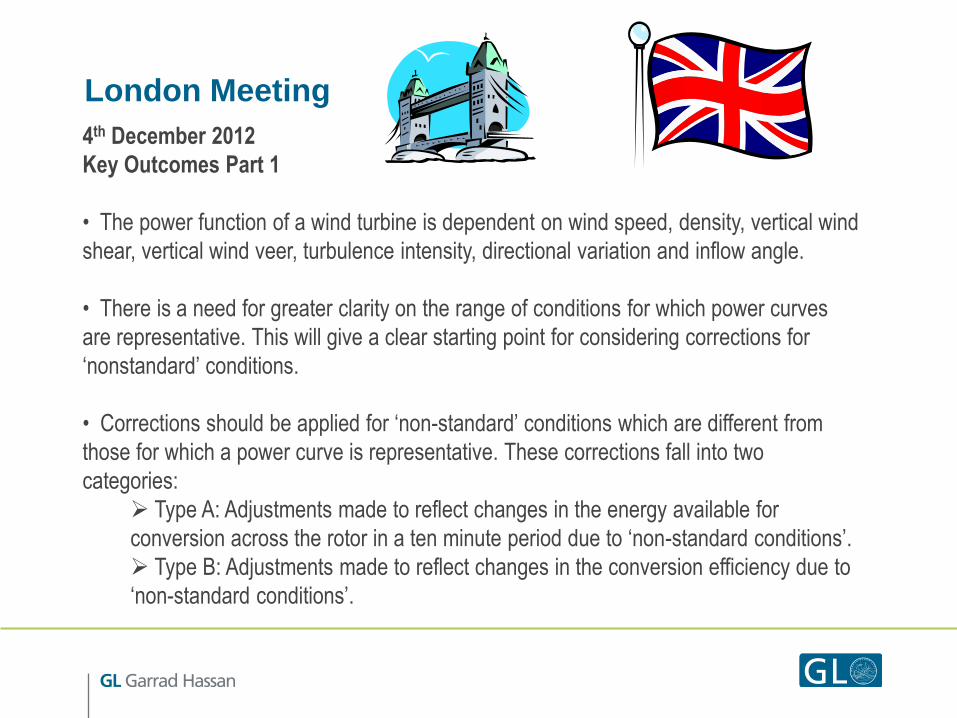
London Meeting
4th December 2012
Key Outcomes Part 1
• The power function of a wind turbine is dependent on wind speed, density, vertical wind
shear, vertical wind veer, turbulence intensity, directional variation and inflow angle.
• There is a need for greater clarity on the range of conditions for which power curves
are representative. This will give a clear starting point for considering corrections for
„nonstandard‟ conditions.
• Corrections should be applied for „non-standard‟ conditions which are different from
those for which a power curve is representative. These corrections fall into two
categories:
Type A: Adjustments made to reflect changes in the energy available for
conversion across the rotor in a ten minute period due to „non-standard conditions‟.
Type B: Adjustments made to reflect changes in the conversion efficiency due to
„non-standard conditions‟.

London Meeting
4th December 2012
Key Outcomes Part 2
• The corrections for wind shear, wind veer and turbulence intensity in the current
working draft of the IEC Power Performance standard should be considered as
candidate methods for incorporation into resource assessment methodologies (Type A
corrections).
• Further collaboration between manufacturers, developers and consultants is
required to improve communication of power function information and explore
corrections for non-standard Conditions.

Brande Meeting
12th March 2013
Key Outcomes Part 1:
• The dependency of power output to five parameters (wind speed, density, wind
shear, wind veer and turbulence intensity) should be made more explicit in power
curve documentation.
• A proposal was made to improve stakeholder communication by supplying power
curves with two ranges of conditions:
The „inner range‟: the conditions for which a manufacturer believes a turbine
will achieve its power curve (without correction).
The „outer range‟: the conditions for which a manufacturer expects a
turbine‟s Performance will degrade below its power curve (and will require
correction).
These ranges of conditions could be tied to the level of warranty e.g. X% warranty for
the „inner range‟ and Y% warranty for the „outer range‟ where Y < X .
Brande Meeting
12th March 2013
Key Outcomes Part 2:
• The use of rotor equivalent wind speed in wind resource assessment offers the
opportunity to correct the wind speed input to the power curve so that it
representative of the whole rotor. This approach is an effective way of dealing with the
sensitivity of power output to wind shear.
• Tip-height measurements (using remote sensing devices e.g. LiDAR/SoDAR) have
a big role to play in improving wind resource assessment. If such information is
available it should not just be used in just the „traditional‟ way (to verify mast
measurement wind shear), instead it should form a core part of the resource
assessment strategy.
• A round robin exercise will be conducted within the working group using a dataset
including tip height measurements from a RES site in Sweden.