power and gas utilities - sector update - centrum 02072014
DESCRIPTION
Power and Gas Utilities - Sector Update - Centrum 02072014TRANSCRIPT
Centrum Equity Research is available on Bloomberg, Thomson Reuters and FactSet
Most stocks rallying more on hope vs actual beneficiaries
Power and Oil & gas sector stocks are upbeat and rallying on reforms post formation of a stable government in May-14. We believe it is essential to segregate stocks rallying on hope and actual beneficiaries as the former will fizzle out once fundamentals catch up. The stock rally does not seem to be taking cognizance of subdued earnings in an optimistic scenario and rich valuations while being overly hopeful of reforms which will impact only a few companies.
� Sector outlook – Power: We are enthused by a spate of structural reforms initiated and implemented since FY12 in the power sector with thrust on increasing power generation capacity. We are thus not optimistic on power generation besides speedy MoEF approval for stranded projects, but believe the next leg of reforms would kick-in in transmission and distribution, rationalisation in logistics cost linked to coal transportation, improvement in rail infrastructure, speedy auctions in coal blocks, etc. The impact of the next leg of reforms is seen to have a Neutral impact on NTPC, PTC India and Tata Power within our coverage universe and hence the rally in stock by +30% since May-14 is certainly based on hope as there is no case for multiple re-rating considering the optimism already built-in by us and the harsh regulatory environment prevailing.
� Sector outlook – Oil & Gas: A stable central government is positive for ONGC (NR), OIL India (NR), GAIL and OMCs (NR). Our positive bias for upstream and downstream sectors is based on the extension of reforms on diesel price de-regulation, tax rationalization, imminent increase in domestic gas prices and a stable rupee leading to lower under-recoveries. However, certainty on ‘net’ benefits to the companies will be essential for ‘further rerating’ of the sector and PSU stocks. A play on RIL and Cairn India would be purely tactical, whereas we re-rate our PT on GSPL on the back of favourable PNGRB tariff order in the making. A sharp +22% rise in share price of Petronet LNG and expensive valuations prompt us to downgrade it to SELL.
� Budget expectations: Key budget expectations include extension of tax holiday, redefining of ‘mineral oil’ to include gas and CBM and hence avail of tax holiday benefits, exemption of customs duty on coal and LNG, clarity on GST roll-out with re-instatement of fiscal benefits currently availed, assigning declared good status on RLNG, enhancing ECB limit, 100% refinancing of loan with ECB, issue of power sector bonds and prompting LIC to subscribe to these bonds and seek MAT exemption for companies under tax holiday.
� Recommendation and key risks: Expensive valuations prompt us to downgrade Petronet LNG to Sell with a revised PT of Rs145 (Rs130 earlier) and also downgrade NTPC to Sell with a revised PT of Rs125 (Rs120 earlier). The revision in PT is led by rolling-forward of valuation to Jun-16. We have revised our PT on GAIL and GSPL upwards to factor-in moderation in subsidy and favourable PNGRB tariff order on the anvil. We retain BUY on MRPL, SELL on PTC India and Tata Power. Key risks to our thesis are (1) regulatory changes; and (2) changes in estimated volumes and realizations.
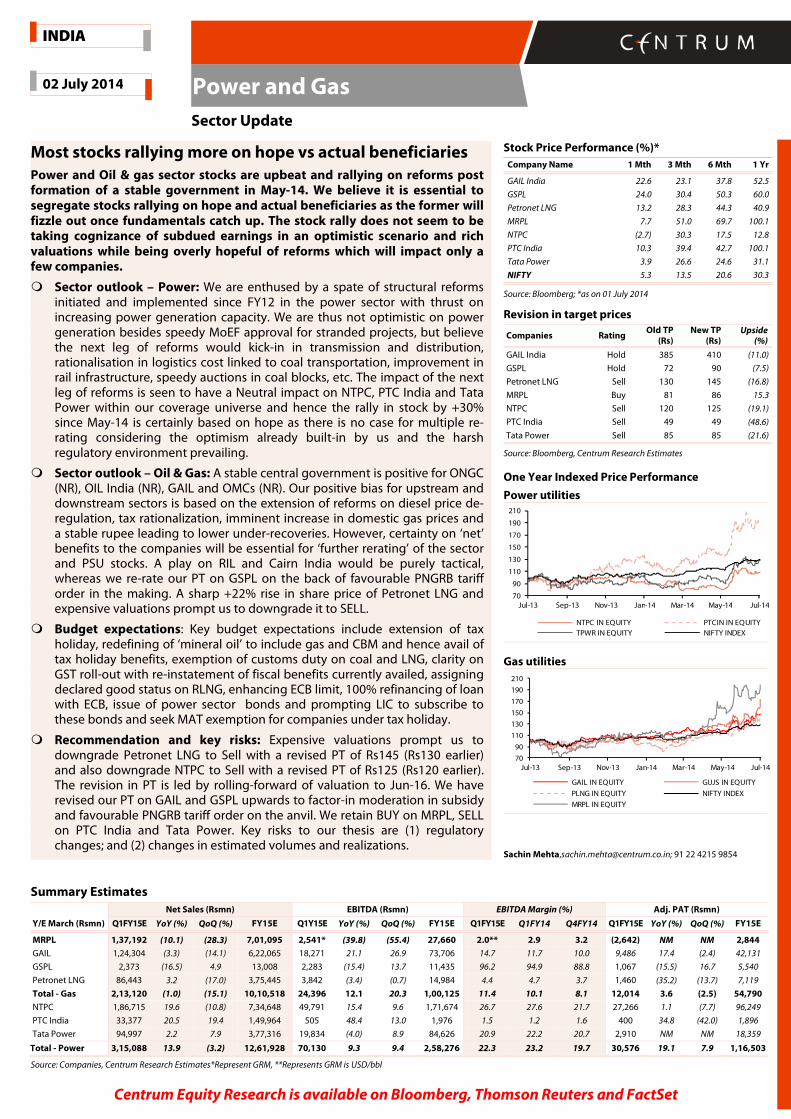
Stock Price Performance (%)*
Company Name 1 Mth 3 Mth 6 Mth 1 Yr
GAIL India 22.6 23.1 37.8 52.5
GSPL 24.0 30.4 50.3 60.0
Petronet LNG 13.2 28.3 44.3 40.9
MRPL 7.7 51.0 69.7 100.1
NTPC (2.7) 30.3 17.5 12.8
PTC India 10.3 39.4 42.7 100.1
Tata Power 3.9 26.6 24.6 31.1
NIFTY 5.3 13.5 20.6 30.3
Source: Bloomberg; *as on 01 July 2014
Revision in target prices
Companies Rating Old TP (Rs)
New TP (Rs)
Upside (%)
GAIL India Hold 385 410 (11.0)
GSPL Hold 72 90 (7.5)
Petronet LNG Sell 130 145 (16.8)
MRPL Buy 81 86 15.3
NTPC Sell 120 125 (19.1)
PTC India Sell 49 49 (48.6)
Tata Power Sell 85 85 (21.6)
Source: Bloomberg, Centrum Research Estimates
One Year Indexed Price Performance
Power utilities
Gas utilities
Sachin Mehta,[email protected]; 91 22 4215 9854
Summary Estimates
Net Sales (Rsmn) EBITDA (Rsmn) EBITDA Margin (%) Adj. PAT (Rsmn)
Y/E March (Rsmn) Q1FY15E YoY (%) QoQ (%) FY15E Q1Y15E YoY (%) QoQ (%) FY15E Q1FY15E Q1FY14 Q4FY14 Q1FY15E YoY (%) QoQ (%) FY15E
MRPL 1,37,192 (10.1) (28.3) 7,01,095 2,541* (39.8) (55.4) 27,660 2.0** 2.9 3.2 (2,642) NM NM 2,844
GAIL 1,24,304 (3.3) (14.1) 6,22,065 18,271 21.1 26.9 73,706 14.7 11.7 10.0 9,486 17.4 (2.4) 42,131
GSPL 2,373 (16.5) 4.9 13,008 2,283 (15.4) 13.7 11,435 96.2 94.9 88.8 1,067 (15.5) 16.7 5,540
Petronet LNG 86,443 3.2 (17.0) 3,75,445 3,842 (3.4) (0.7) 14,984 4.4 4.7 3.7 1,460 (35.2) (13.7) 7,119
Total - Gas 2,13,120 (1.0) (15.1) 10,10,518 24,396 12.1 20.3 1,00,125 11.4 10.1 8.1 12,014 3.6 (2.5) 54,790
NTPC 1,86,715 19.6 (10.8) 7,34,648 49,791 15.4 9.6 1,71,674 26.7 27.6 21.7 27,266 1.1 (7.7) 96,249
PTC India 33,377 20.5 19.4 1,49,964 505 48.4 13.0 1,976 1.5 1.2 1.6 400 34.8 (42.0) 1,896
Tata Power 94,997 2.2 7.9 3,77,316 19,834 (4.0) 8.9 84,626 20.9 22.2 20.7 2,910 NM NM 18,359
Total - Power 3,15,088 13.9 (3.2) 12,61,928 70,130 9.3 9.4 2,58,276 22.3 23.2 19.7 30,576 19.1 7.9 1,16,503
Source: Companies, Centrum Research Estimates*Represent GRM, **Represents GRM is USD/bbl
70
90
110
130
150
170
190
210
Jul-13 Sep-13 Nov-13 Jan-14 Mar-14 May-14 Jul-14
NTPC IN EQUITY PTCIN IN EQUITY
TPWR IN EQUITY NIFTY INDEX
70
90
110
130
150
170
190
210
Jul-13 Sep-13 Nov-13 Jan-14 Mar-14 May-14 Jul-14
GAIL IN EQUITY GUJS IN EQUITY
PLNG IN EQUITY NIFTY INDEX
MRPL IN EQUITY
02 July 2014
Sector Update
INDIA
Power and Gas

2 Power and Gas
Sector Oulook – Power Utilities
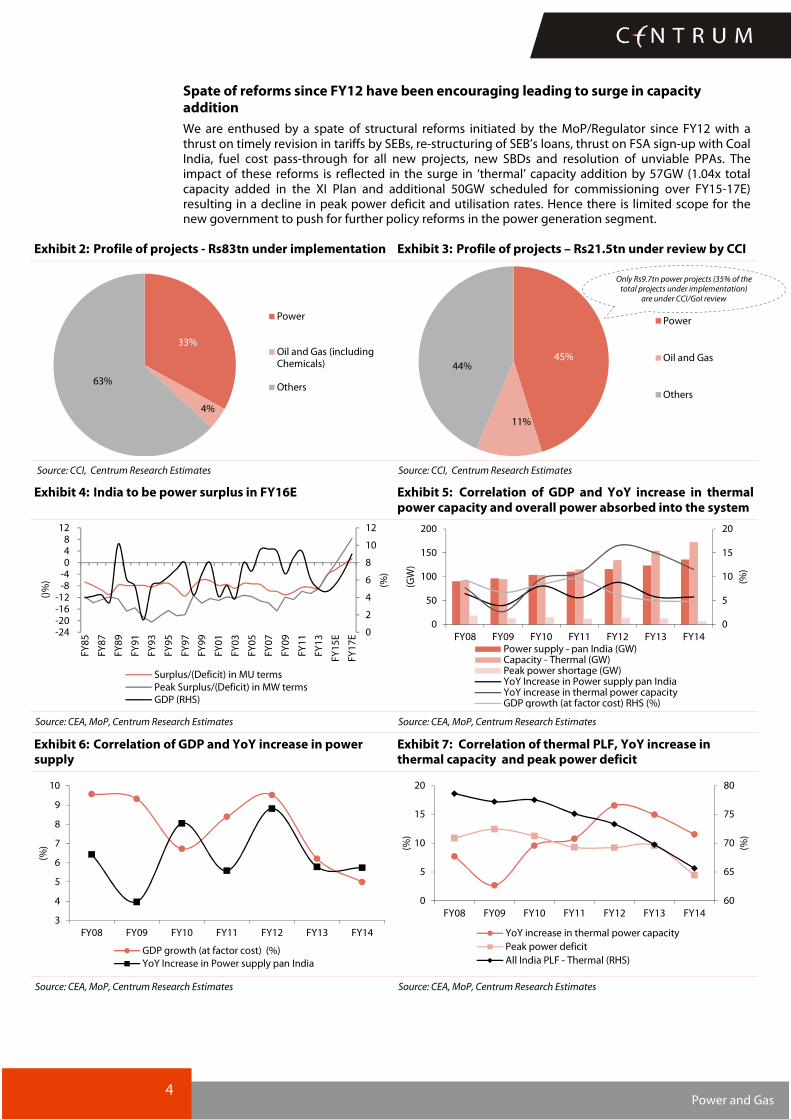
We disagree with consensus view that a stable central government will re-rate the entire power sector. It is misplaced optimism. It is imperative to segregate stocks that are rallying on hope vs. actual beneficiaries of reforms. We reiterate that power sector is plagued by over-capacity in generation, persistent challenges in securing domestic fuel, harsh regulations and subdued demand. Our hypothesis suggest that even in a scenario of a jump in GDP to +9% in the medium term, we see ample existing capacity in place to meet the demand and hence as new capacities come on-stream, utilisation rates would only decline. We believe structural reforms in the generation segment have already been implemented with limited room to improve thereon and hence focus should be on beneficiaries in the transmission and distribution space. (Refer Exhibit 1 for details)
� Limited role of Central Government: Of the Rs27.4 tn worth power projects under implementation, 175 projects worth Rs9.7 tn (35% of the total) reached the Cabinet Committee on Investment for speedy clearance and the balance 65% is stuck with State Governments or for regulatory clearances. (Refer Exhibit 2 and 3 for details)
� Ample generation capacity in place to meet even a bull case scenario of +9% GDP: Empirical trend analysis suggests that utilisation rate will decline as power absorbed into the system will continue to grow at 6-7% CAGR indifferent to GDP growth of 5% or 9%. In FY14, peak power deficit slumped to 6 GW and India could have become power surplus, but it was constrained with unavailability of transmission corridors. So even if we assume GDP of +9% in the medium term, peak power deficit may bounce up to 14-15 GW (in line with past trend). However existing low utilisation rates and ample idle capacity ‘now’ available (‘thermal’ capacity addition by 57GW over FY12-14 and additional 50GW scheduled for commissioning over FY15-17E), we believe demand would be easily met to meet a bull case GDP scenario. (Refer Exhibit 4 to 7 for details)
� Policy initiatives to be sentiment positive, but implementation will be challenging as Power is a State subject: We expect NDA led government to announce policy initiatives on pooling of coal and gas prices, speedy auction of coal blocks, emphasis of T&D infrastructure, speedy push to rail infrastructure, extension of fiscal/tax benefits, tax rationalization, other incentives, etc. Though we see it as sentiment positive, implementation will be challenging as concurrence of all States is needed, which is unlikely. Until structural issues of adequate availability of domestic fuel and revival in demand are jointly resolved, we see no possibility of a positive turnaround.
� Sector earnings governed by regulations: The power sector is highly regulated by CERC/SERC and hence the formation of a stable government is unlikely to impact the earnings of companies. CERC/SERC tariff regulations are valid until FY19/end of multi-year tariff period and it is immune to the formation of any government. Hence we see the impact as neutral.
� Recommendation – Book profits amidst the sharp rally: With the sharp +30% jump in stock price without a case for re-rating makes it compelling to book profits. Overall, we recommend a sober stock picking strategy with;-
• Overall defensive bias and emphasis on attractive valuations;
• Play on improvement in core business led by stable earnings growth and resolution of unviable PPA;
• Business model with long-term fuel security, PPA and cost competitiveness to outperform peers

3 Power and Gas
Exhibit 1: Key sector reforms and key beneficiaries – Priced in
Policy Measure Implementation
Status
Probability of smooth
implementation Case in point
Time frame to realize Policy Impact
Key Beneficiaries
Factored-in CMP
Increase in coal based generation capacity
Implemented High
Thermal capacity addition of 57GW over FY12-14 and additional 50GW scheduled for commissioning in next 3 years
NA NTPC
Adani Power KSK Energy
Yes
FSA sign-up with Coal India
Implemented Medium 160 FSA with 222.2MT signed for a capacity of 73GW
NA NTPC
KSK Energy CESC
Yes
Resolution of unviable PPA
Implemented Low to Medium CERC historical compensatory tariff order, although it is challenged
0-1 year Tata Power
Adani Power Yes
Improvement in SEB financial health
Implemented High FRP package underway and timely revision in tariffs by all SEBS
N.A All utilities Yes
Speedy MoEF approvals to power projects
Pending High Online single window clearance to be implemented from Jul-14
0-1 year All utilities To a large
extent
Speedy coal block auctions
Pending Low to Medium MoP thrust to improve coal supplies 1-3 years Subjective NA
Rationalization of freight cost on coal through swapping arrangements
Pending Low GSEB and NTPC to soon announce swap arrangements, but unlikely to be implemented across al utilities
1-2 years NTPC Yes
Extension of tax holiday Pending High Industry demands and government emphasis on capacity addition
0-1 year NTPC
Adani Power Yes
Revival in demand Implemented High SEB currently have excess PPA capacity vs actual demand and hence power purchase is on merit order
NA NA NA
Improvement in rail infrastructure for coal evacuation
Pending Medium All critical railway lines have been stuck owing to land acquisition issues and law and order problems
2-4 years All Utilities Coal India
To a large extent
Speedy MoEF approvals for coal blocks
Pending Medium to High Lack of rail infra to hinder evacuation 0-1 year All Utilities Coal India
To a large extent
Introduce 24x7 power supply
Pending Low to Medium Lack of adequate transmission and distribution to hinder implementation
2-4 years All Utilities
Partly
PPP model in distribution on pan India basis
Pending Low to Medium SEB resistance and political unwillingness
3-5 years All utilities No
Lower AT&C losses Pending Medium SEB resistance and political unwillingness
3-5 years All utilities (Negative)
No
Revival of stranded gas based plants
Pending Medium Without subsidy to SEB by MoP, it is unlikely to take-off. Past effort of UPA government have failed
0-1 years
Torrent Power R- Power GMR Infra GVK Infra
Lanco Infra
To a large extent
Improve transmission and distribution capacity manifold
Pending High Mis-match between capex incurred on generation vis-à-vis T&D spend
2-4 years PGCIL SEBs
No
Encourage SEB-SEB power trading
Pending High Gujarat model does not encourage power traders and instead moots SEB owned power trading arm
1-2 years PTC India
(Negative) No
Case 1 / Case 2 standard bidding guidelines (SBD)
Implemented High
Despite fuel cost pass-through for new projects, leading IPP have refrained from bidding as it is perceived pro-consumer. MoP has ruled-out changes in SBD
0-1 year SEBs NA
Source:Centrum Research
The sharp rally in ‘all’ utilities is unjustified and rally may continue on hope until fundamentals catch-up
4 Power and Gas
Spate of reforms since FY12 have been encouraging leading to surge in capacity addition
We are enthused by a spate of structural reforms initiated by the MoP/Regulator since FY12 with a thrust on timely revision in tariffs by SEBs, re-structuring of SEB’s loans, thrust on FSA sign-up with Coal India, fuel cost pass-through for all new projects, new SBDs and resolution of unviable PPAs. The impact of these reforms is reflected in the surge in ‘thermal’ capacity addition by 57GW (1.04x total capacity added in the XI Plan and additional 50GW scheduled for commissioning over FY15-17E) resulting in a decline in peak power deficit and utilisation rates. Hence there is limited scope for the new government to push for further policy reforms in the power generation segment.
Exhibit 2: Profile of projects - Rs83tn under implementation Exhibit 3: Profile of projects – Rs21.5tn under review by CCI
Source: CCI, Centrum Research Estimates Source: CCI, Centrum Research Estimates
Exhibit 4: India to be power surplus in FY16E Exhibit 5: Correlation of GDP and YoY increase in thermal power capacity and overall power absorbed into the system
Source: CEA, MoP, Centrum Research Estimates Source: CEA, MoP, Centrum Research Estimates
Exhibit 6: Correlation of GDP and YoY increase in power supply
Exhibit 7: Correlation of thermal PLF, YoY increase in thermal capacity and peak power deficit
Source: CEA, MoP, Centrum Research Estimates Source: CEA, MoP, Centrum Research Estimates
33%
4%
63%
Power
Oil and Gas (includingChemicals)
Others
45%
11%
44%
Power
Oil and Gas
Others
0
2
4
6
8
10
12
-24-20-16-12
-8-4048
12
FY
85
FY
87
FY
89
FY
91
FY
93
FY
95
FY
97
FY
99
FY
01
FY
03
FY
05
FY
07
FY
09
FY
11
FY
13
FY
15
E
FY
17
E
(%)
()%
)
Surplus/(Deficit) in MU terms
Peak Surplus/(Deficit) in MW termsGDP (RHS)
0
5
10
15
20
0
50
100
150
200
FY08 FY09 FY10 FY11 FY12 FY13 FY14
(%)
(GW
)
Power supply - pan India (GW)Capacity - Thermal (GW)Peak power shortage (GW)YoY Increase in Power supply pan IndiaYoY increase in thermal power capacityGDP growth (at factor cost) RHS (%)
3
4
5
6
7
8
9
10
FY08 FY09 FY10 FY11 FY12 FY13 FY14
(%)
GDP growth (at factor cost) (%)
YoY Increase in Power supply pan India
60
65
70
75
80
0
5
10
15
20
FY08 FY09 FY10 FY11 FY12 FY13 FY14
(%)
(%)
YoY increase in thermal power capacity
Peak power deficit
All India PLF - Thermal (RHS)
Only Rs9.7tn power projects (35% of the total projects under implementation)
are under CCI/GoI review

5 Power and Gas
Exhibit 8: Status of projects pending with CCI as on 1 July 2014
Sector
No. of projects with CCI Amount (Rs tn.)
As % of Total Cleared Pending Total
Cleared Projects
Pending projects
Total
Power 92 83 175 4.1 5.6 9.7 45
As % of Grand Total 59 29 40 76 35 45
Oil & Gas 8 35 43 0.2 2.2 2.4 11
As % of Grand Total 5 12 10 3 14 11
Others 55 167 222 1.1 8.2 9.3 44
As % of Grand Total 35 59 50 21 51 43
Grand Total 155 285 440 5.4 16.1 21.5 100
Source: CCI, Centrum Research Estimates
Exhibit 9: Coal India : Coal supply assumptions
Coal India - Total (MT) FY07 FY08 FY09 FY10 FY11 FY12 FY13 FY14 FY15E FY16E FY17E
Production 360.9 379.5 403.7 431.3 431.3 435.8 452.2 462.5 490.3 5195.7 550.8
Dispatch 350.3 374.6 400.8 416 424.5 433.1 465.2 471.5 498.9 528.8 560.5
Source: Company, Centrum Research Estimates
Exhibit 10: Correlation of GDP vs pan-India power supply and PTC Volumes
Exhibit 11: Quarterly correlation of GDP and PTC’s volumes
Source: Company, Centrum Research Estimates Source: Company, Centrum Research Estimates
4
5
6
7
8
9
10
-
200
400
600
800
1,000
FY07 FY08 FY09 FY10 FY11 FY12 FY13 FY14
(%)
PTC Volumes (BU) Power supply pan India (BU)
GDP (at factor cost) RHS
200
2,200
4,200
6,200
8,200
10,200
12,200
-
2.0
4.0
6.0
8.0
10.0
12.0
Q1
FY
09
Q
2F
Y0
9
Q3
FY
09
Q
4F
Y0
9
Q1
FY
10
Q
2F
Y1
0
Q3
FY
10
Q
4F
Y1
0
Q1
FY
11
Q
2F
Y1
1
Q3
FY
11
Q
4F
Y1
1
Q1
FY
12
Q2
FY
12
Q3
FY
12
Q4
FY
12
Q1
FY
13
Q2
FY
13
Q3
FY
13
Q4
FY
13
Q1
FY
14
Q2
FY
14
Q3
FY
14
Q4
FY
14
GDP at factor cost (LHS) PTC's volumes (MU)
We remain optimistic and factor-in 6% CAGR over FY14-17E on coal supplies vs 3 % CAGR over FY09 to FY14
The status quo remains nearly the same as we compare with the Apr-14 statistics (Refer our report dated 17-May-14 for details)

6 Power and Gas
Positive on Upstream / Downstream, Neutral on Gas Utilities
A stable central government is positive for ONGC, OIL India and OMCs but Neutral for gas utilities. Our positive bias for upstream and downstream sectors is based on extension of reforms on diesel price de-regulation, tax rationalization, a stronger rupee on the anvil leading to lower under-recoveries and an imminent increase in domestic gas prices. However, certainty on ‘net’ benefits to the companies will be essential for ‘further rerating’ of the sector and PSU stocks, as stocks have already rallied. A play on RIL and Cairn India would be purely tactical, whereas a re-rating in gas utilities would depend on radical positive changes in regulations, zero subsidy burden for GAIL and a quantum increase in gas supplies. However, with low probability, we are Neutral.
� Under-recoveries on a decline: Over FY14-16E, under-recoveries are likely to reduce by 40% to Rs840 bn (@crude price of USD105/bbl and INR/USD at 60). As product crack spreads increase over 9MFY15 in line with historical trend, diesel and LPG/Kerosene under-recoveries would increase going forward and CMP of stocks are assuming that GoI would keep increasing the diesel price which may be challenging in a scenario of inflationary environment. Although we built-in absolute subsidy burden for ONGC (Not Rated) and OIL India (Not Rated) to moderate marginally, OMCs (Not Rated) are certain beneficiaries of lower under-recoveries (CMP largely factor-in benefit of lower under-recoveries). Clarity on gas price hike to near USD 7-8/MMBTU would boost earnings for upstream companies (but factored-in CMP of ONGC and partly for OIL India). Possible decline in Government compensation reflecting lower fuel subsidies and higher revenues (in the form of royalty, tax, dividends and dividend distribution tax) from potential higher realizations on oil and gas, provide enough headroom for the Government to pass on benefits (albeit partially) to upstream PSUs and hence is positive.
� Re-rating of Gas utilities depends on radical regulatory changes and jump in gas supplies – Probability is low: We see Neutral impact on outlook for GAIL, GSPL and Petronet LNG noting that earnings are driven by (1) PNGRB regulations which remain harsh; (2) price sensitivity to higher gas prices by 75% of end consumers (power and fertiliser sectors); (3) litigations over laying pipelines to transmit gas/RLNG; (4) ongoing tariff litigations with APTEL/SC and (5) optimism in increased gas volumes already built-in for Petronet LNG, GAIL and GSPL, makes us Neutral.
� Impact of reforms and policy initiatives to firm-up over next 2-3 years: The impact of the recent price hike and approvals for a number of upstream projects by the Cabinet Committee on Investments (CCI) in the past few months are expected to provide a fillip to exploration activity, though ‘quantum’ increase in terms of gas production would be seen only after 2-4 years considering the long gestation period of upstream projects. The outlook on domestic gas supplies remains bleak and hence utilisation levels will be subdued.
Stock Recommendations
We retain HOLD on GAIL and GSPL and recommend SELL on Peronet LNG. We maintain BUY on MRPL with a revised PT of Rs86 (Rs81 earlier). Among non-coverage companies, we prefer Oil India, BPCL, and IOCL. Earnings growth in RIL (Not Rated) will largely be led by non-core business whereas for Cairn India (Not Rated), it will depend on speedy clearances and consequent increase in production. Hence we see RIL and Cairn India as tactical plays.

7 Power and Gas
MRPL (Rating: BUY; Target Price: Rs86)
Exhibit 12: Quarterly Estimates
(Rsmn) Q1FY145E Q1FY 14 Q4FY 14 YoY (%) QoQ (%) FY15E
Product Sales (MT) 2.9 3.2 3.4 (9.6) (16.1) 13.9
Sales 1,37,192 1,52,659 1,91,275 (10.1) (28.3) 7,01,095
GRM 2,541 4,220 5,701 (39.8) (55.4) 27,660
PAT (2,642) (4,539) 10,671 NM NM 2,844
Source: Company, Centrum Research Estimates
� The first quarter is seasonally weak historically as product crack spreads are subdued and pick-up in balance 9MFY15. We expect MRPL to report a GRM of USD2.0/bbl vs USD2.9/bbl in Q1FY14 and USD3.2/bbl in Q4FY14. For FY15E, MRPL is expected to report an average GRM of USD4.5/bbl.
� In line with our IC report, Phase-III commissioning is on track and PFCC unit and Petchem units are scheduled to be commissioned over next 1 month, leading to high GRM accretive product slate.
� We reiterate that pending commissioning of Phase-III in its entirety, earnings will remain volatile owing to erratic fuel consumption and skewed product slate. Further, inventory gains may be off-set with sequential appreciation in rupee in Q1FY15.
� Also, without resort to borrowings, company has paid significant amount of its outstanding dues towards oil payments to Iran in Q1FY15, which should moderate street concerns. MoPNG is considering a possible merger of ONGC Mangalore Petchem (MRPL stake at 3%) with MRPL which provides further potential upside to our PT, which we have not factored-in.
Ratings and price target – Maintain BUY
We maintain BUY on the stock with a revised PT of Rs86 (Rs81 earlier). Our revision in PT is owing to roll-forward to Jun-16 earnings and has been derived as the average value using DCF and fair multiple assigned to EV/EBITDA, EPS and BV.
GAIL (Standalone) (Rating: HOLD; Target Price: Rs410)
Exhibit 13: Quarterly Estimates
(Rsmn) Q1FY15 E Q1FY 14 Q4FY 14 YoY (%) QoQ (%) FY15E
Sales 1,24,304 1,28,556 1,44,643 (3.3) (14.1) 6,22,065
EBITDA 18,271 15,084 14,399 21.1 26.9 73,706
EBITDA Margins (%) 14.7 11.7 10.0 297 bps 474 bps 11.9
PAT 9,486 8,082 9,720 17.4 (2.4) 42,131
Source: Company, Centrum Research Estimates
� In the quarter, sequential 3% appreciation in INR/USD coupled with decline in LPG/LHC realizations and likely subsidy pay-out of Rs5bn would weigh down on earnings. We expect transmission volumes to remain flat QoQ and its earnings under pressure owing to zero take-pay charges and impact of PNGRB tariff order, although it is marginally negative. .
� We expect the company to post higher EBITDA of Rs 18.2 bn (+21% YoY +27% QoQ) on the back of (1) higher petchem and LPG/LHC volumes as shut-down was minimal at 10 days vs 15-20 days in Q4FY14 (2) subsidy burden at Rs5bn vs Rs7 bn in Q1FY14 and flat QoQ. GAIL is expected to report a profit of Rs13.7 bn (+122% YoY and -18% QoQ). Earnings from trading/marketing would be a key variable, we have however built-in modest jump in its earnings.
� Petchem expansion under-way at Pata has been delayed further and is likely to commence production in Q4FY15.
Earnings revised
We are revising our EBITDA/PAT in FY15E/FY16E on the back of lower subsidy burden factored-in at Rs10.5bn vs Rs14bn considered earlier and changes in petchem and LPG utilisation and realisations. We roll-forward our earnings to Jun-16 and maintain our HOLD rating with a revised target price of Rs410 (Rs 385 earlier).
Exhibit 14: Earnings revision
Particulars FY15E FY16E
Current Earlier Chg (%) Current Earlier Chg (%)
Revenue 622,065 617,332 0.8 677,404 672,363 0.7
EBITDA 73,706 71,191 3.5 73,932 77,024 -4.0
EBITDA margin (%) 11.9 11.6 30 bps 10.9 11.5 (60 bps)
PAT 42,131 40,421 4.2 42,499 44,552 -4.6
Source: Company, Centrum Research Estimates

8 Power and Gas
GSPL (Standalone) (Rating: Hold; Target Price: Rs90)
Exhibit 15: Quarterly Estimates
(Rsmn) Q1FY15 E Q1FY 14 Q4FY 14 YoY (%) QoQ (%) FY15E
Volume (MMSCMD) 23.0 21.9 20.3 5.0 13.2 25
Sales 2,373 2,843 2,262 (16.5) 4.9 13,008
EBITDA 2,283 2,698 2,008 (15.4) 13.7 11,435
EBITDA Margins (%) 96.2 94.9 88.8 128 bps 741 bps 91.9
PAT 1,067 1,263 915 (15.5) 16.7 5,540
Source: Company, Centrum Research Estimates
� Our channel checks reveal that PNGRB (following APTEL directive in Feb-14) would shortly release final tariff order for HP network paving the way for GSPL to charge higher tariffs. Hence in anticipation, we revise our earnings and PT to reflect the emerging scenario. We highlight that PNGRB has already disputed it and litigated with SC, however pending the outcome, GSPL in the interim would charge higher tariffs.
� During the quarter, we expect volumes to bounce up sequentially at an average 23 MMSMCD. We highlight that the provisional tariff order dt. 19-Feb-2014 on HP network (increasing its levelised tariff from Rs23.99/MMBTU to Rs26.58/MMBTU) has not been accounted in Q1FY15.
� We expect EBITDA to bounce back sequentially on the back of higher volumes despite factoring-in moderation of take-pay charges.
Ratings and price target – Maintain HOLD
We maintain HOLD on the stock with a revised PT of Rs90 (Rs72 earlier) as we factor-in likely PNGRB tariff order entailing prior period revenue of Rs1.4bn and recurring higher tariffs at Rs26.58/MMBTU vs current Rs23.99/MMBTU for HP network. We roll-forward our valuation to Jun-16E. The current re-structuring of CGD companies may unlock some value and add a potential Rs4 to our SoTP based PT, however pending outcome, we await tangible developments. Contrary to media reports flash on 1 Jul 2014, Gujarat Gas Management has clarified that there are no plans of merger with GSPC.
Exhibit 16:Exhibit 16:Exhibit 16:Exhibit 16: Earnings revision:
Particulars FY15E FY16E
Current Earlier Chg (%) Current Earlier Chg (%)
Revenue 13,008 10,737 21.2 14,434 13,170 9.6
EBITDA 11,435 9,321 22.7 12,526 11,442 9.5
EBITDA margin (%) 91.9 91.7 20 bps 91.0 90.8 20 bps
PAT 5,540 4,123 34.4 6,006 5,280 13.8
Source: Company, Centrum Research Estimates
Petronet LNG (Rating: Downgrade toSELL; Target Price: Rs145)
Exhibit 17: Quarterly Estimates
(Rsmn) Q1FY15 E Q1FY 14 Q4FY 14 YoY (%) QoQ (%) FY15E
Sales 86,443 83,770 1,04,085 3.2 (17.0) 3,75,445
EBITDA 3,842 3,978 3,868 (3.4) (0.7) 14,984
EBITDA Margins (%) 4.4 4.7 3.7 (30 bps) 73 bps 4.0
PAT 1,460 2,253 1,693 (35.2) (13.7) 7,119
Source: Company, Centrum Research Estimates
� During the quarter, despite sharp dip in spot RLNG prices to USD12/MMBTU, demand remained weak. We however factor-in optimistic capacity utilizations. We expect the company to report capacity utilization of 94% at Dahej terminal vs. 102%/91% in Q1FY14 / Q4FY14 respectively. At Kochi terminal, utilization rates remain at sub 2% as FACT citing high RLNG prices has stopped drawal of RLNG since 10-Jan-2014. Capacity under-utilization and lack of visibility on pipeline connectivity at Kochi-Mangalore and Kochi-Bangalore would continue to hurt earnings.
9 Power and Gas
� We have built-in annual 5% escalation in regas charges and continue to build-in an sustainable trading/marketing margin of USD0.08/MMBTU for the forecast period.
� We have factored in an optimistic 105%/108% capacity utilization for Dahej in FY15/16E and 5%/16% capacity utilization for Kochi terminal for the same forecast period. We do not expect material revenue generation from possible lease of storage tanks at Kochi.
Ratings and price target – Downgrade to SELL
We downgrade the stock to SELL with a revised PT of Rs145 (Rs130 earlier) as it trades above Mean+SD on a one year forward PE(x). The revision in PT is owing to roll-forward to Jun-16E. We have valued Petronet LNG as average of fair value derived on DCFF and PE(x).
NTPC (Standalone) (Rating: Downgrade to SELL; Target Price: Rs125)
Exhibit 18: Quarterly Estimates
(Rsmn) Q1FY15 E Q1FY 14 Q4FY 14 YoY (%) QoQ (%) FY15E
Units sold (BU) 59.3 53.1 58.4 11.6 1.5 232.2
Sales 1,86,715 1,56,129 2,09,381 19.6 (10.8) 7,34,648
EBITDA 49,791 43,142 45,426 15.4 9.6 1,71,674
EBITDA Margins (%) 26.7 27.6 21.7 (97) bps 497 bps 23.4
PAT 27,266 25,270 30,935 7.9 (11.9) 96,249
APAT 27,266 26,975 29,530 1.1 (7.7) 96,249
Source: Company, Centrum Research Estimates
� During the quarter, we expect NTPC to report 59.3 BU (+12% YoY and +2% QoQ) of energy sales. Despite weak demand for gas based power, we expect NTPC to report 41% PLF for gas and 89% for coal stations. PLF for coal stations have been declining MoM from 87% in Apr 14 to 81% in Jun 14 as demand slows down and NTPC stares at acute shortage of coal inventory for most of its stations.
� NTPC has availed of the grace period until Sep 14 to transit to the new CERC tariff norms and hence earnings will be bloated in the interim and revised downwards from 2HFY15. Captive coal mining from Pakhri block is delayed as MDO contract has been terminated whereas the company has guided for production from Chatti-Bariatu and Kerandari mines to commence from Q1FY17.
� NTPC has appealed in HC against CERC tariff norms for FY15-19. As per industry sources, there is low probability of any revision in CERC tariff regulations as it has been framed within the framework of Electricity Act and is legally binding. We continue to follow the CERC regulations for the forecast period and await tangible developments.
Ratings and price target – Downgrade to SELL
We downgrade the stock to SELL and revise our PT to Rs125 (Rs 120 earlier). We have valued NTPC on DCFF. NTPC has traded at more premium multiples historically, but an altered return profile for next 5 years with curtailed incentives certainly does not merit a re-rating as being reflected in the +30% rally in stock. Hence, we downgrade it to SELL as the rally is based on hope and we have already built-in demand revival and hence higher PLF for NTPC for the forecast period.

10 Power and Gas
PTC India (Standalone) (Rating: SELL; Target Price: Rs49)
Exhibit 19: Quarterly Estimates
(Rsmn) Q1FY15 E Q1FY 14 Q4FY 14 YoY (%) QoQ (%) FY15E
Units traded (MU) 10,430 8418 7656 23.9 36.2 41,405
Sales 33,377 27,704 27,952 20.5 19.4 1,49,964
EBITDA 505 340 447 48.4 13.0 1,976
EBITDA Margins (%) 1.5 1.2 1.6 29 bps (9 bps) 1.3
PAT 400 297 689 34.8 (42.0) 1,896
Source: Company, Centrum Research Estimates
� PTC India (PTC) has not recovered balance overdues of Rs2.5 bn from TNSEB as it remains disputed.
� During the quarter, we expect PTC to clock a volume of 10.4 BU (+55% YoY and +27% QoQ). However, the sales volume mix is skewed towards sale on IEX/PXIL and its share is estimated to be about 34% in Q1FY15E vs. 27%/24% in Q4FY14/Q1FY14. A higher share of trade on IEX/PXIL implies (1) higher proportion of working capital being blocked; (2) lower trading margins and (3) an inability to identify buyer/seller under bilateral trade and hence negative.
� We built-in robust trading margin of Rs0.3/kWh for its erstwhile tolling projects and Rs0.08/kWh from export of 250 MW to Bangladesh. Net rebate/surcharge which measures efficiency of working capital will be a key variable. We have factored in earnings of Rs100mn.
Ratings and price target – Maintain SELL
We continue to maintain our negative stance on PTC India and see stock fundamentals as weak. We retain our SELL rating on PTC India and our PT of Rs49. We have valued PTC as the average of fair value derived on PE(x) and PB(x) and based on Jun-16.
Tata Power (Rating: Maintain SELL; Target Price: Rs85)
Exhibit 20: Quarterly Estimates
(Rsmn) Q1FY15 E Q1FY 14 Q4FY 14 YoY (%) QoQ (%) FY15E
Sales 94,997 92,918 88,052 2.2 7.9 3,77,316
EBITDA 19,834 20,668 18,215 (4.0) 8.9 84,626
EBITDA Margins (%) 20.9 22.2 20.7 (137 bps) 19 bps 22.4
Net Income 2,910 (1,590) (1,884) NM NM 18,359
Source: Company, Centrum Research Estimates
� Although the company has raised supplementary bills to factor-in CERC’s compensatory tariff, our channel checks reveal that SEBs have not paid the compensatory tariff. We see challenges in implementation of CERC tariff order as SEBs are likely to challenge it with the SC, if APTEL decides to uphold CERC’s tariff order. We however continue to be optimistic and follow CERC’s compensatory tariff order.
� Profit from coal business segment remains the key variable. Until the first tranche of stake sale receipts over Arutmin mine is not received, Tata Power is likely to continue to account for Arutmin coal sales. We have accordingly factored-in coal sales volume from KPC and Arutmin at 20 MMTPA, as the first tranche from Arutmin stake sale is not received and the entire proceeds are likely to be concluded by Q4FY15.
� We expect the company to post a net income of Rs2.9bn on the back of inclusion of compensatory tariff for Mundra UMPP and modest coal realizations. We also factor-in higher dividend receipts from coal business and hence expect earnings to be buoyant.
Ratings and price target – Maintain SELL
We reiterate that equity dilution by 14% in Apr-14 is negative as interest cost savings have a neutral impact to 75% of our SoTP price target, it being regulated and hence a drag on fair equity value. In a scenario of stay on CERC compensatory tariff order, it would de-rate Tata Power as it faces the risk of earnings downgrades and our price target then would be Rs59.
11 Power and Gas
nterprises
Appendix A
Disclaimer
Centrum Broking Limited (“Centrum”) is a full-service, Stock Broking Company and a member of The Stock Exchange, Mumbai (BSE) and National Stock Exchange of India Ltd. (NSE). Our holding company, Centrum Capital Ltd, is an investment banker and an underwriter of securities. As a group Centrum has Investment Banking, Advisory and other business relationships with a significant percentage of the companies covered by our Research Group. Our research professionals provide important inputs into the Group's Investment Banking and other business selection processes.
Recipients of this report should assume that our Group is seeking or may seek or will seek Investment Banking, advisory, project finance or other businesses and may receive commission, brokerage, fees or other compensation from the company or companies that are the subject of this material/report. Our Company and Group companies and their officers, directors and employees, including the analysts and others involved in the preparation or issuance of this material and their dependants, may on the date of this report or from, time to time have "long" or "short" positions in, act as principal in, and buy or sell the securities or derivatives thereof of companies mentioned herein. Centrum or its affiliates do not own 1% or more in the equity of this company Our sales people, dealers, traders and other professionals may provide oral or written market commentary or trading strategies to our clients that reflect opinions that are contrary to the opinions expressed herein, and our proprietary trading and investing businesses may make investment decisions that are inconsistent with the recommendations expressed herein. We may have earlier issued or may issue in future reports on the companies covered herein with recommendations/ information inconsistent or different those made in this report. In reviewing this document, you should be aware that any or all of the foregoing, among other things, may give rise to or potential conflicts of interest. We and our Group may rely on information barriers, such as "Chinese Walls" to control the flow of information contained in one or more areas within us, or other areas, units, groups or affiliates of Centrum. Centrum or its affiliates do not make a market in the security of the company for which this report or any report was written. Further, Centrum or its affiliates did not make a market in the subject company’s securities at the time that the research report was published.
This report is for information purposes only and this document/material should not be construed as an offer to sell or the solicitation of an offer to buy, purchase or subscribe to any securities, and neither this document nor anything contained herein shall form the basis of or be relied upon in connection with any contract or commitment whatsoever. This document does not solicit any action based on the material contained herein. It is for the general information of the clients of Centrum. Though disseminated to clients simultaneously, not all clients may receive this report at the same time. Centrum will not treat recipients as clients by virtue of their receiving this report. It does not constitute a personal recommendation or take into account the particular investment objectives, financial situations, or needs of individual clients. Similarly, this document does not have regard to the specific investment objectives, financial situation/circumstances and the particular needs of any specific person who may receive this document. The securities discussed in this report may not be suitable for all investors. The securities described herein may not be eligible for sale in all jurisdictions or to all categories of investors. The countries in which the companies mentioned in this report are organized may have restrictions on investments, voting rights or dealings in securities by nationals of other countries. The appropriateness of a particular investment or strategy will depend on an investor's individual circumstances and objectives. Persons who may receive this document should consider and independently evaluate whether it is suitable for his/ her/their particular circumstances and, if necessary, seek professional/financial advice. Any such person shall be responsible for conducting his/her/their own investigation and analysis of the information contained or referred to in this document and of evaluating the merits and risks involved in the securities forming the subject matter of this document.
The projections and forecasts described in this report were based upon a number of estimates and assumptions and are inherently subject to significant uncertainties and contingencies. Projections and forecasts are necessarily speculative in nature, and it can be expected that one or more of the estimates on which the projections and forecasts were based will not materialize or will vary significantly from actual results, and such variances will likely increase over time. All projections and forecasts described in this report have been prepared solely by the authors of this report independently of the Company. These projections and forecasts were not prepared with a view toward compliance with published guidelines or generally accented accounting principles. No independent accountants have expressed an opinion or any other form of assurance on these projections or forecasts. You should not regard the inclusion of the projections and forecasts described herein as a representation or warranty by or on behalf of the Company, Centrum, the authors of this report or any other person that these projections or forecasts or their underlying assumptions will be achieved. For these reasons, you should only consider the projections and forecasts described in this report after carefully evaluating all of the information in this report, including the assumptions underlying such projections and forecasts.
The price and value of the investments referred to in this document/material and the income from them may go down as well as up, and investors may realize losses on any investments. Past performance is not a guide for future performance. Future returns are not guaranteed and a loss of original capital may occur. Actual results may differ materially from those set forth in projections. Forward-looking statements are not predictions and may be subject to change without notice. Centrum does not provide tax advice to its clients, and all investors are strongly advised to consult regarding any potential investment. Centrum and its affiliates accept no liabilities for any loss or damage of any kind arising out of the use of this report. Foreign currencies denominated securities are subject to fluctuations in exchange rates that could have an adverse effect on the value or price of or income derived from the investment. In addition, investors in securities such as ADRs, the value of which are influenced by foreign currencies effectively assume currency risk. Certain transactions including those involving futures, options, and other derivatives as well as non-investment-grade securities give rise to substantial risk and are not suitable for all investors. Please ensure that you have read and understood the current risk disclosure documents before entering into any derivative transactions.
This report/document has been prepared by Centrum, based upon information available to the public and sources, believed to be reliable. No representation or warranty, express or implied is made that it is accurate or complete. Centrum has reviewed the report and, in so far as it includes current or historical information, it is believed to be reliable, although its accuracy and completeness cannot be guaranteed. The opinions expressed in this document/material are subject to change without notice and have no obligation to tell you when opinions or information in this report change.
This report or recommendations or information contained herein do/does not constitute or purport to constitute investment advice in publicly accessible media and should not be reproduced, transmitted or published by the recipient. The report is for the use and consumption of the recipient only. This publication may not be distributed to the public used by the public media without the express written consent of Centrum. This report or any portion hereof may not be printed, sold or distributed without the written consent of Centrum.
The distribution of this document in other jurisdictions may be restricted by law, and persons into whose possession this document comes should inform themselves about, and observe, any such restrictions. Neither Centrum nor its directors, employees, agents or representatives shall be liable for any damages whether direct or indirect, incidental, special or consequential including lost revenue or lost profits that may arise from or in connection with the use of the information.
This document does not constitute an offer or invitation to subscribe for or purchase or deal in any securities and neither this document nor anything contained herein shall form the basis of any contract or commitment whatsoever. This document is strictly confidential and is being furnished to you solely for your information, may not be distributed to the press or other media and may not be reproduced or redistributed to any other person. The distribution of this report in other jurisdictions may be restricted by law and persons into whose possession this report comes should inform themselves about, and observe any such restrictions. By accepting this report, you agree to be bound by the fore going limitations. No representation is made that this report is accurate or complete.

12 Power and Gas
nterprises
The opinions and projections expressed herein are entirely those of the author and are given as part of the normal research activity of Centrum Broking and are given as of this date and are subject to change without notice. Any opinion estimate or projection herein constitutes a view as of the date of this report and there can be no assurance that future results or events will be consistent with any such opinions, estimate or projection.
This document has not been prepared by or in conjunction with or on behalf of or at the instigation of, or by arrangement with the company or any of its directors or any other person. Information in this document must not be relied upon as having been authorized or approved by the company or its directors or any other person. Any opinions and projections contained herein are entirely those of the authors. None of the company or its directors or any other person accepts any liability whatsoever for any loss arising from any use of this document or its contents or otherwise arising in connection therewith.
Centrum and its affiliates have not managed or co-managed a public offering for the subject company in the preceding twelve months. Centrum and affiliates have not received compensation from the companies mentioned in the report during the period preceding twelve months from the date of this report for service in respect of public offerings, corporate finance, debt restructuring, investment banking or other advisory services in a merger/acquisition or some other sort of specific transaction.
As per the declarations given by them, Mr. Sachin Mehta, research analyst and and/or any of his family members do not serve as an officer, director or any way connected to the company/companies mentioned in this report. Further, as declared by him, he has not received any compensation from the above companies in the preceding twelve months. He does not hold any shares by him or through his relatives or in case if holds the shares then will not to do any transactions in the said scrip for 30 days from the date of release such report. Our entire research professionals are our employees and are paid a salary. They do not have any other material conflict of interest of the research analyst or member of which the research analyst knows of has reason to know at the time of publication of the research report or at the time of the public appearance.
While we would endeavour to update the information herein on a reasonable basis, Centrum, its associated companies, their directors and employees are under no obligation to update or keep the information current. Also, there may be regulatory, compliance or other reasons that may prevent Centrum from doing so.
Non-rated securities indicate that rating on a particular security has been suspended temporarily and such suspension is in compliance with applicable regulations and/or Centrum policies, in circumstances where Centrum is acting in an advisory capacity to this company, or any certain other circumstances.
This report is not directed to, or intended for distribution to or use by, any person or entity who is a citizen or resident of or located in any locality, state, country or other jurisdiction where such distribution, publication, availability or use would be contrary to law or regulation or which would subject Centrum Broking Limited or its group companies to any registration or licensing requirement within such jurisdiction. Specifically, this document does not constitute an offer to or solicitation to any U.S. person for the purchase or sale of any financial instrument or as an official confirmation of any transaction to any U.S. person unless otherwise stated, this message should not be construed as official confirmation of any transaction. No part of this document may be distributed in Canada or used by private customers in United Kingdom.
The information contained herein is not intended for publication or distribution or circulation in any manner whatsoever and any unauthorized reading, dissemination, distribution or copying of this communication is prohibited unless otherwise expressly authorized. Please ensure that you have read “Risk Disclosure Document for Capital Market and Derivatives Segments” as prescribed by Securities and Exchange Board of India before investing in Indian Securities Market.
Rating Criteria
Rating Market cap < Rs20bn Market cap > Rs20bn but < 100bn Market cap > Rs100bn
Buy Upside > 25% Upside > 20% Upside > 15%
Hold Upside between -25% to +25% Upside between -20% to +20% Upside between -15% to +15%
Sell Downside > 25% Downside > 20% Downside > 15%
Member (NSE, BSE, MCX-SX), Depository Participant (CDSL) and SEBI registered Portfolio Manager
Registration Nos.
CAPITAL MARKET SEBI REGN. NO.: BSE: INB011454239, NSE: INB231454233
DERIVATIVES SEBI REGN. NO.: NSE: INF231454233 (TRADING & SELF CLEARING MEMBER)
CDSL DP ID: 12200. SEBI REGISTRATION NO.: IN-DP-CDSL-661-2012
PMS REGISTRATION NO.: INP000004383
MCX – SX (Currency Derivative segment) REGN. NO.: INE261454230
Website: www.centrum.co.in
Investor Grievance Email ID: [email protected]
Compliance Officer Details:
Tel: (022) 4215 9413; Email ID: [email protected]
Centrum Broking Limited
Registered Office Address
Bombay Mutual Building ,
2nd Floor,
Dr. D. N. Road, Fort, Mumbai - 400 001
Correspondence Address
Centrum House
6th Floor, CST Road, Near Vidya Nagari Marg, Kalina,
Santacruz (E), Mumbai 400 098.
Tel: (022) 4215 9000