poverty scoring for myanmar - the mimu
TRANSCRIPT

Poverty Scoring for Myanmar
Mark Schreiner microfinance.com
UNDP/Myanmar
Yangon, 1 August 2012

1
UNDP Objectives for Poverty Scoring
1. Estimate participants’ poverty rates:
— Compare across villages, townships, etc. — Measure change (impact?) over time — Report single summary number — Manage social performance
2. Target services to poorer:
— Households (livelihood grants) — Areas (place offices in townships,
choose villages to serve in given township)

2
Objectives for Today
Learn where Myanmar’s poverty scorecard comes from and how it works
Discuss options for targeting
Present possible operational processes for: — Sampling — Data-entry — Quality control — Managing targeting exceptions
3
What Does Poverty Scoring Do?
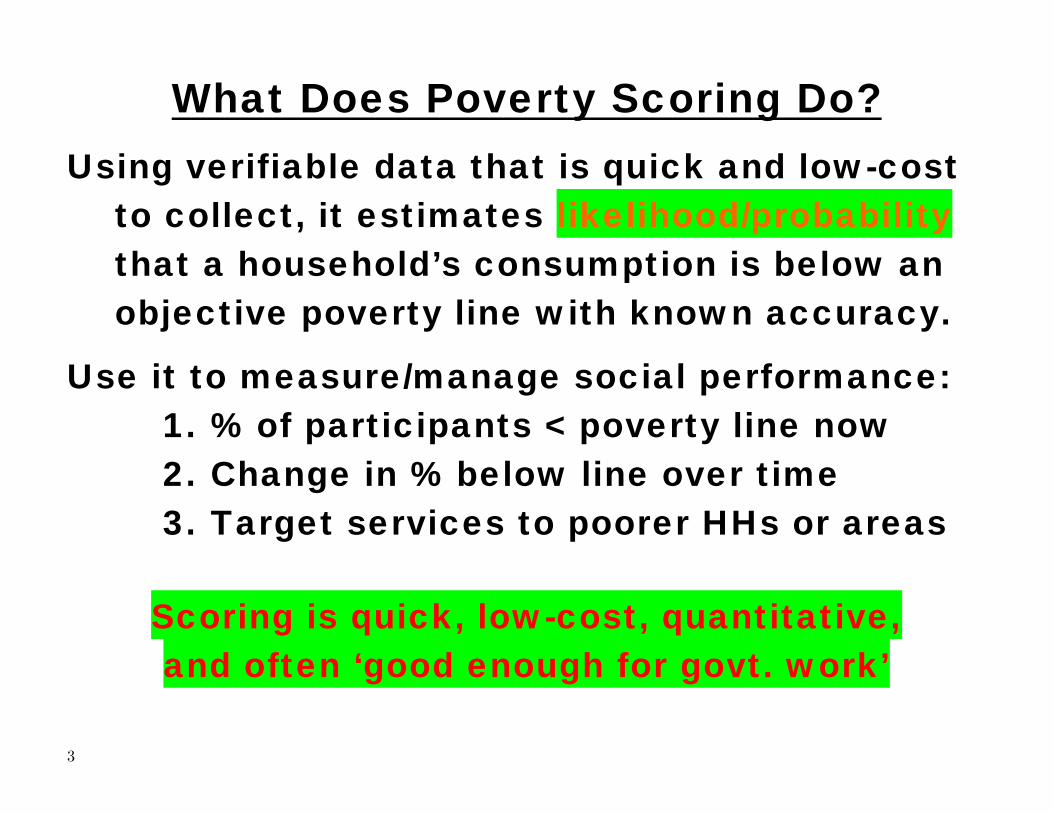
Using verifiable data that is quick and low-cost to collect, it estimates likelihood/probability that a household’s consumption is below an objective poverty line with known accuracy.
Use it to measure/manage social performance: 1. % of participants < poverty line now 2. Change in % below line over time 3. Target services to poorer HHs or areas
Scoring is quick, low-cost, quantitative, and often ‘good enough for govt. work’

4
Countries w/Poverty Scorecards
Afghanistan El Salvador Mexico Rwanda Bangladesh Ethiopia Morocco Russia Benin Ghana Mozambique Senegal Bolivia Guatemala Myanmar Sierra Leone Brazil Haiti Nepal South Africa Burkina Faso Honduras Nicaragua Sri Lanka Cambodia India Nigeria Syria China Indonesia Pakistan Tanzania Colombia Jordan Palestine Timor-Leste Dominican Rep. Kenya Peru Uganda Ecuador Malawi Philippines Vietnam Egypt Mali Romania Yemen
>90% of people below $1.25/day live in the 48 countries with a poverty scorecard

5
Poverty Scoring and Wealth Ranking
Scoring: — Defines poverty narrowly (value of consumption) — Looks at broad patterns among 10 indicators — Based on IHLCA data, has known accuracy — One standard for entire Union — Quantitative and consistent, so comparable
across villages and over time — Requires skilled enumerator
Wealth Ranking: — Defines poverty holistically/comprehensively — Looks at each HH, can adjust for exceptional cases — Based on participatory judgment, unknown accuracy — Standard varies by village — Subjective and so non-comparable — Requires skilled facilitator
6
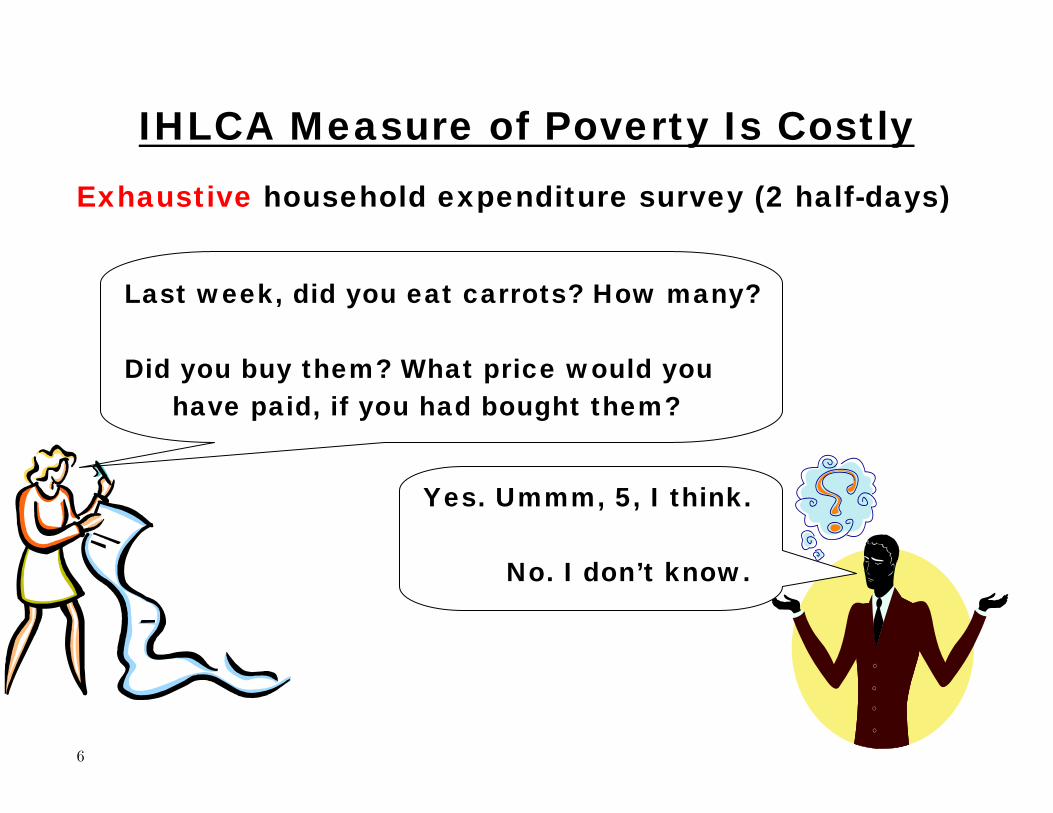
IHLCA Measure of Poverty Is Costly
Exhaustive household expenditure survey (2 half-days)
Last week, did you eat carrots? How many?
Did you buy them? What price would you
have paid, if you had bought them?
Yes. Ummm, 5, I think.
No. I don’t know.

7
Poverty Scoring Costs Less
About 10-minute scorecard w/observable indicators
Earth Open fire
What floor do you have? What stove you use?

Simple Poverty Scorecard for Myanmar Location Entity Additional data
Survey No.: Village: Name of HH head: Township: Field office: WR Class: City/town: Date scored: Started w/UNDP: Ward/village tract: Enumerator: # HH members:
Indicator Response Points ScoreA. Eight or more 0 B. Seven 6 C. Six 10 D. Five 14 E. Four 19 F. Three 26
1. How many members does the household have?
G. One or two 34
A. No female head/spouse 0 B. None, KG, or first standard 1 C. Second standard 7 D. Third to fifth standard 8
2. What is the highest standard/diploma/degree that the female head/spouse has passed?
E. Sixth standard or higher 9
A. One or none 0 B. Two 2 C. Three 3 D. Four 4
3. How many rooms does the household occupy, including bedrooms, living rooms, and rooms used for household businesses (do not count toilets, kitchens, balconies, nor corridors)?
E. Five or more 9
A. Earth/sand, palm/bamboo, combination earth and wood/palm/bamboo, or other 0 4. What is the major construction
material of the floor (observe, do not ask)? B. Wood planks, parquet or polished wood, tongue-and-groove wood,
cement, wood with covering, cement with covering, or a combination of cement/finished wood and something else
5
A. Thatch/large leaves/palm/dhani, or tarpaulin 0 B. Bamboo, or rudimentary wood 2 C. Unbaked brick and mud, finished wood, or other 3
5. What is the major construction material of the external (outer) walls (observe, do not ask)? D. Baked brick and cement, or pucca cement 9
A. Open fire, open stove, rice-husk stove, or traditional closed stove 0 6. What type of stove is used most often for cooking food in the household?
C. A1 improved stove, other improved stove, stove using electricity, gas, kerosene/diesel, or biofuel, or other 4
A. Neither 0 B. One, but not both 1
7. Does any member of your household own or have access to a cupboard or a food-storage cabinet (including one rented to others or pawned)?
C. Both 5
A. No 0 8. Does any member of your household own or have access to a black-and-white or colour TV (including one rented to others or pawned)? B. Yes 9
A. No, none of these 0 B. Only bicycle or non-motorized boat 4
9. Does household member own or have access to a bicycle or non-motorized boat, a motorcycle, power tiller, trishaw, motorboat, trawlarjee, three-wheeled motor vehicle, motorcar (4 wheels or more), or tractor (including one rented to others or pawned)?
C. Motorcycle, power tilller, trishaw, motorboat, trawlarjee, three-wheeled motor vehicle, motorcar (4 wheels or more), or tractor (regardless of bicycle or non-motorized boat)
8
A. Landless agricultural household 0
B. Non-agricultural household 1
C. Agricultural household with land, but no non-draught large animals
4
10. If any household member’s main job is connected with agriculture, hunting, forestry, fishery, mining, or quarrying, and if any household member owns or has the right to use land for agriculture, forestry, pasture, livestock breeding, or water surfaces, then does the household own any non-draught oxen, non-draught buffalo, cows, mythun, horses, or donkeys/mules (including ones rented to others or pawned to others)?
D. Agricultural household with land and with non-draught large animals 8
Microfinance Risk Management, L.L.C., microfinance.com Score:

Worksheet: Household Roster and Main Job
At the start of the interview, read the following to the respondent: Please tell me the names and ages of all the persons who usually sleep in the dwelling, eat most of their meals here, and share expenses together. You should include all members of the family, including any children or other persons who may be away for study or work but who consider this as their permanent residence. It also includes any other people who are not blood relatives but who normally sleep here, eat most of their meals here, and share expenses. Write the names and ages of all household members. For each member 10-years-old or older, ask the respondent whether he/she in his/her main job is connected to agriculture, hunting, forestry, fishery, mining, or quarrying. Count the total number of household members, write it next to “# household members” on the right side of the header of the scorecard, and use it to mark the response to Question 1. You will use the responses related to the main job of each member later when marking Question 10.
Name of household member Age In his/her main job, is <name> connected
to agriculture, hunting, forestry, fishery, mining, or quarrying?
1. No Yes 2. No Yes 3. No Yes 4. No Yes 5. No Yes 6. No Yes 7. No Yes 8. No Yes 9. No Yes 10. No Yes 11. No Yes 12. No Yes 13. No Yes 14. No Yes 15. No Yes

10
How is a Scorecard Constructed?
Derived from data from Myanmar’s 2009/10 IHLCA
For IHLCA HHs, consumption-based poverty status (poverty line of MMK1,010/person/day) is known
I use statistics (not just my judgment) to select indicators and to assign points to reflect how indicators are linked with poverty status
Total points (scores) range from 0 (most likely below poverty line) to 100 (least likely below line)

11
Scorecard Feedback and Revisions
3 draft scorecards to find 17 finalist indicators 4th draft after HDI managers rate finalists Pilot w/200 HH in Ayeyarwady, Kayin, Shan:
— About 10 interviews/day/enumerator — Measure overlap of scoring and wealth ranking
5th (final) draft after pilot Overall impact of feedback:
— Avoided some indicators that vary by region — Replaced indicator field staff found backwards — Replaced indicator that ignored land quality — Many smaller adjustments — Improved ‘Guidelines’ and training materials
Final scorecard balances goals/constraints of IHLCA, data, users

12
What Do Poverty Scores Mean?Score
Poverty Likelihood (%)
0–4 83.45–9 76.1
10–14 68.615–19 60.420–24 48.825–29 41.630–34 29.535–39 23.340–44 15.045–49 10.650–54 7.455–59 3.560–64 1.265–69 1.070–74 0.375–79 0.080–84 0.085–89 0.090–94 0.095–100 0.0
HHs who score 19 have a 60.4% probability (poverty likelihood) of being below the national poverty line
13
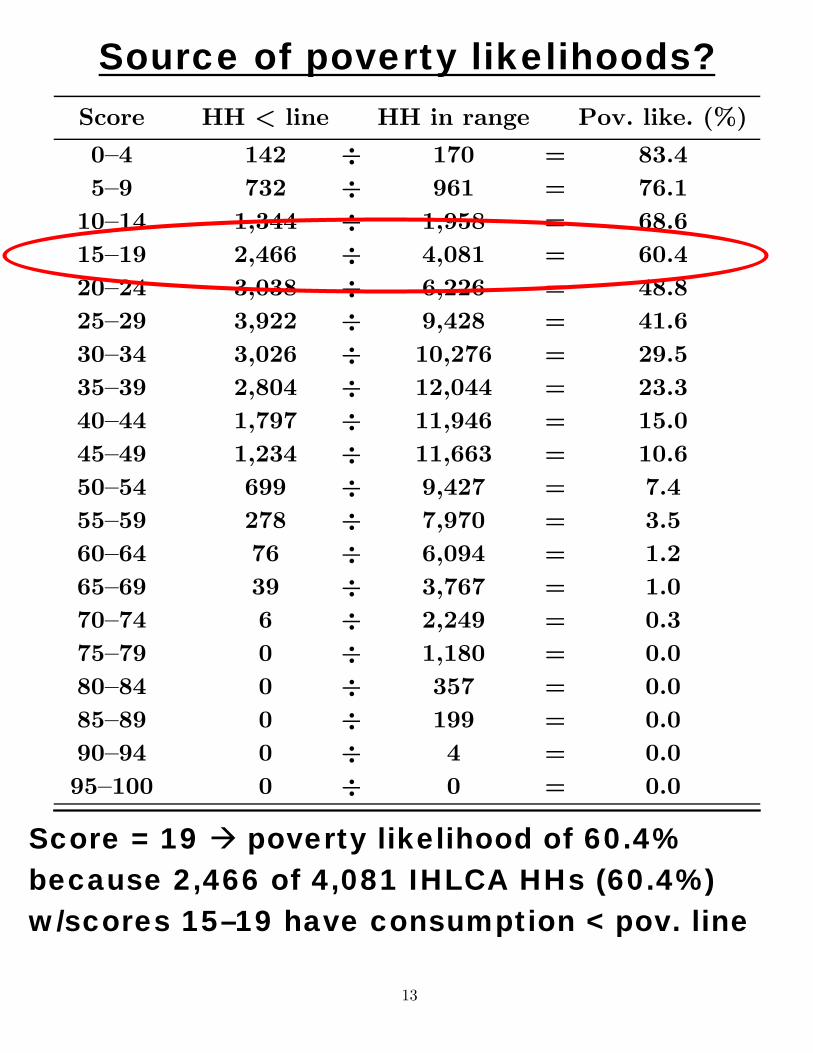
Source of poverty likelihoods?
Score HH < line HH in range Pov. like. (%)0–4 142 ÷ 170 = 83.45–9 732 ÷ 961 = 76.1
10–14 1,344 ÷ 1,958 = 68.615–19 2,466 ÷ 4,081 = 60.420–24 3,038 ÷ 6,226 = 48.825–29 3,922 ÷ 9,428 = 41.630–34 3,026 ÷ 10,276 = 29.535–39 2,804 ÷ 12,044 = 23.340–44 1,797 ÷ 11,946 = 15.045–49 1,234 ÷ 11,663 = 10.650–54 699 ÷ 9,427 = 7.455–59 278 ÷ 7,970 = 3.560–64 76 ÷ 6,094 = 1.265–69 39 ÷ 3,767 = 1.070–74 6 ÷ 2,249 = 0.375–79 0 ÷ 1,180 = 0.080–84 0 ÷ 357 = 0.085–89 0 ÷ 199 = 0.090–94 0 ÷ 4 = 0.095–100 0 ÷ 0 = 0.0
Score = 19 poverty likelihood of 60.4% because 2,466 of 4,081 IHLCA HHs (60.4%) w/scores 15–19 have consumption < pov. line

14
Three Uses of Poverty Scoring
1. Estimate poverty rates at point in time: — One summary number for reporting — Set goals and track progress
(all-UNDP, district, field office) — ‘You manage what you measure’
2. Track changes in poverty over time: — Scoring does not tell why poverty changed
(to measure impact, plan for control group)
3. Target clients or areas: — Enter/exit areas based on their poverty — Set goals for poverty rate of new participants — Allot budget by number of poor being served — Qualify individual HH for livelihood projects

15
1. Estimating Poverty Rates
A group’s estimated poverty rate is the average of its members’ poverty likelihoods.
Sample of 300 clients, 01jan13
Clients Score 1/1/13 Poverty likelihood (%)
100 20 48.8 100 30 29.5 100 40 15.0
Average(=Poverty rate %): 31.1

16
2. Tracking Change in Poverty Rates
Estimate a group’s poverty rate twice, then take the difference.
300 clients, 01jan13 and 31dec15 Score Poverty likelihood (%)
Clients 2013 2015 2013 2015 100 20 25 48.8 41.6 100 30 30 29.5 29.5 100 40 45 15.0 10.6
Average(=Poverty rate): 31.1 27.2
Clients’ poverty rate fell by (31.1 – 27.2) = 3.9 percentage points.
3.9 ÷ 31.1 = 12.5% of poor clients left poverty.

17
3. Targeting Households
Cut-off% of all
HHs targeted
Pov. rate among
targeted
% of poor HHs
targeted<=4 0.2 58.8 0.5<=9 1.1 77.4 4.1<=14 3.1 68.2 9.9<=19 7.2 62.1 21.0<=24 13.4 56.5 35.6<=29 22.8 49.1 52.7<=34 33.1 43.5 67.9<=39 45.1 37.5 79.6<=44 57.1 33.2 89.3<=49 68.8 29.2 94.4<=54 78.2 26.6 97.8<=59 86.1 24.5 99.4<=64 92.2 23.0 99.8<=69 96.0 22.1 100.0<=74 98.3 21.6 100.0<=79 99.4 21.4 100.0<=84 99.8 21.3 100.0<=89 100.0 21.2 100.0<=94 100.0 21.2 100.0<=100 100.0 21.2 100.0
33.1% of all HHs score 34 or less. 43.5% of targeted HHs are < pov. line. 67.9% of poor HHs are targeted.

18
Example 5-Class System
Cut-off% of all
HHs targeted
Pov. rate among
targeted
% of poor HHs
targeted<=4 0.2 58.8 0.5<=9 1.1 77.4 4.1<=14 3.1 68.2 9.9<=19 7.2 62.1 21.0<=24 13.4 56.5 35.6<=29 22.8 49.1 52.7<=34 33.1 43.5 67.9<=39 45.1 37.5 79.6<=44 57.1 33.2 89.3<=49 68.8 29.2 94.4<=54 78.2 26.6 97.8<=59 86.1 24.5 99.4<=64 92.2 23.0 99.8<=69 96.0 22.1 100.0<=74 98.3 21.6 100.0<=79 99.4 21.4 100.0<=84 99.8 21.3 100.0<=89 100.0 21.2 100.0<=94 100.0 21.2 100.0<=100 100.0 21.2 100.0
C
A
B
D
E

19
Targeting Geographic Areas
Exit/remain in current townships/villages: — Exit places serving the fewest poor — Sample (if you will not target HHs if you stay),
otherwise census
Enter new townships/villages: — Narrow down possible areas:
For state/regions and districts, use IHLCA For townships, use WFP rankings Consult district/township officials
— Score candidate villages w/sample or census
Other area-targeting approaches (McCarty): — Allot budget in proportion to poor served — Enter only poorest areas, serving all there — Integrate scorecard in GoM Population Census — Make scorecard using only indicators in Census

20
Example Poverty Estimates from Pilot
Share < Natl. line (%)
n All 71 UNDP targeted
Lowest 71 scores
Delta 74 29 38 45 Kayin 53 25 49 56 Shan 70 24 39 48 All pilot 197 26 41 49 All Myanmar (IHLCA): 21%. All rural: 25%

21
Overlap, Scoring/Wealth Ranking
Scoring Targeted Non-targeted
Targeted 47 24
WR
Non-targeted 24 102
WR targeted 71 of 197 HHs
Among lowest-scoring 71, overlap w/those targeted by WR was 2 in 3
Among highest-scoring 126, overlap w/those not targeted by WR was 4 in 5
Scoring and WR define ‘poverty’ differently. Neither is right or wrong, but WR is incumbent

22
How to Deal with Exceptions?
What if HH was targeted by WR but not by scoring? (or vice versa)
Not an issue in new areas or if not targeting
Enumerator must see something scoring misses: — Disabled — Small, elderly HH with low income — Large HH with many earners and few dependents
Exceptions are permitted (abuse is not): — If targeted now, qualify regardless of score? — Adapt current WR system for exceptions
to manage exceptions for scoring — Limit # or % of HHs in area who can be excepted

23
Getting Field Staff ‘Buy-In’
UNDP staff know/trust wealth ranking. In their minds, WR is ‘right’, and scoring is scary (and sometimes makes targeting mistakes)
Field staff can undermine scoring if they want
Challenge is not statistical (we know how well scoring works if used properly) but rather getting organizational change so that it is used properly
Transparency helps staff understand how scoring works and thus accept its value
Listen to staff in process of feedback and revision
Plan to permit reasonable exceptions

24
Data Quality
Quality of scoring data matters because it drives decisions that affect poor HHs
Scorecard is transparent to get field-staff ‘buy-in’ when they understand and accept its usefulness
Rule: Follow IHLCA practice when applying scoring
All enumerators must be trained (MY materials available) and follow ‘Guidelines to Interpretation’
To discourage cheating, ‘social auditor’ (like financial auditor) should interview random sample a second time and compare answers to original

25
Fitting Scoring with Current Processes
CDFs are enumerators
Admin. assistants supply CDFs w/paper scorecards, key data, back up data, send data to Yangon
Adapt existing WR processes for: — Managing exceptions — Tracking who has been scored — Tracking HHs’ targeting status
UNDP/Yangon analyzes data, sets goals, measures progress, reports results, relates poverty data with other data
2–3 teams of 2 ‘social auditors’ tour Union

26
Roll-out
Sampling approaches:
— To estimate poverty rates to target areas, random sample of HHs in current or potential villages
— To target particular HHs, census all HHs
Approaches to roll-out:
— Big push: Scoring is main job of CDFs until done
— Combine trips: For a few months, CDFs score HHs who they happen to meet as part of regular project work. Then do ‘small push’ for a few weeks to score all remaining HHs

27
Use Scoring Data to Manage
To target, score HHs in 2012/13 (or when evaluating potential new project villages) — Could use WR to target HH, and scoring to target
villages and measure change/impact. Depends on: Costs Whether scoring targets accurately enough
— Or use scoring for all purposes
To measure change, score again at project end (2015)
To measure UNDP’s impact, compare change between project villages and controls (best controls are villages that UNDP almost picked but did not, or HHs in project villages just above targeting cut-off)

28
FOR MEASURING POVERTY AND TARGETING THE POOR,
POVERTY SCORING IS SIMPLE,
LOW-COST, QUANTITATIVE,
TRANSPARENT, and
OF KNOWN ACCURACY.