poverty policy framework in nwfp - riportriport.org/wp-content/uploads/pdf...
TRANSCRIPT


K&P, Consultancy Services, Peshawar.
Poverty Policy Framework in NWFP
TABLE OF CONTENTS
EXECUTIVE SUMMARY ........................................................................................................................... I
1. INTRODUCTION............................................................................................................................... 1
1.1. BACKGROUND .............................................................................................................................. 1 1.2. INCEPTION REPORT ....................................................................................................................... 1 1.3. SCOPE OF WORK AND INTERMEDIATE OUTPUTS ............................................................................ 1 1.4. FINAL OUTPUT .............................................................................................................................. 1 1.5. RESEARCH AND INTERVIEWS ........................................................................................................ 2 1.6. MEETING OF THE STEERING COMMITTEE ...................................................................................... 2
2. ECONOMIC PROFILES & MDG IMPLEMENTATION ............................................................. 1
2.1. INTRODUCTION............................................................................................................................. 1 2.2. PAKISTAN’S ECONOMIC PROFILE ................................................................................................. 1 2.3. NWFP’S ECONOMIC PROFILE ...................................................................................................... 2 2.4. STRUCTURE OF NWFP’S PUBLIC FINANCE .................................................................................. 3
3. INTERNATIONAL ASPECTS OF POVERTY REDUCTION STRATEGY............................... 5
3.1. HISTORICAL BACKGROUND .......................................................................................................... 5
4. ANALYSIS OF POVERTY POLICY REFORM PROCESS ......................................................... 8
4.1. POVERTY REDUCTION STRATEGY IN PAKISTAN & NWFP ........................................................... 8 4.2. NWFP PROVINCIAL REFORM PROGRAMME-1 .............................................................................. 9 4.3. THE NWFP PRSP .......................................................................................................................10 4.4. MISSING LINKS BETWEEN NATIONAL & NWFP PRSP ...............................................................11 4.5. COMPARISON OF THE NATIONAL AND THE PROVINCIAL PRSP .....................................................12 4.6. MAIN FEATURES OF THE PROVINCIAL REFORM PROGRAMME - 2 ................................................14 4.7. THREATS TO POVERTY REDUCTION STRATEGY IN NWFP ...........................................................15 4.8. ACHIEVEMENTS UNDER NATIONAL POVERTY REDUCTION STRATEGY ........................................16 4.9. VIEW OF DONORS ON PAKISTAN’S POVERTY REDUCTION STRATEGY .........................................17
5. POTENTIAL OF GROWTH SECTORS FOR POVERTY REDUCTION .................................19
6. LINK BETWEEN PRSP, MDGS & CDF ........................................................................................21
6.1. ALIGNMENT OF POVERTY REDUCTION STRATEGY PAPER WITH MDGS ......................................21 6.2. ACHIEVEMENT OF PROVINCIAL MDG TARGETS IN NWFP .........................................................21 6.3. SCORE CARD ON MDG ACHIEVEMENT .......................................................................................25 6.4. MDG HUMAN DEVELOPMENT INDEX FOR NWFP DISTRICTS (2005) ..........................................27
7. ANCHORING THE MDGS – USEFULNESS OF VISION 2030, MTDF & MTBF ...................30
7.1. VISION 2030 ................................................................................................................................30 7.2. MEDIUM TERM DEVELOPMENT FRAMEWORK 2005-10 ...............................................................32 7.3. DO WE NEED A MTDF? ..............................................................................................................33 7.4. CONFLICT BETWEEN MTDF , MTBF & NWFP PRP ...................................................................34
8. MAJOR ISSUES IN POVERTY REDUCTION .............................................................................36
8.1. DEFINING SECTORAL OBJECTIVES ..............................................................................................36 8.2. LAND OWNERSHIP .......................................................................................................................36 8.3. DEVELOPING LAND MARKETS ....................................................................................................37 8.4. ROLE OF PRIVATE SECTOR ..........................................................................................................37 8.5. NRM & FORESTRY .....................................................................................................................39 8.6. FOREST REFORM .........................................................................................................................39 8.7. ENVIRONMENT ............................................................................................................................40 8.8. GENDER ......................................................................................................................................41

K&P, Consultancy Services, Peshawar.
8.9. ROLE OF LOCAL GOVERNMENT IN POVERTY REDUCTION ...........................................................42 8.10. CONSULTATIVE PROCESS ............................................................................................................43
9. NEXT STEPS .....................................................................................................................................44
10. CONCLUSION ..............................................................................................................................44
ANNEXURES ..............................................................................................................................................45
ANNEX 1 : POVERTY POLICY REFORM MATRIX .........................................................................................46 ANNEX 2 : TORS .......................................................................................................................................44 ANNEX 3: FINAL INCEPTION REPORT .........................................................................................................45 ANNEX 4 : LIST OF ORGANIZATION INTERVIEWED .....................................................................................50 ANNEX 5: PRINCIPLES OF MAKING PRSP ..................................................................................................51 ANNEX 6: HOUSEHOLD LIVELIHOOD SECURITY ANALYSIS FRAMEWORK ..................................................52 ANNEX 7 : PICTOGRAPH OF MAIN REFORMS EFFECTS UNDER ....................................................................53 ANNEX 8: PROGRESS IN NWFP TOWARD KEY MILLENNIUM DEVELOPMENT GOALS (MDGS), 2003 .......54 ANNEX 9: ALIGNMENT UNDER THE PARIS DECLARATION .........................................................................55 ANNEX 10: NWFP BUDGET AT A GLANCE ...............................................................................................56 ANNEX 11: EXAMPLE OF RESOURCE DIVERSION ........................................................................................57 ANNEX 12 : PAKISTAN MILLENNIUM DEVELOPMENT GOALS & TARGETS ................................................58 ANNEX 13 : CHECKLIST OF POVERTY DIAGNOSTICS ...................................................................................60 ANNEX 14: UNSPENT BALANCES OF 2004-05 ...........................................................................................62 ANNEX 15: PROMINENT INEQUALITY- SENSITIVE FACTORS.......................................................................63 ANNEX 16: THE COMING ENERGY CRISES .................................................................................................64 ANNEX 17: COMPREHENSIVE DEVELOPMENT FRAMEWORK IMPLEMENTATION 2003 ...............................65 ANNEX 18: STUDY ON DISPOSAL OF STATE LAND IN NWFP .....................................................................66 ANNEX 19: DIVISION BETWEEN PUBLIC AND PRIVATE SECTOR ROLES ......................................................67
Tables
TABLE 1 : POVERTY HEADCOUNTS ............................................................................................................. 2
TABLE 2 POVERTY GAP AND SEVERITY IN NWFP ...................................................................................... 2
TABLE 3 : CHRONOLOGY OF POVERTY REDUCTION POLICIES IN PAKISTAN & NWFP ................................ 8
TABLE 4 PROJECTED EMPLOYMENT, INVESTMENT AND FISCAL OUTCOMES .............................................38
TABLE 5 LINKS BETWEEN THE ENVIRONMENT AND MDGS ......................................................................40
TABLE 6 : 15 MDG TARGETS WHICH WILL BE MET BY NWFP ...................................................................68
TABLE 7 : 2 MDG TARGETS WHICH CAN BE MET BY NWFP ......................................................................69
TABLE 8 : 14 MDG TARGETS WHOSE ACHIEVEMENT WILL BE DIFFICULT ..................................................70
TABLE 9: MDG HUMAN DEVELOPMENT INDEX OF NWFP DISTRICTS (2005) ...........................................72
TABLE 10 : DISTRICT ROAD & HOUSING ALLOCATIONS 2001-05 ..............................................................73
Figures
FIGURE 1 POVERTY HEADCOUNT ............................................................................................................... 3
FIGURE 2 VIRTUOUS CIRCLE OF GROWTH ................................................................................................13
FIGURE 3 PROGRESS OF MDG POVERTY TARGET .....................................................................................37

K&P, Consultancy Services, Peshawar.
PREFACE & ACKNOWLEDGEMENT This report on “Poverty Policy Framework in NWFP,” is commissioned by the Government of NWFP, with support of IUCN Pakistan. The work on the assignment began in March 2006. This is to acknowledge with appreciation the assistance of Mian Asim Ismail, Economic Analyst of P&D Department and the IUCN Pakistan staff. A word of thanks is also due to the members of the steering committee and its Chair, Hasan Yusufzai, Chief Economist, Planning and Development Department for their valuable suggestions. A special word of thank is due to the many officers of the federal and provincial government for their valuable time and advise / comments for the preparation of the report.
Khalid Aziz, Consultant NWFP, PRSP,
Senior Partner, K&P, Consultancy Services,
Peshawar. October, 2006

K&P, Consultancy Services, Peshawar.
Abbreviations
Poverty Policy Framework in NWFP
ADP Annual Development Programme CAS Country Assistance Strategy CCB Citizen Community Boards CDF Comprehensive Development Framework CFY Current Financial Year CWIQ Core Welfare Indicators Questionnaires DPC Development Policy Credit DFID Department for International Development FBS Federal Bureau of Statistics FDI Foreign Direct Investment FY Financial Year GOP Government of Pakistan Govt Government HIES Household Income Expenditure Survey HLSA Household Livelihood Security Assessment IDA International Development Agency IFI International Financial Institution IMF International Monetary Fund I-PRSP Interim Poverty Reduction Strategy Paper LFY Last Financial Year MDGs Millennium Development Goals MTBF Mid Term budgetary Framework MTEF Mid Term Expenditure Framework MTFF Mid Term Financial Framework NRM Natural Resource Management NWFP North West Frontier Province NWMDG NWFP Millennium Development Goals O&M Operation and Management P&D Planning & Development PDF Pakistan Development Forum PH&ED Public Health and Engineering Department PIFRA Project to Improve Financial Reporting and Auditing PPA Participatory Poverty Assessment PPP Private-Public Partnership PRGF Poverty Reduction Growth Facility PRP Provincial Reform Programme PRS Poverty Reduction Strategy PRSP Poverty Reduction Strategy Paper SAC Structural Adjustment Credit SAP Social Action Programme SMEDA Small and Medium Enterprises Development Authority SMEs Small and Medium Enterprises SPCS Sarhad Provincial Conservation Strategy WAPDA Water and Power Development Authority WTO World Trade Organization

EXECUTIVE SUMMARY FINAL
K&P, Consultancy Services, Peshawar. i
EXECUTIVE SUMMARY
SECTION 1: Introduction The purpose of this report is to provide a framework for the development of a poverty policy framework for NWFP. Before providing recommendations the study examines the national and provincial initiatives taken so far for poverty reduction. The report analyses the weaknesses of programmes and policies and examines the level of comparative human development reached by the province in meeting the MDGs. This report is not a substitute for the PRSP. The report does not go into the strengths of each development sector for poverty reduction. It addresses the overarching policies in multi dimensional sectors like environment, NRM and local government because of their importance. The report concludes by indicating the next steps in the shape of a reform matrix, which is available at Annex 1
SECTION 2: Economic Profiles and MDG Implementation In this section the study establishes the rationale for having a PRSP, which is to implement the MDGs. It finds that international assistance is available, if the conditions given in the CDF are met. It is evident that besides additional assistance, help is provided in debt relief for PRSP participatory nations. The report then examines the important economic highlights relating to poverty in Pakistan and NWFP In the case of Pakistan the main relevant feature are;
In 2005-06, the Pakistan economy grew at a rate of 6.6% per annum (as compared with an 8.6% growth rate target); this is despite an increase in oil prices and devastation caused by the earthquake of 8 Oct, 2005.
Inflation declined from 9% in July 2005, to 6.2% in July 2006, with food inflation coming down from 9.7% to 3.6%.
There was a positive increase in the investment ratio and it reached 20% of GDP.
Worker remittances amounted to $ 4.5 billion, and remained one of the largest source of external finance for Pakistan
FDI exceeded $ 3 billion last year, which is the highest so far.
Real per capita income grew at a rate of 5.7% per annum.
Agriculture sector, which is the main stay of Pakistan‘s economy, contributed 22% of total GDP, and accounted for about 45% of total employment. However, as compared with the previous year‘s growth 6.7%, agriculture grew at only 2.5%. This had a negative impact on poverty since 66% of the country‘s population lives in rural areas. This is a set back reducing livelihood security of a large number of people
In the case of NWFP the important poverty related data shows that;
NWFP has a population of 21 million, which is 14% of Pakistan‘s population.
Agriculture accounts for 24% of NWFP‘s GDP, while industry accounts for 26% of the GDP. The services sector accounts for 54% of its GDP
Poverty in NWFP stood at 46.3% of the total population as compared with 37.3% for Pakistan. The poverty trend has been on the ascendant since 1993-94
58% of the rural population has no land and represents 70% of the population in the bottom / poorest quintile.
Wages in the province declined between 1998-99 and 2001-02. This shows low growth and declining welfare.
Remittances play a vital role in NWFP‘s economy and contribute 30% income of households. 8% of such total remittances come from the Gulf.

EXECUTIVE SUMMARY FINAL
K&P, Consultancy Services, Peshawar. ii
The labour force of NWFP is growing faster than Punjab‘s, which is attributable to NWFP‘s lower participation in education at the middle and secondary level and a higher population growth rate.
The lower than expected NFC award announced by the GOP coupled with the increase in salaries announced by government, has reduced NWFP‘s growth prospects. The emerging resource gap can be met by economizing or by an increase in assistance
NWFP‘s public finances are under extreme pressure, since 57% of its revenues have been prevented from increasing due to an embargo on growth on net profit paid by WAPDA. Secondly, the expected increase from the NFC has not materialized. This places NWFP‘s development lower in 2005 than what it was in 1991. NWFP must grow at a rate of 7-8% per annum in order to create additional employment of 1.2 million jobs per annum; this would help bring down unemployment, which is above 13% of the labor force today. Unfortunately because of poor NFC and net profit transfers, growth will be low in NWFP. Unemployment and poverty will increase if remedial measures are not taken.
SECTION 3: INTERNATIONAL ASPECTS OF POVERTY REDUCTION STRATEGY The study discusses the international aspect of poverty reduction strategy. It notes that priorities change every few years regarding the policies under which foreign assistance is provided to the developing world. Now, with more seriousness than before, a framework for obtaining foreign assistance for implementation of the MDG has been laid down. It gives prominence to the operation of private sector based on free market principles. This is known as the ―Washington Consensus‖ and is a western liberal approach to economics and development. Because of failures in S. America, the strategy is under reconsideration in the World Bank with the creation of a new Commission on Growth and Development. The study finds that the donors are more interested in governability, rather than genuine poverty reduction. The study warns that we should not spend public funds for easing corporate farming business. Such policies will lead to rural unemployment and increase poverty. The study recommends that NWFP should align its policies with international expectations, so as to harmonize them with the principles given in the Paris Declaration.
SECTION 4: ANALYSIS OF POVERTY POLICY REFORM PROCESS Section 4 provides an analysis of poverty polices both at the national and NWFP level. The conclusions of the study are that NWFP has never had a full fledged PRSP based on a sound statistical base. It transformed its PRP-1 and 2 documents as substitutes for PRSP. They are not the same thing. PRP reforms government processes to make them more coherent in the financial sense. PRSP deals with poverty reduction. These are two different categories and should not be mixed. The study also examines the PRP-1 and finds it contained measures, which would lessen fiscal constraints, focus the limited resources on public sector priorities and encourage private sector growth. It emphasized private-public partnership to shift social sector responsibilities to the private sector. It concentrated on reform in agriculture, irrigation, power, roads, education, health, and forestry. It stressed the need to reduce the comparative disadvantage of increased transportation cost for industrial goods. NWFP PRP-1 recognized the provinces advantage in irrigation, hydel generation, minerals, marble, tourism, agriculture, livestock, forestry, agro and mineral processing industries and export of trained manpower and recommended their greater utilization.

EXECUTIVE SUMMARY FINAL
K&P, Consultancy Services, Peshawar. iii
However, PRP-1 suffered from the following weaknesses; Its projection that NWFP‘s receipts from profit on hydel generation will increase substantially did not transpire, thus leading to pressure on the province‘s finances and non-fulfillment of policy reform targets. Secondly, the NWFP PRP-1 suffered from not having indicators, which could be monitored. Such an omission also made it difficult to judge progress; the NWFP PRP-1 was high on good intentions but lacked the logical framework analysis, which would have made it an effective model for policy reform for the benefit of the poor. The NWFP PRP-1, spoke of poverty reduction, but did not give a specific strategy how this was to be achieved? It also did not list measures to achieve the MDGs, for which the NWFP PRP-1 was actually meant. NWFP PRP-1 had its roots in structural adjustment and aimed to prevent a fiscal melt down more than implement a poverty reduction strategy or achieve the MDGs. It remains a supply side fiscal reform document. Poverty on the other hand is a much wider phenomenon and covers every aspect of social and economic behavior. For its reduction a detailed livelihood diagnosis is required, which cannot be provided by household income data alone. The NWFP PRP-1, may be considered a good fiscal reform formula but lacked strategy for tackling poverty.
The NWFP PRSP was issued in April 2003. It was mostly a patch work of borrowings from the national PRPS and NWFP PRP-1. It accepted that its lead strategy will be the previous PRP-1. The NWFP PRSP had good poverty analysis from the distributional aspect but it was not strengthened by a poverty survey based on household income. However, it served the purpose of integrating the new MMA rightist government into the development mainstream and also helped obtain two World Banks structural adjustment credits of $170 million for NWFP. The study examines the new NWFP PRP-2, programme. It finds that like PRP-1, it too suffers from a lack of poverty diagnostic. Its absence draws away the anchor to which a PRSP strategy should be tied, the objectives of the key departments have not been clearly defined either, there is no participatory process backstopping the analytical framework. The PRP-2 does not have intermediate indicators for monitoring, it lacks alignment with NWFP MDGs, and it does not address implementation of expenditure budgeting.
The study advocates a detailed livelihood analysis to identify pockets of poverty. The study understands the ecological drive of humans forcing them to consume more resources. This force out the poor from the commons, when pitted against the strong in society. To balance this and organize the poor, it is necessary to create community organizations; it is the study‘s hope that with creation of such social capital the poor will be able to reduce transaction cost. The report finds that some important gains have been made under the poverty reduction strategy at the national level. The report in summing this section agrees that like the national PRSP, NWFP‘s performance could have been better, if there was more political will, better management, more funding, better disbursal of funds, enhanced professional capacity of departments and better monitoring and evaluation.
SECTION 5: POTENTIAL OF GROWTH SECTORS FOR POVERTY REDUCTION Section 5 deals with the potential of growth sectors for poverty reduction. The report finds that the failure of the NWFP PRSP and NWFP PRP-1 was not to take into account the poverty reduction aspect of tourism, housing, industries, private sector development and natural resources. The national PRSP-1 is a strategy document, which indicates an approach for poverty reduction. It is not an investment planning document like the annual development programme; however, it identified the potential within sectors, which can be prioritized for increasing incomes. The NWFP‘s PRSP did not discuss the poverty reduction

EXECUTIVE SUMMARY FINAL
K&P, Consultancy Services, Peshawar. iv
aspect of these sectors. The provincial government should undertake a poverty diagnostic for policy formulation as early as possible to cover future areas of policy reform. A comprehensive check list for such a diagnosis is given at Annex 13. The existing emphasis of national PRSP-2 and the NWFP PRP-1 is focused on consumption poverty, which is simplistic. However, the omission of not discussing the growth sectors is not so damaging, since the usefulness of these sectors has been analyzed by the World Bank. Descriptions and programmes are available in the World Bank‘s project loan documents for the two SAC loans and the NWFP Economic Report, 2005. In this connection the report recommends that the following may be initiated by the NWFP government;
Make income security the focus of poverty related interventions, so that the focus of reform shifts to policies, which are centered on employment generation, vocational training, skill development, micro credit and value chain analysis of productive sectors like tourism, industry, and construction. This will definitely reduce poverty in the long run.
The new focus will also demand development of SMEs based on agriculture, horticulture and livestock clusters; are areas in which NWFP has a comparative advantage.
Vocational training and skill development is an extremely important poverty reduction intervention, since more than 30% of households categorized as poor in NWFP, depends for their livelihood on remittances.
When the focus shifts to developing clusters in livestock, it will automatically lead to programmes to conserve sustainable range lands and forests. In this way, issues of natural resource management will be addressed.
Once poverty reduction begins to focus on livelihood security, then issues of environment and gender will also be favourably addressed; it has been found that because of linkage of women with livestock improvement leads to increased income for women.
Certain institutional changes, will lead to center staging livelihood security into government planning. Three areas for reform are - the creation of responsibility within a government department to deal with livelihood security as a normal role of that department, second is the transformation of the delivery mechanism of social services, which should be based on rural support NGOs and public- private partnerships. The third is to initiate movement on the stopped forestry sector reform, based on community involvement; this would lead to integration of the poor into the system instead of their exclusion, which results in increasing poverty, dis-empowerment, deprivation and destitution.
SECTION 6:LINK BETWEEN PRSP, MDGS & CDF Link between PRSP, MDGs and CDF. The study finds that for aligning the poverty reduction programmes as desired under the CDF and Paris Declaration, the MTDF performs the integration role. The national Mid Term Development Framework provides the long term perspective (2005-15), within which the MDG targets are to be achieved. The Mid Term Development Framework has incorporated these targets into its strategies and programmes in various sectors. The MDG targets are also the mid term development framework‘s targets. The PRSP targets, have similarly been incorporated into the mid term development framework and aligned with the MDGs. Therefore, the national Mid Term Development Framework is the structure, where the policies relating to poverty reduction are integrated. In this manner the PRSP and MDGs become part of a global development strategy, through the Mid Term Development Framework. The report also examines the ―NWFP Millennium Development Goals Report, 2005,‖ and presents the following conclusions regarding the provincial outcomes arising out of the implementation of the MDGs in NWFP;
Out of 26 indicators measured, NWFP was on track to achieve the targets in15,
There are 2 indicators, where the MDG targets can be achieved with more effort.

EXECUTIVE SUMMARY FINAL
K&P, Consultancy Services, Peshawar. v
There are 14 targets for different indicators, which are unlikely to be met.
The MDG data also indicates a strong gender vulnerability, adverse to the girl child and women. Unless this situation is changed drastically, the province will remain trapped in poverty and backwardness.
NWFP has to commit itself more to achieving progress on HIV / Aids and Malaria, their monitoring should be started by the Health Department; failure to do so will cause grave risk to public health in the future. Thirdly, the report finds that the provincial departments have data about regularization of katchi abadis, which is target 11 indicator 1; but has not been made available. It should be done as giving rights in katchi abadis will help in poverty reduction.
This study used the MDG data to create an Index of Human Development for the 24 districts of NWFP . The difference in district rankings between 2001 and 2005 is indicated in the chart at table 9 of the Annexures. The highlights of the District Human Development Index for the districts of NWFP, is as follows;
The top eight districts have retained their group position with very slight variation; Chitral has made major gains and has jumped from its 10 position in the (MICS) 2001, to 5
th
position in the MDG Survey 2005.
Battagram, has done very well to move from 21st position in 2001, to 11th in 2005.
Karak, has done poorly by moving down from 9th position in 2001, to l8th in 2005.
Buner, similarly has done poorly by moving from 13th position in 2001, to 22nd in 2005.
Charsadda, has performed well by moving from 17th position in 2001, to 10th in 2005.
In making the index, sectoral progress in key MDG sectors appeared responsible for lowering the HDI of some districts. The following highlights are important;
The highest primary education enrollment was in Abbotabad and Haripur and they have the highest GPI (Gender Parity Index) also — they are at the top of the table in both the surveys.
Another significant finding is the increase in GER (Gross Enrollment Ratio) at primary level in both Upper and Lower Dir districts since 2001. For Dir to progress faster, it is necessary that it should improve its GPI, which is very poor. The implementation of this one recommendation alone will substantially improve most of the remaining critical indicators relating to IMR, women mortality and poverty.
Mansehra, has lost its previous high ranking of 5th in 2001, to 12th in 2005. This is a result of its decline in immunization and lower LHW coverage. It also performed poorly in drinking water and sanitation sectors.
Kohat, has underperformed in 2005 by dropping from 4th position in 2001 to 13th position in 2005. This was due to worsening infant mortality, GER and drinking water and sanitation performance.
Swabi, improved its previous 2001 position from 12th, to 7th in 2005. This resulted due to
improvements in GER, adult literacy and drinking water and sanitation sector.
Tank, has improved from 20th positions in 2001, to 14th in 2005. This is due to better performance in GER, adult literacy, drinking water and sanitation sector.
Kohistan has not changed its position at the bottom of the table; it seems that a gigantic development effort is needed to improve its human development index position.
The Human Development Index data also leads to the postulation of the following poverty reduction hypothesis;
Those districts, which led in girls‘ primary education and achieved a high gender parity index, came in the top most group of districts in other indicators as well. The amazing co-relationship, which emerges from this pivotal finding is, that by concentrating on girls‘

EXECUTIVE SUMMARY FINAL
K&P, Consultancy Services, Peshawar. vi
education, districts mired in poverty and engulfed by backwardness, can emerge out of the constraining limits. This lesson is worth underlining, while making allocations or selecting priorities.
Districts performing well under sanitation had low incidence of infant mortality.
Advantage in having a higher ranking in forest did not necessarily translate into higher ranking in the district index.
The composite index confirms the positive relationship between a high literacy rate and low infant mortality.
Except for Karak district, higher proportion of LHW coverage led to lower IMR.
It is evident, that when one examines the investment in infrastructure like road and building sector, one finds that higher allocations are not necessarily translatable into better human development index for the districts.
shows that districts receiving large funds for roads and buildings, over the last 4 years, were not in the forefront of MDG Human Development Index of NWFP. It is therefore evident, that there is no short cut to investment in education, particularly girls‘ education for improving the index. It also sends a message to those who compete for large infrastructural projects, that the real welfare of the people lies in obtaining more funds for MDG sectors, particularly those relating to female related sectors.
SECTION 7: ANCHORING THE MDGS – USEFULNESS OF VISION 2030, MTDF & MTBF The study discusses the anchoring of the MDGs in strategic and planning documents through the Vision 2030, MTDF and MTBF. Without it MDG implementation will suffer. The study then discusses vision 2030 Approach Paper, which is being prepared at the national level. Vision 2030, desires that the country should emerge as, ―A developed, industrialized, just and prosperous Pakistan through rapid and sustainable development in a resource constrained economy by deploying knowledge inputs‖. It envisages that Pakistan will participate in globalization and adopt a knowledge based and technologically driven mode of production for production of high quality goods and services. On the fiscal side it hopes to raise the saving investment ratio leading to high growth in savings and productivity in a technological society based on compassion, equity and justice. The other results to be obtained from Vision 2030, are macro-economic stability, reduction in poverty and unemployment, food security, social and regional harmony and the well being of the people of Pakistan. This study then discusses two threats that faces NWFP in the future. One is water shortage and the other relates to fuel scarcity. Both are projected to create local conflicts and worsen poverty. NWFP is advised to lay its claim to its share of water received under the Indus Water Accord. The report also advocates early forest reforms by involving the communities; it also pleads for restarting the forestry reform process, which has been derailed. The study then examines the MTDF and presents the arguments against it. The study notes that the PRSP methodology has placed the finance rather the planning ministry Incharge of poverty reduction strategies. This has led to rivalry, which could harm the PRSP and is a threat. It has been said that the policy divergence between the MTDF and PRSP approach is in fact a reflection of the struggle for supremacy between the Planning Commission and the Ministry of Finance; Planning Commission‘s pivotal role in transforming the country through the five year plans is now being challenged by the Ministry of Finance, which leads the PRSP implementation and has thus entered the planning field. MTDF‘s bid to include the PRSP within it is seen as an attempt by the Planning Commission to obtain control over the
EXECUTIVE SUMMARY FINAL
K&P, Consultancy Services, Peshawar. vii
PRSP implementation. Internationally, there is re-thinking going on in the IFIs, who show greater willingness to include the state in economic planning now; in the recent past state planning was condemned for being inefficient and interference in the free market mechanism for allocation of resources.
The study enumerates the following weaknesses in the MTDF;
MTDF believes that poverty reduction is a natural consequence of growth, through the trickle down effect; such a strategy is against the spirit of an alternate strategy, which recommends specific distributive policies for targeting poverty directly, rather than through GDP growth alone. Support for this opinion is provided by an expenditure review for 2004, which blames inadequate spending and non targeted expenditures on pro-poor programmes, as the causes of indifferent MDG results. Secondly, the MTDF is based on vague assumptions of a speedy and successful devolution of powers and strengthening of governance, which would improve social service delivery. The MTDF also lacks a coherent policy how poverty reduction is to be approached at the local government level.
It is also vague in defining the policy for the very poor, who will be covered by Zakat, Bait ul Mal and food support programmes. Social security nets for the poor require deeper thinking and need a system which is able to deliver food and livelihood support directly to the targeted households.
The study disagrees with the view of the ―like minded group‖ of donors, who think that there is no need for an MTDF. There is a need for the MTDF, because the PRSP only focuses on that aspect of macro economic reform, which deals with poverty. The MTDF being the top planning document subsumes the PRSP policies and goes beyond to look at all the other infrastructure sectors and their problems to support the PRSP. It looks at the wider world. Thirdly, the MTDF is also a compliance requirement under the World Bank‘s Comprehensive Development Framework, and Paris Declaration. The study recommends that the proposed NWFP MTBF should be expanded to include and protect other important expenditures, which are excluded from the MTBF at present. NWFP also needs to articulate a provincial MTDF based on its requirements and which is a master document of its strategies; yes, the answer is to have an MTDF for NWFP.
The study integrates the conflicting aspects of the MTDF, MTBF and the NWFP process of PRP. It found that expenditures have been divided into two. The crucial expenditures, mostly dealing with the MDGs are covered under an MTBF. The remaining expenditures in other sectors are dealt in the normal un-structured manner; if there are funds available they will be released otherwise project implementation will be delayed. MTBF commitments have priority in expenditures. This issue will generate departmental tensions once the MTBF begins to be applied across the board. Presently, the NWFP processes have not completely entered the MTBF framework. This issue needs to be taken forward as it will improve performance and services. It is proposed that the NWFP MTDF should be built around the MTBF. It is proposed that the Finance Department NWFP must align the funding of
budgetary proposals on the principles given in the guideline of the MTBF, as early as possible. From information gathered, it is evident that there is still long way for NWFP to change the budget framework and shift the emphasis from allocation to meaningful expenditures. There is a need of reform in other areas as well, including the system of accounts. This study concludes that PIFRA has the flexibility to include performance budgeting within the new accounting model. What is missing is a provincial law, which ties each demand for grant of funds by the legislature with monitorable targets. If such a system is put into place, a provincial auditor general would certify whether or not the targets have been successfully met by departments against each grant; the minister and his department would be
EXECUTIVE SUMMARY FINAL
K&P, Consultancy Services, Peshawar. viii
accountable and answerable to the legislature for the use of funds allocated for the purpose for which the funds were granted. This will improve governance and the performance of departments in the delivery of services. It will also shift the focus of attention from allocation of funds to expenditure of funds; allocation by itself does not create change unless the expenditure is directed towards defined targets. Both poverty reduction and the reform process would greatly benefit from such a change. Capacity building in this area must start as early as possible
SECTION 8: MAJOR ISSUES IN POVERTY REDUCTION Section 8 of the study deals with the major issues in poverty reduction. The first one is the importance of defining sectoral objectives. There are weaknesses in NWFP programmes on thus score. For instance in PRP-2. little indication is available of the funds needed and the results which will be delivered. In the drinking water and sanitation sector the objective is to provide safe drinking water and sanitation based on better hygiene practices through low cost technologies, based on community participation. None of the processes involved in this have been articulated into a do able structure. The weakness in lose definition of objectives is two fold; the objectives become supply side driven; as if investments by themselves will remove the underlying weaknesses; the objectives are not informed by livelihood analysis; it is poverty reduction, which is the principle focus of intervention under the PRSP, PRP and MDGs. The approach thus has to be holistic. There are similar other weaknesses of analysis in other sectors discussed in NWFP PRP-2. It is evident that for the success of a future PRSP-2, it must re-define the sectoral objectives via livelihood analysis; it will help focus on development interventions leading to poverty reduction, which is goal, no 1, under the MDGs. The study finds that it is mainly due to asset deprivation, particularly land, which creates poverty. It is found that despite official pronouncements state land is not distributed. In NWFP due to poor growth and freezing of revenues from net profit have reduced NWFP‘s poverty reduction prospects. The study argues for the quickening of the process of developing land markets by concentrating on securing title to land. The issue of disputed land titles is very acute in Peshawar (NWFP), where the land record is full of ambiguity and under the control of multiple departments. It causes delays in confirming ownership and thus prevents the development of business. It also harms expansion of municipal service because of poor tax contribution. It also restricts the construction industry in housing and road development.
The study underlines the pivotal role of private sector in poverty reduction for the NWFP. The World Bank has projected that almost 17.4% of gross investment will be provided by the private sector by 2010, out of a total gross investment of 19.3%. The study also recommends the that private sector be inducted to provide social services in health and education through public-private partnerships as a means to achieve larger coverage.
The study also explores the relevance of the NRM and forestry sector for poverty reduction. It finds that poverty of the marginalized groups has become worse, because the rich have captured common resources, making the lives of the poor even more difficult, since the later are excluded from the use of such resources. This has increased the insecurity to livelihood of the poor on the one hand, and permitted the enrichment of the local elite, who have privatized the commons. Not only has the state to be restored, but a system of control of commons introduced based on community participation and separate programmes for upgrading of the commons through public sector investment. In this way not only will conflict
EXECUTIVE SUMMARY FINAL
K&P, Consultancy Services, Peshawar. ix
be reduced but incentives will be introduced leading to sustainable management of natural resources through user rights based on community participation. Rangelands do not have any regeneration policy framework and the demands of conservation as well as promotion of the livestock sector have not been aligned. A review of the situation is essential for poverty reduction. This should be done under the next NWFP PRSP The study finds that the best way to reduce conflict over forests as well as to protect them will require the introduction of new forestry laws based on community participation NWFP‘s natural resource management lacks clarity regarding functions and responsibility relating to forests. 19
th century polices are still practiced today. The approach of these polices is to
centralize management operation emphasizing timber harvesting as a source of provincial revenue and thus claiming higher rights for the state than the inhabitants, whose livelihood is considered secondary. This needs to be changed. A decade ago, it was decided to shift from regulating the forests as a resource generator for the provincial government. Instead, the model of joint forestry management with community participation was adopted as the model for the future. The reform process to transit to the new model has been stopped after the lead donor withdrew. Today, the Forestry sector is neither regulatory nor have the communities been integrated into forestry management. If the poverty indicators of forest communities are to be improved, then they must be integrated into its management. Owing to this hiatus, timber mafias have become active in feeling timber illegally. Joint forestry reform is a must for poverty reduction in NWFP.
The study finds a close nexus between environment and poverty. NWFP is the possessor of 17.3% of the national forests. Poor communities living around forests suffer as there is a clear link between environment and health. Poor women and children suffer most from pulmonary diseases due to household cooking chores dependent on wood-burning in open stoves within enclosed spaces. Their incomes do not permit them to use other fuels. Secondly, degraded water sources due to poor environmental practices pollute drinking water and cause health hazards for a majority of the population, who do not receive piped water; their fragile incomes are further reduced by very high health costs due to illness. Adverse environment leads to poor quality of life and early death. Bad environment practices also lead to environmental disasters like land slides and pollution of water sources.
The study finds that in any PRSP strategy, environment must be accorded high priority as it brings dividends in other areas, particularly health. The study proposes an environment audit to find how to link communities to natural resources like forests, water and grazing lands. This should be followed by rule change in law to induct communities for joint management and resource sharing. It is also recommended to develop environment related poverty indicators. There is a close connection between gender equality, economic development and poverty reduction. Female education is the foremost poverty reducing intervention. A compelling body of evidence has emerged in recent years demonstrating that investing in girl‘s education leads to fewer children, better nutrition and healthy families, lower child mortality, generates more income for the family and is far more likely to educate children then women with little schooling. Female education creates a ―virtuous circle‖ for the community and the country. Independent research in the developed world has brought out that the main reason for recent growth has been the greater contribution made to GDP, by women, rather than new technology or productivity enhancement. This has been corroborated by the new MDG data which has become available now. The quickest path out of poverty is to invest in the female

EXECUTIVE SUMMARY FINAL
K&P, Consultancy Services, Peshawar. x
The study examines the crucial role of local government in poverty reduction. It finds that poor capacity is harming the implementation of the MDGs and poverty reduction generally. It finds that although power has shifted on paper to the grass-roots, yet the capacity and financial capacity to mange programmes is absent.
The study highlights the weakness in the existing PRSP framework regarding consultation for formulation of PRSP. It found that there was no consultation for the preparation for the PRP-1 and 2 since they were in the nature of reform documents and not a PRSP. The NWFP PRSP had more consultations then the national PRSP-1. The study recommends that before the finalization of national PRSP-2 the matter may be discussed in the CCI failing which then in the NEC. Suffice set to say that the level of consultations with communities and others stakeholders can be improved.
Next Steps The study proceeds to lay down the next steps, which are needed to implement its recommendations which are listed at Annex 1 of the report in the form of a policy reform matrix. Amongst others, the study recommends the following steps; Approval of the study by NWFP cabinet, which would lead to the preparation of the following;
NWFP PRSP-2. The following results are also required to be produced for which the approval of the NWFP government will be needed;
Livelihood income & security survey for the province
Wide consultations with communities for preparation of PRSP
Preparation of provincial Vision 2030
Preparation of MTDF
6 departmental budgets to be prepared under the MTBF
Restarting forestry reform process
Initiating expenditure budgeting
Donor consultation for assisting in implementing the proposals emerging from this study.
The study concludes by indicating that implementation of its recommendations will have a far reaching beneficial result on poverty reduction in NWFP and align its policies and harmonize them with the Paris Declaration for Aid Effectiveness.

Section 1 INTRODUCTION FINAL
K&P, Consultancy Services, Peshawar. 1
1. INTRODUCTION
1.1. Background
The Government of NWFP with support of IUCNP commissioned this exercise vides TORs at Annex 2; subsequently the tasks were reduced, and items 2 and 7 of the TOR were not pursued.
1.2. Inception report
Based on discussion with stakeholders and preliminary perusal of the literature, an inception report was submitted on 2
nd of March 2006. The inception report is at Annex 3.
1.3. Scope of work and intermediate outputs
After meetings with stakeholders, it became clear, that there was a knowledge gap concerning the alignment, sequence and harmonization of various poverty related interventions taking place at the federal and provincial level. After discussions with the IUCN and P&D Department, it was considered essential to obtain conceptual clarity in the poverty framework under implementation in the province. This led to reformulation of the output and activities under this study. The following activities were undertaken;
An examination of the macro economic situation in Pakistan and NWFP in the context of poverty
Assessing the need for a poverty reduction strategy in the larger framework of international assistance for poverty reduction and the attached conditionalities.
An assessment of NWFP‘s NWFP Provincial Reform Programme-1 and its alignment with the Comprehensive Development Framework and MDGs
Review of MDGs in the framework of the over-all PRSP progress and the relationship between the MTDF and Comprehensive Development Framework is examined. An evaluation is made of NWFP‘s Provincial Reform Programme-1 and NWFP Provincial Reform Programme-2 and NWFP‘s Poverty Reduction Strategy Paper-1.
A comparison is also made of the national Poverty Reduction Strategy Paper with the NWFP Provincial Reform Programme-2 as well as with the targets of the MTDF, for purposes of discovering gaps
A review is carried out of sectoral omissions, where some sectors were not examined for their poverty reduction role
An analysis is made of overarching issues in poverty reduction, like environment, gender, NRM, local government and the consultative process
While discussing the above activities, a constant concern has been NWFP‘s inability so far to carry out a poverty assessment based on livelihood security analysis. This will provide the road to be followed in putting together a poverty reduction programme.
The study concludes that NWFP has good chances to alleviate poverty and make progress in reaching the MDG goals, if correct prioritization is made and more discipline ensured.
1.4. Final output The study provides guidelines for managing the poverty reduction strategy in NWFP by aligning its policies in the context of a refined Poverty Reduction Strategy which needs to be drawn up as early as possible.

Section 1 INTRODUCTION FINAL
K&P, Consultancy Services, Peshawar. 2
1.5. Research and interviews The assignment was carried out by reviewing literature, examination of official documents and interview with key government officials. A list of persons / organizations interviewed for the study is at Annex 4.
1.6. Meeting of the steering committee The concepts and recommendations in the draft report were discussed with members of the provincial steering committee on 26/06/2006. The steering committee is notified by the government of NWFP for the review and formulation of Poverty Reduction Strategy Paper by its notification of 15
th March 2006. Some of the recommendations of the participants have
been incorporated in the main body of this study.
Section 2 ECONOMIC PROFILES & MDG IMPLEMENTATION FINAL
K&P, Consultancy Services, Peshawar. 1
2. ECONOMIC PROFILES & MDG IMPLEMENTATION
2.1. Introduction
Pakistan endorsed the MDGs in 2000, which committed it to reduce extreme poverty, achieve universal primary education, promote gender equality, empower women, improve health indicators for child and women mortality and ensure environmental sustainability. Based on extensive deliberations, 18 targets and 48 indicators were agreed to monitor progress for each of the 8 goals. For an acceptable poverty reduction strategy, it is necessary to prepare national and provincial poverty reduction strategy papers. This is a prerequisite for obtaining credit on concessional terms from the World Bank (through the International Development Association – IDA) and the IMF (through the Poverty Reduction & Growth Facility – PRGF); it is in addition to the provision of debt relief under the enhanced HIPC Initiative and debt restructuring under the Paris Club. The PRSP has thus become both the instrument for the implementation of MDGs and a method for obtaining external assistance. Historical background explaining the development of the international approach to poverty reduction is discussed in section 2.
2.2. Pakistan’s Economic Profile
NWFP is closely integrated into the national economy. Economic changes in Pakistan have an impact on NWFP. If there is adverse situation on the economic front, poverty increases. In 2005-06, the Pakistan economy grew at a rate of 6.6% per annum (as compared with a 8.6% growth rate target), this is despite an increase in oil prices and devastation caused by the earthquake of 8 Oct, 2005. The following are the other main features of the performance in 2005-06;
Inflation declined from 9% in July 2005, to 6.2% in July 2006, with food inflation coming down from 9.7% to 3.6%.
There was a positive increase in the investment ratio and it reached 20% of GDP.
Oil prices increased to $ 70-75 per barrel severely affecting the trade balance and price level.
The key driver of growth has been the service sector, which grew at 8.8% per annum, and large scale manufacturing, which grew at 9% per annum.
Consumer spending increased and reduced savings.
The credit to private sector increased to over Rs. 11 billion in less then 3 years, which compares favorably with the cumulative borrowing in the previous 18 years (1984-2003) of Rs. 9.21 billion.
Worker remittances amounted to $ 4.5 billion, and remained one of the largest source of external finance for Pakistan
FDI exceeded $ 3 billion last year, which is the highest so far.
Real per capita income grew at a rate of 5.7% per annum.
Agriculture sector, which is the main stay of Pakistan‘s economy, contributed 22% of total GDP, and accounted for about 45% of total employment. However, as compared with the previous year‘s growth 6.7%, agriculture grew at only 2.5%. This had a negative impact on poverty since 66% of the country‘s population lives in rural areas. This is a set back reducing livelihood security of a large number of people.
The per capita income growth in $ term rose from $ 742 per capita per person last year to $ 847 per capita per person in 2005-06. However, there are problems with its distribution.

Section 2 ECONOMIC PROFILES & MDG IMPLEMENTATION FINAL
K&P, Consultancy Services, Peshawar. 2
Total investment in 2005-06 was 20% as compared with 18.1% in 2004-05. 16.4% of investment was generated by national savings and 3.7% by foreign savings. The external debt declined from 51.7% of GDP in 1999-2000, to 28.3% of GDP by end of March 2006; it is not indicated, what percentage of such reduction resulted from repayment of loans or re-profiling of debt under the Paris Club. It is concluded that except for re-payment of $ 1.1 billion debt, the rest has either been written off or restructured. Pakistan benefited from the lower borrowing costs due to reduced interest rates.
1
2.3. NWFP’s Economic Profile
Following are the main feature of NWFP‘s economy;
NWFP has a population of 21 million, which is 14% of Pakistan‘s population.
Agriculture accounts for 24% of NWFP‘s GDP, while industry accounts for 26% of the GDP. The services sector accounts for 54% of its GDP
NWFP‘s economy has been growing more slowly then the national economy during the last four years. In FY03, NWFP registered a growth rate of 4.7% against Pakistan‘s 5.5%.
Real provincial GDP grew on an average by 3.4% between FY99-FY03 versus about 4% for Pakistan. However, the NWFP GDP growth rate figures are open to challenge.
Poverty in NWFP is multi-dimensional, both in terms of income and consumption; 30% of household incomes are dependent upon remittances.
Table 1, Table 2 and
Figure 1 below give the poverty head counts as measured by the World Bank. It shows that in 2001-02, poverty in NWFP stood at 46.3% of the total population as compared
with 37.3% for Pakistan.2 The poverty trend has been on the ascendant since 1993-94
as depicted in figure 1 below. This is confirmed by NWFP
Table 1 : Poverty Headcounts3
With World Bank Poverty Line
Urban Rural Overall
1998-99 2001-02 1998-99 2001-02 1998-99 2001-02
NWFP 31.2 34.8 46.5 48.3 44.3 46.3
Pakistan 24.2 26.4 35.9 41.6 32.6 37.3
(with official poverty line)
NWFP 28.4 31.8 44.9 44.3 41.6 42.4
Table 2 Poverty gap and severity in NWFP4
Urban Rural Overall
Poverty Measure 98-99 01-02 98-99 01-02 98-99 01-02
Poverty Gap 6.6 6.5 10.5 9.0 9.9 8.6
Severity of Poverty 2.2 1.8 3.4 2.4 3.2 2.4

Section 2 ECONOMIC PROFILES & MDG IMPLEMENTATION FINAL
K&P, Consultancy Services, Peshawar. 3
Figure 1 Poverty Headcount 5
58% of the rural population has no land and represent 70% of the population in the
bottom / poorest quintile.
43% of all working adults are employed as agriculture / fishery workers
Wages in the province declined between 1998-99 and 2001-02. This shows low growth and declining welfare.
Remittances play a vital role in NWFP‘s economy and contribute 30% income of households. 8% of such total remittances come from the Gulf.
The labour force of NWFP is growing faster than Punjab, which is attributable to NWFP‘s lower participation in education at the middle and secondary level and a higher population growth rate.
The NWFP labour force grows at about 3.2% annually. This requires a GDP growth rate of 7% a year at least, to absorb the additional workers entering the labour force, it would require the creation of about 2, 20,000 jobs per year from 2005-2010.
6 Both the national
and NWFP economic profile show the need for poverty reduction and reducing the vulnerability of the poor households. To achieve it, a targeted poverty reduction strategy at the national and the provincial level is essential.
The lower than expected NFC award announced by the GOP coupled with the increase of salaries announced by government has reduced NWFP‘s growth prospects. The emerging resource gap can be met by economizing or by an increase in assistance.
2.4. Structure of NWFP’s Public Finance
According to revised budget accounts of NWFP for 2005-06, the province had revenue receipts of Rs. 65.46 billion and a current revenue expenditure of Rs. 60.69 billion. Development and capital receipts are in addition and amount to Rs. 12.1 billion. This includes current capital receipts of Rs. 8.6 billion generated through non food trading (Rs. 400 million), SAC-II (Rs. 2.98 billion), and DPC-I (Rs. 5.23 billion)
.7
During the same period, the development expenditure, including foreign assistance was Rs. 25.17 billion. Out of this, Rs. 20.9 billion came from the provinces own resources. This

Section 2 ECONOMIC PROFILES & MDG IMPLEMENTATION FINAL
K&P, Consultancy Services, Peshawar. 4
included bank borrowing of Rs. 5.2 billion. Public investment constitute about 4.1% of the provincial GDP. According to the World Bank, the real GDP of NWFP has to increase by 7-7.5% per annum over a five year period, if 1.2 million additional jobs are to be created between 2005-10. If this happens then unemployment is expected to fall from 13% of total labour force calculated for 2005, to about 9.6% in 2010. Such a projection is expected to substantially reduce poverty in NWFP.
8 The rate of growth is based on the assumption, that
the four provinces will obtain 47% of the total taxes (from the division of taxes between the federation and the provinces) under the NFC. However, according to the recent announcement of NFC Award under Order No 1 of 2006, the total share of NWFP has been fixed at 41.5% for the year 2006-07 and will increase to 45% in 2009-10;
9 thus the
presumption regarding the amount of resources available to NWFP does not hold. The expected growth and employment generation will thus not occur. Secondly, the baseline of the provincial GDP requires correction as it includes the earnings of WAPDA‘s installation located in NWFP;
10 This adds all the incomes earned from hydel generation from Tarbella
into the provincial GDP. It is also not clear how the mega Ghazi-Barotha Project figure is booked in the GDP calculations? It is surmised that if these substantial amounts on account of WAPDA activities are not booked to NWFP‘s account, then the province‘s GDP will be substantially less. It will reduce the per capita income calculation for NWFP, which is already 30% lesser than the national per capita income.
11 In this context it is recommended that
while ground work is done for the formulation of a NWFP PRSP-2, the provincial government may wish to review the growth strategy in view of the reduced NFC transfers and NWFP may take steps to correct the statistical base of provincial GDP calculations.

Section 3 INTERNATIONAL ASPECTS OF POVERTY REDUCTION STRATEGY FINAL
K&P, Consultancy Services, Peshawar. 5
3. INTERNATIONAL ASPECTS OF POVERTY REDUCTION STRATEGY
3.1. Historical Background
Pakistan‘s got involved with the poverty reduction strategy when she signed in 2000 the international agreement at the UN, regarding the MDGs. Poverty reduction has been a major objective of development cooperation between the IFIs and developing countries since 1960s. The aim of donor assistance is to raise income levels through economic growth, modernization and bring about better income distribution through the trickle-down effect. In the 1970‘s the paradigm shifted, and fulfillment of basic needs became the philosophy of development with emphasis on integrated rural development and redistribution with economic growth. In the 1980‘s the focus shifted again to achieve sustainable livelihood delivered through programmes based on participation, empowerment of communities and macro-economic stabilization; this was also the period, when the financial conditions of many developing countries deteriorated, and led to borrowing from the IMF for solving difficulties. By 1988, a deep financial crisis forced Pakistan to seek relief from the IMF under a structural adjustment programme. In 1988, before the start of the IMF driven prescription, the poverty head-count in Pakistan stood at 17.32% of the population. After undergoing re-structuring during the next ten years, the poverty head count increased to 32% of the population.
12 A fact admitted in the national
PRSP-1.13
It was evident that the developed world viewed the deteriorating conditions in the poor countries as their own fault; ―poverty is your fault. Be like us and you too can enjoy the riches of private sector led economics‖,
14 clearly was their mind set. No account was taken of
country specific problems or the impact of global factors. There is an obvious link between IMF driven economic prescriptions, based on structural adjustment, and increase of poverty in Pakistan. The IMF-World Bank driven structural adjustment formula was a unified diagnosis for all poor and distressed economies, irrespective of differences. It expounded that the reason for poverty in developing countries was due to; poor governance, excessive government intervention in markets, wastefully high government expenditure, and too much state ownership. Belt tightening, privatization, liberalization and good governance became standard prescription for every country, irrespective of differences.
15
It was seen that adjustment caused more problems than it solved. Poverty increased creating social dislocation. A new approach had to be found to tackle poverty, through long term sustained growth within liberalism. In 1989, John Williamson formulated the ―Washington Consensus‖, comprising 10 propositions. These were; fiscal discipline, a redirection of public expenditure priorities towards investments offering both high growth and the potential to improve income distribution, tax reform to lower marginal rates and a broad tax base, interest rate reduction, a competitive exchange rate, trade liberalization, international flow of foreign direct investment, privatization, deregulation to abolish barriers to entry and exit and secure property rights. This approach rejected the state‘s active role and believed that once the government got out of the way, market forces would allocate resources efficiently and generate vigorous growth leading to development. The focus of the new doctrine was Latin America, but its enthusiastic backers proclaimed it valid for all countries of the world, irrespective of differences in social, economic, political and historical circumstances. This philosophy came at a time, when the Soviet Union was collapsing and the United States, emerged as the only world power. However, events soon disappointed the United States, as country after country in Latin America rejected the Washington Consensus amidst wide spread protest against globalization. Since then

Section 3 INTERNATIONAL ASPECTS OF POVERTY REDUCTION STRATEGY FINAL
K&P, Consultancy Services, Peshawar. 6
several Latin America countries have turned left and others are waiting to follow suit. Unemployment has swelled enormously, with marked increase in destitution in Asian and other countries. It has led to an increase in criminal activities and terrorism especially amongst a growing army of frustrated youth. The lot of the common people has worsened as public services deteriorate in both quantum and quality. The World Bank has recently created a high level body - Commission on Growth and Development to revise John Williamson‘s prescription. Pakistan‘s macro-economic situation exhibits the same weaknesses seen in other countries implementing the Washington Consensus. It has been said that the IFI‘s have a higher preference for governability rather than poverty reduction; an impression that has gathered momentum. Trade liberalization has adversely endangered livelihoods of small producers and vulnerable social groups, especially woman, the poor and adversely affected the environment and natural resources. The northern dominated global institutions are viewed as consolidating a system of highly unequal relations between countries. Many feel that foreign assistance advances the commercial, political and diplomatic interest of the north which deepens poverty, increases vulnerability of the poor and produces a negative gender effect.
16 Independent confirmation for some of the above aspects is available in the Joint
Staff Assessment, which questioned the use of public funds in Pakistan for providing incentive for corporate farming, which would cause unemployment and cause competitive disadvantage to the local agricultural producers and would thus be socially unjustifiable. Such a measure was not pro-poor and would ultimately lead to dispossession of peasant farmers.
17
Since 1995, the World Bank is developing an alternate strategy against poverty, based on the Comprehensive Development Framework, anchored in poverty reduction achieved through the MDGs under a strategic policy reform framework, referred to as the Poverty Reduction Strategy. All countries desirous of obtaining cheap loans from the IDA and re-structuring of their debt are required to first develop an acceptable Poverty Reduction Strategy document. A Poverty Reduction Strategy is based on eight principles, which are listed at Annex 5. The cataclysmic events of 9/11 added urgency to efforts for tackling poverty, as one of the root cause of terrorism and state failure. ―To fight terrorism, we will need to fight poverty and deprivation as well. A purely military approach to terrorism is doomed to fail‖.
18 In other words Poverty Reduction Strategy can be defined as the economic
arm of the war against terrorism. Lest it be surmised that the focus on poverty reduction was totally IFI driven for a narrow agenda will be incorrect. Poverty is a blight and its elimination from society is a commendable policy under any yardstick of morality. The above diagnosis led to the formulation of a United Nations initiative, called the Millennium Development Goals. Pakistan along 189 other nations adopted the implementation of the goals by signing the Millennium Declaration in 2000. Foreign assistance for implementation of the declaration was coordinated during the Monterrey Conference, where the IFIs and the donor countries agreed in March 2002, to provide finances for filling the resource gap for implementation of the MDGs in poor countries. Subsequently, the donor community met in Paris in 2005 and laid down the principles for aid effectiveness, based on the earlier Rome Declaration of 2003, which had recommended the principles of ownership, alignment and harmonization of foreign assistance for the achievement of MDGs. This completed the gridlock needed to attain the MDG targets for the fulfillment of the Millennium Declaration of 2000. We will examine later, whether the various policies followed by NWFP and GOP are in line with the principles devised for fighting poverty. Not applying the defined principles would delay the implementation of the MDGs and Poverty Reduction Strategy; it will also cause difficulties later, if the recommendations

Section 3 INTERNATIONAL ASPECTS OF POVERTY REDUCTION STRATEGY FINAL
K&P, Consultancy Services, Peshawar. 7
stipulated for alignment and harmonization of foreign assistance are ignored; it will slow the fight against poverty, and reduce foreign assistance. The World Bank has become the coordinator for the implementation of the principles of the Paris Declaration. Countries implementing Poverty Reduction Strategies are to comply by 2010, with the indicators provided in the Paris Declaration. In this way a new set of positive conditionalities have been imposed. It is important for NWFP to take steps for achieving compliance; as they are based on a sound moral principle – poverty reduction.

Section 4 ANALYSIS OF POVERTY POLICY REFORM PROCESS FINAL
K&P, Consultancy Services, Peshawar. 8
4. ANALYSIS OF POVERTY POLICY REFORM PROCESS
NWFP not only has the highest ratio of persons living on or below the poverty line, but also has lower than national per capita income. Comparison of historical data of 1990-91 with 2005, show its declining position. NWFP has gone down in important social sectors. One of the main reasons for this decline is its deteriorating financial position, as compared with the past. It coincides with the reduction of net profits received from WAPDA, which have remained static since 1992. No compensation has been paid to the province for the reduced value of money due to inflation. It has led to a worsening of social indicators; NWFP was better placed in 1991 in social indicators, than in 2005. 4.1. Poverty Reduction Strategy in Pakistan & NWFP
In November 2000, as prescribed by the Comprehensive Development Framework, Pakistan articulated the Interim PRSP; it focused on diverse policy interventions proposed for engendering growth, improve human development and governance and reduced vulnerability of the poor to shock. As a result, of these policies, external assistance to Pakistan increased. It also received greater market access for its manufactures to the OECD countries. All the provinces of Pakistan developed poverty reduction papers in line with the federal government. The table below gives the dates for the launching of the PRSP and PRP papers in NWFP.
Table 3 : Chronology of Poverty Reduction Policies in Pakistan & NWFP
1. I-PRSP Pakistan (Nov 2000)
2. PRP-1 NWFP (Nov 2001-04)
3. PRSP NWFP (April 2003)
4. PRSP Pakistan (Dec 2003-06)
5. PRP-2 NWFP (May 2006-08)
One of the weaknesses of the interim Poverty Reduction Strategy was its narrow definition, based on consumption, and is the basis for calculating the poverty line. Poverty is multi-dimensional and a complex phenomenon. A more comprehensive definition is required. Unless, poverty is seen in its complexity, the remedies may be off the mark. The existing definition states: ―Those households (or individuals) are classified as poor, who do not have income sufficient to allow a consumption pattern consistent with minimum calories requirement. It is also assumed that households earning income equivalent to poverty line not only have sufficient food to meet the minimum nutrition requirements but also the non food requirement‖.
19
Such a definition ignores the multi dimensional aspects of household poverty; a more composite definition states: ―A livelihood comprises the capabilities, assets (including both material and social resources) and activities required for a means of living. A livelihood is sustainable, when it can cope with and recover from stresses and shocks and maintain or enhance its capabilities and assets both now and in the future, while not undermining the natural resource base‖.
20
The existing narrow definition establishes limited indicators and prevents the development of more comprehensive policy formulation against poverty. Annex 6 shows an outline essential for carrying out such an analysis. Government agencies avoid undertaking a wider definition of poverty, since the poverty figures will appear worse; it will also lead to greater

Section 4 ANALYSIS OF POVERTY POLICY REFORM PROCESS FINAL
K&P, Consultancy Services, Peshawar. 9
expenditures. It is argued that when NWFP revises its poverty strategy it should consider this advice and examine poverty from the livelihood security aspect. 4.2. NWFP Provincial Reform Programme-1
Pakistan developed its interim PRSP, in 2000. NWFP initiated its Provincial Reform Programme Nov 2001-2004 (PRP-1). It mirrored the national I-PRSP, at the provincial level. The NWFP, PRP-1 preparation benefited from consultation with World Bank. Its reforms were based on: fiscal and sector reforms, poverty reduction proposals, private sector development and devolution.
21 The diagram at Annex 7 indicates the inter linkage of the
eight categories of reforms.22
The NWFP, PRP-1 provided a matrix of objectives and activities needed to obtain the desired result. One of the main objectives of the PRP-1 was to for obtain external assistance for the NWFP from the World Bank. The province was successful in doing so.
The reform provided a medium term economic policy framework for broad based economic development in NWFP. It outlined measures, which would lessen fiscal constraints, focus the limited resources on public sector priorities to alleviate poverty and encourage private sector growth. It emphasized private-public partnership to shift activities to the private sector. It concentrated on reform in agriculture, irrigation, power, roads, education, health, forestry and poverty reduction. It recommended measures for private sector development, devolution and economic reforms. It recognized the need to protect the natural resource base of the province, particularly its depleted forest and range land resources. It stressed the need to reduce the comparative disadvantage of increased transportation cost for industrial goods. NWFP PRP-1 recognized the provinces advantage in irrigation, hydel generation, minerals, marble, tourism, agriculture, livestock, forestry, agro and mineral processing industries and export of trained manpower. It emphasized priority investment in these areas for employment and poverty reduction. It identified a set of medium term reforms to be completed in the period 2001-04.
23 NWFP PRP-1 also recommended the following additional
steps to be taken by the provincial government for poverty reduction;
Carrying out a bench mark district survey of poverty.
Aligning and harmonizing different donor programmes and avoidance of duplication and management fatigue.
Starting of public works programmes for the unemployed.
Increasing private sector investment to increase employment
Improvement of educational and health services for the poor. 24
Although, it is not the purpose here to evaluate the assumptions of the NWFP PRP-1, but suffice it to say that its projection that NWFP‘s receipts from profit on hydel generation will increase substantially, did not transpire, thus leading to pressure on the province‘s finances and non-fulfillment of policy reform targets. Secondly, the NWFP PRP-1 suffered from not having monitorable indicators, which could be monitored. Such an omission also made it difficult to judge progress; the NWFP PRP-1 was high on good intentions but lacked the logical framework analysis, which would have made it an effective model for policy reform for
the benefit of the poor.25
The NWFP PRP-1, spoke of poverty reduction, but did not give a specific strategy how this was to be achieved? It also did not list measures to achieve the MDGs, for which the NWFP PRP-1 was actually meant. On the other hand, the national I-PRSP, had shown the links and the institutional arrangements for poverty reduction but remained a supply side prescription, which believed that investments by themselves will reduce poverty; hardly any emphasis was laid on developing a policy reform framework for the social sectors, which is essential for poverty reduction.

Section 4 ANALYSIS OF POVERTY POLICY REFORM PROCESS FINAL
K&P, Consultancy Services, Peshawar. 10
Section V of NWFP PRP-1, dealt exclusively with poverty reduction by continuing with six major on-going programmes under implementation in the province. These were the World Bank‘s Poverty Reduction Fund Project, the Khushal Pakistan Project, the non budgetary
Zakat Programme, the establishment of SME Bank and the World Bank‘s Community Infrastructure Project.
In conclusion, it can be said that NWFP PRP-1 had its roots in structural adjustment and aimed to prevent a fiscal melt down more than implementing a poverty reduction strategy or achievement of the MDGs. It remains a supply side fiscal reform document. Poverty, on the other hand is a much wider phenomenon and covers every aspect of social and economic behaviour. For its treatment a detailed livelihood diagnosis is required, which cannot be provided by household income expenditures survey data alone. The NWFP PRP-1, may be considered a good fiscal reform formula but lacked monitorable indicators for tackling poverty. It also did not indicate the cost involved in implementation of its recommendations, nor a time frame for implementation.
4.3. The NWFP PRSP
In the last quarter of 2002, NWFP began developing a PRSP like the national document. It was issued in April 2003. It confessed to be a patch job and considered itself as an adjunct to the PRP-1, as the lead strategy. It borrowed heavily from the national PRSP. The following are the important features of NWFP‘s PRSP;
Governance reforms to achieve an efficient, accountable, and service oriented civil service
Reform to improve service delivery in key sectors especially basic health, education and social services
Fiscal and financial management reforms to improve governance in budget and financial management, adoption of a medium term budget framework, enhanced effectiveness and accountability of expenditures, and strengthened resource mobilization
Promoting sustainable growth
Addressing vulnerability to shock. NWFP‘s PRSP, 2003 performed two vital roles; it came at a time when a rightist religious alliance took power in NWFP; the paper presented a pro-poor approach, which committed the new cabinet to support the national poverty strategy and in that way integrated the new government into the main stream of international development strategy. Secondly, it obtained support for the reforms contained in PRP-1.
The outcome of the implementation of the NWFP PRP-1 has been a mixed one; many of the sectoral reforms are incomplete, due to a lack of capacity, weak governance and federal government‘s inability to provide growth to net hydel revenues as stated in the constitution. Annex 10 shows the NWFP resource position. Net profit from hydel generation, constitute 57.57% of the total receipts received from the federal government. According to the constitutional agreement between NWFP and federal government, net profits from hydel generation will increase with an increase in electricity prices by WAPDA. They have been pegged at Rs. 6 billion per annum, since 1992. It limits NWFP‘s ability to increase poverty expenditures; it also increases the investment gap, which is presently met through World Bank and other assistance, it eventually lowers progress. That is the principal reason for the worsening NWFP social indicators since 1992. The recent NWFP MDG Survey clearly shows this decline.

Section 4 ANALYSIS OF POVERTY POLICY REFORM PROCESS FINAL
K&P, Consultancy Services, Peshawar. 11
Foreign assistance has increased the province‘s revenues, yet it also has freed funds, which are spent less judiciously, in avoidable new job creation; an example of such expenditures is given at Annex 11. Although, NWFP‘s efforts at reform have been appreciated, yet it could do more in MDG implementation.
26 It is apparent, that the donors want to assist NWFP,
owing to its critical geo-political situation. This is a good opportunity for the province to transform the situation in its favor and help in improving the lives of its people. For poverty reduction it is important, that the cost and priorities are defined as precisely as possible, so that reform can stay on track. A weak link in NWFP PRP-1 was the lack of precision in the selection of reform targets. It also lacked intermediate indicators for obtaining desired results. A good example of having intermediate targets, is the design of the national PRSP-1, which defines medium and long term goals for poverty reduction outcomes. 4.4. Missing Links Between National & NWFP PRSP
The following are the gaps noticed in the two documents;
The NWFP PRSP-1 is more in the nature of an indicative document; it contains data regarding poverty in NWFP and description of the consultative process followed. In this respect it rates higher than the national PRSP-1. The provincial government thus relied more on building its strategy, on concerns expressed by the people.
27 The NWFP
document also rates higher in its analysis and the description of the spatial spread of poverty, within the different regions of the province; such an analysis is not available in the national PRSP-1.
However, there are gaps in the provincial PRSP also. Although, the document refers to the matrix of policy reform, yet these are based on the work of the World Bank done for the NWFP Structural Adjustment Credit – 1.
28 The proposals are thus borrowed to that
extent and do not emerge as conclusions derived from within an analytical framework. The second problem is that since the macro economic and fiscal issues have not been discussed in the context of NWFP‘s economy, therefore no policy recommendations are made. This limits the value of the recommendations and makes the NWFP paper a compendium of items, some borrowed from SAC and others from NWFP PRP-1.
It also fails to provide reasons for the causes of poverty; such an analysis ought to begin with a description of household income, which can be divided into consumption and saving. The saving go either into future investment or used for tax payments. The later constitute in simple term, public investment. Household savings and the public investment become aggregate national savings, which is used to create capital for economic growth.
Households become entrapped in poverty, when their incomes decline and they cannot make savings for future investments. In such a situation, the size of the public budget declines because of negative savings at the household level with consequential decline in investment in capital per person. This cycle of poverty impoverishes not only the households, but also the state and is described as the poverty trap; emergence of a robust private sector is the principle method for moving out of the poverty trap.
The NWFP PRSP ignores the role of the private sector, non farm employment in the rural area and lacks a strategy for using micro credit for poverty reduction. Thus, it does not have a creditable employment strategy, which is a primary tool for poverty reduction.
The growth strategy of national PRSP-1 and NWFP PRSP, is based on the hope that GDP growth will automatically lead to poverty reduction, by generating employment and a multiplier effect. Unfortunately, because of constraints, the trickle down does not reach the poor and results in accumulation of incomes in the top quintile. This apparently will make it difficult to halve poverty by 2015. It is essential to rely on processes, which address poverty directly and leads to targeted interventions.

Section 4 ANALYSIS OF POVERTY POLICY REFORM PROCESS FINAL
K&P, Consultancy Services, Peshawar. 12
4.5. Comparison of the national and the provincial PRSP To ensure that the next version of the NWFP PRSP does not suffer from shortfalls, we now identify the areas that have been missed in the national PRSP and the first version of the NWFP PRSP. The national PRSP lists reforms in macro economic policy; this is an area of activity reserved for the federal government. National economic and monetary policy is its domain. In it we thus find reforms in the fiscal and monetary policy areas; there are also proposals for financial and capital market reforms, other reforms cover trade policy, market liberalization, privatization, deregulation and strengthening small and medium enterprises. The national PRSP also makes proposals for human resource development. This in turn is linked to improvements in the social sectors like education, literacy, gender parity, health, drinking water, sanitation and other indicators connected to human development as indicated in the MDGs. In this manner the national PRSP transforms macro economic reform by linking it to human development. The national PRSP by doing so enters the area of MDGs implementation. While creating this linkage between the macro economic framework at the top and human development at the bottom, the PRSP also links with governance by advocating support for devolution. The national PRSP takes account of overarching issues like the environment-poverty nexus, gender equality and the adverse impact on poverty, if natural resource management considerations are ignored. Furthermore, the national PRSP provides monitorable indicators, that are to be used for measuring performance during implementation. The following are some major weaknesses of the national PRSP. It has not adequately discussed the poverty issues with the stakeholders; there are two types of such stakeholders; the various categories of the poor and broad based consultations with the provincial governments. There was consultation with provincial government civil servants in the PRSP steering committee but it cannot be called a proper consultation; a more vigorous option, with far reaching positive consequences, was to take into confidence the provincial parliaments. It was noted, that interaction with local NGOs was minimal; many were not consulted. The PRSP was not discussed at the highest economic consultative forum of the National Economic Council. In many ways, the policy reforms emerging out of the national PRSP, were the result of initiatives taken on the behest of donors or a few insightful department heads; there is no implementation framework parallel to what can be called a PRSP project. In situations like this, where a lead implementation strategy is not available, progress is slow and wasteful. On the other hand, the Provincial PRSP was based on more meaningful consultation process with NWFP communities. These helped to build a picture of provincial poverty in its regional context. People from different parts of the province gave their own list of priorities, which varied from place to place. Secondly, the provincial PRSP contained more data regarding the various manifestation of poverty like rural-urban, regional and sectoral. However, it did not have policy transformation analysis like the national PRSP; one reason was that macro economic and fiscal policy is a federal subject; naturally the NWFP did not have much to say on these issues. As stated, there was a lack of in-depth discussion with provinces in the formulation of the national PRSP. Therefore the provinces did not really contribute much to the policies in the macro economic or fiscal policy discussion at the national level. The provincial PRSP did a comparatively better job by mapping the existence of poverty geographically; something not attempted in the national PRSP. However, other programme and sector analysis remained weak. In some ways the provincial PRSP was patchwork. It looks that after presenting an analysis from the PPA the provincial PRSP borrowed the policy recommendations contained in the PRP-1 and some contained in SAC, previously prepared
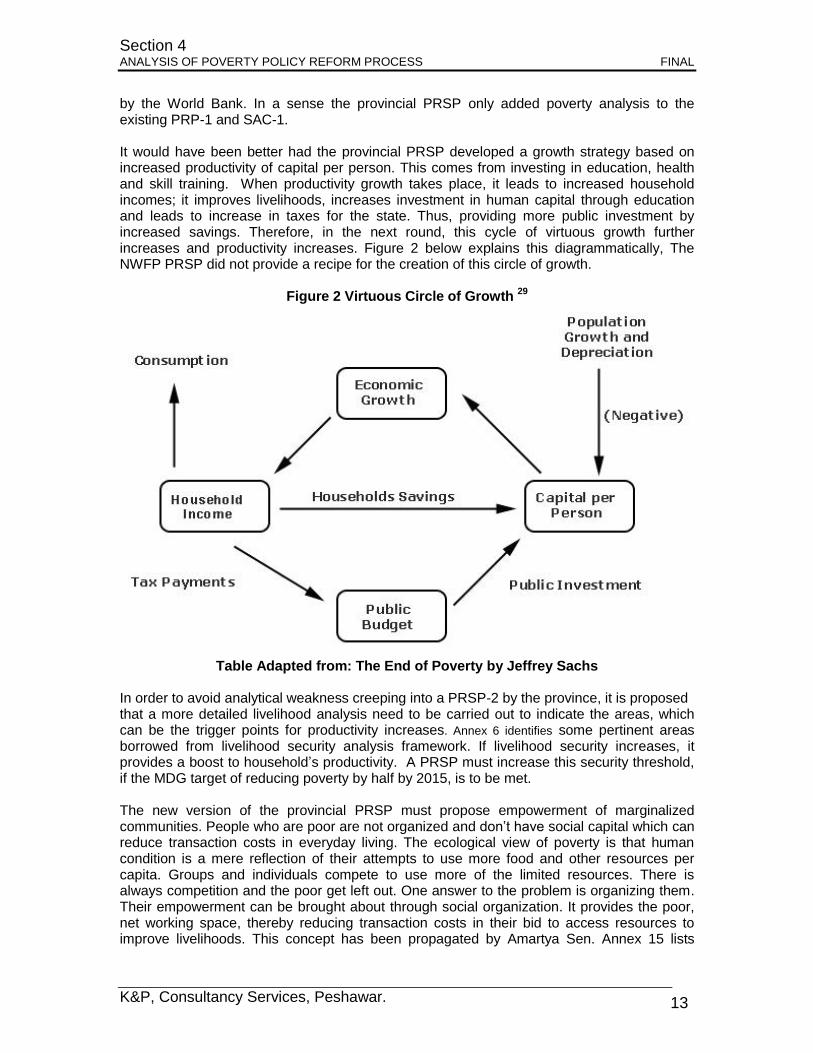
Section 4 ANALYSIS OF POVERTY POLICY REFORM PROCESS FINAL
K&P, Consultancy Services, Peshawar. 13
by the World Bank. In a sense the provincial PRSP only added poverty analysis to the existing PRP-1 and SAC-1. It would have been better had the provincial PRSP developed a growth strategy based on increased productivity of capital per person. This comes from investing in education, health and skill training. When productivity growth takes place, it leads to increased household incomes; it improves livelihoods, increases investment in human capital through education and leads to increase in taxes for the state. Thus, providing more public investment by increased savings. Therefore, in the next round, this cycle of virtuous growth further increases and productivity increases. Figure 2 below explains this diagrammatically, The NWFP PRSP did not provide a recipe for the creation of this circle of growth.
Figure 2 Virtuous Circle of Growth 29
Table Adapted from: The End of Poverty by Jeffrey Sachs
In order to avoid analytical weakness creeping into a PRSP-2 by the province, it is proposed that a more detailed livelihood analysis need to be carried out to indicate the areas, which can be the trigger points for productivity increases. Annex 6 identifies some pertinent areas borrowed from livelihood security analysis framework. If livelihood security increases, it provides a boost to household‘s productivity. A PRSP must increase this security threshold, if the MDG target of reducing poverty by half by 2015, is to be met. The new version of the provincial PRSP must propose empowerment of marginalized communities. People who are poor are not organized and don‘t have social capital which can reduce transaction costs in everyday living. The ecological view of poverty is that human condition is a mere reflection of their attempts to use more food and other resources per capita. Groups and individuals compete to use more of the limited resources. There is always competition and the poor get left out. One answer to the problem is organizing them. Their empowerment can be brought about through social organization. It provides the poor, net working space, thereby reducing transaction costs in their bid to access resources to improve livelihoods. This concept has been propagated by Amartya Sen. Annex 15 lists

Section 4 ANALYSIS OF POVERTY POLICY REFORM PROCESS FINAL
K&P, Consultancy Services, Peshawar. 14
some important inequality sensitive factors. It includes institutions, concepts and means, which act as barriers to participation by different regions/groups/persons and are in effect meant to prevent access to productive resources and thus reduce consumption and welfare. If access to resources is reduced, productivity is lowered. Democracy and membership of social organization thus improve productivity across income levels and are a poverty reducing phenomenon, the national PRSP completely ignores this analysis and it is proposed, that if there is a new version of a provincial PRSP, which is recommended by this report then it must support measures to increase social capital. Some of remaining weaknesses of the provincial PRS-1 are the following; Both the PRP-1 and the PRSP do not show how to reach the MDG targets, nor is there an indication of investment needed either in the development or current budget. This is a big weakness. The issue of creating social nets and differentiation of poverty into what Geof Wood terms idiosyncratic and non-idiosyncratic poverty has also been ignored in the NWFP poverty reduction policy. The former is caused by structural reasons such as weak class position, lack of education and skills or calamity like earthquake or drought. The latter, is induced by specific circumstances. For instance orphan hood, infirmity, disability, lack of male support in household, illness, and personal disaster.
30 It is the later category, which needs safety net
support for long term; the non-idiosyncratic poverty need safety nets for survival.
4.6. Main Features of the Provincial Reform Programme - 2
In order to deepen reform and combat poverty, the province issued the PRP-2 in May 2006. It continues many of the earlier programmes and adds new initiatives, especially those relating to private sector and human development. It is based on the following four pillars;
For reduction of poverty and raising standard of living it supports acceleration of human development by investment in education and health
It aims to improve livelihoods, by raising incomes based on sustainable economic activity, though an invigorated private sector.
It aims to address disparities in development, which may be gender related, rural – urban or regional. It intends to develop social safety nets for the deprived.
It suggests that pubic expenditure effectiveness should be increased to improve delivery through better governance and accountability. The following are the important objectives in the leading social sectors.
Education The objectives here are;
Improve access, enrollment and quality
Reduce gender and rural – urban disparities
Expand capacity at the secondary school level
These objectives can be improved by placing more emphasis on achievement of MDG targets, introduction of vocational and skill development at the middle school level and improvement of regulation in government, so that a greater percentage of education and health sector delivery could be provided by private service providers under public-private partnership regulated by government under defined service performance yardsticks. NWFP PRP-2 can also benefit by developing a periodic report card system for evaluation of services by users.

Section 4 ANALYSIS OF POVERTY POLICY REFORM PROCESS FINAL
K&P, Consultancy Services, Peshawar. 15
Health The main health reforms will be based on; Management and organizational reform Programme reforms Increasing financial allocations For the health sector the following suggestions are made. Targets for achievement of MDGs need to be center staged. More of health related MDG indicators need to be included for implementation. More emphasis is required on maternity care programmes, provision of laboratory services in rural areas and reduction of personal expenditure of the poor by improving rural health delivery services and quality of drinking water. NWFP PRP-2 focus on tertiary care will drain away resources from the rural areas and affect the poor adversely. The NWFP Health Foundation needs to be transformed into a facilitator of health services in rural areas, where private sector is shy. Capacity needs to be built in Health Department
and the Health Foundation for creative use of funds. The establishment of a report card system proposed for the education sector, is also proposed for the health and drinking water sector in the first phase. Water supply and sanitation
NWFP Provincial Reform Programme-2 aims to increase the supply of safe drinking water from 66% to 72% of population
Access to sanitation would be available to 75% of the population as compared with 69% at present.
Sewerage coverage will be provided to 16.5 million persons in 2008 as compared with 14 million today
The following comments are made regarding the NWFP PRP-2 recommendations;
A livelihood expenditure study carried out in NWFP, found that from 18-25% of a poor household‘s income (living on or near the poverty line), is spent on health matters. Most of the disease is water borne and related to poor quality drinking water or lack of hygiene and sanitation.
31 The allocations to drinking water sector must be increased because of
the beneficial base effect on health sector.
Unfortunately, the capacity of Public Health and Engineering Department has been seriously eroded as a result of a policy decision to reduce the size of government. This decision has increased disease and immiserization of the poor. The brunt of the problem arising out of this decision, in the shape of disease and disabling the poor from earning is enormous. The abolished water testing laboratories must be reestablished and security of clean drinking water must be ensured for every citizen as a basic human right. The returns from this measure alone will be high.
The NWFP PRP-2 agenda of reforms and measures at present is not based on any selection criteria and apparently is an ideas and issues paper. If all the proposals given in the document are of equal importance, it would require a massive increase in resources for implementation. At best the NWFP PRP-2 is an indicative document, which should be used by the departments for guiding them in the selection of projects.
4.7. Threats to Poverty Reduction Strategy in NWFP
The following are other major challenges facing poverty reduction in NWFP;
Although allocations are made for expenditure in poverty reduction sectors, yet the absorption of funds is low; the result is that the level of service to the poor in education, health and drinking water sector are reduced. According to one report, even after the expiry of 8 months of the last financial year, only 9 districts out of 24 had approved their development plans. This is a clear example of the failure to spend allocated budgets.
32

Section 4 ANALYSIS OF POVERTY POLICY REFORM PROCESS FINAL
K&P, Consultancy Services, Peshawar. 16
As shown in Annex 14 a sum of Rs. 1.97 billion of mostly pro-poor allocations was unspent balance in 2005-06. If expenditures are not made, how will poverty be reduced? It defeats the objective of the poverty reduction strategy. The proposed budget reform should induce a shift away from allocative to an expenditure budget with supporting legislation.
There is a contradiction between macro economic objectives and poverty reduction goals. For example, the poor are taxed to support enlarging benefits accruing to the higher income groups. For instance during the FY 2004-05, indirect taxes realized Rs. 35 billion from increase in price of petroleum products, which made the poor more vulnerable. It cannot be good for poverty reduction.
The federal poverty reduction strategy should incorporate the four provincial poverty reduction strategies. It is suggested, that the formulation of NWFP PRSP-2 should precede the federal PRSP, rather than come after it. It is recommended that the national PRSP-2 should be discussed in the Council of Common Interest to obtain the highest level stakeholder commitment.
Poverty Reduction Strategy is also politics and the political executive has to balance the pressure of constituency building with the demands of poverty reduction. The provincial budget contains soft allocations, which do not assist poverty reduction. Owing to it, the provincial finances have come under strong pressure, which could destabilize the reform process as exampled by a small study carried out for this report; please see Annex 11.
In NWFP, the poverty diagnostic is partial and sectors like building, housing, tourism, NRM, environment and gender, have been ignored. These should be covered in the proposed new NWFP PRSP-2.
Implementing a PRSP also requires a high degree of knowledge and skill in government. There is a need for capacity building in NWFP for the successful implementation of the poverty reduction strategy.
Absence of performance budgeting makes it difficult to monitor, evaluate or speed up the implementation of poverty reduction strategy. It should be introduced.
The absence of annual work and financial plans delays the poverty reduction strategy and leads to poor financial utilization.
In conclusion it is evident that the PRP 1 & 2 suffers from the following weaknesses, which should be avoided in any future poverty reduction work.
The NWFP Provincial Reform Programme-1 and 2 latter lack poverty diagnostic. Its absence draws away the anchor to which a PRSP strategy should be tied.
The objectives of the key department have not been clearly defined.
There is no participatory process backstopping the analytical framework.
Both the documents, do not provide intermediate indicators for monitoring
Both the reform papers lack alignment with MDGs.
Both the papers do not address implementation of expenditure budgeting as an important reform principle.
4.8. Achievements under national Poverty Reduction Strategy
It is not to suggest that no positive outcomes occurred from implementation of the PRSP. The following positive indicators show, that some progress has been achieved in the fight against poverty;
The evidence provided by the labor force survey for Pakistan for the first half of 2005-06, shows that 5.82 million new jobs were created since 2003-04, with an average job creation of 1.0 – 1.2 million per annum. Consequently, unemployment rate, which stood at 8.3% in 2001-02 declined to 6.5% by December, 2005.
Section 4 ANALYSIS OF POVERTY POLICY REFORM PROCESS FINAL
K&P, Consultancy Services, Peshawar. 17
Total remittances from 2001-02 to 2005-06 totaled over $ 19 billion or Rs. 1129 billion. The inflows, particularly to the rural and semi urban areas of Pakistan are projected to have improved the livelihoods of the population, especially the poor thus leading to a reduction in poverty. The increase in remittances was mainly due to external factors and not by policies of the PRSP.
Over the last five years, the federal government claims to have spent Rs. 1332 billion, on poverty related social sector programmes to cater for the needs of the poor and vulnerable and in meeting the MDG targets. This has helped reduce poverty.
It is reported that the head count poverty ratio has fallen from 34.46% in 2001 to 23.9% in 2004-05, a decline of 10.6%. Accordingly, in absolute terms, the number of poor has fallen from 49.23 million in 2001 to 36.45 million in 2004-05.
33 However, there is debate
about the accuracy of these figures, but poverty has reduced a result of economic growth.
The national PRSP targeted expenditure for the needs of the poor and vulnerable sections of society; was Rs. 316.2 billion in 2004-05, which increased to Rs. 378.8 billion in 2005-06. The largest percentage of expenditure has been on roads and highways.
The Fiscal Responsibility and Debt Limitation Act (2005), enjoins that poverty related expenditures will not be less than 4.5% of the GDP, and budgetary allocation for health and education will be doubled in the next 10 years. To reduce poverty it will be meaningful to increase this ratio to 7% of GDP by 2006-07.
34 The presence of this law is
positive commitment for poverty reduction. It has been argued, that the classification of certain budgetary expenditure as pro-poor is
misleading. All expenditures have some impact on poverty, but booking most of the expenditures in the road and building sector under poverty, distorts the picture. This is an argument for having a more elaborate definition of poverty. Despite the reservations it is evident that the national poverty strategy has made a dent into poverty.
4.9. View of Donors on Pakistan’s Poverty Reduction Strategy
The donors are of the view that;
Progress has been made generally and in key reform components relating to the role of private sector, macro economic stabilization, trade, financial sector and corporate governance, and re-orientation of expenditures toward education, health and other priorities areas.
MTBF has also taken root by monitoring expenditure on key poverty and human development indicators. However, more needs to be done in targeting the poor and civil society at the grass root level.
Areas for further improvement are; implementation of devolution, capacity building of district government, rural strategy to improve agriculture productivity, expansion of non form rural employment and reducing rural poverty, improvement in CWIQ survey and monitoring.
The weakness in the statistical base concerning the poverty line is also noted.
The targets given in the PRSP-1 for implementation of the MDGs are too ambitious, especially those relating to enrolment, infant and child mortality.
It has been argued that data on poverty in skewed.
Although experts have preferred the reliability of the PIHS surveys over other information, yet there are anomalies even in the PIHS; for instance the average income

Section 4 ANALYSIS OF POVERTY POLICY REFORM PROCESS FINAL
K&P, Consultancy Services, Peshawar. 18
per person in NWFP is higher than that of Pakistan.35
In this context it has been said that the poverty figures are political in nature.
36 There is a dire need to improve statistics,
and to place them above compulsion of politics.
A similar informed comment has been made about the questionable figures issued by government about literacy statistics, which are thought to be doubtful.
37
UNESCO, recently found that the following factors were responsible for Pakistan‘s weak response in facing to the challenges of literacy. The following reasons are also relevant to explain the less than optimal performance in achieving good results in poverty reduction in the NWFP. These are a) insufficient political will b) weak organizational structure. c) inadequate financing and delay in disbursement. d) low-level of capacity. e) low awareness of the importance of literacy f) lack of monitoring and evaluation system and g) uniform national policies. The weaknesses delay poverty reduction. These comments must be noted to avoid slippages in following the poverty reduction strategy.
Section 5 POTENTIAL OF GROWTH SECTORS FOR POVERTY REDUCTION FINAL
K&P, Consultancy Services, Peshawar. 19
5. POTENTIAL OF GROWTH SECTORS FOR POVERTY REDUCTION
One of the criticisms against the NWFP PRSP and NWFP PRP-1 is the failure to take into account the poverty reduction aspect of tourism, housing, industries, private sector development and natural resources. The national PRSP-1 is a strategy document, which indicates an approach for poverty reduction. It is not an investment planning document like the annual development programme; however, it identified the potential within sectors, which can be prioritized for increasing incomes. The NWFP‘s PRSP discussed these matters but did not give sectoral linkages for increasing incomes. On the other hand, the NWFP PRP-1 did not discuss the framework for generating economic growth through the private sector.
38
This is a big omission. Furthermore, there is no analysis of each sector indicated above. Subsequently, the NWFP PRP-2, which was approved recently, focused on the private sector for reducing poverty and generating employment and benefits from tourism and
construction industry. These issues and sectors are discussed in PRP-2.39
It may be noted that the poverty reduction strategy is not limited to the policy papers only, the recommendations for poverty reduction in NWFP are also contained in the World Bank ‗s SAC-1, SAC-2 and the DPC. Thoughtful sectoral analysis is also available in the World Bank Economic Report,
40 and the First NWFP Development Policy Credit, which is based on the
Economic Report. Therefore, a detailed analysis of the sectors mentioned above and how to achieve development therein is indicated in the Economic Report as well as in the Development Policy Credit.
41 The policy reform matrix of Development Policy Credit misses
out on interventions for improving natural resource management or the environment; this is a shortcoming caused by the method of analysis followed, which is configured largely on the structural reform model; it is not guided by livelihood income security analysis. In order to address these omissions the following recommendations are made;
The provincial government should undertake a poverty diagnostic for policy formulation. A comprehensive check list for such a diagnosis is given at Annex 13. The existing emphasis of national PRSP-2 and the NWFP PRP-1 is focused on consumption poverty, which is simplistic. Some of the best approaches to poverty diagnosis are provided by DFID and Care‘s Household Livelihood Security Assessment. There are other models too.
If income security for livelihood becomes the focus of poverty related interventions, then the focus of reforms would begin to shift to policies, which are centered on employment generation, vocational training, skill development, micro credit and value chain analysis of productive sectors like tourism, industry, and construction. This will definitely reduce poverty in the long run.
The new focus will also demand development of SMEs based on agriculture, horticulture and livestock clusters; areas in which NWFP has a comparative advantage.
Vocational training and skill development, is an extremely important poverty reduction intervention, since more than 30% of households categorized as poor in NWFP, depend for their livelihood on remittances.
The focus should shift to developing clusters in the livestock sector, with the help of micro and SME credit. It will automatically lead to programmes to conserve sustainable range lands and forests. In this way, issues of natural resource management will be addressed.
Once poverty reduction begins to focus on livelihood security, then issues of environment and gender will also be favourably addressed; it has been found that because of linkage of women with livestock improvement leads to increased income for women.

Section 5 POTENTIAL OF GROWTH SECTORS FOR POVERTY REDUCTION FINAL
K&P, Consultancy Services, Peshawar. 20
Certain institutional changes, will lead to center staging livelihood security into government planning. Three areas for reform are the creation of responsibility within a government department to deal with livelihood security as a normal role of the department and the second is the transformation of the delivery mechanism, which should increasingly be based on rural support NGOs and public- private partnerships.
The third is to initiate movement on the stopped forestry sector reform based on community involvement; this would lead to integration of the poor into the system instead of their exclusion, and which results in increasing poverty, dis-empowerment, deprivation and destitution
.

Section 6 LINK BETWEEN PRSP, MDGS & CDF FINAL
K&P, Consultancy Services, Peshawar. 21
6. LINK BETWEEN PRSP, MDGS & CDF 6.1. Alignment of Poverty Reduction Strategy Paper with MDGs
As required by the Paris Declaration, the national Mid Term Development Framework 2005-10, aims to align the MDGs into its programme for creating a just and sustainable economic system. The national Mid Term Development Framework provides the long term perspective (2005-15), within which the MDG targets are to be achieved. The Mid Term Development Framework, has incorporated these targets into its strategies and programmes in various sectors. The MDG targets are also the mid term development framework‘s targets. The PRSP targets, have similarly been incorporated into the mid term development framework and aligned with the MDGs. Therefore, the national Mid Term Development Framework, is the structure where the principle policies relating to poverty reduction are integrated. In this manner the PRSP and MDGs become part of a global development strategy, through the Mid Term Development Framework. We will now examine NWFP‘s progress in the achievement of MDG targets.
6.2. Achievement of Provincial MDG Targets in NWFP
The Bureau of Statistics in its ―NWFP Millennium Development Goals Report 2005,‖
42 has
provided a comprehensive report on the progress achieved under the various targets of the MDGs. The report collected data for 26 indicators and 9 targets; the main findings of the report are discussed. This discussion is vital for indicating the areas that need to be addressed by NWFP, when preparing its Vision 2030, provincial mid term development framework and a fully featured PRSP-2 latter. In the interim period, this analysis indicates the areas where the relevant departments have to make more effort both in capacity building and the delivery of programmes. Target 1: Halve, between 1990 and 2015, the proportion of people below the poverty line (%) MDG target 1, aims to halve between 1990-2015, the proportion of people living below the poverty line. The study found the NWFP poverty headcount to be 42.05% of the population in 2005. The national PRSP target for the same period, was 28%. By 2015, the MDG target indicates that only 13% of the population will be on or below the poverty line. According to present trends this target will be difficult to meet by NWFP. More GDP growth must be ushered into the province.
Target 2: Halve, between 19901 and 2015, the proportion of people who suffer from hunger (%)
MDG target 2, is to halve between 1990-2015, the proportion of people who suffer from hunger. The target has two indictors; according to indicator 1, the percentage of underweight children under the age of 5 years must be brought down from 40% in 1990-91 to less than 20% in 2015. The study indicates that NWFP has reduced it to 38% in 2005; the national PRSP target for the same period is 28%. NWFP has to make more efforts if the target is to be achieved. The present trend calls for greater vigour. For indicator 2 of this target no data is available.
Target 3: Ensure that by 2015, children everywhere, boys and girls alike, will be able to complete a full course of primary schooling
MDG target 3, indicator 1, requires that by 2015 every child between 5-9 years of age shall complete primary education from class 1 to class 5. NWFP has achieved 47% enrollment of

Section 6 LINK BETWEEN PRSP, MDGS & CDF FINAL
K&P, Consultancy Services, Peshawar. 22
the primary group by 2005. The national PRSP-1 target for the same period is 58%. To achieve the MDG target more investment and policy reform are needed. The present trend is negative. MDG target 3, indicator 2, states that 100% of students will complete their primary education from grade 1 to grade 5. NWFP has performed well by achieving a 76% success rate in 2005 against a PRSP-1 target of 79% in the same period. More effort will help in reaching that target for this indicator. However, this must not be confused with the fact that all the eligible primary school candidates do not attend school, because of lower gross education rates. According to MDG target 3, indicator 3, the literacy rate should be 80% by 2015. By 2005 NWFP has achieved 53% against the national PRSP-1 target of 45%. This goal will not be achieved because of low GER. More investment is required with further policy changes.
Target 4: Eliminate Gender Disparity in Primary and Secondary Education by 2005 and to all levels of Education no later than 2015
MDG target 4, lays down the elimination of gender disparity in primary and secondary education by 2005 and to all levels of education not later by 2015. This target has 4 indicators. Under indicator 1, the target is to achieve parity between the girl and boy enrollment at primary level by 2015. NWFP has achieved a ratio of 0.55. In a period of 9 years it is possible for NWFP to achieve this target. MDG target 4, indicator 1 states that at the secondary level the gender parity ratio should be 0.94 by 2015. NWFP has reached a parity ratio of 0.43 at the secondary level against the national PRSP-1 target of 0.73. It appears that NWFP will not be able to achieve the target for this indicator by 2015. More investment and policy changes are needed. MDG target 4, indicator 2, projects full parity in literacy between girls and boys aged from 15-24 years of age by 2015. No data has been produced in this survey for the indicator. It is therefore, assumed that this target will not be met. NWFP can generate this data and make more investments. MDG target 4, indicator 3, states that the share of women in wage employment in the non agricultural sector should be 14% of the total in 2015. In 2005 the figure for NWFP was 4.03% only. Given the historic growth rate of women urban employment in NWFP, this indicator target will not be achieved. More vigorous action is needed to bring the target within reach. MDG target 4, indicator 4, states that representation of women in elected institutions should be increased; in 2005 women occupied 18% of the total seats in the provincial legislature. There is no matching target figure for 2015. Hence the increased share of women in the parliament and local government is considered as meeting the target.
Target-5: Reduce by two-thirds, between 1990 and 2015, the under-five Mortality Rate
MDG target 5, has 6,, indicators concern the reduction of child mortality. The target is to reduce by two thirds, between 1990 – 2015, the under 5 mortality rate. Under indicator 1 of target 5, the under 5 mortality rate has to be 52 per 1000 live births. In 2005, NWFP has a figure of 87 deaths; the national PRSP-1 target is 80. The province has made appreciable progress because in 1991 the mortality rate was 129. The trend line is achievable though challenging; more investment and policy reforms are needed. MDG target 5, indicator 2, wants the reduction to 40, the number of deaths of children under one year age per thousand live births by 2015. According to the report, the NWFP figure was 69 deaths per thousand live births. The national PRSP-1 target for he same period is 83. Clearly NWFP has done well and the trend indicates that the target for this indicator will be achieved. MDG target 5, indicator 3, lays down that by 2015, more than 90% of children between 12 and 23 months of age will be fully vaccinated against EPI target diseases. By 2005, NWFP

Section 6 LINK BETWEEN PRSP, MDGS & CDF FINAL
K&P, Consultancy Services, Peshawar. 23
had achieved a coverage of 73%, against the national PRSP-1 target of 82%. With a little more effort, NWFP will be able to meet this target. MDG target 5, indicator 4, states that by 2015, more than 90% of infants of 12 months of age must receive measles vaccine. By 2005, NWFP had achieved coverage of 78% against the national PRSP-1 target of 80%. Again the trend line indicates that NWFP will be able to achieve the MDG target. MDG target 5, indicator 5, states that by 2015 the proportion of children under 5 year of age suffering from diarrhea in the past 30 days should be less than 65% of such children. According to the survey for 2005, the figure was 84%. The relevant figure under this indicator for 1991 was 54%. NWFP may not be able to meet this target without more effort. MDG target 5, indicator 6, aims that by 2015, the proportion of households covered by lady health visitors delivering their services, should be 100% by 2015. NWFP‘s MDG survey for 2015 shows 43% coverage. The national PRSP-1 target coverage for 2005 was 83% for this indicator. On the face of it, the performance of NWFP is poor. However, the existing NWFP survey does not cover the LHW services obtained by the population from private sector service providers. To get a clearer picture of performance, the district health authorities should obtain information from private sector providers as well. On the basis of present information, NWFP will not be able to meet the target for indicator.
Target 6: Reduce by three-quarters, between 1990 and 2015, the Maternal Mortality Rate
MDG target 6 is to reduce by three quarters, from 1990 to 2015, the maternal mortality rate. It has a set of five related indicators. MDG target 6, aims at reducing by three quarters, from 1990 to 2015, the maternal mortality rate. According to indicator 1, the target is to reduce the number of mothers dying due to complications of pregnancy and delivery to 140 per 100,000 live births by 2015. In 1991, the figure for NWFP was a shocking 500-700 maternal deaths per 100,000 live births. In 1995 it reached 780 deaths per 100,000 live births. Inexplicably, there is no data for 2005. This requires an explanation. It is a crucial result and should be obtained. It is unlikely for the target to be met. MDG target 6, indicator 2, states that the proportion of deliveries, attended by skilled health personnel should be more than 90% by 2015. In 1991, NWFP had reached 53% mark. In the survey the figure provided is as low as 9%. The likely explanation for this low figure is the non recording of intervention by private service providers. The MDG survey 2005, did not have any figures about the provision of births attended by private birth attendants. The data corroborates the poor result for target 6 indicator 1. Accordingly this target will not be met. MDG target 6, indicator 3, states that by 2015 the proportion of eligible couples for family planning programmes, using one of the contraceptive methods should be 55%. According to the survey the coverage was 28%, against the mid term national PRSP target of 41.7%. The trend line shows that NWFP will not be able to achieve the MDG target for this indicator. MDG target 6, indicator 4, states that the average number of children per women during her reproductive age should be 2.1 children by 2015. In the 2005, the NWFP average was 4.15 children per women. The national PRSP-1 target for this indicator was 3.7. This is a challenging target and will be achieved with difficulty. MDG target 6, Indicator 5, projects that 100% of child bearing women, within the ages of 15-49 years, who delivered during the last 3 years, must receive at least one antenatal care during her pregnancy by 2015. The survey shows 45% coverage against the national PRSP-1 target of 50% for 2005. NWFP, according to the present trend line is not likely to achieve the MDG target, unless the private sector figures are made available and integrated.
Target 7: Have halted by 2015, and begun to reverse, the spread of HIV / Aids
MDG target 7, is to halt by 2015, and reverse the spread of HIV / Aids. Unfortunately, no reliable data was available for the survey, except that 414 HIV / Aids cases were reported at

Section 6 LINK BETWEEN PRSP, MDGS & CDF FINAL
K&P, Consultancy Services, Peshawar. 24
Peshawar. The non availability of data, for whatever reason, cannot be taken lightly. The situation is fraught with an imminent public health danger in the future, unless more positive steps are taken now. Thus the MDG target for this indicator is unlikely to be achieved and HIV / Aids remain a very serious threat.
Target 8: Have halted by 2015 and begun to reverse, the incidence of Malaria and other major diseases
MDG target 8 is to halt by 2015 and begin to reverse the incidence of malaria and other major diseases. Unfortunately, no indicator has been devised for malaria measurement and control for NWFP. It may be that owing to past work against malaria, it is no longer viewed as a threat. There is therefore a danger of relapse of this disease. The indicator should be activated and monitored. MDG target 8, indicator 2, states that the total number of TB cases per 100,000 population should not be more than 45 by 2015. According to the NWFP MDG survey, the province has 85 persons p / 100,000 incidence of TB. This shows a much better picture than the national PRSP-1, target of 133 persons p / 100,000. According to the trend, NWFP will achieve the MDG target for the indicators. MDG target 8, indicator 3, states that the detection and management of TB will be through DOT strategy. The target for 2015 is an 85% treatment of TB under this method. According to the report, NWFP had achieved a performance rate of 77%; higher than the 70% target set by the national PRSP-1 for 2005. NWFP will achieve the MDG target for this indicator.
Target 9: Integrate the principles of sustainable development into country policies and programmes and reverse the loss of environmental resources
MDG target 9, indicator 1, deals with environmental sustainability. It has four indicators for monitoring. Target 9, indicator 1, states that by 2015, the forest cover should at least be 6% of the total land area. NWFP, because of its highland is blessed with natural forests. Although they are under threat due to policy deficits, even then forests cover 26.2% of the total area. This is more than the national PRSP-1 target of 5% for the same period; but policy changes are needed to protect this natural advantage. MDG target 9, indicator 2, states that at least 12% of the total land area must be protected for conservation of wild life by 2015. NWFP due to high population density has 6.4% of the total land area conserved for wild life. This target will be difficult to attain due to population pressure. Target 10: Halve, by 2015, the proportion of people without sustainable access to safe drinking water and basic sanitation
MDG Target 10, indicator 1, states that 93% of the population must have access to safe drinking water by 2015. The report indicates a coverage of 80%, which is higher than the 70% target set by national PRSP-1 2005. This is a commendable achievement and NWFP will reach the target. Target 10, indicator 2, states that by 2015, 90% of the population must have access to sanitation. According to the report, NWFP has achieved a coverage of 76%. This target is likely to be achieved. Target 11: Have achieve, by 2020, a significant improvement in the lives of slum dwellers
Target 11, indicator 1, states that by 2015, 95% of katchi abadis should be regularized, as percentage of those identified by the cut of date of 1985. No progress has been reported. This is an indicator, which has a direct impact on improving livelihoods and reducing poverty. There are various government departments, involved in improvement of katchi abadis and data will be available with them. It is proposed, that the government may take step to monitor this indicator because of its importance to poverty reduction.

Section 6 LINK BETWEEN PRSP, MDGS & CDF FINAL
K&P, Consultancy Services, Peshawar. 25
6.3. Score Card on MDG Achievement
From the foregoing analysis of provincial MDG data for NWFP, the following major conclusions are derived;
Out of 26 indicators measured, NWFP was on track to achieve the targets in15, as shown in Table 6 of the Annexure.
There are 2 indicators, where the MDG targets can be achieved with more effort and may be seen in Table 7 of the Annexure.
There are 14 targets for different indicators, which are unlikely to be met. These are shown in

Section 6 LINK BETWEEN PRSP, MDGS & CDF FINAL
K&P, Consultancy Services, Peshawar. 26
Table 8 of the Annexure. The foregoing review of progress also indicates a strong gender vulnerability, adverse to the girl child and women. Unless this situation is changed rapidly, the province will remain trapped in poverty and backwardness. As shown later in this report, investment in the girl child and women is the quickest methodology for poverty reduction; the development data from this survey confirms this hypothesis. NWFP has to commit itself to achieving more progress on the indicators shown in
Section 6 LINK BETWEEN PRSP, MDGS & CDF FINAL
K&P, Consultancy Services, Peshawar. 27
Table 8. Secondly, HIV / Aids and Malaria monitoring should be converted into indicators by the Health Department; failure to do so will cause grave risk to public health in the future. Thirdly, provincial departments have data about regularization of katchi abadis, which is target 11 indicator 1; this should be made available and monitored as it helps in poverty reduction.
6.4. MDG Human Development Index for NWFP Districts (2005)
As a result, of the availability of the MDG Survey Report 2005, the state of human development indicators was studied for each of the 24 districts of NWFP. It is an accepted fact, that poor development indicators indicate the presence of poverty. Districts scoring high also mean that poverty was lesser there. In creating the District Human Development Index, the following methodology was adopted and while doing so substantial input was derived from the previous path breaking study, ―NWFP: A District-based Multiple Indicators Cluster Survey, 2001‖ (MICS), prepared by Planning & Development Department, NWFP, in collaboration with the UNICEF. In this study, 6 indicators viz IMR (Infant Mortality Ratio), NER (Net Enrollment Rate) at the primary level, adult literacy, drinking water, sanitation and average per capita income per day were considered in devising district composite ranking for NWFP. This ranking mirrored the methodology used for the creation of the human development index previously developed by UNDP. Furthermore, the MICS composite index used the following system of weightage to highlight the critical indicators, necessary for human development. In MICS, Infant Mortality Rate, (IMR) received weightage of 1, primary education 0.66, adult literacy 0.33, clean drinking water 0.25, sanitation 0.25 and income per capita per day 0.50. Incidentally, the last component, although reflective of welfare, created an exogenous factor not necessarily generated from within the district, thus shading positively the HDI of the district. In creating the current MDG Human Development Index for the NWFP districts, 9 indicators were selected, as compared with the 6 used by MICS. Weightage was given to indicators, keeping in mind the human development and poverty reducing impact of the MDG indicator involved. In education, gender parity index (GPI) at primary level was given weightage of 0.5, gross enrollment ratio at primary school level was given a weightage of 0.25 and adult literacy was given 0.25 weightage. In the health sector, Infant Mortality Ratio (IMR), was given a weightage of 0.5, lady health worker (LHW) coverage was given a weightage of 0.25, and EPI was given 0.25 weightage. In environment sector, forest cover was given a weightage of 0.23, drinking water sector was given 0.5 weightage and sanitation received a weightage of 0.27. Table 9 shows the comparative district ranking in the NWFP, based on performance of districts in achieving the MDG indicator targets. In giving the ranking, the most developed district has the highest rank of 1 and the most under developed has the lowest rank of 24. Column 13, gives the ranking of districts in the MICS 2001 report. Column 14, indicates the change of district position between 2001 and 2005. By comparing both the rankings the following conclusions are derived.
Those districts, which led in girls‘ primary education achieving a high gender parity index, came in the top most group of districts in other indicators as well. The amazing co-relationship, which emerges from this pivotal finding is, that by concentrating on girls‘ education, districts mired in poverty and engulfed by backwardness, can emerge out of the constraining limits. This lesson is worth underlining, while making allocations or selecting priorities.
Districts performing well under sanitation had low incidence of infant mortality.

Section 6 LINK BETWEEN PRSP, MDGS & CDF FINAL
K&P, Consultancy Services, Peshawar. 28
Advantage in having a higher ranking in forest did not necessarily translate into higher ranking in the district index.
The composite index confirms the positive relationship between a high literacy rate and low infant mortality.
Except for Karak district, higher proportion of LHW coverage led to lower IMR.
It is evident, that when one examines the investment in infrastructure like road and building sector, one finds that higher allocations are not necessarily translatable into better human development index of districts.
Shows that districts receiving large funds for roads and buildings, over the last 4 years, were not in the forefront of MDG Human Development Index of NWFP. It is therefore evident, that there is no short cut to investment in education, particularly girls‘ education for improving the index. It also sends a message to those who compete for large infrastructural projects, that the real welfare of their people lies in obtaining more funds for MDG sectors, particularly those relating to the female gender.
While comparing the result of the MDG composite ranking against the MICS composite ranking the following significant results are noted;
o The top eight districts have retained their group position with very slight variation; Chitral has made major gains and has jumped from its 10 position in the MICS 2001, to 5
th position in the MDG Survey 2005.
o Battagram, has done very well to move from 21st position in 2001, to 11th in 2005.
o Karak, has done poorly by moving down from 9th position in 2001, to l8th in 2005.
o Buner, similarly has done poorly by moving from 13th position in 2001, to 22nd in 2005.
o Charsadda, has performed well by moving from 17th position in 2001, to 10th in 2005.
The following highlights are noted in various sectors, which resulted in either improving or reducing the MDG Human Development Index of a district;
o The highest primary education enrollment was in Abbotabad and Haripur and they have the highest GPI (Gender Parity Index) — they are at the top of the table in both the surveys.
o Another significant finding is the increase in GER (Gross Enrollment Ratio) at primary level in both Upper and Lower Dir districts since 2001. For Dir to progress faster, it is necessary that it should improve its GPI, which is very poor. The implementation of this one recommendation alone will substantially improve most of the remaining critical indicators relating to IMR, women mortality and poverty.
o Mansehra, has lost its previous high ranking of 5th in 2001, to 12th in 2005. This is a result of its decline in immunization and lower LHW coverage. It also performed poorly in drinking water and sanitation sectors.
o Kohat, has underperformed in 2005 by dropping from 4th position in 2001 to 13th position in 2005. This was due to worsening infant mortality, GER and drinking water and sanitation performance.
o Swabi, improved its previous 2001 position from 12th, to 7th in 2005. This
resulted due to improvements in GER, adult literacy and drinking water and sanitation sector.
o Tank, has improved from 20th positions in 2001, to 14th in 2005. This is due to better performance in GER, adult literacy, drinking water and sanitation sector.
o Kohistan has not changed its position at the bottom of the table; it seems that a gigantic development effort is needed to improve its human development index position.

Section 6 LINK BETWEEN PRSP, MDGS & CDF FINAL
K&P, Consultancy Services, Peshawar. 29
The survey of the MDG indicators shows that there is a need for greater care and concentration in the achievements of its target then is the present case in NWFP; for planners who have a dilemma where to put their money, which is shrinking in value, the answer is very clear – if you have to choose between investing in infrastructure or human development, please choose the later; what good is a road when the people are too poor to travel?
Section 7 ANCHORING THE MDGS – USEFULNESS OF VISION 2030, MTDF & MTBF FINAL
K&P, Consultancy Services, Peshawar. 30
7. ANCHORING THE MDGS – USEFULNESS OF VISION 2030, MTDF & MTBF
7.1. Vision 2030
To deal with poverty on a consistent and long term basis, certain planning concepts and tools have been perfected and are advocated for implementation under the CDF. Pakistan has begun to conceive / implement these instruments at the national level; it is proposed that we begin to do so at the provincial level. The National Economic Council (NEC), in its meeting of 27 May, 2005, approved the preparation of Vision 2030 under an objectives statement. It was decided, that it‘s preparation will be undertaken by the Planning Commission. It will be a long term perspective document, high lighting the strategic direction needed to follow the Vision. It would be achieved after the implementation of a series of five, 5 year development plans formulated for a 25 year period. In this context, MTDF 2005-10, represents the first installment and also signifies the resumption of 5 Year Planning in Pakistan. However, the approach conflicts with mid-term planning which is dependent on a 3 year rolling plan approach.
Vision 2030, desires that the country should emerge as, ―A developed, industrialized, just and prosperous Pakistan through rapid and sustainable development in a resource constrained economy by deploying knowledge inputs‖
43. It envisages that Pakistan will
participate in globalization and adopt a knowledge based and technologically driven mode of production for production of high quality goods and services. On the fiscal side it hopes to raise the saving investment ratio leading to high growth in savings and productivity in a technological society based on compassion, equity and justice. The other results to be obtained from Vision 2030, are macro-economic stability, reduction in poverty and unemployment, food security, social and regional harmony and the well being of the people of Pakistan. In particular the Vision places special emphasis on;
Education: Developing a system of delivery of quality education at all levels and a
completely new system of quality technical education of international standard
Justice: The availability of a safe and secure environment with easy access to justice and the development of institutions for provision of security and efficient, timely dispensation of justice.
Health: Availability of good, affordable health care and an effective regulatory regime for policing the sector.
Governance & Management: Strengthening of capacity in management of projects, institutions and organizations.
Institution: Establishment of quality institutions. The state has the basic responsibility for the provision of justice, security, education, health, sanitation, water and other essential services.
Finances: Availability of necessary resources is critically dependant on significantly increasing the tax to GDP ratio and promoting a just and non-regressive regime of taxation.

Section 7 ANCHORING THE MDGS – USEFULNESS OF VISION 2030, MTDF & MTBF FINAL
K&P, Consultancy Services, Peshawar. 31
The following tentative goals for poverty reduction and income distribution have been defined for Vision 2030;
Reduction of poverty by 2030 is the major goal. Experiences of various countries show
that reducing it below ten percent becomes a challenge and ‗pockets‘ of poverty remain due to social and cultural rigidities, poverty would be reduced through targeted programs.
The trend of worsening income distribution ought to be reversed. Vision 2030 should, therefore aim to further improve and achieve better income distribution.
The share in the national income of the poorest 20 percent of the population has ranged from 6 to 8.5 percent in the last 50 years. Vision 2030 would aim to increase this share from 8 to 10 percent. In short the Vision 2030 concept aims to convert Pakistan into a ―core nation‖.
44
It is obvious that the Vision 2030 needs clarification in the following areas;
The Vision wants to convert Pakistan into a ―core nation‖. However, the criterion for a core nation is not defined. What will be the minimum core values in 2030? These have to be defined. However, there are two major threats facing the implementation of the Vision. Pakistan will come under intense pressure from limited water and energy supply in the future; these two stressors are likely to challenge our survival and disrupt the fulfillment of Vision 2030.
The approach paper refers to energy deficit and conflict over dwindling water resources as threats to implementation of Vision 2030. Let us briefly examine these two threats in the context of poverty reduction strategy. At the present population growth rate, Pakistan will reach the 220 million mark by 2030. That is a huge number to feed and service; it will not be possible to do so within Pakistan‘s existing resources or technology; it is also unlikely that it will be able to find adequate food, energy or employment opportunities for such a large number of people in the future owing to a slow down in growth because of energy and water constraints. In the same context NWFP too will be the center of environmental conflict specially in the forestry and water sector.
Oil prices today are in the $ 70 per barrel range. The present global oil production is 85 million barrels per day. The annual global rate of growth of energy demand is roughly 3%. The annual rate of global oil depletion at source is 2%; therefore to meet current global oil demand the supply must increase by at least 5% per annum. By 2030 the
global output should be more than 135 M/barrel of oil P/day. 45 This is not possible. The graph at Annex 16 depicts the crises points, when the energy based industrial and agriculture growth will reach a crises. Energy costs will go up, producing food and energy difficulty of a stupendous nature. Fossil fuel is used for transportation and fueling economic growth. A reduction of oil and gas will increase costs and make it impossible for farmers here to meet higher cost of inputs. Food production will fall leading to famine conditions. Therefore, it is very important that Vision 2030 paper should address the issues from the poverty perspective. NWFP planners should consider options to deal with poverty in a scenario with increasing energy costs. As the fuel costs go up the poor will be forced to depend on forests for meeting their fuel needs. The forest cover will be reduced.
The other issue which will effect Pakistan‘s future growth will be uncertainty in the availability of water. Pakistan has the world‘s largest irrigated agriculture. Its survival as a country depends on assured water supplies. If the supplies are reduced it will be a lethal blow. On the other hand, water is a finite resource and its availability is limited. Reservoirs are depleting and Pakistan has already lost more than 6 MAF of storage

Section 7 ANCHORING THE MDGS – USEFULNESS OF VISION 2030, MTDF & MTBF FINAL
K&P, Consultancy Services, Peshawar. 32
capacity due to silt. If Pakistan‘s population reaches 220-230 million in 2030, how will it feed it? Besides becoming a source of conflict in the region, the decreasing availability of water coupled with a weak state regulatory apparatus will increase poverty. This will threaten NWFP‘s unused share in the Indus water unless it develops uses for it now; it would also reduce poverty.
The Vision 2030 also refers to the importance of conservation of natural recourses including water, land and forest to meet the challenges of development, growth and poverty reduction. However, due to emphasis on market mechanism as the arbiter of price and the virtual absence of social nets, the poor per force depend on natural resources for livelihoods. With a projected increase in population, poor employment opportunities and poor income distribution, natural resources will come under severe strain and their productivity reduced. This will emerge as a threat to NWFP‘s forest dependent communities who will be further impoverished. It is thus essential for NWFP to confront these issues in its version of a 2030 report. It is also high time to involve communities in the management of forests if NWFP wants to reduce poverty and also protect forests in the future.
7.2. Medium Term Development Framework 2005-10
MTDF is Pakistan‘s version of a comprehensive development framework conceived under Vision 2030, with five more MTDFs expected between now and 2030. MTDF claims that the human development targets included within it have been fixed in conformity with the Millennium Development Goals. They will be achieved through a PRSP, which provides for a 7-8% annual GDP growth. The following seven outcomes have been indicated for the first MTDF;
Establish a just and sustainable economic system for reducing poverty and achieving MDGs.
Move, in an organized and disciplined manner, towards an efficient, balanced, internationally competitive, environment friendly, and technologically driven knowledge economy for rapid sustainable growth and to make Pakistan, an industrialized nation within 25 years.
Evolve a mature, tolerant, democratic society, which is developed economically, culturally, ethically and imbibed with Islamic values of moderation and enlightenment, at peace with itself and with the rest of the world.
Build a strong and prosperous Pakistan having a fully integrated economy with a sense of common and shared destiny
Protect the right to development of every citizen particularly.
Protect the right of development of every citizen particularly those of children, youth, women and minorities.
Ensure equitable development of regions. The weakness of MTDF is its approach, which believes in poverty reduction as a natural consequence, through the trickle down effect; such a strategy is against the spirit of an alternate strategy, which recommends specific distributive policies for targeting poverty directly, rather than through GDP growth alone. Support for this opinion is provided by an expenditure review for 2004, which blames inadequate spending and non targeted
expenditures on pro-poor programmes.46
Secondly, the MTDF is based on vague assumptions of a speedy and successful devolution of powers and strengthening of governance, which would improve social service delivery. The MTDF also lacks a coherent policy how poverty reduction is to be approached at the local government level.
Section 7 ANCHORING THE MDGS – USEFULNESS OF VISION 2030, MTDF & MTBF FINAL
K&P, Consultancy Services, Peshawar. 33
It is also vague in defining the policy for the very poor, who will be covered by Zakat, Bait ul Maal and food support programmes. Social security nets for the poor require deeper thinking and a system devised which is able to deliver food and livelihood support directly to the targeted households. It is recommended that the MTDF should be built on the conceptual framework of the PRSP concerning delivery of programmes at the local government level. In order to achieve progress and programme effectiveness at the district level, capacity must be enhanced through community participation. The model developed by the IUCN in the Sarhad Conservation Strategy is readily available for replication, not only for involving the communities in programme conception but also for management of wild life, forest, grazing land and harvesting of medicinal plants in the fragile highlands.
47
It has been said that the policy divergence between the MTDF and PRSP approach is in fact a reflection of the struggle for supremacy between the Planning Commission and the Ministry of Finance; Planning Commission‘s pivotal role in transforming the country through the five year plans is now being challenged by the Ministry of Finance, which leads the PRSP implementation and has thus entered the planning field. MTDF‘s bid to include the PRSP within it, is seen as an attempt by the Planning Commission to obtain control over the PRSP implementation. Internationally, there is a re-thinking going on in the IFIs, who show greater willingness to include the state in economic planning now; in the recent past state planning was condemned for being inefficient and an interference in the free market mechanism for allocation of resources.
7.3. Do We Need a MTDF?
It has been argued by the ―like minded donor group‖ of international donors in Islamabad, that in the presence of the PRSP, there is no need for an MTDF. I think this comment does not take into consideration other needs of planning that the MTDF aims to fulfill. The PRSP operates within the framework of an over all development and structural policy, so that investments are made in a holistic manner. Secondly, while the PRSP focuses on macro economic reform and opening up the economy to deal with poverty, the MTDF being the top planning document subsumes the PRSP policies and goes beyond to look at all the other infrastructure sectors and their problems to support the PRSP. Thirdly, the MTDF is also a compliance requirement under the World Bank‘s Comprehensive Development Framework,
and Paris Declaration.48
Annex 17, (derived from the Comprehensive Development Framework) shows that Pakistan is barely meeting the minimum Paris Declaration requirements. It has to put in more effort to align itself by 2010. This can only be better done under an MTDF. There are problems of coordination in the implementation of multiple programmes under different ministries both in the federal and the provincial governments. The MTDF, PRSP and MDG are the responsibility of different ministries at the apex level, i.e finance and the planning departments. This division could lead to programme incoherence. It is evident that more emphasis has been given to the PRSP side of the equation with the result that there is more capacity building in the Finance than the Planning Division. The same situation is reflected in the provincial governments; one needs to address this issue, otherwise the implementation of the MDG and delivery of related services, would be adversely affected. On the other hand the MTDF programmes are not properly costed, nor are they integrated into a financial plan, under the MTBF. To avoid adverse planning outcomes it is proposed that the NWFP MTBF should be expanded to include and protect other important expenditures which are excluded from the MTBF at present. NWFP also needs to articulate a provincial MTDF based on its
Section 7 ANCHORING THE MDGS – USEFULNESS OF VISION 2030, MTDF & MTBF FINAL
K&P, Consultancy Services, Peshawar. 34
requirements and which is a master document of its strategies; yes, the answer is to have an MTDF for NWFP. 7.4. Conflict between MTDF , MTBF & NWFP PRP
An examination of the different planning policies shows a contradiction in approach. The PRP-2 caters mostly for the social sector and lays the framework for some sort of GDP growth. It also acts as a surrogate for a provincial PRSP, since there is no current planning document called as such. This vacuum needs to be filled with a full PRSP. In the meantime the findings of this report can be utilized by the NWFP both in its future policy related to the MDGs as well as laying out a fully functional framework of the PRSP, Vision 2030 and a NWFP MTDF. The MTBF is a budgetary expenditure control technique built on a logical framework structure to ensure the fulfillment of objectives contained in the provincial policies to be implemented in the medium term of 3 years; in other words it is an instrument to ensure that poverty related programmes do not suffer from fund shortages and are fully covered to the agreed extent. It will assist NWFP to know some of the pitfalls that have become visible in the simultaneous implementation of the MTBF and the MTDF. Let us examine the requirements of the MTDF with other sectoral guidelines available in it. When the MTDF projections are compared with requirements of the Medium Term Budgetary Framework,
49 it appears as if the two
documents speak separate languages. For instance, the guidelines lay down four steps to create a three year MTBF, which begins by a top ministry strategic review. This lays down in three year blocks the main objectives to be achieved in a prioritized manner. These are in the shape of a logical framework composed of objectives, output and outcomes. The outputs are the measurable result intended to be produced by the organization. In order to ensure that the results are achieved, intermediate indicators are required to be developed. The outputs lead to outcomes, which are the changes that take place while fulfilling the
objectives. Step 2 of the process is to prepare base line financial projection of the cost of the output for the organization in three year blocks. Both the priorities and the budget baseline will be used for negotiation by the department for obtaining funds in the following year‘s budget in the MTBF budget ceiling committee. Step 3, of the guidelines requires the final budget ceiling. This involves the line department, Ministry of Finance, and Planning and Development Departments. Based on the MTBF baseline previously determined by the Department of Finance and on the basis of the departmental strategic review, the final objectives are discussed jointly by the department concerned, and the departments of Finance and Planning. The fourth step is to translate into the final budget document, on the proscribed new format, the budget estimates based on the agreed budget ceiling after any amendments, which may have been made in the NEC. The MTDF indicates what needs to be done in various sectors but has no strategic review of poverty and how it will be eradicated by targeted interventions in the sectors. Apparently, two different approaches are being followed; the MTBF is being applied to a selected area of service delivery in the social sectors related to the MDGs on the basis of a three years rolling plan, while the other programmes are given a secondary position. This issue will generate departmental tensions once the MTBF begins to be applied across the board. Presently, the NWFP processes have not completely entered the MTBF framework. This issue needs to be taken forward as it will improve performance and services. It is
proposed that the NWFP MTDF should be built around the MTBF.50
It is proposed that the

Section 7 ANCHORING THE MDGS – USEFULNESS OF VISION 2030, MTDF & MTBF FINAL
K&P, Consultancy Services, Peshawar. 35
Finance Department NWFP, must align the funding of budgetary proposals on the principles
given in the guideline of the MTBF, as early as possible.
From information gathered, it is evident that there is still long way for NWFP to go to change the budget framework and shift the emphasis from allocation to meaningful expenditures. There is a need of reform in other areas as well, including the system of accounts. This report concludes that PIFRA has the flexibility to include performance budgeting within the new accounting model. What is missing is a provincial law, which ties each demand for grant of funds by the legislature with monitorable targets. If such a system is put into place, a provincial auditor general would certify whether or not the targets have been successfully met by departments against each grant; the minister and his department, would be accountable and answerable to the legislature for the use of funds allocated for the purpose for which the funds were granted. This will improve governance and the performance of departments in the delivery of services. It will also shift the focus of attention from allocation of funds to expenditure of funds; allocation by itself does not create change unless the expenditure is directed towards defined targets. Both poverty reduction and the reform process would greatly benefit from such a change. Capacity building in this area must start as early as possible.
In conclusion it can be said that the MTDF is a visitor from the past, belonging to the days of sectoral budgeting. The MTBF comes from the present and follows the approach recommended under the Paris Declaration and supported by other donor agencies for the implementation of the Millennium Development Goals, 2000. Because of greater scrutiny and adherence to specific guidelines, the programmes included in the MTBF are apparently cost effective and precision driven. This can, not be said of the MTDF expenditures or programmes. It will remain so unless the MTBF is expanded to cover the projects included in the MTDF. However, it is not to say that the MTDF is completely out of line. The MTBF recommendation of extending its budgeting model progressively into other ministries will in the course of time, align the MTDF with the principles of MTBF. NWFP must follow suit. It will further integrate the MTDF and subsequently the Vision 2030 into the process of a three year rolling MTBF; both would then become the instruments of poverty reduction. The recommendation for NWFP is to adopt the MTBF guidelines and begin immediate capacity building to begin their implementation. Its present capacity is inadequate to bring about this transformation. A further study will be needed to define the approach, extent and financial implications of this recommendation. Furthermore, it is proper that the province develop its own vision 2030 and the first interim MTDF, with the understanding that the framework of expenditures will operate under the MTBF and an expenditure law.

Section 8 MAJOR ISSUES IN POVERTY REDUCTION FINAL
K&P, Consultancy Services, Peshawar. 36
8. MAJOR ISSUES IN POVERTY REDUCTION
8.1. Defining Sectoral Objectives
We now examine some of the challenges facing the development of a sound approach for poverty reduction in NWFP. A recommendation applicable to all the sectors is the need to redefine the sectoral objectives. A quick review of the objectives indicated in NWFP PRP-2, show that they are anchored within a supply side driven framework. For instance NWFP PRP-2 defines the objective in education as; To improve access to primary education (enrolment) and raise its quality To reduce gender and rural-urban disparities To expand capacity at the secondary school level for continuing education beyond
primary level. 51
Unfortunately very little is said about what is more important within these priorities or how they will be implemented in the districts. It is also quiet on what needs to be done at what cost and the likelihood of the availability of resources. Similarly in the health sector the objective has been defined as; Management and organizational reforms Programmatic reforms Increasing financial allocation.
52
No indication has been given of the sum needed and the results which will be delivered. In the drinking water and sanitation sector the objective is to provide safe drinking water and sanitation based on better hygiene practices through low cost technologies based on community participation.
53 The weakness in lose definition of objectives is two fold;
The objectives are supply side driven; as if investments by themselves will remove the underlying weaknesses.
The objectives are not informed by livelihood analysis; it is poverty reduction, which is the principle focus of intervention under the PRSP and MDGs. The approach thus has to be holistic. There are similar other weaknesses of analysis in other sectors discussed in NWFP PRP-2. It is evident that for the success of a future PRSP-2, it must re-define the sectoral objectives via livelihood analysis; it will help focus on development interventions leading to poverty reduction, which is goal no 1, under the MDGs. Secondly, the recent MDG survey 2005, should lead to preparation of detailed targets for each district for at least the important identified indicators.
8.2. Land Ownership
While the MTDF discusses the impact on poverty of irrigation projects, it fails to come to grip with the issue of asset deprivation of the poor in land. This issue could have been addressed through land reform or land distribution. But this has so far been ignored. The MDG document speaks of reducing poverty by distributing 2.5 million acre of land amongst landless households before 2015, as a poverty reducing and income distribution measure.
54
No visible policy was noticed in the NWFP which would distribute state land. On the other hand, as a study, conducted for this report, shows at Annex 18, there is a lack of will to distribute land to the landless; there is an obvious resource capture by the rich and squeezing out of poor beneficiaries, thus creating social tension for the future. This factor when linked with the earlier reservations mentioned in the report leads one to conclude that it will be difficult for NWFP to meet MDG goal no 1, which is to halve poverty by 2015, unless

Section 8 MAJOR ISSUES IN POVERTY REDUCTION FINAL
K&P, Consultancy Services, Peshawar. 37
the issue of asset deprivation is seriously addressed. Figure 3 below shows the present position regarding poverty reduction. If the gap is to be narrowed then either the GDP must be higher than 8% per annum or other direct measures would be required to increase incomes of the vulnerable households. Unfortunately, neither is there industrial growth nor an increase in transferred resource from the federal government / WAPDA under net profits to generate an 8% p/annum growth rate for NWFP.
Figure 3 Progress of MDG Poverty Target 55
8.3. Developing Land Markets
Recent research has shown the critical contribution of problem free urban land rights for economic growth. It has been noted that dispute free title to land, leads to development and expansion of bank credit. Issue of disputed land titles is very acute in Peshawar (NWFP), where the land record is full of ambiguity and under the control of multiple departments. It causes delays in confirming ownership and thus prevents the development of business. It also harms expansion of municipal service because of poor tax contribution. It also restricts the construction industry in housing and road development.
56 It is recommended that the
NWFP PRSP-2 examine the improvement of urban land rights as a core area for poverty reduction and private sector development. 8.4. Role of Private Sector
The Private sector has been given a pivotal role in the reduction of poverty. As discussed earlier the World Bank expects that a large part of GDP growth and employment creation will be generated by the private sector. Secondly, the PRSP strategy wants activities now performed by the state to be undertaken through private-public partnership. Thus, the private sector has been made the center piece of the poverty reduction effort. The MTDF highlights the crucial role of public-private partnerships (PPP) in increasing the rate of growth and delivery of services. The NWFP should work on reforms in Public-Private partnership area to provide services in the rural areas; it will help reduce poverty. It will be important if it follows the ten principles for public-private partnership laid down in the MTDF. These are;

Section 8 MAJOR ISSUES IN POVERTY REDUCTION FINAL
K&P, Consultancy Services, Peshawar. 38
High level political and institutional support for PPPs.
Government has the central role in defining what it wants since it is the main regulator; it should define this framework to expand PPP
PPP contracts must make sense in terms of delivering both the desired outcomes and commercial returns
Good PPPs indicate fair risk allocation, demonstrate value for money, clarity of purpose, affordability and certainty of public service payment obligations based on delivery of outputs
They are output based for targeted and efficient subsidy allocation
They must be based on a well defined policy framework that (a) sets out clearly the processes, priorities and scope of PPP; (b) drives transparent procurement processes; (c) includes a communication strategy to improve public and private sector understanding of PPPs; (d) provides clarity of long term government obligations that work across federal and provincial level; (e) includes mechanisms to recognize implicit / explicit government liabilities and public sector balance sheet requirements; and (f) includes mechanisms to deal with incumbents
A well developed legal framework that provides clarity, defines contracting authority powers, minimizes procurement costs, through standard / model contracts, improves dispute reduction, and accommodates future developments
Public sector / supply side issues should be addressed including availability of long term local finance; PPP bid capacity and financing partners and building capacity of local skills
Early identification of projects and prefeasibilty studies for prospective investors is important.
57 The following areas given in Annex 19 can be considered for PPP in NWFP.
This is besides interventions which could be initiated in the social sectors. For a strategic shift to private sector development, the NWFP government must redefine the role of the state, and radically reduce the administrative burden on firms. In this connection constant reforms have to occur for the proposed private-public framework. The following capacity building recommendations are made in this connection;
Strengthening the capacity of the government to execute public-private partnerships.
Improve land markets, particularly in the urban areas.
Repositioning the role of the state, away from operational roles (such as in tourism, construction, logistics and banking) and toward effective sector regulation.
Strengthening sector governance.
Focusing on selected infrastructure improvements, such as cold storage and logistics.
Streamlining tax administration and other administrative barriers for all enterprises (rather than giving fiscal incentives).
58
Table 4 below shows the crucial importance of private investment for generating a GDP growth rate of 7.5% by FY 2010 as compared with a projected GDP growth rate of 6.6%. The private sector has been given the pivotal role in poverty reduction in NWFP.
Table 4 Projected Employment, Investment and Fiscal Outcomes59
FY02 FY03 FY04 FY05 FY06 FY07 FY08 FY09 FY10
Actuals Actuals Actuals Proj. Proj. Proj. Proj. Proj. Proj.
Reform Scenario
Real GDP growth rate (%) 5.4 4.6 5.6 6.3 6.6 6.9 7.2 7.5 7.5
Unemployment rate (%) 13.1 12.9 13.0 12.8 12.4 11.9 11.2 10.4 9.6
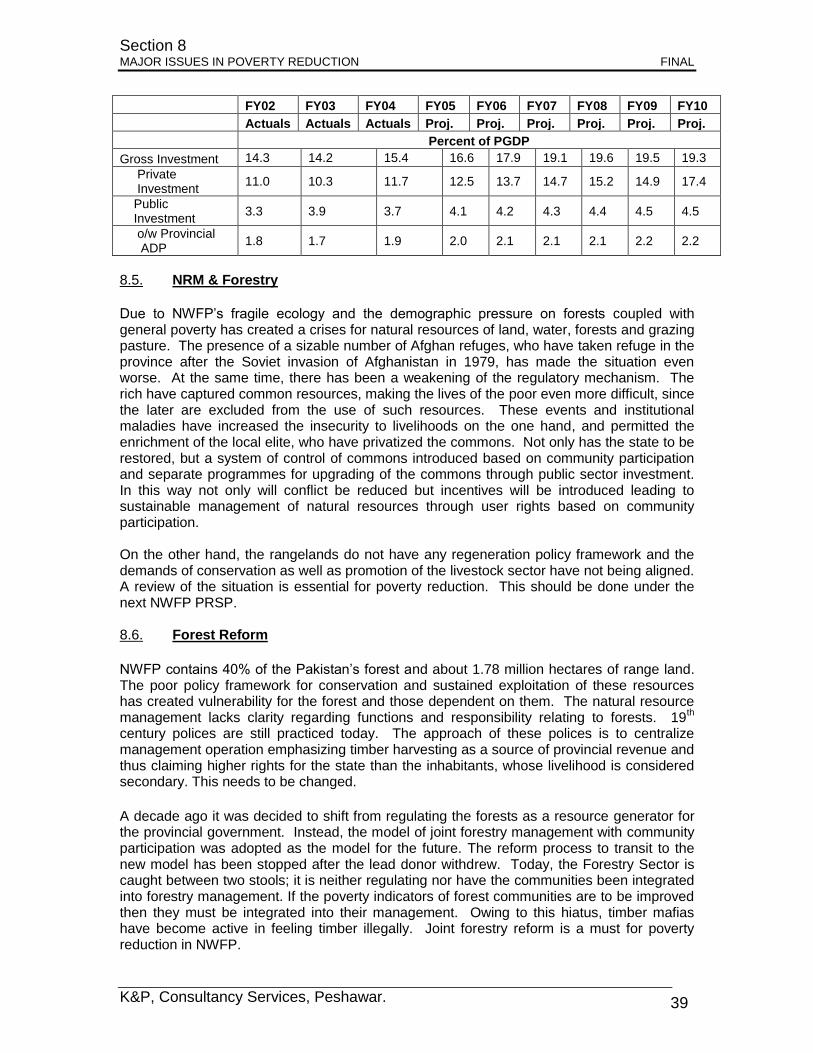
Section 8 MAJOR ISSUES IN POVERTY REDUCTION FINAL
K&P, Consultancy Services, Peshawar. 39
FY02 FY03 FY04 FY05 FY06 FY07 FY08 FY09 FY10
Actuals Actuals Actuals Proj. Proj. Proj. Proj. Proj. Proj.
Percent of PGDP
Gross Investment 14.3 14.2 15.4 16.6 17.9 19.1 19.6 19.5 19.3
Private Investment
11.0 10.3 11.7 12.5 13.7 14.7 15.2 14.9 17.4
Public Investment
3.3 3.9 3.7 4.1 4.2 4.3 4.4 4.5 4.5
o/w Provincial ADP
1.8 1.7 1.9 2.0 2.1 2.1 2.1 2.2 2.2
8.5. NRM & Forestry
Due to NWFP‘s fragile ecology and the demographic pressure on forests coupled with general poverty has created a crises for natural resources of land, water, forests and grazing pasture. The presence of a sizable number of Afghan refuges, who have taken refuge in the province after the Soviet invasion of Afghanistan in 1979, has made the situation even worse. At the same time, there has been a weakening of the regulatory mechanism. The rich have captured common resources, making the lives of the poor even more difficult, since the later are excluded from the use of such resources. These events and institutional maladies have increased the insecurity to livelihoods on the one hand, and permitted the enrichment of the local elite, who have privatized the commons. Not only has the state to be restored, but a system of control of commons introduced based on community participation and separate programmes for upgrading of the commons through public sector investment. In this way not only will conflict be reduced but incentives will be introduced leading to sustainable management of natural resources through user rights based on community participation. On the other hand, the rangelands do not have any regeneration policy framework and the demands of conservation as well as promotion of the livestock sector have not being aligned. A review of the situation is essential for poverty reduction. This should be done under the next NWFP PRSP. 8.6. Forest Reform
NWFP contains 40% of the Pakistan‘s forest and about 1.78 million hectares of range land. The poor policy framework for conservation and sustained exploitation of these resources has created vulnerability for the forest and those dependent on them. The natural resource management lacks clarity regarding functions and responsibility relating to forests. 19
th
century polices are still practiced today. The approach of these polices is to centralize management operation emphasizing timber harvesting as a source of provincial revenue and thus claiming higher rights for the state than the inhabitants, whose livelihood is considered secondary. This needs to be changed.
A decade ago it was decided to shift from regulating the forests as a resource generator for the provincial government. Instead, the model of joint forestry management with community participation was adopted as the model for the future. The reform process to transit to the new model has been stopped after the lead donor withdrew. Today, the Forestry Sector is caught between two stools; it is neither regulating nor have the communities been integrated into forestry management. If the poverty indicators of forest communities are to be improved then they must be integrated into their management. Owing to this hiatus, timber mafias have become active in feeling timber illegally. Joint forestry reform is a must for poverty reduction in NWFP.
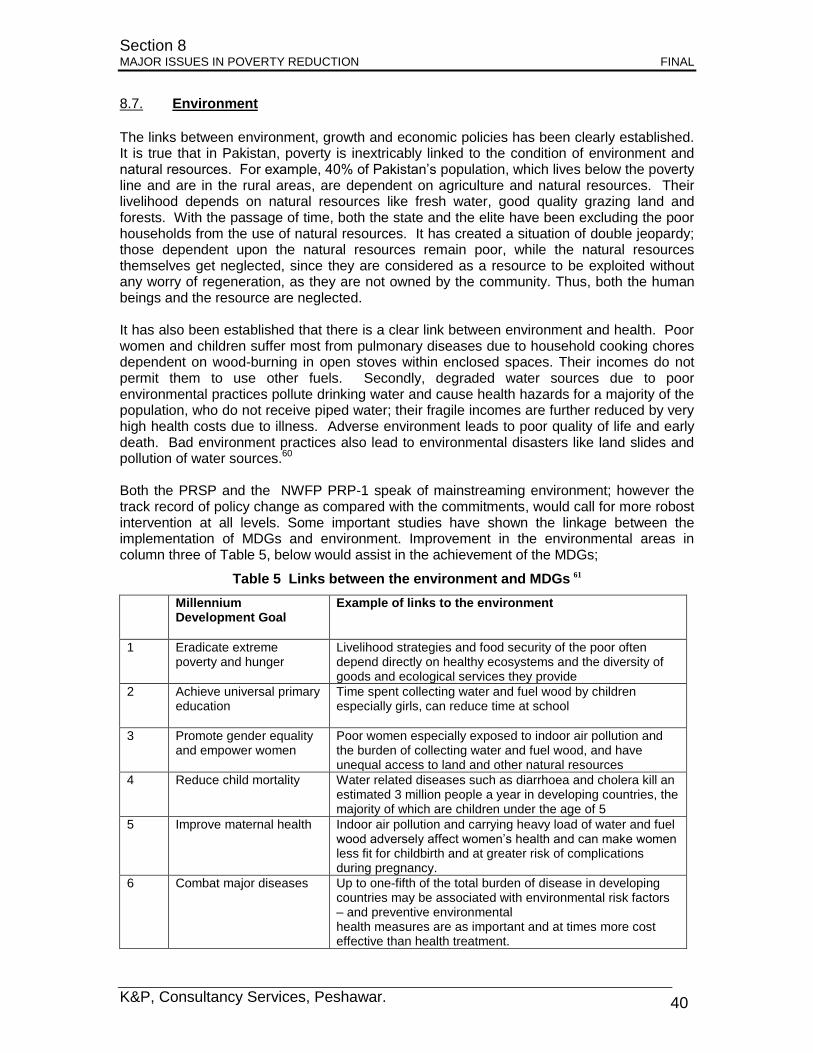
Section 8 MAJOR ISSUES IN POVERTY REDUCTION FINAL
K&P, Consultancy Services, Peshawar. 40
8.7. Environment
The links between environment, growth and economic policies has been clearly established. It is true that in Pakistan, poverty is inextricably linked to the condition of environment and natural resources. For example, 40% of Pakistan‘s population, which lives below the poverty line and are in the rural areas, are dependent on agriculture and natural resources. Their livelihood depends on natural resources like fresh water, good quality grazing land and forests. With the passage of time, both the state and the elite have been excluding the poor households from the use of natural resources. It has created a situation of double jeopardy; those dependent upon the natural resources remain poor, while the natural resources themselves get neglected, since they are considered as a resource to be exploited without any worry of regeneration, as they are not owned by the community. Thus, both the human beings and the resource are neglected. It has also been established that there is a clear link between environment and health. Poor women and children suffer most from pulmonary diseases due to household cooking chores dependent on wood-burning in open stoves within enclosed spaces. Their incomes do not permit them to use other fuels. Secondly, degraded water sources due to poor environmental practices pollute drinking water and cause health hazards for a majority of the population, who do not receive piped water; their fragile incomes are further reduced by very high health costs due to illness. Adverse environment leads to poor quality of life and early death. Bad environment practices also lead to environmental disasters like land slides and pollution of water sources.
60
Both the PRSP and the NWFP PRP-1 speak of mainstreaming environment; however the track record of policy change as compared with the commitments, would call for more robost intervention at all levels. Some important studies have shown the linkage between the implementation of MDGs and environment. Improvement in the environmental areas in column three of Table 5, below would assist in the achievement of the MDGs;
Table 5 Links between the environment and MDGs 61
Millennium Development Goal
Example of links to the environment
1 Eradicate extreme poverty and hunger
Livelihood strategies and food security of the poor often depend directly on healthy ecosystems and the diversity of goods and ecological services they provide
2 Achieve universal primary education
Time spent collecting water and fuel wood by children especially girls, can reduce time at school
3 Promote gender equality and empower women
Poor women especially exposed to indoor air pollution and the burden of collecting water and fuel wood, and have unequal access to land and other natural resources
4 Reduce child mortality Water related diseases such as diarrhoea and cholera kill an estimated 3 million people a year in developing countries, the majority of which are children under the age of 5
5 Improve maternal health Indoor air pollution and carrying heavy load of water and fuel wood adversely affect women‘s health and can make women less fit for childbirth and at greater risk of complications during pregnancy.
6 Combat major diseases Up to one-fifth of the total burden of disease in developing countries may be associated with environmental risk factors – and preventive environmental health measures are as important and at times more cost effective than health treatment.

Section 8 MAJOR ISSUES IN POVERTY REDUCTION FINAL
K&P, Consultancy Services, Peshawar. 41
7 Ensure environmental sustainability
Current trend in environmental degradation must be reversed in order to sustain the health and productivity of the ecosystem.
The IUCN, World Bank and DFID have contributed to the framework of environment and poverty. The key areas through which the poverty - environment linkage operates lies in agriculture, forestry, water, irrigation, industrial waste, roads, and institutional development sectors. It is essential that we change the way that we transact with natural resources, unless this takes place our environmental concerns would remain rhetorical. The price of failure is environmental degradation and acute conflict. In a study on environment and security in Pakistan, it was found that the country is on a path to convergent crises in security, economic management, development policies, political stand off, environmental decay and increasing poverty. It is only a matter of time before disputes based on forest, water resources and commons erupt into violence in the NWFP.
62 It is therefore extremely
important for policy makers to address the environmental conflict issue and prevent an imminent breakdown of social order.
63 In this behalf the following recommendations are
made; A change in the development approach, which is based on sectoral interventions, to one
based on livelihood security analysis which integrates the role of environment as indicated in Annex 6
To carry out a province wide environment audit for identifying the participation of poor households in common environmental resources like forests, water, and grazing land to identify areas needing rule change to provide for livelihood improvement of the poor and community management of such resources.
Making programmes in the health sector to reduce the vulnerability of the poor due to the adverse environment – health linkage
Development of strategic environment assessment from the household livelihood security aspects.
Creating monitorable indicators based on the above programmes. Development of environment / poverty related annual work and financial plans.
Capacity building in the field of environmental management at the district government and provincial level
Strengthening environmental policing
8.8. Gender
There is a close connection between gender equality, economic development and poverty reduction. Female education is the foremost poverty reducing intervention. A compelling body of evidence has emerged in recent years demonstrating that investing in girl‘s education leads to fewer children, better nutrition and healthy families, lower child mortality, generates more income for the family and is far more likely to educate children then women with little schooling. Female education creates a ―virtuous circle‖ for the community and the country64. Independent research in the developed world has brought out that the main reason for recent growth has been the greater contribution made to GDP, by women, rather than new technology or productivity enhancement
65.
NWFP policy documents profess rhetorical support for addressing gender imbalance in different sectors and make it a part of their policy recommendations. Yet there is no monitoring to test this claim. Removal of gender imbalance is integrated into the MDG and is its third goal. In chapter 12, the MTDF speaks of empowering the women politically, socially and economically66. It addresses the various challenges that are faced in this connection. It lists the MDG goals and indicators which are women centered and spread in goals 2, 4, 5 and 6. The GOP PRSP-1 also speaks about the mainstreaming of gender and the need to

Section 8 MAJOR ISSUES IN POVERTY REDUCTION FINAL
K&P, Consultancy Services, Peshawar. 42
empower women for equitable access to assets and resources, which requires the removal of social and economic constraints. It further highlights the government‘s commitment to gender equality for the reduction of poverty67. PRP – 1 and PRP – 2 also address the issue in the same vein. In NWFP because of the policy of exclusionary development for women, has placed its policy out of synchronization; gender has become ―ghettoized‖. This is against the mainstreaming of gender commitment given by Pakistan in the Beijing Platform. Research has found that poverty discriminates against women and children, particularly the girl child. Poverty enslaves the female and shifts greater burden of managing the limited household resources to her. In one sense, poverty creates female slavery. The lives of a majority of women are nasty, brutish and short in the Hobbesian sense. Because of resource degradation in NWFP and non availability of water and fodder for humans and livestock, results in a nightmare of labour and misery for the poor women; the existence of drought in parts of the province has increased female pain. In order to gender development the following steps are proposed; More investment in girl‘s education at all levels. Special skill and vocational development programme for the rural women, which should
include adult literacy connected to livelihood improvement. Better progress in MDG goals Providing land rights to sitting tenants of disputed or unpossessed state lands Providing land rights to peri-urban dwellers Ensuring protection of rights of the poor. Improved child maternity and special emphasis on medical care for rural women‘s
medical hardships Introduction of smokeless stoves Special window of micro credit for women in urban and rural areas. Income generation and livestock development programmes. Development of women specific programmes in rural support NGOs Providing water, forest and grazing rights to communities by amending regulations Special programme for urban women in secretariat skills, tailoring and increased
scholarships in educational and vocational fields. Mainstreaming of all women programmes with the Beijing Platform declaration Development of special statistical indicators to measure periodically the welfare index of
women in NWFP and Pakistan. 8.9. Role of Local Government in Poverty Reduction
A silent revolution took place in Pakistan, after the introduction of the Local Government Ordinance, 2001. It restructured state power by shifting it to elected bodies composed of district assemblies, tehsil municipal administrations and union councils. Concurrently, the process of development planning, budgeting, fund allocation, rule making and political and social power has shifted from the bureaucratic center to elected officials. It has changed the previous framework. It has also caused reform confusion. A contrary opinion holds that the reform may not last. It believes that the regulatory power of the state as reflected in the authority of the provincial executive has weakened. However, the effect on project implementation is mixed and achieving the MDGs through the new system is slow. Maybe it improves after the capacity of local government has improved. The responsibility for the improvement of services and development in the social sectors has shifted to district government. These responsibilities include the implementation of goals under MDGs and poverty reduction measures also come under the purview of district governments. Unfortunately, the shift of power and resources to the district government has not been commensurate with additional responsibilities of the local government. Nor does

Section 8 MAJOR ISSUES IN POVERTY REDUCTION FINAL
K&P, Consultancy Services, Peshawar. 43
the district government have adequate capacity to under take poverty reduction mandate with any seriousness. On paper, the districts have been empowered but in fact they have very little say. For instance in NWFP in 2005-06, about Rs. 21 billion relating to the salary component of the devolved departments was transferred to the districts. In addition Rs. 1 billion was also transferred from the non salary budget and approximately Rs. 1 billion from the Government of Pakistan as share of compensation for zilla tax / octori. Rs. 963 million was allocated to all the districts as development fund under the Provincial Finance Commission Award. On an average, each district received Rs. 30 – 50 million of development budget, depending upon its population and backwardness. Within the district, 30% of these funds were transferred to the tehsils. Out of the remaining 70% funds, 25% were set aside for CCBs. The remaining funds were distributed equally amongst the Union Councils. Therefore, it is evident that hardly any amount is left to do serious poverty reduction work by improving services in the social sector. In 2006, the situation for poverty reduction in the districts worsened, since the present councils began work in Nov 2005, after the elections. It was therefore not possible for them to spend the funds allocated by the end of June. Secondly, an anomalous situation has developed in obtaining donor assistance; the work is needed to be done in districts, while decision making and power under law lies with the provincial government. If the battle against poverty reduction is to be fought under the local government, then new rule making should take place, which must allow district governments to undertake loan negotiation for development assistance directly with donors. Secondly, serious consideration should be given by the provincial government in increasing the non salary budget of districts to improve services in the social sectors based on a facility yardstick. 8.10. Consultative Process The PRSPs are required under the Paris Declaration and the Comprehensive Development Framework to be based on an extensive participatory process for their formulation. For the formulation of national PRSP there were consultations with community organizations, through the rural support programme network. This dialog was supplemented by consultation of communities, through a participatory poverty assessment (PPA). The GOP obtained provincial participation through a high level national steering committee. A one day workshop was also held for the parliamentarian to involve them in the formulation stage of the PRSP. In the case of the NWFP PRSP, a similar process was followed. Because of the nature of the existing distribution of power in the state, the constitutional machinery, which ought to have been brought into play for top level participation of provincial governments could not be done. The PRSP process would have benefited considerably had the issues been discussed with all the provinces in the Council of Common Interest, under article 153 of the Constitution. One understands that there may be some sensitivity against the calling of a meeting of the highest constitution consultative body. Another alternative, is to discuss the draft PRSP-2 in the National Economic Council, which is mandated to advise the federal and provincial government on all plans in respect of financial, commercial, social and economic policies; and in formulating such plans, it is constitutionally required that the NEC follow the Principles of Policy set out in chapter 2 of part II of the Constitution. One of the commitments is to fight poverty. Unfortunately, this was not done. It has been identified as a risk to the PRSP strategy.
68 It is suggested that the Government of Pakistan may call a
meeting of the CCI and the NEC before approving national PRSP-2. Similarly, when the NWFP formalizes its PRSP-2, it should be discussed with all the district governments and the provincial assembly. It is further recommended that during its preparation, the NWFP PRSP-2 should involve communities at Union Council level on the model the SPCS.

Section 9 & 10 NEXT STEPS & CONCLUSION FINAL
K&P, Consultancy Services, Peshawar. 44
9. NEXT STEPS
Annex 1 provides a policy reform matrix resulting from the recommendations contained in this report. The objective will be to prepare a NWFP PRSP-2 aimed at providing the policy framework for implementation of the MDGs and reduction of poverty. In order to set the process rolling, the NWFP cabinet approval will be needed. As a result, far reaching policy changes will occur resulting in quicker and effective poverty reduction. A host of other changes will be ushered, which are indicated in the policy matrix for creating an effective policy framework for poverty reduction.
10. CONCLUSION
This report has examined poverty reduction approach from the global to the household level. The report has identified the requirements, which are to be met at the programme level which includes the need to create a NWFP PRSP-2 along with a provincial version of Vision 2030 and MTDF. The study has indicated the reforms needed which will align the PRSP with the Paris Declaration and the Comprehensive Development Framework. This report believes that the international climate facing NWFP is helpful and benign. It is the deficit in vision and management skills that is preventing the early reduction of poverty. An early implementation of recommendations provided in this report at the policy, sectoral and programme level will provide the means to improve the poverty and MDG indicators.

ANNEXURES FINAL
K&P, Consultancy Services, Peshawar.
45
ANNEXURES

Annex 1 FINAL
K&P, Consultancy Services, Peshawar. 43
Annex 1 : Poverty Policy Reform Matrix
Objective Activities Indicators Results
To prepare a fully functional Poverty Reduction Strategy aimed at meeting MDG targets & poverty reduction
a) NWFP cabinet approves report policy framework in NWFP.
b) Review progress on MDG indicators, emphasizing girl education, maternity health security & gender parity in education.
c) Introduce missing indicators for HIV / Aids and Malaria, katchi abadis
d) Obtain donor / GOP coordination to meet resource gap & obtain technical assistance
e) Prepare indicative budget / timeline for sample poverty survey in NWFP.
f) Increase capacity of departments to undertake more public private partnerships in health & education
g) Advocacy & involvement of public for preparation of Vision 2030, MTDF and Poverty Reduction Strategy 2.
h) Finalize & adopt community consultation process based on Sarhad Provincial Conservation Strategy.
i) Prepare development programme based on current data from MDG survey for 2006-07
j) Implement MTBF guidelines k) Prepare NWFP PRSP-2, including
MDG achievement. l) Separate MDG expenditure be shown
in ADP & current budget expenditure m) Formulate Vision 2030 for NWFP. n) Formulate MTDF for NWFP o) Introduce expenditure budgeting &
legislation to support it. p) Forestry reform initiated
a) NWFP cabinet approves preparation of PRSP-2 by -----------------------.
b) Stakeholder & donor consultation completed by -----------------
c) Poverty sample survey to be available by -----------------------
d) Revised NWFP ADP & current budget which shows direct MDG expenditure to be ready by -----------------------
e) Revised sectoral policies in the light of poverty survey and performance of MDGs to be ready by ---------------------
f) 6 NWFP department budgets based on MTBF guidelines to be ready by ---
g) NWFP PRSP -2 ready for implementation in 2007-08
h) NWFP Vision 2030 available by -----------------------.
i) NWFP MTDF available by March 2007 & implemented from FY 2008-09
j) Reform in law for introduction of performance budgeting for FY 2007-08 – phase 1.
k) New Forestry Act available
a) NWFP Govt implements the new Poverty Reduction Strategy approach
b) Donors align policies in support. c) Active stakeholder consultation in place at
all levels d) NWFP poverty strategy is integrated into
the national & international framework. e) Supporting sectoral policies informed by
poverty analysis and reflected in Poverty Reduction Strategy / ADP
f) All MDG indicators monitored & implemented
g) Departments capacitated to deliver Poverty Reduction Strategy
h) Performance budgeting leads to increased accountability & progress
i) Quality of services improved j) MDG goals pursued vigorously k) Household incomes increase l) Poverty is reduced m) Better accountability n) Improved poverty reduction.
Annex 2 FINAL
K&P, Consultancy Services, Peshawar.
44
Annex 2 : TORs Terms of Reference: Refinement of NWFP Poverty
Reduction Strategy Paper (PRSP) Background
With the changing global trends and priorities, the context of ―Development‖ has also changed to focus more seriously on livelihood improvements with poverty reduction measures for poor. The Government of Pakistan responding to this new global .shelf and change in focus has developed a comprehensive national level Poverty Reduction Strategy and approved it as the poverty reduction agenda for the country. The national PRSP also recommends that for effective implementation of the national PRSP, provincial PRSPs be developed within the broad priorities and available resources of the respective province. To fulfill its obligation, the Government of NWFP, with the financial support of UNICEF, Peshawar, has prepared a provincial PRSP with in the broad parameters of national PRSP and approved the same from the Provincial Cabinet in August 2004.
A detail review of the provincial PRSP by various provincial departments showed that some important sectors, like Tourism, Housing, Industries, Natural Resources i.e forest wildlife, fisheries, environment gender more importantly the relation it has not been incorporated and the links between national and provincial PRSP clearly identified in view of these identified gaps, the provincial government has decided to review and refine the provincial PRSP to make it a more‘ conclusive poverty alleviating agenda for the province.
In the light of the above the P&D Department GoNWFP in collaboration with IUCN PSNP programme would like to review the provincial PRSP and refine it as per the following TORs.
Review the Provincial PRSP and identify gaps and relevant sectors that have been missed out in its formulation;
Monetize the cost of all actions/initiatives at percent and rolling basis in order to provide a clear picture of the resource requirement for implementing the programme over the next five years i.e 2005-06 to 2010-2011.
Incorporate the likely potentials of economic development sectors like, tourism, housing, industries, private sector development and natural resources for their significance in elevating poverty in the province.
Review the MDGs and to identify relationship between MDGs and provincial PRSP indicators leading to implementation of MDGs at provincial level.
Incorporating Environment and Gender in PRSP as cross cutting theme that clearly demonstrate the interdependency of both sectors with poverty in the over all context of livelihood improvement as well as establishing linkage between the root cause of poverty and the natural resources management arid the role of women in the existing NRM practices.
Indicate the missing links between the national and provincial PRSP and capture the impact of MTDF 2005-10 and devise a mechanism for linking them
Formulate refine version of the Provincial PRSP in the light of the above mentioned tasks so that it represent a Provincial Mid Term Development Plan up to 2010.
Any other task relevant to the above work

Annex 3 FINAL
K&P, Consultancy Services, Peshawar.
45
Annex 3: Final inception report
Refinement of NWFP Poverty Reduction Strategy Paper (PRSP) Introduction:
NWFP, has a population of 21.45 million,
69 it is home to 1 in 7 Pakistanis; it has an
estimated per capita provincial GDP/Income70
which is 40% below the national average. Furthermore, about 43% (as compared to 33% for Pakistan) of the province‘s population
71
(that is, almost 1 in 2 inhabitants) belongs to a household that is living below the poverty line. Around 30% of households rely on remittances from migrant labor. The widespread poverty characteristic of the inhabitants of the province is reflected in the abject human development indicators. The table below highlights the province‘s standing relative to the national averages in selected social indicators;
Table 1: Selected Social Indicators.
Indicator NWFP
(Average) Pakistan (Rural)
Pakistan (Urban)
Pakistan (Average)
Adult Literacy (%) 43.0 41.6 69.7 51.6
Female Adult Literacy (%) 25.2 56.3 62.5 39.2
Access to Safe Drinking Water (%) 63.0 90.0 97.0 93.0
Access to Sanitation (%) 39.0 95.0 61.0 57.0
Incidence of Diarrhea * (%) 17.0 12.0 12.0 12.0
Source: Selected Indicators 2004-05, Bureau of statistics, NWFP
* Improving Devolved Social Service Delivery in NWFP and Punjab, Asian Development Bank, 2005.
The province‘s poor social indicators exert severe drag on the provincial government‘s efforts aimed at bringing about improvement in income levels and poverty reduction, hence the endemic intergenerational poverty. As a fall out of the war in Afghanistan and the resulting movement of hundred of thousands of refugees resulted in a severe resource degradation and extreme pressure on the provinces health, education, road infra-structure and natural resources. The presence of refugees also resulted in an adverse effect on local wage level and further contributed to reduction of employment opportunity for residents. This has exacerbated the poverty in NWFP. The Millennium Development Goals (MDG) and the PRSP focus on four pillars to combat poverty, these are; accelerating economic growth, improving governance and devolution, investing in human capital and reduction in regional inequalities (PRSP: 27) Given that this is the way forward, the GoNWFP is cognizant of the need to participate in this national endeavor aimed at improving the economic and social well-being of its inhabitants. The provincial government faces certain constraints, some of which require consideration if significant reduction in absolute poverty is to be realized and a further widening of the inequalities between the ‗have‘ and the ‗have-nots‘ is to be avoided. Given the wide gap in regional income disparities, improvements are a daunting endeavor for the GoNWFP.

Annex 3 FINAL
K&P, Consultancy Services, Peshawar.
46
For instance, provincial government finance is an area of particular concern which requires special attention. Apparently, the provincial government has inadequate ―slack‖ capacity to raise additional revenue from existing provincial sources. As far as the expenditures side is concerned, it is unlikely that attempts at ―fat trimming‖ from provincial expenditures would yield substantial savings (total expenditures are not large, given the relatively small magnitude of the provincial GDP). Faced with the above limitation, it is unlikely that the provincial government would be able to garner adequate funds from provincial sources to bring about a meaningful reduction in poverty. It is thus essential to increase resources for the critical interventions either by obtaining fresh resources or by giving up some of the current activities. Consequently, the GoNWFP‘s major effort ought to focus on securing not only the province‘s full entitlement against the NFC award plus an additional 4% to 5% for at least the short term (4-5 years), on grounds of equity, if it is to meaningfully address the prevailing level of deprivation in the province and to bridge the wide gap in inter-provincial inequalities. The capping of incomes from net profits on hydel electricity has dealt a serious blow to the ability of NWFP to confront poverty. It is seriously hampered in meeting the demand for priority expenditures. Assistance from the World Bank‘s structural credit budgetary support is in the nature of a life line to the province to meet its obligations to the people. However, this budgetary support lifts the pressure from the federal government to settle the matter. It could become a problem when formulating a 3 year expenditure plan under the MTBF. The exemption from property taxation and the rebate on electricity consumption for industrial units in industrial estates, the later measure anticipated to encourage industrial activity in the province, has negative implications for government revenues further eroding the ability to confront poverty. NWFP has been able to raises additional budgetary resources by obtaining loans through the World Bank‘s Structural Adjustment Credit. From 2002 to 2006, NWFP received a sum of Rs 13961.8 million, as budgetary support. NWFP is now preparing to obtain long term World Bank budgetary support for the reform process under a Development Policy Credit. To enable the provincial government to effectively deal with poverty reduction and achieve the MDG and the PRSP targets, refinement of NWFP PRSP deserves due urgency. Constraints facing NWFP in increasing its GDP The following structural constraints limit NWFP‘s efforts to increase its GDP -contributions- unless it increases by a minimum of 7-8% annually, it will face difficulties in alleviating poverty in a meaningful manner.
Location: Deep inland location of NWFP increases the input and output transportation cost thus making this province non-competitive with the upland markets of Sindh and Punjab. However, if the focus of the market were to change towards Afghanistan and Central Asia, NWFP would gain a comparative advantage in developing its industrial sector. Secondly, improvement in the efficiency of the railway network from the port to NWFP could also help in reducing input and output transportation costs. Hence, NWFP‘s locational position could be transformed into an advantage.
Annex 3 FINAL
K&P, Consultancy Services, Peshawar.
47
Political Instability: Being a border state with Afghanistan, NWFP has suffered the consequences of the war, which has caused instability and discouraged private investment. It has also created a mass of problems related to weaponry and drugs.
Small Private Sector: Due to the above factors, NWFP has a weak private sector which is operating below its full potential. Other reasons for the lack luster performance of the private sector include: uncertainty, unhelpful tax administration, bureaucratic over-load and power shortages. This has led to shrinkage in the industrial base and resulted in out migration of people in search of jobs.
Skill Shortage: Because of lack of investment in vocational training coupled with a poor education base, productivity of labour is low which discourages investment. The same drawbacks force migrant labour into low paid jobs abroad. Vocational training policies are unprogressive and way behind Punjab and Sindh.
Weak Governance: The ability to be creative in policy formulation is severely constrained because of lack of capacity and absence of appropriate training.
Potential for GDP growth.
Although the above paints a negative picture of NWFP‘s potential yet there are areas in which growth and investment can take place; some of these are as under;
NWFP has a huge hydel potential for the production of energy. The province can earn revenue by selling electricity to the national grid or it can create its own local grid within the province on a lower rate, which would create a comparative advantage for the manufacturing sector. Electricity produced in NWFP is sold at average rate rather than marginal cost, thus negating its comparative advantage.
NWFP has a diversity of gem stones, metallic and non metallic industrial minerals. With further detailed investigation this potential can be brought up to the level of industrial exploitation.
47% of the NWFP labour force is employed in agriculture, livestock, diary, forestry and fisheries. These sectors have a large employment potential. There is enough scope to develop high value added crops like fruits, olive cultivation, edible oil, tea and floriculture.
The developments in agriculture and the other sectors can benefit, if schemes for micro-credit are introduced for implementation through the SRSP and other similar rural support NGOs.
NWFP has good potential in the tourism sector, both scenic and archaeological tourism. This can be linked to the provinces biodiversity to generate activity in this sector.
Keeping the above potential in mind small and medium enterprises can be developed, if given the proper policy and incentive frame work. To generate growth NWFP needs to adopt tertiary education which promotes telephony, internet infrastructure and easy registration of patents.
Comprehensive poverty reduction strategy: In order to deal with poverty the provincial government has drawn a provincial strategy. This route has been adopted in line with Pakistan‘s commitment to achieve the Millennium Development Goals 2000, which were agreed at the UN general assembly. The following are the six main pillars of this strategy.
Governance reforms for an efficient, accountable, and service oriented civil service.

Annex 3 FINAL
K&P, Consultancy Services, Peshawar.
48
Reforms to improve service delivery in key sectors (especially basic social services) fiscal and financial management.
A medium term budgetary framework (MTBF), to enhance effectiveness and accountability of expenditure, and strengthen resource mobilization.
Promote sustainable private sector development to accelerate economic growth.
Addressing vulnerability to shocks.
Removing gender disparities.
In order to obtain the budgetary space required for structural reform NWFP government is supported by a Structural Adjustment Credit from the World Bank aims to improve service delivery in education, health & social services. Lately the bank has indicated a long term commitment by taking steps for budgetary support assistance to NWFP, through a Development Policy Credit. In this context the World Bank has recently completed the North West Frontier Province Economic Report, issued in Dec 2005.
The project: In order to implement the MDGs the government of Pakistan developed a comprehensive Poverty Reduction Strategy Paper with the acronym PRSP. In line with the federal government, the provinces of Pakistan also developed their Poverty Reduction Strategies. NWFP with the support of UNICEF prepared a provincial PRSP, which was approved by the NWFP cabinet in August 2004. A review of the provincial PRSP indicates that important sectors like tourism, housing, industries, forestry, wild life, livestock, fisheries, environment and gender issues were not examined. This is a weakness which needed to be addressed for the formulation of a comprehensive poverty reduction strategy. It is conjectured that the linkage between MDGs and PRSP has not been clearly identified and incorporated in the PRSP. In order to bridge these gaps, the provincial government has desired to review and strengthen the PRSP. In order to achieve the above objectives, the Planning and Development Department, Government of NWFP in collaboration with IUCN (PSNP programme) has decided to refine the PRSP under the following Terms of Reference.
Review the Provincial PRSP and identify gaps and relevant sectors that have been
overlooked in its formulation;
Monetize the cost of all actions/initiatives at percent and rolling basis in order to provide a clear picture of the resource requirement for implementing the programme over the next five years i.e 2005/06 to 2010/2011.
Incorporate the likely potentials of economic development sectors like, tourism, housing, industries, private sector development and natural resources for their significance in elevating poverty in the province.
Review the MDGs and to identify relationship between MDGs and provincial PRSP indicators leading to implementation of MDGs at provincial level.
Incorporating Environment and Gender in PRSP as cross cutting theme that clearly demonstrate the interdependency of both sectors with poverty in the over all context of
Annex 3 FINAL
K&P, Consultancy Services, Peshawar.
49
livelihood improvement as well as establishing linkage between the root cause of poverty and the natural resources management arid the role of women in the existing NRM practices.
Indicate the missing links between the national and provincial PRSP and capture the impact of MTDF 2005-10 and devise a mechanism for linking them
Formulate refine version of the Provincial PRSP in the light of the above mentioned tasks so that it represent a Provincial Mid Term Development Plan up to 2010.
Any other task relevant to the above work.
Consultants Interpretation of Terms of References: The consultant understands that in order to achieve the TOR the following tasks need to be undertaken.
NWFP, like other provinces is following a poverty reduction strategy based upon the
Millennium Development Goals. To prioritize interventions in the most appropriate areas, a provincial reform strategy has been crafted. Other budgetary reforms based on the requirements of a mid term budgetary framework, which prioritizes and links expenditure with the PRSP is in place. The study will review the institutional framework of the approach so far within the above TORs.
Study & review of the differences b/w Federal and Provincial PRSP
Review of the Provincial PRSP with the view to finding gaps regarding the sectors mentioned in the objective
Examine the WB Economic Report on NWFP with a view to ascertaining potential conflicts if any between the Federal / Provincial PRSP
Examine the MDGs, MTPF & over-arching programmatic themes like Gender, Environment & NRM, with the view to ascertaining whether the PRSP reflects the sectoral concerns.
Examine environment impacting sectors like forestry, wild life, fisheries and agriculture, to see whether they reflect environment concerns. Review the ADP & other policy papers issued by various bodies to find out whether they fall within the outcomes of the MTBF.
To find out what are the GOP and NWFP policies on Environment & NRM?
Whether ERRA / Provincial ERRA have sensitized earthquake development into poverty reduction?
Examine the potential of the listed sectors in alleviating poverty
Examine linkages and where deficient or missing, recommend integration of the MDG and the PRSP
Explore the linkages between Gender, Environment & NRM policies with poverty, (Perhaps defining a new role for IUCN in the area of poverty reduction)
Examine the Strategic Directions to Achieve Vision 2030, issued by the Planning Commission, GOP, 2006 and to see the fit with the PRSP/Poverty Reduction Strategy
To identify linkages between poverty, vulnerability and exclusion in the context of the strategy under execution.

Annex 4 FINAL
K&P, Consultancy Services, Peshawar.
50
Annex 4 : List of organization interviewed
Mr. Waqar Mahsud (Special Secretary) Prime Minister Secretariat Mr. Zia ur Rehman, (Secretary Finance), Govt of NWFP Mr. Aurangzeb Haq (Special Secretary Finance), Govt of NWFP Mr. Ahmed Hassan (SAC Cell), Dept of Finance), GOP Ms. Fareeha Senior Economist (Finance Department Main Asim Ismail Chief Economic Analyst (P&D, E.A Section Mr. Zainullah Khan (Add secretary finance) Ms. Bushra Rehman (Finance Department, Project Coordinator) Mr. Shuja ur Rehman (Head, Sarhad IUCN) Mr. Hameed Hasan (coordinator, governance Sarhad IUCN Office) Mr. Sheikh Murtaza Ahmad (Project Coordinator UNDP Islamabad) Dr. Pervez Tahir (Chief Economist) Mr. Ifthikhar Khan (Controller General Accounts) Mr. Ahmed Rasul Bangish (Accountant General NWFP) Ms. Esther Haldiman, (International Cooperation) Mr. Abdul Rasheed, (Project Director, Devolution Support Unit NWFP) Conferences / meeting attended Pakistan Development Forum Islamabad National Tripartite Forum on Employment and Skills, Islamabad 25th, 26th April 2006, NWFP Development Forum Peshawar. Meeting of steering committee of PRSP

Annex 5 FINAL
K&P, Consultancy Services, Peshawar.
51
Annex 5: Principles of making PRSP
1. PRSP is a national development strategy and not a poverty strategy alone 2. It is a long term vision broken up into shorter medium term parts 3. MDGs will be the core element of a long term vision 4. It is based on integrated plans which use bottom up instead of top down planning. 5. All externally financed project will be adequately funded by a MTFF and linked to the
budget 6. The PRSP must be owned by a country by incorporating it into its constitutional, legal,
institutional and community structures 7. It must be based on stakeholder consultation through poverty diagnostic 8. It must be aligned with international commitments and obligations

Annex 6 FINAL
K&P, Consultancy Services, Peshawar.
52
Annex 6: Household livelihood security analysis framework72

Annex 7 FINAL
K&P, Consultancy Services, Peshawar.
53
Annex 7 : Pictograph of main reforms effects under 73

Annex 8 FINAL
K&P, Consultancy Services, Peshawar.
54
Annex 8: Progress in NWFP toward key Millennium Development Goals (MDGs), 2003
74

Annex 9 FINAL
K&P, Consultancy Services, Peshawar.
55
Annex 9: Alignment under the Paris Declaration

Annex 10 FINAL
K&P, Consultancy Services, Peshawar.
56
Annex 10: NWFP budget at a glance 75
(Rs. in million)
Classification Budget 2004-05
Revised 2004-05
Budget 2005-06
NON DEVELOPMENT BUDGET
Current Revenue Receipts 46272.221 45265.555 58352.258
Federal Tax Assignment 27761.579 28302.680 33159.861
G.S.T 9Provincial0 406.308 392.764 419.851
Additionally of 2.5% GST 1225.486 1411.189 1783.734
Other Grants / subvention 4500.000 4500.000 5000.000
Grant from the Federal Government … 5000.000
Net Hydel Profits 8000.000 6000.000 8000.000
Royalty on Crude Oil 187.765 296.915 214.684
Royalty on Natural Gas 117.779 126.334 253.850
Gas Dev: surcharge 51.529 53.423 65.142
Excise duty on Natural Gas 24.500 25.970
Provincial Receipts 4021.775 4157.750 4474.166
Likely availability of Profits arrears 10000.000 12000.000 *10000.000
Current Revenue Expenditure (A) 42650.000 42650.000 51062.000
Surplus (+) / Deficit (-) 3622.221 2615.555 7290.258
Current Capital Receipts
SAC Loan-III (World Bank) 5232.000 …. 5232.000
Current Capital Expenditure
Repayment of CDL (Prematurely) 2100.000 … 2100.000
Surplus (+) / Deficit (-) 3132.000 … 3132.000
Net Surplus (+) / Deficit (-) 6754.221 10422.258
DEVELOPMENT BUDGET
RECEIPTS
Provincial contribution 6754.221 2615.555 10422.258
Japanese Grant 11.5000 11.500 11.500
Extra Budgetary Assistance 1082.447 3251.564 **1979.207
Special Federal Dev: Grant 2709.172 6846.338 1241.315
Foreign Project Assistance 5637.685 3135.690 6845.900
Agriculture Sector Programme-II (ASPL) .. .. 488.320
Total ADP Funding 16195.025 15860.647 20988.500
EXPENDITURE
ADP (Provincial0 8500.000 8500.000 11200.000
Special Funded Program) **1082.447 3251.564 **1979.207
Foreign Project Assistance 5649.185 3135.690 6845.900
ADP 963.393 973.393 693.393
Total Expenditure 16195.025 15860.647 20988.500

Annex 11 FINAL
K&P, Consultancy Services, Peshawar.
57
Annex 11: Example of resource diversion
The framers of the PRSP recognize the need for a disciplined approach in order to tackle poverty.
76 This advice is also available in the NWFP Provincial Reform
Programme-1 and NWFP Provincial Reform Programme-2. It is recognized that fiscal and expenditure reform are essential for implementing the reform strategy. Improvement in fiscal management and accountability issues are recognized as crucial for NWFP government reform programme. The powerful contractor lobby has secured a revision of the CSR to 90% above the 1999 rates; this huge jump of 42% alone is projected to cost an additional Rs. 5.5 billion in less than three years. In this context there are also other contractor related costs, which will denude the NWFP resources.
77
The government has announced pay increases during the current financial year which will add an additional liability of Rs. 5 billion annually. On the development side there are certain programmes of questionable merit which are included in the ADP. Their deletion would save about Rs. 2.5 billion. Besides, during the FY 2004-05, new jobs in the police and other departments were created increasing liabilities in the long term. Table below indicates the prominent current expenditure increases;
Creation of additional posts
No Description Financial Implication per year
1 2500 additional posts for the province w.e.f 1-7-2004
Rs. 117,220,960
2 Creation of 10 posts for Women Sport Directorate w.e.f 1-7-2004
Rs. 1.7 million
3 Creation of 248 additional posts for Jail Department, w.e.f 2004-05
Rs. 9.8 million
4 Creation of 13 new posts in 1st phase for Women
Medical College, Peshawar & allocation of development funds w.e.f 2005-06
Rs. 38 million
2 161 posts for seven police stations, Bannu w.e.f 1-7-05
Rs. 7,827,000
3 56 police posts for Gomal university D.I.Khan w.e.f 1-7-2005
Rs. 3,655,000
Total additional liability in pays etc per year minus other liabilities
178,202,960
Source: White Paper 2005-06 & other documents of Govt of NWFP
It is apparent that the fight against poverty is sufficiently articulated, yet its implementation leaves room for improvement.

Annex 12 FINAL
K&P, Consultancy Services, Peshawar.
58
Annex 12 : Pakistan Millennium Development Goals & Targets 78
Goal 1: Eradicate Extreme Poverty and Hunger
Halve, between 1990 and 2015, the proportion of people whose income is less than a dollar a day
Proportion of population below the calorie based food pius non- food national poverty line
Halve, between 1990 and 2015, the proportion of people who suffer from hunger
Prevalence of underweight children under-five years of age
Proportion of population below minimum level of dietary energy consumption
Goal 2: Achieve Universal Primary Education
Ensure that, by 2015, children everywhere, boys and girls alike, will be able to complete a full course of primary schooling
Net primary enrolment ratio
Completion/survival rate to grade 5
Literacy rate
Goal 3: Promote Gender Equality and Empower Women
Eliminate gender disparity in primary and secondary education preferably by 2005 and to all levels of education no later than 2015
Gender Parity Index (GPI) for primary, secondary and tertiary education
Youth literacy GPI
Share of women in wage employment in the non-agricultural sector
Proportion of seats held by women in National Assembly and Senate, provincial assemblies and local councils
Goal 4: Reduce Child Mortality
Reduce by two thirds. between 1990 and 2015, the under-five mortality rate
Under-us e mortality rate
Infant mortality rate
Proportion of fully immunised children aged 12-23 months
Proportion of children under 1 year immunised against measles
Proportion of children under five who suffered from diarrhoea in the last 30 days
Lady Health Workers‘ coverage of target population
Goal 5: Improve Meternal Health
Reduce by three-quarters, between 1990 and 2015, the maternal mortality ratio
Maternal mortality ratio
Proportion of births attended by skilled birth attendants
Contraceptive prevalence rate
Total fertility rate
Proportion of women 15-49 years who had given birth during last 3 years, and made at least one antenatal care consultation
Goal 6: Combat HIV/AIDS, Malaria and Other Diseases
Have halted by 2015 and begun to reverse the spread of HIV/AIDS
HIV prevalence among 15-24 year old pregnant women
HIV prevalence among vulnerable groups (eg., active sex workers)
Have halted by 2015 and begun to reverse the incidence of malaria and
Proportion of population in malaria risk areas using effective malaria prevention and treatment

Annex 12 FINAL
K&P, Consultancy Services, Peshawar.
59
other major diseases measures
Incidence of tuberculosis per 100,000 population
Proportion of TB cases detected and cured under Directly Observed Treatment Short Course (DOTS)
Goal 7: Ensure Environmental Sustainability
Integrate the principles of sustainable development into country policies and programmes and reverse the loss of environmental resources
Forest cover including state-owned and private forest and farmlands
Land area protected for the conservation of wildlife
GDP per unit of energy use (as a proxy for energy efficiency)
No. of vehicles using CNG fuel
Sulphur content in high speed diesel (as a proxy for ambient air quality)
Halve, by 2015, the proportion of people without sustainable access to safe drinking water and basic sanitation
Proportion of population with sustainable access to an improved water source, urban and rural
Proportion of urban and rural population with access to improved sanitation
Have achieved, by 2020, a significant improvement in the lives of at least 100 million slum dwellers
Proportion of katchi abadis (slums) regularized.
Goal 8: Develop Global Partnership for Development
Develop further an open, rule based, predictable, non discriminatory trading and financial system
Deal comprehensively with the debt problems of developing countries through national and international measures irs order to make debt sustainable in the long run
Market Access
Debt Sustainability
ODA Assistance
In cooperation with developing countries, develop and implement strategies for decent and productive work for youth.
Unemployment rate of young people aged 15-24 years each sex and total
In cooperation with pharmaceutical companies, provide access to affordable essential drugs in developing countries
Proportion of population with access to affordable essential drugs on a sustainable basis
In cooperation with private sector , make available the benefits of new technologies, especially information and communications
Telephone lines and cellular subscribers per 100 populations.
Personal computers in use per 100 population and internet users per 100 population
* Target 13 and 14 relate to land-locked countries and island economies. UN indicators 33-44 for targets 12-15 assess the three dimensions i.e., market access, debt sustainability and ODA assistance.
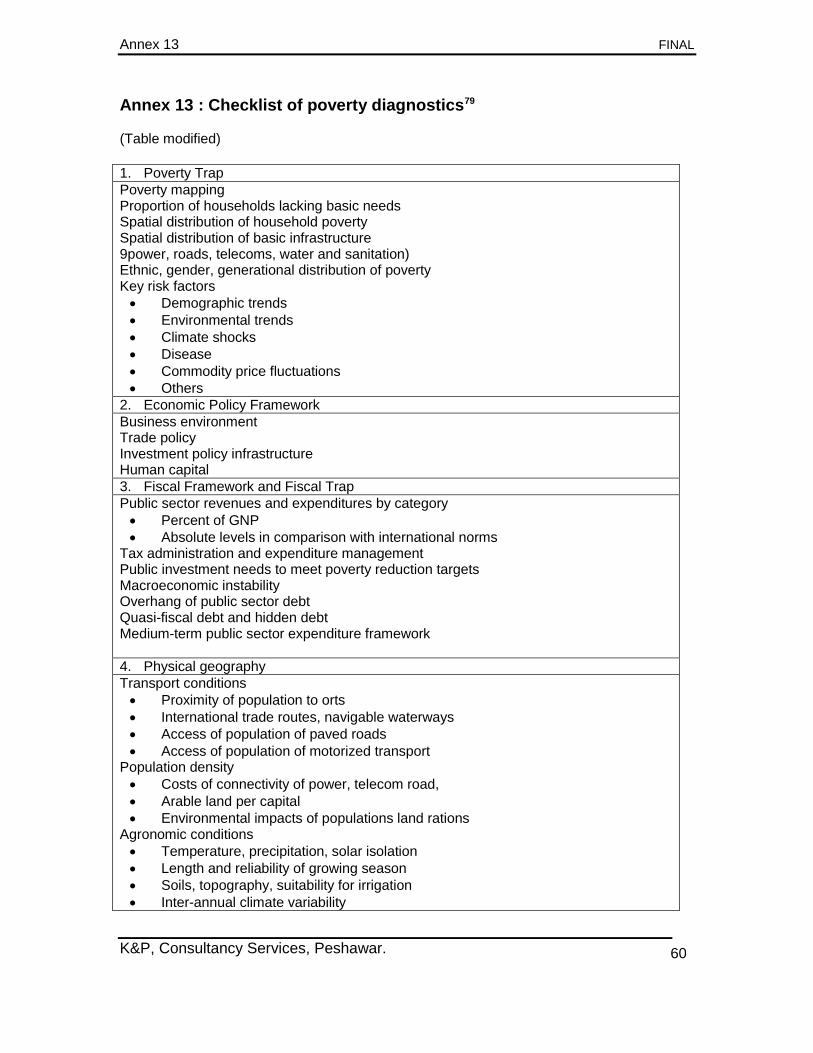
Annex 13 FINAL
K&P, Consultancy Services, Peshawar.
60
Annex 13 : Checklist of poverty diagnostics79
(Table modified)
1. Poverty Trap
Poverty mapping Proportion of households lacking basic needs Spatial distribution of household poverty Spatial distribution of basic infrastructure 9power, roads, telecoms, water and sanitation) Ethnic, gender, generational distribution of poverty Key risk factors
Demographic trends
Environmental trends
Climate shocks
Disease
Commodity price fluctuations
Others
2. Economic Policy Framework
Business environment Trade policy Investment policy infrastructure Human capital
3. Fiscal Framework and Fiscal Trap
Public sector revenues and expenditures by category
Percent of GNP
Absolute levels in comparison with international norms Tax administration and expenditure management Public investment needs to meet poverty reduction targets Macroeconomic instability Overhang of public sector debt Quasi-fiscal debt and hidden debt Medium-term public sector expenditure framework
4. Physical geography
Transport conditions
Proximity of population to orts
International trade routes, navigable waterways
Access of population of paved roads
Access of population of motorized transport Population density
Costs of connectivity of power, telecom road,
Arable land per capital
Environmental impacts of populations land rations Agronomic conditions
Temperature, precipitation, solar isolation
Length and reliability of growing season
Soils, topography, suitability for irrigation
Inter-annual climate variability

Annex 13 FINAL
K&P, Consultancy Services, Peshawar.
61
Drought
long-term trends in climate patterns Disease ecology
human diseases
plant diseases and pests
animals diseases Natural calamities
Earthquake
Floods
Landslides
Fire
5. Governance pattern and failure
Civil and political rights Public management systems Decentralization and fiscal federalism Corruption patterns and intensity Political succession and longevity Internal violence and security Cross-border violence and security Ethnic, religious, and other cultural divisions
6. Cultural barriers
Gender relations Ethnic an religious divisions diaspora
7. Geopolitics
International security relations Cross-border security threats
War
Terrorism
Refugees International sanctions Trade barriers Participation in regional and international groups

Annex 14 FINAL
K&P, Consultancy Services, Peshawar.
62
Annex 14: Unspent balances of 2004-05 80
(Rs in millions)
DERA 651.210 Education Sector Reforms 12.600 Police Performance 0.001 DTF 113.000 EPI 2.973 NPI 100.000 Total (A) 879.784 Extra Budgetary Grant Access to Justice Programme 610.400 Police 0.023 Population Welfare 479.000 DSP0 10.000 Total (B) 1099.423 G. Total (A+B) 1979.207

Annex 15 FINAL
K&P, Consultancy Services, Peshawar.
63
Annex 15: Prominent inequality- sensitive factors81
(Table modified)
Provincial autonomy, for aligning the policies of all governments
National Finance Commission for distribution of resources
Coordination through National Economic Council (NEC) for programme alignment
and expenditure priority
Devolution to districts, for improvement of services and targeting poverty
Coercive means, including weapons, jails, and organized specialists in violence
Labour, especially skilled and / or effectively coordinated labour
Animals, especially domesticated food – and / or work producing animals
Land, including natural resources located in and upon it and land rights.
Commitment- maintaining institutions such as religious sects, kinship systems, and
trade diasporas, community organizations.
Machines, especially machines that convert raw material, produce goods or service,
and transport persons, goods, services, or information
Financial capital- transferable and fungible means of acquiring property rights
Information, especially information that facilitates profitable, safe, or coordinated
action
Media that disseminate such information
Scientific-technical knowledge, especially knowledge that facilitates intervention – for
good or evil – human welfare

Annex 16 FINAL
K&P, Consultancy Services, Peshawar.
64
Annex 16: The coming energy crises82

Annex 17 FINAL
K&P, Consultancy Services, Peshawar.
65
Annex 17: Comprehensive Development Framework implementation 200383

Annex 18 FINAL
K&P, Consultancy Services, Peshawar.
66
Annex 18: Study on disposal of state land in NWFP
In 2002, 16,000 kanals of prime state land in D.I.Khan district, which has abject poverty,
84
was allotted at throw away prices by evicting the sitting tenants, who had been cultivating the land since generations. Each kanal can easily fetch between Rs. 12,000 – 16,000 in the market.
85
The average price of land sold was Rs. 375 per kanal. An allotee obtained 25 kanals of land in village Nivela, subdivision of Paroa, D.I Khan, and within two months of its allotment in 2005, sold it for Rs. 5.5 million.
86
The land became priceless, due to the construction of the CRBC canal in D.I.Khan; according to calculations a piece of 100 kanal of land can on a average produce sugarcane and other crops, whose annual value will be Rs. 800,000. If each peasant family was allotted 100 kanals
87 of land, it could provide productive asset to at least 1600 families. With
an average family size of 7.54 per family (the average for NWFP), it will improve the lives of 12064 persons. Besides, savings from the land will generate a multiplier effect leading to more investment, productivity and improvement of many lives then the derivation of benefits by the few. In this case the state lost because it could have obtained revenue; the peasants lost because their lives were made more vulnerable and they became disempowered.

Annex 19 FINAL
K&P, Consultancy Services, Peshawar.
67
Annex 19: Division between public and private sector roles 88
Service
Main Type of Good
Main Delivery Mechanism Main Financing Mechanism
Public Private Public Private
Farm advisory services (generic)
Public Yes Yes, if contracted Yes No
Farm advisory services (farm specific) Private Yes Yes, preferred
Yes, for small farmers and with co-financing
Yes, preferred
Farmer training Toll Yes Yes Yes Yes
Integrated pest management advice
Public Yes Yes, if contracted Yes No
Market price information (individualized service)
Toll No Yes No Yes
Market price information 9mass media)
Public Yes Yes, preferred Yes Yes
Environmental conservation information services
Public Yes Yes, Preferred Yes No
Irrigation water management advice
Common pool
Yes Yes, if contracted Preferred
Yes Yes, if co-financed
Farmer organization development assistance
Common pool
Yes Yes Yes Yes
Advice on control of major contagious diseases
Pubic Yes No Yes No
Product quality certification for export markets
Private Yes Yes No Yes, preferred
Product quality certification of inputs
Private Yes Yes Yes Yes, preferred

MDGs Tables FINAL
K&P, Consultancy Services, Peshawar.
68
Table 6 : 15 MDG Targets which will be met by NWFP89
Target No Indicator Indicator No
Halve, between 19901 and 2015, the proportion of people who suffer from hunger (%)
2 Prevalence of underweight children under 5 of those entering school
1
Ensure that by 2015, children everywhere, boys and girls alike, will be able to complete a full course of primary schooling
3 Completion/survival rate to grade 5 (5) ================== Literacy Rate (%)
2 3
Eliminate gender disparity in primary and secondary education by 2015 and to all levels of education not later than 2015
4 Proportion of seats held by women in National Parliament
4
Reduce by two-thirds, between 1990 and 2015, the under-five mortality rate
5 Under Five Mortality =================== Infant Mortality Rate =================== Proportion of fully immunized children 12-23 months =================== Proportion of under 1 year children immunized against measles =================== Proportion of children under five who suffered from diarrhoea in the last 30 days and received ORT
1 2 3 4 5
Reduce by three-quarters, between 1990 and 2015, the Maternal Mortality Rate
6 Proportion of women 15-49 years of age who had given birth during last 3 years and made at least 1 antenatal consultation
5
Have halted by 2015 and begun to reverse, the incidence of Malaria and other major diseases
8 Incidence of Tuberculosis per 100,000 population =================== Proportion of TB cases detected and cured under DOTS (Direct
1 2

MDGs Tables FINAL
K&P, Consultancy Services, Peshawar.
69
Observed Treatment Short Course)
Integrate the principles of sustainable development into country policies and programmes and reverse the loss of environmental resources
9 Forest cover including state owned and private forest and farmlands
1
Halve, by 2015, the proportion of people without sustainable access to safe drinking water and basic sanitation
10 Proportion of population (urban and rural) with sustainable access to a safe (improved) water source ===================
Proportion of population (urban and rural) with access to sanitation
1 2
Table 7 : 2 MDG targets which can be met by NWFP
Target No Indicator Indicator No
Eliminate gender disparity in primary and secondary education by 2005 and to all levels of education no later than 2015
4 Youth Literacy CPI
2
Reduce by three-quarters, between 1990 and 2015, the maternal mortality rate
6 Total Fertility Rate Proportion of women 15-49 years who had given birth during last 3 years and made at least one antenatal care consultation
3

MDGs Tables FINAL
K&P, Consultancy Services, Peshawar.
70
Table 8 : 14 MDG targets whose achievement will be difficult
Target No Indicator Indicator No
Halve, between 1990 and 2015, the proportion of people below the poverty line (%)
1 Proportion of population below the calorie based food plus non-food poverty line
1
Halve, between 1990-1 and 2015, the proportion of people who suffer from hunger (%)
2 Proportion of population below minimum level of dietary energy consumption
2
Ensure that by 2015, children everywhere, boys and girls alike, will be able to complete a full course of primary schooling
3 Net Primary Enrolment Ratio (%)
1
Eliminate gender disparity in primary and secondary education by 2005 and to all levels of education not later than 2015
4 Gender parity Index (GPI) for Primary, Secondary & Tertiary Education =================== Share of women in wage employment in the non-agricultural sector
1 3
Reduce by two-thirds, between 1990 and 2015, the under-five mortality rate
5 Lady Health Workers coverage of target population
6
Reduce by three-quarters, between 1990 and 2015, the maternal mortality rate
6 Maternal Mortality Rate ================== Proportion of births attended by skilled birth attendants ==================== Contraceptive Prevalence Rate
1 2 4
Halve helted by 2015 and begun to reverse the spread of HIV / Aids.
7 HIV prevalence among 15-24 year old pregnant women (%) ==================== HIV prevalence among vulnerable group (e.g., active sexual workers) (%)
1 2
Have halted by 2015 and begun to reverse, the incidence of Malaria and other major diseases
8 The NWFP government has not set any indicator for malaria. There is danger of relapse
3 (added)
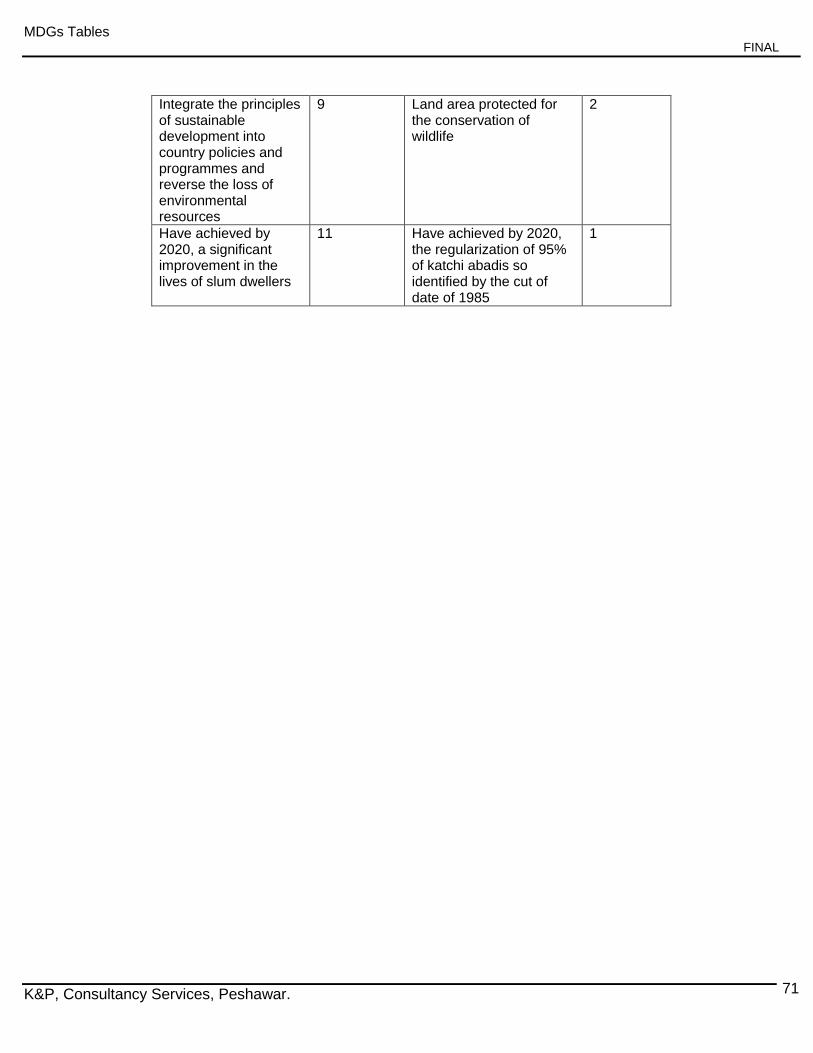
MDGs Tables FINAL
K&P, Consultancy Services, Peshawar.
71
Integrate the principles of sustainable development into country policies and programmes and reverse the loss of environmental resources
9 Land area protected for the conservation of wildlife
2
Have achieved by 2020, a significant improvement in the lives of slum dwellers
11 Have achieved by 2020, the regularization of 95% of katchi abadis so identified by the cut of date of 1985
1

MDGs Tables FINAL
K&P, Consultancy Services, Peshawar. 72
Table 9: MDG Human Development Index of NWFP Districts (2005)
Education Health Environment NWFP MDG Ranking (2005)
MICS (2001) Ranking
Change
District Score (GER)
Score (GPI)
Score (Literacy)
Score (IMR)
Score (Immunization)
Score (LHW
Coverage) Score
(Forest) Score
(DrinkingWater) Score
(Sanitation) Score Rank Col 13 Col 14
A/Abad 0.3 2 0.3 5 2.0 0.8 1.2 2.5 1.1 14 1 2 1
Haripur 0.5 1 0.5 3 5.3 1.0 1.8 2.0 0.8 15 2 1 -1
Malakand 2.8 4 2.0 1 1.8 1.5 3.2 0.5 2.7 19 3 3 0
Peshawar 6.0 4 1.8 2 1.5 4.5 5.1 1.5 0.5 26 4 6 2
Chitral 3.0 11 1.3 6 0.3 0.3 1.4 3.5 0.3 27 5 10 5
Mardan 2.5 3 2.5 3 0.8 2.3 3.9 8.0 2.4 27 6 8 2
Swabi 2.0 1 2.8 9 4.8 3.0 3.0 1.0 3.5 30 7 12 5
Nowshera 4.3 2 1.0 7 4.5 3.5 3.7 5.5 1.4 32 8 7 -1
L Dir 0.8 11 4.3 4 2.8 2.5 0.7 4.5 4.3 34 9 14 5
Charsadda 3.8 8 3.3 2 1.3 1.3 5.5 5.0 4.9 34 10 17 7
Battagram 1.8 5 5.5 4 1.0 5.0 0.2 10.0 5.7 38 11 21 10
Mansehra 1.3 9 2.3 6 4.3 3.8 0.5 8.5 3.8 38 12 5 -7
Kohat 3.3 6 0.8 7 5.0 4.3 4.4 7.0 2.2 39 13 4 -9
Tank 4.5 6 4.8 10 4.0 2.8 2.3 4.0 4.1 42 14 20 6
L Marwat 4.8 3 4.0 5 2.5 2.0 5.3 9.5 5.9 42 15 19 4
Hangu 5.3 8 3.8 8 5.5 5.3 3.5 3.0 1.9 43 16 11 -5
Swat 4.0 5 4.5 8 5.8 1.8 2.5 10.5 1.6 44 17 15 -2
Karak 1.5 9 1.5 10 6.0 0.5 4.1 6.0 5.1 44 18 9 -9
Shangla 5.5 12 5.8 1 0.5 4.8 2.1 12.0 3.0 46 19 23 4
Bannu 5.8 7 3.0 9 3.0 3.3 4.6 6.5 4.6 46 20 18 -2
DIKhan 5.0 7 3.5 12 3.5 4.0 4.8 9.0 3.2 51 21 16 -5
Buner 3.5 10 5.0 11 2.3 5.5 2.8 7.5 5.4 53 22 13 -9
U Dir 1.0 10 5.3 11 3.8 5.8 0.9 11.5 6.2 54 23 22 -1
Kohistan 2.3 12 6.0 12 3.3 6.0 1.6 11.0 6.5 60 24 24 0

MDGs Tables FINAL
K&P, Consultancy Services, Peshawar. 73
Table 10 : District Road & Housing Allocations 2001-05
Allocation in Million
S. No. Name of District 2001-02 2002-03 2003-04 2004-05 Grand Total Ranks MDG Rank
1 Mardan 75.976 339.998 415.974 27.550 859.498 1 6
2 Kohat 72.839 332.317 405.156 20.208 830.520 2 13
3 Peshawar 70.251 208.198 278.449 39.505 596.403 3 4
4 D.I.Khan 82.142 10.682 92.824 172.599 358.247 4 21
5 Lower Dir 30.472 106.152 136.624 80.983 354.231 5 9
6 Bannu 34.422 125.26 159.682 32.095 351.459 6 20
7 Karak 54.765 54.674 109.439 84.415 303.293 7 18
8 Charsadda 85.137 60.013 145.150 11.744 302.044 8 11
9 Haripur 82.509 34.56 117.069 63.419 297.557 9 2
10 Nowshera 61.611 62.56 124.171 45.394 293.736 10 8
11 Swat 112.946 0 112.946 27.100 252.992 11 17
12 Battagram 39.656 0 39.656 166.959 246.271 12 11
13 Swabi 34.971 51.523 86.494 49.364 222.352 13 7
14 Lakki 41.939 52.56 94.499 18.353 207.351 14 15
15 Buner 38.415 26 64.415 63.943 192.773 15 22
16 Abbottabad 47.857 14.56 62.417 65.160 189.994 16 1
17 Mansehra 42.699 39.607 82.306 14.476 179.088 17 12
18 Shangla 1.218 29.36 30.578 112.980 174.136 18 19
19 Tank 18.261 27.073 45.334 66.089 156.757 19 14
20 Chitral 27.368 2.56 29.928 88.596 148.452 20 5
21 Kohistan 49.77 0 49.770 47.557 147.097 21 24
22 Hangu 0 52.8 52.800 29.437 135.037 22 16
23 Uppder Dir 0 29.36 29.360 55.325 114.045 23 23
24 Malakand 7.942 26.8 34.742 20.630 90.114 24 3

MDGs Tables FINAL
K&P, Consultancy Services, Peshawar. 73
Note:
Please don’t print the remaining pages
These are for programming purposes. If you remove them you will not able to print annexure numbers.
Annex 1 : Poverty Policy Reform Matrix
Annex 2 : TORs
Annex 3: Final inception report
Annex 4 : List of organization interviewed
Annex 5: Principles of making PRSP
Annex 6: Household livelihood security analysis framework
Annex 7 : Pictograph of main reforms effects under NWFP PRP-1
Annex 8: Progress in NWFP toward key Millennium Development Goals (MDGs), 2003
Annex 9: Alignment under the Paris Declaration
Annex 10: NWFP budget at a glance
Annex 11: Example of resource diversion
Annex 12 : Pakistan Millennium Development Goals & Targets
Annex 13 : Checklist of poverty diagnostics
Annex 14: Unspent balances of 2004-05
Annex 15: Prominent inequality- sensitive factors
Annex 16: The coming energy crises
Annex 17: Comprehensive Development Framework implementation 2003
Annex 18: Study on disposal of state land in NWFP
Annex 19: Division between public and private sector roles

References FINAL
K&P, Consultancy Services, Peshawar.
74
REFERENCES
Section 2: 1 Govt of Pakistan, “Pakistan Economic Survey 2005-06”, Islamabad, 2006,(P. i-iv, 9,11,145-153,60-61)
2 Staff Report , “The News International”, 21
st June, 2006, reports instances of child selling to earn income (P.11)
3 IDA (World Bank), “Second NWFP Structural Adjustment Credit”, Washington, May 26, 2004, (P.2, annex d).
4 Ibid (3)
5 Ibid (3)
6 Ibid (8) , (P.XVII)
7 Government of NWFP, “White Paper 2006-07”, Finance Department, 17
th June 2006, (P.ii, IV-V)
8 The World Bank, “Pakistan NWFP Economic Report, Accelerating Growth & Improving Public Service Delivery in the NWFP:
The Way Forward”, Dec 2005, (P.93-95) 9 Ibid(7), (P.1-2)
10 Ibid (8), (P. 134)
11 Aziz, Khalid, “Provincial Autonomy: A View from NWFP”, Ed Cheema, Pervaiz & Khan, Rashid , Problems and Politics of
Federalism in Pakistan, Islamabad Policy Research Institute, 2006, (P. 32-34)
Section 3 12
Zaidi, S.Akbar, “Globalization & the Creation of Poverty in Pakistan”, The Journal, vol.7 No.1, NIPA Karachi, March 2002. 13
Govt of Pakistan , “Accelerating Economic Growth and Reducing Poverty: The Road Ahead”, PRSP, Secretariat Ministry of
Finance, Dec 2003,(P.1) 14
Sach, Jeffrey, “The End of Poverty, how we can make it happen in our lifetime”, Penguin Books, London, 2005,(P.81-82) 15
Ibid (14), P. 81 16
Ali, Syed Mohammad, “The Politics of Development Aid: Implementation for Pakistan”, http://www.policy.hu/ali/ 17
IDA (World Bank) and IMF, “Joint Staff Assessment of the Poverty Reduction Strategy Paper”, 12/2/2004, Washington, (P.
3,11) 18
Ibid (14), P. 81
Section 4 19
Ibid (13), (P.124) 20
“Chambers, R and Conway, G.R (1992) “Sustainable Rural Livelihoods: Practical Concepts for the 21st century”. Institute for
Development Studies (IDS): Sussex, UK, (P.9) 21
Govt of NWFP, “Provincial Reform Programme 2001-04”, Finance Department, Peshawar, 2001.(P.8-20) 22
Ibid (21), P.57 23
Govt of NWFP, “Provincial Reform Programme, 2001-2004”, Finance Department (P.58) 24
Ibid (23) 25
Ibid (21), annex-II 26
The World Bank, “First NWFP Development Policy Credit,” (P.6-7) 27
Ibid (37), (P.15) 28
Ibid(39), (P.68-84) 29
Ibid (14)(P.247) 30
Wood, Geof & Malik, Abdul, “Sustaining Livelihoods & Overcoming Insecurity” in “Valleys in Transition: Twenty Years
of AKPRSP’s Experience in Northern Pakistan”, Oxford University Press, Karachi, 2006 (PP. 54-119) 31
Steimann, Bernd, “Livelihood Strategies in North-West Pakistan, Results from the Sustainable livelihoods Survey 2004, NWFP,
Pakistan”, Zurich University, April 2005, (P. 21-22, 38), available at www.nccr-north-south.unibe.ch 32
Khan, Mohammad, “Inefficiency continues to mar NWFP development”, The News, 9th June, 2006
33 Govt of Pakistan, “Pakistan Economic Survey 2005-06”, (xv-xvi)
34 The World Bank, “Pakistan Public Expenditure Management, Strategy Issues and Reform Agenda”, Vol 1, Jan 2004, (P. vi)
35 Government of Pakistan, HIES 2001-02, Statistics Division, Islamabad, compare P.1 of table 10 with the same column of the
same table on page 10 . 36
Hussain, Imdad, “Power & poverty”, The Nation, 17th April, 2006.
37 Inayatullah, “UNESCO’s new initiative”, The Nation, 11
th April, 2006
Section 5 38
Ibid (21), (P.25-40, 48-53) 39
Government of NWFP, “NWFP Provincial Reform Programme-II 2005/06 – 2007/08”, Peshawar, May, 2006. 40
Ibid (8), (P. viii – ix) 41
Ibid (26), (Annex B, Pp. 1-13)

References FINAL
K&P, Consultancy Services, Peshawar.
75
Section 6 42
Govt of NWFP, “NWFP Millennium Development Goals Report 2005,” Bureau of Statistics, Planning & Development Dept,
Nov 2006 .
Section 7 43
Govt of Pakistan, “Approach Paper Strategic Directions to Achieve Vision 2030”, Planning Commission, Feb, 2006 44
Ibid (43) 45
McKillop, Andew, and Newman , Shaila. “The Final Energy Crises”, Pluto Books, England, 2005, (P.29-55) 46
Ibid (34), (P. ii) 47
Govt of NWFP and IUCN, “Sarhad Provincial Conservation Strategy”, 1996, Peshawar. 48
The World Bank , “Supporting Development Programs Effectively, Applying the Comprehensive Development Framework
Principle: A Staff Guide”, Washington D.C, Nov 2004 (P.4-25) 49
Govt of Pakistan, “Medium Term budgetary Framework (MTBF), Guideline 2006-07”, Finance Division Budget Wing (MTBF
Secretariat Islamabad) 50
Govt of Pakistan, “Medium Term Budgetary Framework (MTBF), Guidelines 2006-07”, Finance Division, Budget Wing,
(MTBF Secretariat Islamabad), (P.6-10)
Section 8 51
Ibid(39), (P.7) 52
Ibid(39), (P.10) 53
Ibid(39), (P.11) 54
Govt of Pakistan,” Pakistan Millennium Development Goals Report 2005”, Centre for Research on Poverty Reduction and
Income Distribution, Planning Commission of Pakistan, Islamabad, Sep 2005 (P.15) 55
Ibid(54)(P.16) 56
Ibid (8), (P.47) 57
Ibid (49), (P.533-534) 58
Ibid (8), (P.56-57) 59
Ibid (8), (P.95) 60
Govt of Pakistan, “Mainstreaming Environment into the Government of Pakistan’s Poverty Reduction Strategy Papers”, Ministry
of Environment, (P. 8 – 21) 61
Ibid (60), (P.10) 62
Ibid (2),Reported 45 deaths in Kurram Agency over water rights, (P.1) 63
Aziz, Khalid etc, “ In the Balance: Environment and Security in the NWFP”, Feb 2000; IUCN, International Institute of
Sustainable Development, Cowater International INC 64
Coleman, Isobel, “Gender Disparities, Economic Growth and Islamization in Pakistan”, Chapter 6, in edited by Hussain,
Ishrat et al , “Islamization and the Pakistani Economy,” Woodrow Wilson International Center for Scholars, Washington,
D.C, 2004 65
“The Importance of sex”, The Economist, 12th
April, 2006, 66
Ibid (49), (P. 161- 172) 67
Ibid (49), (P. 93 – 96) 68
Ibid (3), (P. 3, 13)
Annex 3 69
Govt of NWFP, “Selected Socio-Economic indicators of NWFP, 2004-2005,” Bureau of Statistics, NWFP, 2005 70
World Bank, NWFP Economic Report, 2005. 71
Govt of NWFP, “Poverty Reduction Strategy Paper,” Planning Department, April 2003.
Annex 6 72
Care, “Household livelihood security assessments, A toolkit for practitioners”, July, 2002
Annex 7 73
Ibid (21)
Annex 8 74
Ibid(8)
Annex 10 75
Ibid(7)
Annex 11 76
Ibid (13).4-6). 77
Aziz, Khalid, “A Report on Policies & Practices in Public Sector Projects in the North West Frontier Province”, a study for the
World Bank, Feb 2005, (P.29-32).

References FINAL
K&P, Consultancy Services, Peshawar.
76
Annex 12 78
Ibid (54), (P.83-85)
Annex 13 79
Ibid (14)
Annex 14 80
Ibid (7)
Annex 15 81
Tilly, Charles, “Poverty and the Politics of Exclusion”, (Paper for World Bank Study: “Moving out of Poverty”), Columbia
University, 2006,[table modified]
Annex 16 82
Ibid (45)
Annex 17 83
The World Bank , “Getting Serious About Meeting MDGs” Report from CDF 2003
Annex 18 84
Govt of NWFP, “NWFP Poverty Reduction Strategy Paper,” Planning & Development Dept, April 2003 (P.11). 85
Ibid (86) 86
Aziz, Khalid, “An Inquiry into Land Distribution in D.I.Khan”, a mimeograph, April 2006. 87
This is the size of subsistence holding defined under the Land Reforms Act
Annex 19 88
Ibid (8), (P.25)
MDGs Tables 89
Ibid(42).