poverty international policy centre for inclusive … event organised by ipc-ig with the support of...
TRANSCRIPT
Poverty Number 25
International Policy Centre for Inclusive GrowthPoverty Practice, Bureau for Development Policy, UNDP
2 International Policy Centre for Inclusive Growth
G U E S TE D I TO R S T his issue of Poverty in Focus brings a set of articles that discuss some of the recent
developments and innovations in the social protection area in developing countries.Most invited authors were presenters at the Policy Dialogue, Expert Workshop and South-SouthLearning Event organised by IPC-IG with the support of AusAID, the Secretariat of Strategic Affairsand the Institute for Applied Economic Research of the Brazilian Government in December 2012.
The workshop was an opportunity to bring together policymakers, researchers and practitionersfrom developing countries as well as representatives from different multilateral organisationsto discuss social protection innovations from three perspectives: a) an informative perspective tofoster and support the dialogue and cooperation between policymakers from different countries;b) an analytical perspective focusing on the evidence of the impact of social protectionprogrammes; and c) a learning perspective in which researchers and policymakers couldstrengthen the learning process and share their thoughts on the knowledge gaps in this area.
Social protection mechanisms in many developing countries have been tested by the food and fuelprice crises and the global financial crisis. Countries that have developed comprehensive socialprotection interventions before the crises seem to have been able to avoid the worst effects.
Social protection programmes were quickly adapted through a variety of mechanisms. In LatinAmerica, Conditional Cash Transfer (CCT) programmes, which were considered by some experts asan inappropriate tool to handle a crisis situation, proved to be a flexible way to expand and smooththe consumption of both traditional and new beneficiaries. Countries such as Mexico, Brazil andChile were able to respond quickly to this challenge with new components to their flagshipprogrammes. In Indonesia, a completely different setting from Latin America, the responsewas through a temporary unconditional cash transfer (BLT) previously used in the 2005–06 fuelsubsidy reform and that was quickly put in place to counteract the effect of the 2008–09 crisis.
Many countries have consolidated several instruments or strategies that allow for broaderinterventions that go beyond the ‘flagship’ programmes. These instruments—specially interlinkedbeneficiary databases and/or single registries for targeted social policies—are powerful tools toimprove intersectoral coordination and national and local-level policy coordination, as shown insome experiences reported in this publication.
Traditional social protection mechanisms such as social pensions and child/family allowancesare gaining ground in many developing countries as part of their national social protection floors.This issue of Poverty in Focus provides an overview of the recent expansion of old-age pensions inAsia and looks more closely at the reforms that are taking place in Thailand and at the povertyand inequality impacts of the Old-age Pension in South Africa.
In Latin America, countries with consolidated social pensions such as Uruguay, Argentina,Chile and Brazil have implemented important reforms in their child/family allowancebenefits to fight child poverty. In Peru financial inclusion of CCT beneficiaries, particularlywomen, has become a central objective of the programmes.
Using a flagship programme and its mechanisms as a way to improve the access of the mostexcluded has become a key concern of many interventions in the regions such as the ‘Brasilwithout extreme poverty’ plan and the Chilean Ethical Family Income—also presented in thisissue. However, the challenge to match an increased demand for social services with their supplyis also highlighted. In India, the JSY programme, which has been successful in stimulatinginstitutional delivery, faces major problems on the supply side.
In Africa, national governments have implemented both social pensions and child grants.A heated debate on the dependency issue has made evidence on the productive impact of socialtransfers a much-needed input to this discussion. Some evidence of positive impacts of socialtransfers at the level of the household and the local economy is also presented in this issue.
The productive dimension of social protection intervention and its growth-friendly features arealso discussed when focusing on its interlinkages with employment. The NREGA in India and EPWPin South Africa are key examples of how recent innovations in public works and employmentguarantee schemes can improve the impact of this much criticised type of intervention.Similarly, a reform of PDS in one India state has helped not only to improve beneficiarycoverage, but also to foster the productive inclusion of smallholder farmers.
We hope you find the reading useful…
by Fábio Veras Soares and Radhika Lal
Poverty in Focus is a regular publication of theInternational Policy Centre for Inclusive Growth (IPC-IG).The purpose of this edition is to document recentinnovations in the area of social protection to foster thepolicy dialogue between policymakers, practitioners andspecialists in the context of South-South learning onSocial Protection interventions. The articles presentedhere summarise the discussions held during the PolicyDialogue, Expert Workshop and South-South LearningEvent promoted by IPC-IG.
Guest EditorsFábio Veras Soares, IPC-IG; Radhika Lal, UNDPand Ryan Higgitt, Queen’s University,Kingston, Canada
Desktop PublishersRoberto Astorino and Rosa Maria Banuth
Copy EditorThe Write Effect Ltd., Oxford, UK
Front page: Comprehensive Social Protection forall is the spirit behind this edition of Poverty in Focus.The images represent the range of interventions, thepeople and the dimensions that are linked to SocialProtection over the lifecycle of people all over theworld. They cover issues from childhood to old age;they link Social Protection to education services, basichealth care and employment; protecting families andindividuals and promoting their social and economicinclusion. Images are from the IPC-IG ‘HumanisingDevelopment’ Global Photography Campaign,Ministry of Social Development and Fight againstHunger, Government of Brazil and the generouscontributions of Fábio Veras Soares.
Editors’ notes: The IPC-IG is grateful to AusAIDfor the financial contribution received to supportthe development of knowledge products that couldcontribute to the implementation of the G20’s SocialProtection commitment. Emphasis is given to theexperiences of low- and middle-income countriesand the innovations that have taken place in theGlobal South. We would like to express our sincereappreciation also to all of the authors for theirgenerous contributions of intellectual inputsand time without monetary remuneration.
IPC-IG is a joint project between the United NationsDevelopment Programme and Brazil to promoteSouth–South cooperation on applied poverty research.It specialises in research-based policy recommendationson how to reduce poverty and inequality. IPC-IG isdirectly linked to the Poverty Group of the Bureaufor Development Policy, UNDP and the Secretariatof Strategic Affairs (SAE) of Government of Brazil.
Interim IPC-IG DirectorJorge Chediek
International Policy Centre for InclusiveGrowth (IPC-IG), Poverty Practice,Bureau for Development Policy, UNDP
SBS, Quadra 1, Bloco J, Ed. BNDES, 13º andar70076-900 Brasilia, DF Brazil
[email protected] www.ipc-undp.org
The views expressed in IPC-IG publications are theauthors’ and not necessarily those of the United NationsDevelopment Programme or the Government of Brazil.
Rights and Permissions – All rights reserved. The text anddata in this publication may be reproduced as long as writtenpermission is obtained from IPC-IG and the source is cited.Reproductions for commercial purposes are forbidden.

Poverty in Focus 3
The long Road to ComprehensiveSocial Protection for Children in Latin America
by Roxana Maurizio,Universidad Nacional de General Sarmiento and CONICET, Argentina
The implementationor expansion of financialsupport for families withchildren in Argentina,Brazil, Chile and Uruguayrepresented an importantstep forward in the fieldof social protection forimpoverished children.
Based on these experiencesthere is consensus that theseprogrammes are welltargeted (despite someexclusion and inclusionerrors) and that theyhave evidenced positiveimpacts with respect tocombating extreme poverty.
The amount and duration ofthe financial support shouldbe consistent with thelong-term objective ofachieving and maintainingsocial inclusion and cohesion.
Recognition in the mid-1990s ofa greater incidence of poverty amongchildren (under 18 years) comparedto other age groups saw severalLatin American countries expand non-contributory cash transfer programmes(conditional cash transfer programmes—CCTs) to households with children.CCTs have gradually become importantmechanisms within social policies andpoverty reduction strategies in almostall countries in Latin America.
The immediate objective of theseprogrammes is to reduce incidencesof poverty and extreme poverty, while,in the long run, breaking the inter-generational transmission of poverty.To this end, prevailing CCT schemes includeconditionalities (or co-responsibilities)related to certain nutrition, educationand health objectives targeted at bothyoung and school-age children.
This article seeks to draw lessons, identifygood practices and discuss advances andfuture challenges in CCT programmestargeting poor children, by analysingexperiences in Argentina, Brazil, Chile andUruguay regarding social protection forfamilies with children. Three questionsare given particular emphasis here:
What exactly has been done in thearea of social protection for children inthese four Latin American countries?
What are the main identifiableimpacts of these policies to date?
What are the future challenges, andthus in what direction should thesecountries move forward?
Recent trends in social protection forchildren in four Latin American countriesThe implementation or expansion offinancial support for families with
children in Argentina, Brazil, Chile andUruguay represented an importantstep forward in the field of socialprotection for impoverished children.
Chile Solidario was launched in 2002 withthe objective of removing impediments tosocial inclusion in Chile. Ten years later, in2012, the Chilean government launchedthe Ethical Family Income (Ingreso ÉticoFamiliar) programme, the specific aimof which, in addition to increasing thecoverage and amount of benefits, wasa more comprehensive conceptualisationof child social protection.
Organised under three ‘pillars’ (dignity,duties and achievements), this newprogramme utilises unconditional andconditional cash transfers and awards;yet at the same time it places particularemphasis on autonomous family incomegeneration through female employmentsubsidies and training programmes(Cechini et al., 2012).
The National Assistance Plan of SocialEmergency (Plan de Atención Nacional ala Emergencia Social—PANES) in Uruguaywas replaced in 2007 by the Equity Plan(Plan de Equidad), which entailed a numberof reforms geared toward providing anetwork of assistance for social integration.
This change entailed a significantimprovement from the introductionof a temporary programme to a moreintegrated and comprehensive strategyto support poverty-stricken families withchildren. This pathway to social inclusionincluded the creation of new pillars, thescaling-up of existing social programmesand the merger of both non-contributoryand contributory family allowances(Amarante and Vigorito, 2012).
Argentina implemented in 2009 a largecash transfer programme for children

4 International Policy Centre for Inclusive Growth
called Universal Child Allowance(Asignación Universal por Hijo), thusextending the coverage of the existingcontributory family allowance programmeto segments of the population thatotherwise had no coverage until then.
This non-contributory programme is anaddition to those already in existencein Argentina —namely, a contributoryfamily allowance and a tax deductionfrom income tax for each child(Bertranou and Maurizio, 2012a; 2012b).
Brazil also has this type of three-tiersystem of cash transfer to householdswith children: the well-known BolsaFamília, a child allowance pillar forformal-sector workers (Salário Familia)and a deduction from Personal IncomeTax for parents with children.
The scope and impact of Bolsa Família(created in 2003) has made it one of themost emblematic projects in the worldin terms of cash transfer programmesfor families with children and adolescents.It reaches out to more than 13 millionpoor families throughout the country.Most recently, in 2012 a new financialsupport programme (Brasil Carinhoso) wasannounced. Its main aim is to cover thepoverty gap for those families includedin Bolsa Família with children under theage of 15 and living in extreme poverty(Soares and de Souza, 2012). In February2013 this benefit was extended to allfamilies in extreme poverty, regardlessof their demographic composition.
Close study of these national experiencesreveals new positive trends from whichit is possible to draw important lessons.First of all, each of these countries hasexpanded the coverage of family supportover the last few years, by introducingnew non-contributory pillars andincreasing the real monetaryvalue of these transfers.
The cases of Chile and Uruguay illustratethe critical importance of integratingdifferent social programmes (education,health, nutrition, employment andhousing) under an umbrella programmeas a means of improving coordination,efficiency, transparency and impacts.In this regard, it is important to mentionthat the implementation of the Equity
Plan in Uruguay was accompanied byreforms in the tax system as well asin health care, which suggests a morecomprehensive strategy for reducingstructural poverty and inequality that goesbeyond the cash transfer programme.
The existence of an unconditionalcash transfer component is particularlyimportant, since it ensures at least aminimum level of income for the mostvulnerable families. This is the case, forinstance, of the ‘dignity’ component of theEthical Family Income programme in Chile.
Finally, coordination betweeninstitutions and agencies is anotherimportant dimension of successfulsocial policies. Some national experiencescan serve as useful examples of inter-agency coordination and the ways suchcoordination can strengthen institutionalcapabilities. In Uruguay, for instance,there is increasing coordination amongdifferent public agencies regardingthe implementation, evaluation andmonitoring of social programmes.Chile exhibits similar dynamics.
Evaluating the impacts of cash transferson social and labour indicatorsBased on these experiences there isconsensus that these programmes arewell targeted (despite some exclusionand inclusion errors) and that theyhave evidenced positive impacts withrespect to combating extreme poverty.
As regards longer-term outcomes,increases in primary school enrolmentrates and a reduction in malnutritionamong beneficiary children have beenobserved; though, it should be said,the effects on secondary schoolattendance seem to be less significant.
The types of transfers outlined here seemto not only lead to an increase in familyincome in poor households but alsoensure some amount of money tosmooth consumption overmacroeconomic or labour fluctuations.
This is of utmost importance, since thepoorest households are the ones thatgenerally have less stable incomes.
In some cases, these transfers also appearto have contributed to eliminating
barriers that once prevented poor peoplefrom undertaking certain productiveactivities, thus they allow beneficiaries toalso increase their autonomous income.They have also permitted an increase inliquidity in the poorest communities,thus favouring trade and developmentin those areas (ECLAC, 2010).
Nevertheless, there is a debate withrespect to the impacts that cash transfersto households with children may haveon the labour behaviour of their adultmembers. Such impacts are related tothe receipt of non-labour incomes, on theone hand, and to the fulfilment ofthe programme’s conditionality, whichlargely fall under the responsibility ofthe mothers, on the other.
The empirical evidence for thesecountries shows, in general, that the‘negative’ impacts on activity in thelabour market, as measured by a lowerparticipation rate or fewer hours of workby the adult population from beneficiaryhouseholds, are, in general, null or verylow. However, a lack of participation inthe labour market should not alwaysbe considered negative. Other factorsshould be taken into account, includingwhich member of the household hasreduced their participation in the labourmarket and the quality of the job theyare giving up.
Towards a comprehensive socialprotection system for childrenin Latin AmericaDespite all the progress achievedregarding social protection for children,the current situation in Argentina, Brazil,Chile and Uruguay requires continuedefforts to consolidate a comprehensivesocial protection system groundedin universal rights.
In particular, the challenge is to design anintegrated and multidimensional systemmade up of different pillars. Such asystem should be closely related withproductive, distributive and labourpolicies in a macroeconomic frameworkthat promotes growth by, among otherthings, creating decent work.
In this regard, one of the foremostlessons arising from these experiences isthat an inclusive public policy for children

Poverty in Focus 5
cannot pivot on cash transfers exclusively,and thus countries must move forwardtowards greater integration with otherprogrammes aimed at tackling boththe social risks and the needs of humancapital faced by poverty-boundhouseholds with children.There are different dimensionswhere advancement is imperative.
The first is the necessity of going beyondextreme poverty. Despite the growingcoverage of the existing programmes,they remain targeted at extremely poorfamilies. Therefore, it is fundamental toreach children who are not yet covered,to move forward from ‘anti-povertyprogrammes’ to the universalisation ofsocial protection rights for all children.
The second dimension has to do withintegrating the different pillars of socialprotection. Greater integration amongsub-systems of cash transfers for children(contributory, non- contributory andchild tax credit) is crucial, but so is greaterintegration within and between theother existing programmes aimed attackling social risks. This would includeeducation, nutrition and health policiestargeting children, and also productiveand employment programmes for adultsin households with children. All of theseare essential to support their humanand economic capabilities.
Thirdly, greater importance must be placedon removing structural barriers thatcreate social exclusion. The realisation offull social inclusion of vulnerable groupsrequires reducing segmentation anddualism in the quality of the supplyof basic services for targeted andnon-targeted populations. Dimensionssuch as child care, gender inequalityand child labour should also beconsidered a priority.
The amount and duration of the financialsupport should be consistent with thelong-term objective of achieving andmaintaining social inclusion and cohesion.Concomitant to this, policies to boostformal employment and the consolidationof a framework of protective labourregulations should be put in placeas a means of reaching appropriateworking conditions and to facilitatesocial integration. In this context,
universal policies should provideguarantees to access essential serviceswhile ensuring appropriate income levels.
The fourth aspect concerns conditionalities.It is important to fully understand theirrationale and their role. What are the aimsof conditionalities? Are conditionalitiesimposed to foster demand for socialservices or to gain broader social supportamong taxpayers and median voters?Do they have unintended impacts—positive or negative—beyond thecash transfer? Are governments reallyable to monitor fulfilment of conditionalcontracts? In this regard, it seems moreappropriate to alter the existingperspective of ‘conditionality’ to thatof a universal right for children to accessbasic services. Understood as such, thisrequires ensuring access to good-qualitysocial services.
The institutional design of cash transferprogrammes is another essentialcomponent to ensure their longevity,especially turning such programmes intopermanent State policies to fulfil notonly short- but also long-term objectives.Essential to achieve this is, in turn, amodern, efficient and timely monitoringand evaluation system operating on apermanent basis to make all necessaryadjustments and maximise positiveimpacts on well-being and equality.
Finally, these four Latin American countries—Argentina, Brazil, Chile and Uruguay—need to continue strengthening theirrespective government’s redistributioncapacity through a more progressivetaxation structure and greater fiscalpressure, as well as through moreand effective social spending.
Amarante V., M. Ferrando and A. Vigorito(2011). ‘School Attendance, Child Labourand Cash Transfers: An Impact Evaluation ofPANES’, Working Paper, No. 22/11. Québec,Poverty and Economic Policy Network-PIERI.
Amarante, V. and A. Vigorito (2012).‘The expansion of non-contributorytransfers in Uruguay in recent years’, PolicyResearch Brief, No. 29. Brasília, InternationalPolicy Centre for Inclusive Growth.
Bertranou, F. and R. Maurizio (2012a).‘Semi-conditional cash transfers in theform of family allowances for children andadolescents in the informal economy inArgentina’, International Social SecurityReview, Vol. 65, Issue 1 (Jan–March), 53–72.
Bertranou, F. and R. Maurizio (2012b).‘Monetary Transfers for Children andAdolescents in Argentina: Characteristicsand Coverage of a “System” with ThreeComponents’, Policy Research Brief, No. 30.Brasília, International Policy Centre forInclusive Growth.
Cechini, S., C. Robles and L. Vargas (2012).‘The expansion of cash transfer in Chile andits challenges: Ethical Family Income’, PolicyResearch Brief, No. 26. Brasília, InternationalPolicy Centre for Inclusive Growth.
ECLAC (2010). Time for equality: closinggaps, opening trails. Report of the thirtiethsession of ECLAC. Santiago de Chile, UnitedNations Economic Commission for LatinAmerica and the Caribbean.
Ferro, A., A. Kassouf and D. Levison (2010).‘The impact of conditional cash transferprograms on household work decisions inBrazil’, in R. Akee, E. Edmonds and K.Tatsiramos (eds), Child Labor and theTransition between School and Work,Research in Labor Economics, Vol. 31.Bradford, Emerald Group PublishingLimited: 193–218.
Garganta, S. and L. Gasparini (2012). ‘El Impacto de un Programa Social sobre laInformalidad Laboral: El Caso de la AUH enArgentina’, CEDLAS Working Paper, No. 133.La Plata, Centro de Estudios DistributivosLaborales y Sociales.
Maurizio, R. and G. Vázquez (2012).‘The impacts of a child allowance programon the behavior of adults in the labor market.The case of Argentina’, Working Paper.Buenos Aires, Universidad Nacionalde General Sarmiento.
Medeiros, M., T. Britto and F.V. Soares(2008). ‘Targeted cash transfer programmesin Brazil: BPC and The Bolsa Familia’,Working Paper, No. 46. Brasília,International Poverty Centre.
Perez Ribas, R., F.V. Soares and G. Hirata(2008). ‘The Impact of CCTs. What we knowand what we are not sure about’, Poverty inFocus: Cash Transfers. Lesson from Africaand Latin America. Brasília, InternationalPoverty Centre.
Soares, F.V., R. Ribas and R. Osório (2007).‘Evaluating the Impact of Brazil’s BolsaFamília: Cash Transfer Programmes inComparative Perspective’, IPC EvaluationNote, No. 1. Brasília, InternationalPoverty Centre.
Soares, S. and P. de Souza (2012). ‘No childleft without: a universal benefit for childrenin Brazil’, Policy Research Brief, No. 27.Brasília, International Policy Centre forInclusive Growth.
Villatoro, P. (2008). ‘CCTs in Latin America:Human Capital Accumulation and PovertyReduction’, Poverty in Focus: Cash Transfers.Lesson from Africa and Latin America.Brasília, International Poverty Centre.
World Bank (2009). Transferencias monetariascondicionadas. Reducción de la pobrezaactual y future. Bogota, Mayol Ediciones.

6 International Policy Centre for Inclusive Growth
India has unacceptably highlevels of maternal and infant mortalitydespite sustained economic growth overthe last two decades. At the nationallevel, the Maternal Mortality Rate (MMR)in India for the period 2007–2009 was 212per 100,000 live births (Office of RegistrarGeneral of India, 2011), and the InfantMortality Rate (IMR) for 2011 was 44 per1000 live births (ibid., 2012). There are,of course, variations from state to state,and the poorer states have much worseoutcomes—for example, in Uttar Pradesh1
the MMR reached 359 and the IMR 57.
The programme known as JananiSuraksha Yojana (JSY) is a safe motherhoodintervention under the National RuralHealth Mission (NRHM) of the Governmentof India. Its objective is to reduce maternaland neonatal mortality by encouragingpoor pregnant women to use healthcentres at the time of delivery. Under the
JSY, women receive a cash benefit if theychoose to deliver at a health centre.States have been categorised on thebasis of their performance in terms ofcoverage of institutional deliveries, andthe benefit amount varies from Rs700(US$13) in low-performing states (LPSs)to Rs1400 ($26) in high-performing states(HPSs). The JSY is a large programme, andits coverage and expenditure continueto expand (see Figure 1). In 2010–11,JSY covered 11.34 million beneficiarieswith an expenditure of $323.7 million.
However, in some states the programme’scoverage is still very low. States such asUttar Pradesh and Jharkhand managed toassist less than 20 per cent of women whogave birth in rural areas (see Figure 2).
Lim et al. (2010) have found thatthe scheme has failed to reach outto the most marginalised groups.One of the reasons is eligibility criteria,which disqualify women who are usuallymore vulnerable to maternal and infantmortality and morbidity, includingwomen below 19 years of age, thosewithout ‘below the poverty line’ (BPL)identification cards, and those withmore than two children.2
Delays in payment and the costsassociated with institutional deliveryalso have the effect of keeping thepoorest women out. A 2011 evaluationundertaken by the National HealthSystems Resource Centre (NHSRC, 2011)found that out-of-pocket payments arehigh, amounting to Rs1028 ($19), and,when transport is included, they increaseto a range from Rs1400 ($26) to Rs1600($30). Therefore, the JSY benefit is onlycovering costs. Moreover, according tothe NHSRC, payments are not madeimmediately, meaning that most womenhave to return to the health centre, oftenmore than once, to receive the benefit.
Achievements and Limitationsof an Incentive Based Cash Transferin India: the Case of JSY by Dipa Sinha,
Independent Public Health Researcher
Over 50 per cent of womenwho had a previous homedelivery opted for aninstitutional deliveryafter the introductionof JSY (NHSRC, 2011).
Whether conditionalcash transfers can work inimproving health outcomeswhen there are enormoussupply-side gaps is somethingthat needs to be consideredmore seriously.
Source: Ministry of Health and Family Welfare, Government of India (various years).

Poverty in Focus 7
Altogether, the poorest women thus facesignificant barriers to benefiting frominstitutional deliveries despitethe JSY incentives.
JSY’s impactHowever, JSY has had an impact onthe number of women accessing healthcentres and has increased the numberof institutional deliveries in the country.Over 50 per cent of women who had aprevious home delivery opted foran institutional delivery after theintroduction of JSY (NHSRC, 2011).
Longitudinal data derived from large-scale national surveys (InternationalInstitute for Population Sciences andMinistry of Health & Family Welfare, 2006)indicate that, while there was indeed anincrease in the percentage of institutionaldeliveries in the five-year period from2002–04 to 2007–08 (ibid., 2010) beforeJSY was introduced (41 per cent to 47per cent), after its introduction thissame percentage increased dramaticallyto 73 per cent in 2009 (UNICEF, 2009).
However, it is also true that it has haddifferent impacts in different parts of thecountry, with the level of institutionaldelivery and the proportion of peopleaccessing public facilities varying widely,as seen in Figures 3 and 4. Chhattisgarh,Jharkhand and Uttar Pradesh are thestates with the lowest proportion ofinstitutional deliveries, and these arethe same states that also have thelowest coverage of JSY.
The increase in institutional deliveryis skewed because only a few facilitiesare actually bearing the load of this
substantial increase. Most of the deliveriestake place in facilities at the block3 andhigher levels, with few accessing sub-centres or Primary Health Centres (PHCs).4
While overall there has been an increasein institutional deliveries, it is still notclear whether the JSY has had any impacton maternity and neonatal mortalityrates. Lim et al. (2010) analysed tworounds of data from the District LevelHousehold Survey and found some
reduction in perinatal mortality(approximately three months before toone month after birth) associated withJSY, but their study was limited dueto its small sample size.
The authors also found that theassociation is greater in states witha higher proportion of institutionaldeliveries. On the other hand, issuesrelated to critical gaps in infrastructureand quality of care cast doubt on whether
Source: Annual Health Survey, 2010.
Source: Annual Health Survey 2010.
1. The population of Uttar Pradesh state is 199.5 million(Census of India, 2011) which is almost the same as thetotal population of Brazil.
2. Those less than 19 years are not covered because18 years is legally the minimum age of marriage for agirl; and benefits are not given to those with morethan two children presumably to achieve targetsof population stabilisation.
3. A block is an administrative unit which typicallyconsists of about 100–150 villages. Three to five blockstogether make one district. There are a number ofdistricts in each state (ranging from two to 70).There are 29 states and six Union Territories in India.
4. A sub-centre caters to an average population of5000 people; a Primary Health Centre (PHC) caters to anaverage population of 30,000 people, and a CommunityHealth Centre (CHC) caters to an average population of100,000 people, which roughly corresponds to thepopulation of one block.

8 International Policy Centre for Inclusive Growth
the increase in the proportion ofinstitutional deliveries has had asignificant impact on maternal andneonatal mortality rates.
While the JSY mandates that a womanremains in the health centre for two daysafter the delivery so that any postnatalcomplications in the mother or child canbe dealt with (longer if complications areserious), there are identified cases ofwomen leaving the centre immediatelyafter delivery.
Only about 14 per cent stay more than48 hours, and only one third of womenstay in the facility for at least 24 hours.It is the period immediately after deliverywhen women and infants are at greatestrisk; thus if they do not stay in the centre,much of the advantage of delivering inthis setting is lost. One of the majorreasons why women do not stay afterthe delivery is the poor facilities and poorquality of care in the existing centres.
There are also serious shortagesin the availability of skilled humanresources (midwives, nurses, doctors andspecialists) in relation to the norms set bythe Indian Public Health Standards of theGovernment of India. This includes a 23per cent shortfall in nursing staff in PHCsand Community Health Centres (CHCs) anda 12 per cent shortfall in doctors in PHCs.
Nearly 40 per cent of PHCs have no labtechnicians, and nearly 25 per cent haveno pharmacists. Further still, 34 per centof the PHCs do not have a designatedlabour room. There is a 75 per centshortfall in surgeons, 66 per cent inobstetricians, 80 per cent in physiciansand 74.4 per cent in paediatricians inCHCs. Even where human resources areavailable, they are not skilled enough(Government of India, 2011).
The NHSRC study reveals that theincreased proportion of institutionaldeliveries has not necessarily meantincreased access to skilled birth assistance,because most nurses and auxiliary nursemidwives who are actually providing theservices have never received specialisedtraining for this type of work.
The infrastructure also is poor, especiallyin some states such as Chhattisgarh,
Uttar Pradesh and Jharkhand, wheremore than 25 per cent of the PHCs haveno electricity supply, and, more alarmingstill, over 20 per cent have no regularwater supply. In fact, only 15 per cent ofall PHCs in the country are functioningaccording to Indian Public HealthStandards norms. With such large gaps ininfrastructure, personnel and quality ofcare, there is doubt about how far JSYcan contribute to improvements inhealth outcomes in India, especiallythose related to maternal health.
A significant number of deliveries,indeed, continue to take place at home.About one third of women who hadhome deliveries were not able to accessinstitutions because they could notafford transport costs. Another third ofwomen who had home deliveries alsoreported poor service quality and highcosts in institutions as deterrents ofinstitutional delivery. Messages on thebenefits of JSY had not reached about 40per cent of women who deliver at home(NHSRC, 2011).
The limited role of the cash incentiveThe key assumption behind JSY isthat there is a problem of demand forinstitutional delivery which can be dealtwith by providing a cash incentive. Butclearly this is open to question. What JSY,indeed, seems to be doing, ostensibly, issimply addressing constraints pertainingto costs associated with accessing publichealth institutions. It could be arguedthat ensuring free services (with no out-of-pocket expenditures) would have hada similar impact on the increase in theproportion of institutional deliveries.
It is important, thus, that the quality ofservices are ensured.Whether conditionalcash transfers can work in improvinghealth outcomes when there are enormoussupply-side gaps is something that needsto be considered more seriously. This isespecially important in a country suchas India where there is a danger of cashtransfers being seen as an alternativeto provision of services, rather thana supplement. The Government ofIndia has recently launched a scheme
Source: Annual Health Survey 2010.

Poverty in Focus 9
(Janani Shishu Suraksha Karyakram)5
to ensure access to free services andimproved quality, which will hopefullyaddress some of the concernsraised above.
A deeper issue that such cash transferprogrammes raise is with regard tothe State’s obligations to its citizens.In a ‘rights-based’ approach, the onus ison India to provide quality basicservices (related to education,health and nutrition) to all.
Is the increased importancegiven to conditional cash transfersto incentivise ‘correct’ behaviour atthe cost of direct provision of servicesshifting the blame onto people,thereby absolving governmentsof their responsibilities? Cash transferscannot become a replacement for Stateinterventions that ensure infrastructure,access, quality and so on. They can be at
most an add-on (and many timesa useful add-on) to direct provision.
Government of India (2007). Bulletinon Rural Health Statistics in India 2007.New Delhi, Ministry of Health & FamilyWelfare, Government of India.
International Institute for PopulationSciences and Ministry of Health & FamilyWelfare (2010). District Level HouseholdSurvey-3 (2007–08). New Delhi,Government of India, <http://aidsdatahub.org/dmdocuments/DLHS_3_Key_indicators_by_states.pdf> (accessed 29 July 2013).
International Institute for PopulationSciences and Ministry of Health & FamilyWelfare (2006). District Level HouseholdSurvey-2 (2002–04). New Delhi, Governmentof India, <http://www.aidsdatahub.org/dmdocuments/DLHS_2_2002_2004.pdf>(accessed 29 July 2013).
Lim, S.S., L. Dandona, J.A. Hoisington, S.L.James, M.C. Hogan and E. Gakidou (2010).‘India’s Janani Suraksha Yojana,A Conditional Cash Transfer Programmeto Increase Births in Health Facilities: AnImpact Evaluation’, Lancet, 375: 2009–23.
5. Janani Shishu Suraksha Yojana means ‘Mother andChild Security Programme’.
NHSRC (2011). Programme Evaluationof Janani Suraksha Yojana. New Delhi,National Health Systems ResourceCentre, Ministry of Health & FamilyWelfare, Government of India.
Office of Registrar General of India (2012).SRS Bulletin, Volume 47, No. 2. New Delhi,Office of Registrar General of India,<http://planningcommission.nic.in/data/datatable/2504/databook_162.pdf>(accessed 29 July 2013).
Office of Registrar General of India (2011).Special Bulletin on Maternal Mortality inIndia 2007–09, Sample Registration System.New Delhi, Office of Registrar General ofIndia, <http://www.censusindia.gov.in/vital_statistics/SRS_Bulletins/Final-MMR%20Bulletin-2007-09_070711.pdf>(accessed 29 July 2013).
UNICEF (2009). Coverage EvaluationSurvey. New Delhi, UNICEF,<http://www.unfpa.org/sowmy/resources/docs/library/R309_UNICEF_2010_INDIA_2009CoverageSurvey.pdf>(accessed 29 July 2013).
by Babken Babajanian, Research Fellow, Social Protection Programme, ODI
Tackling Old-age Poverty andVulnerability: Social Pensions in Asia
Social or non-contributorypensions in Asia seek toprovide income support toolder persons who are notcovered by the existingcontributory schemes.
The existing social pensionschemes have a limitedpoverty reduction effect dueto low value of transfers andinsufficient coverage ofpoor households.
Social or non-contributorypensions are increasingly beingused across the developing world asa policy instrument for providing socialprotection to older persons. Some ofthe most innovative social pensionschemes are in Asia—in particular, inBangladesh, Nepal, Thailand and VietNam. These schemes are relatively new,and there is a need to strengthen theempirical knowledge base about theireffectiveness and relevance.
This article discusses key findingsof a recent publication by the AsianDevelopment Bank (ADB) (Handayani and Babajanian, 2012) with a focuson these four countries.
Policy objectives of social pensionsSocial pensions seek to provide incomesupport to older persons who are notcovered by the existing contributory
schemes. Specifically, they aim to addresslifecycle-related drivers of old-agepoverty and vulnerability. These driversare primarily linked to old age as a stagein a lifecycle that makes it difficult toearn stable and reliable income.
The majority of older persons in Asiahave little personal income and rely onfamily structures for income security andsocial support. The existing contributoryschemes in Asia cover roughly between20 per cent and 40 per cent of theworking-age population (Hagemejer andSchmitt, 2012), though only 10 per cent ofthe working-age population in Indonesiaand Viet Nam, and 15 per cent in China,the Philippines and Thailand (Park, 2010).
The inadequacy of the existingsocial protection systems in the regionparticularly heightens the vulnerabilityof elderly women. Women generally live
10 International Policy Centre for Inclusive Growth
For example, the system in Thailandis generally inclusive, as the retirementthreshold is more than 10 years belowlife expectancy, while the pensionscheme in Nepal is rather restrictive, asit defines eligibility age at least 10 yearsabove the life expectancy of bothupper- and low-caste (Dalit) groups.
The extent to which these schemes provideincome support to older persons is acrucial issue. Government expenditureson social pensions in all four countriesconstitute a small share of total nationalincome (Figure 2).
The size of transfers is generally low,and the average monthly benefit isbelow half the poverty line. To date,there are no rigorous impact evaluationsto establish the well-being effects ofsocial pensions. Handayani, S.W. andB. Babajanian (2012) country case studiesshow that, despite their small values,social pensions contribute to basic needsexpenditures of older persons, includingthe cost of food, health care, andexpenses associated with socialand ceremonial activities.
There are indications that social pensionssupport not only older persons butalso other members of their households,particularly children. The ADB casestudies suggest that some beneficiariesspent part of their allowance on theirgrandchildren’s educational expenses(Bangladesh and Nepal), buying candies or
longer than men and are more likelyto experience widowhood in later life.As the majority of women in Asia tendto work in the informal labour marketor perform unpaid domestic and carework, they are less likely to be eligible forformal pensions and have few resourcesto finance old-age needs (Vlachantoniand Falkingham, 2012).
Effectiveness in poverty reductionThe effectiveness of social pensions inreducing old-age poverty and vulnerabilitydepends on both their coverage and thesize of transfers. The economic impactsof social pensions are also influencedby the nature and patterns of intra-household resource allocation.
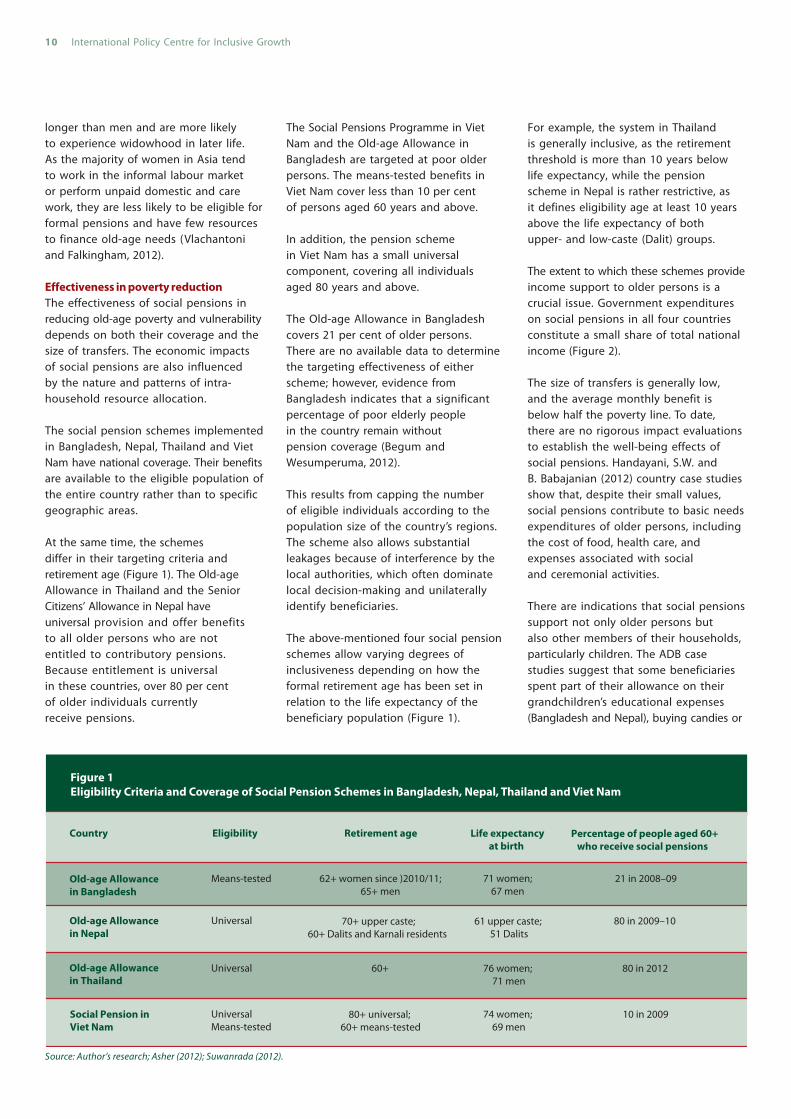
The social pension schemes implementedin Bangladesh, Nepal, Thailand and VietNam have national coverage. Their benefitsare available to the eligible population ofthe entire country rather than to specificgeographic areas.
At the same time, the schemesdiffer in their targeting criteria andretirement age (Figure 1). The Old-ageAllowance in Thailand and the SeniorCitizens’ Allowance in Nepal haveuniversal provision and offer benefitsto all older persons who are notentitled to contributory pensions.Because entitlement is universalin these countries, over 80 per centof older individuals currentlyreceive pensions.
The Social Pensions Programme in VietNam and the Old-age Allowance inBangladesh are targeted at poor olderpersons. The means-tested benefits inViet Nam cover less than 10 per centof persons aged 60 years and above.
In addition, the pension schemein Viet Nam has a small universalcomponent, covering all individualsaged 80 years and above.
The Old-age Allowance in Bangladeshcovers 21 per cent of older persons.There are no available data to determinethe targeting effectiveness of eitherscheme; however, evidence fromBangladesh indicates that a significantpercentage of poor elderly peoplein the country remain withoutpension coverage (Begum andWesumperuma, 2012).
This results from capping the numberof eligible individuals according to thepopulation size of the country’s regions.The scheme also allows substantialleakages because of interference by thelocal authorities, which often dominatelocal decision-making and unilaterallyidentify beneficiaries.
The above-mentioned four social pensionschemes allow varying degrees ofinclusiveness depending on how theformal retirement age has been set inrelation to the life expectancy of thebeneficiary population (Figure 1).
Source: Author’s research; Asher (2012); Suwanrada (2012).

Poverty in Focus 11
snacks for their grandchildren (Thailand)and food, medicine or gifts for theirchildren or grandchildren (Viet Nam).Yet, social pension transfers in all ofthe case studies were too low to offersubstantial support to the householdmembers of the pensioners.More researchis necessary to identify how socialpensions affect intra-householdresource allocation.
This can help provide insight intothe effectiveness and appropriatenessof pension transfers for supportingindividual needs of older persons.
In situations where there is asubstantial redistribution fromolder persons to their households,the question is whether social pensionsreduce vulnerability among the elderlyor whether they mostly support other(non-elderly) members of their households.
The receipt of social pension transfersmay also affect family support for olderpersons. In particular, it is importantto establish whether (and in whichcircumstances) social transfers mayresult in a reduction and crowding outof family support to older persons.
More evidence is likewise required toestablish whether social pensionstargeted at older persons are an effectiveand appropriate policy instrument forreaching out to and supporting olderpersons’ households.
Social pensions represent an importantpolicy instrument for addressing old-agepoverty and social exclusion in Asia.Evidence indicates that social pensionsoffer limited income support due to thelow value of benefits and insufficientcoverage of poor older persons inmeans-tested schemes. They neverthelessprovide an important institutionalfoundation for subsequent expansionand strengthening of the existing schemes.
Economic growth can allow greaterredistribution in the future and make itpossible to extend the coverage, lowerthe retirement age, and finance moregenerous benefits.
Development of effective pensionschemes requires strengthening theadministrative and delivery capacity ofnational social protection institutions.Eventually, the existing socialpension schemes must be integratedwith contributory pensions to formconsolidated systems for old-agesocial protection.
Asher, M. (2012). ‘Social Pensions forthe Elderly in Asia: Fiscal Costs andFinancing Methods’ in S.W. Handayaniand B. Babajanian (eds), Social Protectionfor Older Persons: Social Pensions in Asia.Manila, Asian Development Bank: 60–83.
Begum, S. and D. Wesumperuma (2012).‘Overview of the Old Age AllowanceProgramme in Bangladesh’ in S.W. Handayaniand B. Babajanian (eds), Social Protectionfor Older Persons: Social Pensions in Asia.Manila, Asian Development Bank: 187–213.
Giang, T.L. and D. Wesumperuma (2012).‘Social Pensions in Viet Nam: Status andRecommendations for Policy Responses’in S.W. Handayani and B. Babajanian (eds),Social Protection for Older Persons:Social Pensions in Asia. Manila,Asian Development Bank: 168–186.
Hagemejer, K. and V. Schmitt (2012).‘Providing Social Security in Old Age:The International Labour Organization View’in S.W. Handayani and B. Babajanian (eds),Social Protection for Older Persons:Social Pensions in Asia. Manila,Asian Development Bank: 137–152.
Handayani, S.W. and B. Babajanian (2012).Social Protection for Older Persons:Social Pensions in Asia. Manila,Asian Development Bank.
Park, D. (2010). ‘East and Southeast Asia’sPension Systems: Overview and ReformDirections’ in S.W. Handayani (ed.), EnhancingSocial Protection in Asia and the Pacific:The Proceedings of the Regional Workshop.Manila, Asian Development Bank: 136–157.
Samson, M. (2012). ‘Nepal’s Senior Citizens’Allowance: A Model of Universalism in aLow-Income Country Context’ in S.W.Handayani and B. Babajanian (eds),Social Protection for Older Persons:Social Pensions in Asia. Manila,Asian Development Bank: 214–245.
Suwanrada, W. (2012). ‘Old Age AllowanceSystem in Thailand’, presentation at the‘Recent Developments in the Role andDesign of Social Protection Programmes,A Policy Dialogue, Expert Workshop andSouth–South Learning Event’, 3–5 December2012, Brasília, Brazil, <http://pressroom.ipc-undp.org/international-seminar-on-social-protection/> (accessed 12 March 2013).
Vlachantoni, A. and J. Falkingham, (2012).‘Gender and Old Age Pension Protection inAsia’ in S.W. Handayani and B. Babajanian(eds), Social Protection for Older Persons:Social Pensions in Asia. Manila,Asian Development Bank: 246–278.
Source: Author’s research; Begum and Wesumperuma (2012); Giang and Wesumperuma (2012); Samson (2012); Suwanrada (2012).

12 International Policy Centre for Inclusive Growth
Since the end of apartheid, theexpansion of social assistance programmeshas formed an integral part of SouthAfrica’s policy response to poverty andinequality, and, indeed, the countrynow possesses one of the most extensivesocial security systems among itsAfrican and developing-country peers.
The number of grants paid by the statemore than quintupled over 15 years to15.7 million in April 2012. The largestgrant in per capita and aggregatemonetary terms is the state old-agepension (OAP), although it is a distantsecond to the child support grantin terms of number of beneficiaries(2.8 million compared to 11.3 million).
The key rationale underlying the OAPis the reduction of old-age poverty,while lowering inequality is an importantsubsidiary objective. Given the significantcost of the OAP to the state—currentlyaround 1.2 per cent of GDP—a keyquestion is the degree to which theOAP is successful in achievingthese two objectives.
The old-age pensionThe OAP is a non-contributory means-tested grant paid to men and womenfrom the age of 60 years. The numberof recipients has grown gradually—byan average 2.2 per cent per year—from1.7 million in 1997 to 2.2 million in 2008.The equalisation of the eligibility agefor men and women, when men’s age ofeligibility was lowered from 65 years, sawrapid growth in the number of recipients(6.5 per cent per annum) between 2008and 2011; though the rate of growth hassubsequently normalised. As a proportionof all grants, however, the OAP hasfallen from 62 per cent in 1999to 17.5 per cent in 2012.
The OAP is also relatively large in value.In 2010 prices, the monthly value of theOAP was roughly US$230 purchasing
The Impact of South Africa’sState Old-age Pension
by Morne Oosthuizen, Deputy Director:Development Policy Research Unit,
University of Cape Town
power parity (PPP), or 75 per cent abovethe median monthly per capita income(Woolard and Leibbrandt, 2010: 12).
The pension was also more than twicethe national upper bound poverty lineconstructed by Statistics South Africa(Statistics South Africa, 2008). This meansthat the pension has the potential tomake a significant impact on povertyin the country.
Incidence of the old-age pensionIf the OAP is to have the intendedimpacts, it is essential that it beappropriately targeted. Currently, toaccess the grant, age-eligible individualsmust satisfy a not very strict means testbased on income and assets. A series offormal analyses, including calculationsundertaken by the author, indicate thatin fact some two thirds of age-eligibleindividuals in South Africa presentlyreceive the pension (see also StatisticsSouth Africa, 2012a; SASSA, 2012).
The 2011 General Household Surveyestimates access to the OAP at 66.6 percent in mid-2011, and there is relativelylittle variation in the rate of incidenceacross five-year age cohorts. Lowerincidence among those under 65 yearsmay be related to individuals continuingto work beyond age 60 and the gradualmovement of individuals intothe programme.
Incidence of the OAP correspondsbroadly with the demographic andlocational markers of labour marketdisadvantage and poverty in SouthAfrica. In 2011, just over four fifths ofage-eligible Africans received the OAP,compared to three quarters of Coloureds,three fifths of Asians and just one fifth ofWhites (own calculations; Statistics SouthAfrica, 2012b). Incidence among age-eligible women, at 71.7 per cent, was 10percentage points higher than that of men,since the latter typically reside in better-
The OAP is a non-contributory means-testedgrant paid to men and womenfrom the age of 60 years.
The number of grantspaid by the state more thanquintupled over 15 years to15.7 million in April 2012.
Grants, therefore,play a significant role incompensating for a lack ofwage income among thepoorest households.
Certainly key to the long-termfiscal sustainability ofthe OAP is improvedemployment generation.

Poverty in Focus 13
off households. Access rates also differby location, with 75 per cent of age-eligible individuals in non-metropolitanareas receiving the pension, comparedto 50 per cent in metropolitan areas.
Importantly, access rates also correlatewith income. Almost nine out of ten age-eligible individuals in the poorest threeexpenditure quintiles received the OAPin 2011. This proportion falls to less thantwo thirds for individuals in the fourthquintile and just 15 per cent in the fifthquintile (the 20 per cent of householdswith the highest per capita expenditure).
With inequality in mind, while thereappear to be eligible individuals who stilldo not access the OAP, the existing datado suggest that the programme hasnevertheless been successful in ensuringthat the wealthiest members of society donot capture the benefits. Three quartersof OAP recipients reside in households inthe poorest three quintiles, while just 4 percent are located in the top quintile (owncalculations; Statistics South Africa, 2012b).
This pattern of incidence indicates thatthe pension represents a significantcomponent of household income forpoorer households. Grants accountfor 63 per cent of household income
in the poorest decile, falling to just over16 per cent in the sixth decile, while wageincome rises from 23 per cent to 76 percent (own calculations; Statistics SouthAfrica, 2012c). Grants, therefore, play asignificant role in compensating for alack of wage income among the pooresthouseholds. The OAP alone constitutes20 per cent of household income in thesecond and third deciles, and as muchas 8 per cent in the first and sixth deciles.
This low proportion in the first decilepoints to the relatively large value of theOAP and its ability to lift households outof the poorest decile.
The impact of the old-age pensionThe pension’s good targeting and itsrelatively high value strongly suggestthat it is able to make a significantimpact on poverty. Estimates from the2008/2009 Living Conditions Surveypoint to a strong impact of the pensionon poverty in South Africa, using pre-grant income as a counterfactual. Giventhat household formation is endogenouswith respect to social grants—manyhouseholds would not be viable in theabsence of grants—this is not a particularlyrealistic counterfactual, but it doesprovide insight into the importance ofgrants in alleviating poverty.
Table 1 reveals that the OAP lowered thepoverty rate (P0), the depth of poverty(P1) and the severity of poverty (P2) acrossthree different poverty lines. This islargely in line with findings by Woolardet al. (2010: 21), using data from the 2008wave of the National Income DynamicsStudy, although they use somewhathigher poverty lines and consider thecombined impact of all state grants.
It is also consistent with findings using1993 data that the poverty rate amongAfricans would have been higher by fivepercentage points in the absence of theOAP (Case and Deaton, 1998: 1342), andthat the pension reduced poverty bybetween 26 and 33 percentage pointsin the former homeland of Venda,now part of the Limpopo province(Jensen, 2003: 109–110).
A similarly beneficial impact of the OAPis found in terms of income inequality asmeasured by the Gini coefficient, where avalue of 0 indicates perfect equality anda value of 1 indicates perfect inequality.
The Gini coefficient for individualsdeclines from 0.724 to 0.704 when thepension is included in total income,while that of households falls from 0.710to 0.692 (own calculations; Statistics SouthAfrica, 2012c). Both changes arestatistically significant.
The OAP is an integral part of the SouthAfrican government’s commitment toreducing poverty, transferring about 1.2per cent of GDP to more than 2.8 millionelderly recipients. This grant’s value interms of income support is clearlyevident in disaggregations of householdincome by income source, contributingup to one fifth of household incomein certain deciles.
The pension has a significant impact onpoverty, beyond the recipients themselves:ignoring household formation effects, itis estimated that the pension lifts up to1.8 million individuals out of poverty,as measured by South Africa’s upperbound poverty line. The grant hasfurther beneficial impacts, including thefacilitation of female labour migrationamong co-resident working-age womenwhere OAP recipients themselves arewomen (Posel et al., 2006).
Source: Own calculations; Statistics South Africa (2012c).
Notes: P0, P1 and P2 belong to the Foster-Greer-Thorbecke (FGT) measures of poverty, respectively referred to asthe poverty headcount (or poverty rate), the depth of poverty and the severity of poverty. All differences betweenestimates with and without the old age pension are statistically significant at the 95 per cent level.

14 International Policy Centre for Inclusive Growth
The Old-age AllowanceSystem in Thailand2
by Worawet Suwanrada,Faculty of Economics and Dean of
College of Population Studies,Chulalongkorn University1
The Thai old-age allowancesystem specifically has beenboth decentralised andtransformed from beingmeans-tested to universal.
While the OAP accounted for 4.2 per centof total government expenditure in the2010/11 fiscal year, it is not viewed asparticularly unsustainable from a fiscalperspective, although it is not clear towhat extent the recently announceddecision to abolish the meanstest will affect this.
More broadly, though, concerns havebeen voiced regarding the size of thetax base relative to the number of socialassistance recipients: for the 2009/2010fiscal year, grant recipients outnumberedindividual taxpayers by a ratio of three toone. Certainly key to the long-term fiscalsustainability of the OAP is improvedemployment generation. Not only wouldthis grow the tax base and boost taxrevenue, but, more importantly, it wouldalso enable a greater proportion ofworking-age adults to savefor their retirement.
Case, A. and A. Deaton (1998). ‘Large cashtransfers to the elderly in South Africa’,Economic Letters, 108 (450): 1330–1361.
Jensen, R.T. (2003). ‘Do private transfers“displace” the benefits of public transfers?Evidence from South Africa’, Journal ofPublic Economics, 88 (1): 89–112.
Posel, D., J.A. Fairburn andD. Lund (2006). ‘Labour migration andhouseholds: A reconsideration ofthe effects of the social pensionon labour supply in South Africa’,Economic Modelling, 23(5): 836–853.
SASSA (2012). Fact Sheet No. 1 of 2012.Pretoria, South African Social SecurityAgency, <http://www.sassa.gov.za/portals/1/Documents/8ad5ab49-c0e3-4c9f-ad0f-6b955dd6632d.pdf>(accessed 30 July 2013).
Statistics South Africa (2008).‘Measuring poverty in South Africa:Methodological report on the developmentof the poverty lines for statistical reporting’,Technical Report, No. D0300. Pretoria,Statistics South Africa.
Statistics South Africa (2012a). ‘Census2011, PX-Web data tables’, Statistics SouthAfrica website, <http://www.statssa.gov.za/>(accessed 15 November 2012).
Statistics South Africa (2012b ), GeneralHousehold Survey 2011, Dataset. Pretoria:Statistics South Africa.
Statistics South Africa (2012c ), LivingConditions Survey 2008/2009, Dataset.Pretoria: Statistics South Africa.
Woolard, I. and M. Leibbrandt (2010).‘The evolution and impact of unconditionalcash transfers in South Africa’, SouthernAfrica Labour and Development ResearchUnit Working Paper, No. 51. Cape Town,Saldru, University of Cape Town.
Woolard, I., K. Harttgen and S. Klasen(2010). ‘The evolution and impactof social security in South Africa’,Paper presented at the ‘Conferenceon Promoting Resilience through SocialProtection in Sub-Saharan Africa’,Dakar, Senegal, 28–30 June 2010,<http://erd.eui.eu/media/BackgroundPapers/Woolard-Harttgen-Klasen.pdf>(accessed 30 July 2013).
Thai society is currently facingpopulation ageing and a continuingdecline in fertility. Old-age financialsecurity has become an urgent issueunder this population dynamic.In terms of policy, the Thai governmenthas responded by strengthening itsexisting public pension schemes,introducing new pension schemesand providing various incentiveschemes for long-term saving.
The Thai old-age allowance systemspecifically has been both decentralisedand transformed from being means-tested to universal. The system now inplace is a non-contributory cash benefitscheme to provide income for elderlypersons who have otherwise not beenguaranteed any other public pensionschemes. This new programme, and theway it coexists with other, contributorypublic pension schemes, is an interestingcharacter of Thailand’s old-age allowancesystem today.
History and development beforethe introduction of the universal schemeThailand’s old-age allowance systemwas launched in 1993 by the Ministryof Interior’s Department of PublicAssistance (DPA). The scheme’sobjective is to provide financialassistance to the country’sunderprivileged elderly persons,defined as those who are at least60 years of age and either withoutenough income to meet necessaryexpenses, unable to work or livingwithout caregivers. Initially a village’spublic welfare assistance committee,as the formal representative of the DPA,was responsible for identifyingeligible elderly persons.
The amount of allowance was THB200per capita per month, and the committeeallocated the allowance to the eligibleelderly persons directly. There wereonly 20,000 recipients when the schemestarted (Suwanrada, 2009).
1. Associate Professor, Faculty of Economics andDean of College of Population Studies, ChulalongkornUniversity. Corresponding Address: College ofPopulation Studies, Chulalongkorn University,Phayathai Road, Pathumwan, Bangkok 10330, Thailand.E-mail: [email protected]
2. This paper was supported by the Higher EducationResearch Promotion and National Research UniversityProject of Thailand, Office of the Higher EducationCommission. It was granted by the project ‘Interactionbetween Population Dynamics and Human Securityin Thai Society’ (HS1151A) under Human SecurityResearch Cluster, Chulalongkorn University. The authorwould like to thank Dr.Thanyaporn Chankrajang for hervaluable comments.

Poverty in Focus 15
with the local authorities where theylive. The registration procedure isto be conducted once a year, namelyin November. In practice, some localauthorities provide mobile units to makeit easier for elderly persons. The necessarydocuments for registration are anidentification card, residence registrationbook, bank account (if applicable)and proxy form (if applicable).
After finishing the approval process,the qualified elderly persons startreceiving the pension in October of thefollowing year. The recipient can choosebetween four methods of delivery:to receive cash directly from thelocal authority office; to designatean authorised representative to receivecash directly from the local authorityoffice; to have the pension transferreddirectly to their bank account; or to havethe pension transferred to the bankaccount of an authorised representative.
In 2012, the Yinluck Shinawatragovernment changed the schemeto a multiple-rate system. The singlerate (THB500 per capita per month)was replaced by an amount that variesby age of recipient: persons 60–69 yearsof age receive THB600 per month, persons70–79 receive THB700 per month,
But efforts were made almostimmediately to refine the system.From 1993 to 2004, changes weremade in terms of eligibility, the amountof allowance, the authority in charge,the targeting process and administration.In 2000, the amount of pension was raisedto THB300 per capita per month, the localadministrative organisations started toplay an important role in the targetingprocess, and the channels for pensiondelivery became more diversified (i.e.through authorised person, postalcheque, bank account transfer).
In 2002, in accordance with thereorganisation of various governmentministries, the DPA moved to the new anew home under Thailand’s Ministry ofSocial Development and Human Security.
At this time there were two furthersignificant changes related to eligibilityand the targeting process. First, prioritycame to be given to those elderlypersons more overtly underprivilegedand who were unable to access existingpublic services. The second change wasto allow members of the community tojoin the targeting committee. Altogether,one major impact of this long seriesof refinements was an increase in thenumber of recipients from 110,850 in1995 to 318,000 in 2000. From 1999to 2004, the number stabilised atapproximately 400,000 recipients.
In 2005, the allowance underwent a bigchange due to the movement towardsdecentralisation experienced in theThai government. The old-age allowanceprogramme was once again transferredto another authoritative public body,this time the Department of LocalAdministration Promotion (DOLA) in theMinistry of Interior, the main mandateof which is to manage funds providedto local authorities. The task of targetingthe old-age allowance duly becamedecentralised to the local authorities.
In addition, the participation ofcommunity members in targetingprocesses via community councilsor community meetings was madelegal, and local authorities, if theydemonstrated sound fiscal management,were given free rein to top up someallowances if and when they saw fit.
Unfortunately, in practice, no localauthority actually did this. In 2006,the amount of allowance was raised toTHB500 per capita per month. After thedecentralisation of the targeting process,the number of recipients increaseddramatically to 527,083 in 2005 andjumped to nearly double this number—1,073,190—in 2006. The number rosefurther to 1,755,178 in 2007 and 2008.
Despite the success in providing old-agefinancial security, in which the localgovernments and communities playeda central role, it seems that significanttargeting inefficiency problems remain.Prachuabmoh et al. (2009) found thatmore than 50 per cent of underprivilegedelderly persons with income below thepoverty line and living without supportfrom their families did not receive anallowance. Because the nationalgovernment did not invest in buildingthe institutional capacity of the targetingsystem and there were no nationalguidelines in place, the approachof the local authorities with regard totargeting varied greatly. Some utilisedstrict targeting standards, but othersallocated allowance to all elderly persons.
There were also great differences in howdifferent local authorities understoodthe importance of community meetings.With respect to selecting beneficiaries,local authorities were often unable toclearly account for why any particularolder person was selected over andabove another. Local officials werefrequently accused of favouritism(Suwanrada and Dharmapriya, 2012).
Universalisation of theOld-age Allowance SystemThe biggest change was seen in the fiscalyear of 2009, when the old-age allowancewas expanded to include all elderly peoplein Thailand aged 60 or older and notliving in public old-people’s homesor not receiving permanent income as asalary or pension (i.e. excluding recipientsof central, local or public enterprisepensions or social security fund’s old-agebenefits, and government employees).The number of recipients duly climbedto 5,652,863 in 2010 and 5,698,414 in 2011.
Officially, elderly persons (or theirauthorised representative) must register
As a result of the changefrom a single rate tomultiple rates, the averageold-age allowance perpensioner increased fromTHB500 to THB645 in thefiscal year 2012, and isexpected to be THB662in the fiscal year 2013.
It could be argued thatto maintain the old-ageallowance system for onlyinformal workers willcause a certain horizontalinequality between theformal and informal sectors.

16 International Policy Centre for Inclusive Growth
persons 80–89 receive THB800 per month,and those 90 years of age or olderreceive THB1000 per month.
In the fiscal year 2012 (from 1 October 2011to 30 September 2012) the governmentallocated THB52.535 billion of its totalbudget to the old-age allowance for6,784,734 elderly persons via localauthorities. According to the NationalSurvey on the Older Population,conducted in 2011, the number of old-age allowance recipients is expected toincrease to 7,342,028 persons in the fiscalyear 2013 (from 1 October 2012 to 30September 2013). The governmentbudget will accordingly rise to THB58.347billion. As a result of the change froma single rate to multiple rates, theaverage old-age allowance per pensionerincreased from THB500 to THB645 in thefiscal year 2012, and is expected to beTHB662 in the fiscal year 2013.
The Old-age Allowance Systemin the big picture of pension policyThe old-age allowance system coexistswith other public pension schemes.In principle, those of the workingpopulation who are not national orlocal government officials, employeesof public enterprises or members ofsocial security funds (mostly privateemployees) are now eligible for anold-age allowance. For this segment ofthe population, the Thai government puta considerable effort into establishingcontributory public pension schemesto increase the replacement rate.
This included the expansion of thesocial security fund to the informalsector’s working population and theestablishment of the NationalSaving Fund scheme.
In such an environment, it could beargued that to maintain the old-ageallowance system for only informalworkers will cause a certain horizontalinequality between the formal andinformal sectors. The crucial questionsthus become: should the governmentextend the old-age allowance system toall elderly persons as the basic pensionscheme or how should the old-ageallowance system coexist appropriatelywith other pension schemes?
Lessons learnt from Thailand’s experienceswith the Old-age Allowance SystemOther less-developed countries can learnmuch from Thailand’s experiences withthe means-tested system as it existedbetween 1993 and 2008. Suwanrada andDharmapriya (2012) emphasise that forcountries that wish to introduce themeans-tested social pension, investingin a strong targeting system is critical.
Collecting socioeconomic information onthe beneficiaries is a necessary conditionfor policy design. Although thegovernment has, to some extent,delegated some authority for targetingto the local government and thecommunities, the national guidelinesmust nevertheless be well designed.
Clear and well-defined rules for targeting(i.e. on the conditions for beneficiaries,who to target and how to target) mustbe made so as to minimise targetinginefficiency. In addition, it must be keptin mind that there may be a trade-offbetween decentralisation and equity.
Insight can also be gained fromthe 2009 change to a universal scheme.The Thai government launched the old-age allowance system, featuring a smallpension amount and small numbersof recipients, nearly 20 years ago, andover time the number of recipients andthe amount they receive have graduallyincreased. Both Sakunphanit andSuwanrada (2011) and Suwanrada andDharmapriya (2012) underscore theimportance of political will for change.
A political ideology with an appropriateemphasis on social justice is a prerequisitefor establishing universal coverage.Moreover, knowledge-sharingamong researchers and academics,non-governmental and civil societyorganisations and politicians, domesticallyand internationally, is important.
The challenges faced by Thailand’scurrent universal old-age allowancesystem, especially in the context of rapidpopulation ageing, are equally informative.Since the Thai universal old-age allowancesystem now coexists with publiccontributory pension schemes, Suwanradaand Dharmapriya (2012) advise that thedesign for a social pension should bepart of a wider public pension system.
The government should envisage apension policy for the entire countryand aim for a harmonised system thatcan ensure financial security for olderpeople as well as the fiscal sustainabilityof the government itself, as opposed tomaking policies based on fragmentedor disjointed schemes.
The universal old-age allowance systemcurrently depends on general revenuefinancing through an annual budgetingprocess. In the context of Thailand’sageing population, we can expect thepublic expenditure on old-age allowanceto increase. Thus, consideration of itssources of public funding alsobecomes a prerequisite.
Prachuabmoh, V. et al. (2009). ResearchReport on Monitoring and Evaluation of theSecond Elderly National Plan 2002–2022.Bangkok, College of Population Studies,Chulalongkorn University.
Sakunphanit, T. and W. Suwanrada (2011).‘500 Baht Universal Pension Scheme’, inUnited Nations Development Programme(eds), Sharing Innovative Experiences:Successful Social Protection FloorExperiences. New York, Special Unit forSouth–South Cooperation: 401–415.
Suwanrada, W. (2009). ‘Poverty andFinancial Security of the Elderly in Thailand’,Ageing International, Vol. 33, No. 1–4, 50–61.
Suwanrada, W. and W. Dharmapriya (2012).‘Development of the Old Age AllowanceSystem in Thailand: Challenges and PolicyImplications’ in S.W. Handayani and B.Babajanian (eds), Social Protection for OlderPersons: Social Pensions in Asia. Manila,Asian Development Bank: 153–167.
The government shouldenvisage a pension policyfor the entire countryand aim for a harmonisedsystem that can ensurefinancial security forolder people as well asthe fiscal sustainabilityof the governmentitself, as opposed tomaking policiesbased on fragmentedor disjointed schemes.

Poverty in Focus 17
From a macroeconomicpoint of view, ELRis a unique and valuable formof active labour market policythat functions asan automatic stabiliser.
South Africa is a standoutexample. Introduced in 2004,this country’s ExpandedPublic Works Programme(EPWP) is a national jobcreation initiative now in itssecond phase (2009–2014),with high prospectsfor a third phase.
Thus far, little efforthas been made with respect to drawing in marginalisedsegments of the populationvia the creation of jobsin the social services sector.
The International Labour Organization(2013) estimates that global unemploymenthit almost 200 million people in 2012.Moreover, many developing countriesaround the world are experiencingpersistently high levels of unstableemployment and underemployment.What might the role of ‘productivesocial protection’, defined as employment-based or employment-friendly socialprotection interventions, bein this context?
Surely, employment-based socialprotection cannot be hoped to substitutean inclusive and job-rich developmentpath, at least not for any extendedperiod of time. Many countries have longdeployed public works and employmentprogrammes focused on creatinginfrastructure and physical assets as ameans of addressing both seasonal andcyclical unemployment.
However, this article seeks to identifywhat I regard as the most pressingaspects of employment-based socialprotection relative to current macropolicy and the labour market.Specifically, although standardinfrastructure and asset creation typesof programmes are unquestionablyimportant, attention here is given toemployment programmes that addresscare deficits for young, elderly andseriously ill or disabled people.
In an earlier US simulation study(Antonopoulos, 2011), I found that aninvestment in services for social carewould generate more than twice thenumber of jobs—1.2 million versus500,000—than comparable investmentin physical infrastructure, largely due tothe higher labour intensity of care work.That same research also indicates that,in addition to producing more jobs perdollar spent, in practice these types of
social care investment reach the leastwell-off and at the same time producerelatively more gains from the perspectiveof gender equity: first, by reducing theburden of care (particularly welcome towomen who work a double day) and,second, by substantially expandingincome-earning opportunitiesfor women.
What this shows, I argue, is thecrucial need for social care investmentprogrammes implemented within aframework of an employer of last resort(ELR), providing necessary scale,intuitional resilience and continuity.
The key feature of an ELR pertains tounstable markets unable to generatesufficient numbers of job opportunities,whereby the government, in this case,now steps in through public service jobcreation and provides employment toanyone willing and able to work atminimum wage.
At its core, therefore, ELR protects againstjoblessness via an ‘employment benefit’—in other words, ‘employment insurance’.When set up as a permanent institutionalfeature of the economy, from amacroeconomic point of view, ELRis a unique and valuable form of activelabour market policy that functions asan automatic stabiliser.
South Africa is a standout example.Introduced in 2004, this country’sExpanded Public Works Programme(EPWP) is a national job creation initiativenow in its second phase (2009–2014),with high prospects for a third phase.
In a 2008 study, given particular focushere, Antonopoulos and Kijong foundthe EPWP to be groundbreaking as asocial-sector intervention. The twopillars of the 2008 analysis were a gender-
Job Guarantee Investments in theSocial Sector: Lessons from South Africa’sExpanded Public Works Programme by Rania Antonopoulos,
Levy Economics Institute1
1.Senior scholar and director of the Levy Institute’sGender Equality and the Economy programme.She holds a PhD in Economics from the New Schoolfor Social Research. Her research publications areavailable at <www.levyinstitute.org>.
2. Learnership combines work-based experiencewith structured learning, and results in a qualification,registered within the National Qualifications Frameworkby the South African Qualification Authority, that signalsoccupational competence and is recognisedthroughout the country.

18 International Policy Centre for Inclusive Growth
disaggregated social accounting matrix(SAM) and time-use satellite accountsdeveloped for the South Africaneconomy. Although it was applied to thecontext of South Africa, the methodologyused is applicable to a variety of otherpolicy experiments that, with appropriatemodifications, can be adopted for use inother countries.
The proposals put forth in the presentarticle (and the earlier work it draws on)highlight the role of social-sectorinterventions in meeting several policyobjectives—namely, income and jobgeneration, provisioning of communities’unmet needs, retaining or enhancingskills for a new cadre of workers,and promotion of gender equalityby addressing the overtaxed timeof women and their lower labourforce participation rates.
The ex ante evaluation of a policyscenario for South Africa’s EPWPdemonstrates that the orders ofmagnitude involved are compelling,and might indeed motivate criticaldiscussion on its potential utilityfor other countries.
Background on South AfricaWhile many positive developmentshave taken place in post-apartheidSouth Africa, unemployment and povertyremain serious challenges. Over the pastdecade the country’s official unemploymentrate has been very high. What makesjoblessness even more intractable is thefact that, as compared to countries ata similar socioeconomic level, self-employment and the size of the informalsector in South Africa remain surprisinglysmall. To redress the serious problem ofchronic unemployment, South Africaintroduced, among other measures,the EPWP in 2004.
Its main goal is to contributetowards social inclusion and economicempowerment through job creation.To this end it provides a paid workentitlement to unemployed people.In its first phase, the EPWP had a targetof creating 1 million work opportunitieswithin five years.
First-phase EPWP projects werefocused primarily on labour-intensive
infrastructure, with a mandate tosubstitute, to the largest degree possible,human power for machine power butalso include a focus on environmental,cultural, social and economic-sectorprogrammes. In many respects the EPWPhad established deeply transformativeobjectives which were difficult to achievein the short term, given (what mid-termreviews and independent research hasrevealed to be) largely insufficientbudgetary allocations relative to theprogramme’s scale of ambition. Further,it was found that EPWP job opportunitieswere too few in number and too shortin duration to have a substantial impact.
Our 2008 study joined efforts to broadenthe policy dialogue on the revision of theEPWP for its second phase. Specifically,we proposed an expansion of publicjob creation within the social sector, andexplored the economy-wide implicationsof such an expansion for unemployment,growth of output, tax revenue, andpoverty reduction. Two high-impactfocus areas were identified: (i) earlychildhood development (ECD); and(ii) home- and community-based care(HCBC). We consider these areas of socialservice delivery particularly importantfrom a gender equality perspective.
Across the world, especially amongpoor households that cannot purchase‘care’ services from the market, it is theunpaid work of women that typically fillspublic-sector care gaps. In South Africawomen spend more time than menon unpaid care work, which of courseincreases in the context of povertyand unemployment.
In contrast to adult men, women perform75 per cent of all unpaid work, includingcare for sick and permanently ill people(from malaria and TB, and people livingwith HIV/AIDS) and for young children—almost always with meagre means andin impoverished conditions. In SouthAfrica the two care areas of ECD andHCBC are critically interconnected.
Due to the high prevalence of HIV/AIDSamong those in the middle age ranges,older children and older women becomethe primary caretakers of orphansand/or children living in householdswith people living with HIV/AIDS.
Scaling up the social sectorin the EPWP: a simulation analysisThe monetary allocations for existingEPWP social-sector job creation, low asthey are, have been primarily focusedon facilitating skill-upgrading throughlearnership programmes.2 In contrast,the revised EPWP jobs analysed in thesimulation would provide full-time,year-round employment based onservice delivery targets (ECD for 50per cent of children, and HCBC for20 per cent of the population), thepurpose of which is to create jobs whileproviding services that reach infants,young children and the sick membersof vulnerable households.
As noted, the two pillars of our2008 simulation analysis are a gender-disaggregated SAM and time-use satelliteaccounts that we developed for theSouth African economy. We approachedour study from a macroeconomicperspective, placing emphasis ongender, race, income and povertystructures. In addition, the policyexperiment is based on a budgetaryallocation of approximately ZAR9.2billion (approximately US$935 million).
The full-time, year-round jobs thatwe propose primarily reach unskilledworkers who are members of poorand ultra-poor households. Wages arestipulated at ZAR500 per month, withsome jobs requiring higher skill levels(and thus paying up to ZAR1000).
The labour supply response is presumedto be the same for all households belowthe poverty line. It must be noted thatthe ZAR9.2 billion injection is intendednot only to provide wages for newlyhired beneficiaries but also to coverall other associated costs, ranging fromtraining fees to food and materialsused and administrative costs.The key simulation findings are:
The injection of ZAR9.2 billioncorresponds to the creation of571,505 new full-time EPWP social-sector jobs. Approximately 540,000of these are allocated to unskilledmembers of poor and ultra-poorhouseholds, and the remainingto skilled supervisory workers.Should the entire injection be
Poverty in Focus 19
dedicated to paying wages exclusively,our findings indicate that 1.2 millionjobs can be created.
Almost 60 per cent of these jobs areestimated to be filled by women;of which 56 per cent are unskilledpositions and 3 per cent skilled.Unlike all other sectors andoccupations in the economy,including unskilled ones, monthlywages received by both women andmen are identical, at ZAR500 for mostworkers and up to double that ratefor those with some level of skill.
For every three job opportunitiesdirectly created through EPWP, anotherjob is created within the formalmarket sector, for a total of 772,000new work opportunities overall.
The ZAR9.2 billion corresponds to 3.5per cent of government expenditures,or 1.1 per cent of gross domesticproduct (GDP).
The total impact on GDP growth isabout 1.8 per cent, or ZAR15 billion.The GDP growth rate increases from4.2 per cent to 6 per cent, with animplied multiplier of 1.6 (ZAR15billion ÷ ZAR9.2 billion).
New direct and indirect taxes equalto about ZAR3 billion are generated,which will reduce the overall costof the intervention by one third(assuming no unanticipated leakages).
The resultant growth is pro-poor. Theoverall incremental change in income is9.2 per cent for ultra-poor households,5.6 per cent for poor households, and1.3 per cent for non-poor households.
All EPWP-participating ultra-poorhouseholds cross the ultra-poorpoverty line, and the poverty gap isin fact reduced by 60–80 per cent.Poor households, previously locatedanywhere between the ultra-povertyand poverty lines, are lifted above thepoverty line.
Overall, social-sector job creationis more labour intensive than theinfrastructure sectors of EPWP.Therefore, from a policy perspectiveit is crucial to note that budgetaryallocations in the social sector result
in higher levels of job creation andgreater depth-of-poverty reduction.
Fiscal spaceFinancing for the proposed EPWP social-sector expansion of ZAR9.2 billion (ZAR13.3billion at 2007 prices) can take place throughone of three means, or a combinationthereof: (i) an expansionary fiscal stance;(ii) higher tax rates; and (iii) increasedtax revenues due to the resultanteconomic growth (Pollin et al., 2006).
Deficit financing. The projectedgovernment budget surplus ofZAR26.6 billion in fiscal year 2007–08could fully finance the proposedexpansion. Positive multiplier effectsof the programme would increase taxrevenue and thus contribute to thereduction of the net increase ofbudget deficit-to-GDP.
Tax financing. Financing solelythrough tax revenue would beachieved by increasing the tax-revenue-to-GDP ratio from 27.8 per cent to28.4 per cent. A one percentage pointincrease in the value-added tax rateand an equivalent one in the corporateincome tax rate would also financeexpansion of the EPWP social sector.
Growth dividend. The estimated 3.7per cent growth in real GDP duringthe 2008–09 fiscal year alone couldbring in an additional ZAR20 billion.In addition, as already mentioned,the projected Keynesian multipliereffects of this specific interventionprogramme could finance up toone third of the new spending.
Finally, it is also worth considering thestrong linkages between a job creationinitiative such as EPWP and achievementof the Millennium Development Goals(MDGs), including eradication of extremehunger, poverty reduction, and care forpeople living with HIV/AIDS; improvedchild and maternal health; and thepromotion of gender equality.
Although by no means a poverty panacea,a well-designed public employmentguarantee strategy can pay dividends.A good place to start would be to includea public employment component for allMDG-related projects aimed at physicaland social infrastructural asset creation.
The simulation study by Antonopoulosand Kijong (2008) complements theefforts of others who consider public jobcreation to be a critical part of any policymix needed to address unemploymentand poverty. One of the concerns inimplementing such initiatives is thatscarce resources may be wasted inmeaningless types of projects.
In evaluating the desirability, feasibilityand sustainability of pro-poor policy,the multidimensional aspects of povertymust be kept in mind. Thus far, littleeffort has been made with respect todrawing in marginalised segments ofthe population via the creation of jobsin the social services sector. Yet doing sohas the strong potential to contributeto many policy objectives, includingreversing outward migration andcrime trends, revitalising marginalisedcommunities, increasing human capitaland promoting social inclusion.
By reducing the unpaid care burdensof poor women, the specific jobs wehave proposed would contributeparticularly toward the goal ofachieving gender equality.
Antonopoulos, R. (2007). ‘The Right to a Job,the Right Types of Projects: EmploymentGuarantee Policies from a GenderPerspective’, Working Paper, No. 516.Annandale-on-Hudson, NY,The Levy Economics Institute.
Antonopoulos, R. and K. Kijong (2008).The Impact of Public Employment GuaranteeStrategies on Gender Equality and Pro-poorEconomic Development: South Africa,Scaling up the Expanded Public WorksProgramme — A Social Sector InterventionProposal. Project Report. Annandale-on-Hudson, NY, The Levy Economics Instituteof Bard College and United NationsDevelopment Programme, <http://www.levyinstitute.org/pubs/UNDP-Levy/EGS.html> (accessed 12 August 2013).
International Labour Organization (2013).Global Employment Trends 2013. Geneva,International Labour Organization, <http://www.ilo.org/wcmsp5/groups/public/—dgreports/—dcomm/—publ/documents/publication/wcms_202326.pdf>(accessed 12 August 2013).
Pollin, R., G. Epstein, J. Heintz and L.Ndikumana (2006). An Employment-targeted Economic Program for SouthAfrica. Amherst, MA, Political EconomyResearch Institute.
Statistics South Africa (2007). Labour ForceSurvey. Pretoria, Statistics South Africa.

20 International Policy Centre for Inclusive Growth
On 25 August 2005, India’sParliament enacted the right of ruralhouseholds to at least100 days of workannually. Now known as the MahatmaGandhi National Rural EmploymentGuarantee Act (NREGA), this law triggeredthe implementation of an employmentgeneration programme withoutprecedent in India or elsewhere.
The programme evolved rapidly.It increased the number of participatinghouseholds from 20 million in 2006/07 toa peak of 50 million in 2010/11, while thetotal number of workdays rose fromless than 1 billion to a peak of close to3 billion over the same period. Since itsinception, the average number ofworkdays per year per household hasbeen between 40 and 50 days, withlarge fluctuations across regions.
Partial evaluations report that thejobs the programme has created havecontributed to improvements in severaldimensions. These include povertyreduction, increased food consumptionin villages, in some instances increasedexpenditures on education and health,reduction of debt obligations, andreduced distress migration.
The programme may also have createduseful assets, but there are questions asto the durability and quality of some ofthese. Since projects must be executedusing labour-intensive methods thatonly require basic skills, there are limitsto the complexity and perhaps qualityof the assets that can be built.
Adding to the now wide body ofliterature on the programme, a recentstudy by Zepeda et al. (2013) useseconomy-wide modelling to assess themacroeconomic and distributive effectsof running a public works programmesuch as the NREGA.
Implementation of theNREGA is fundamentally aredistributive intervention,and the simulation resultsunderscore this.
The study finds that thewelfare of the pooresthouseholds increasesby up to 9 per cent forcertain groups in rural areasand by up to 0.2 per centin urban areas.
Here we highlight two of thesimulations put forward by Zepedaet al.—one addressing the effects ofemployment creation, and the other theincrease in land/agricultural productivityderived from the implementation of theprojects built by the programme.
Employment creation modelMirroring the actual 2009–2010programme outlays, the employmentgeneration simulation is based on apublic expenditure of 0.65 per cent ofGDP, which goes into programme wages,the purchasing of project materials andthe employment of administrative staff.
The modelling assumes that programmeemployees come from poor ruralhouseholds and generally follow thesame sex and caste mix as that observedin the official records. The increase inexpenditures is assumed to be fullyfinanced by a rise in income taxes,making explicit from the outset the‘cost’ of running such a programme.
Results indicate that implementing theNREGA has a positive macroeconomicimpact and positive redistributive effects.India’s GDP increases by about 0.4 percent. The increase in economic activityconforms to the notion of the balancedbudget multiplier but also respondsto the redistribution of income fromhigh- to low-income households.
Implementation of the NREGA isfundamentally a redistributiveintervention, and the simulation resultsunderscore this. But there are importantindirect redistribute effects as well.As income shifts from high- to low-income households and the structure ofdemand changes, activity in agriculture,food processing and light manufacturingincreases, while heavy manufacturingand services simultaneously decline.
The Benefits Outweigh theCosts: an Assessment ofIndia’s NREGA
by Eduardo Zepeda, United NationsDepartment of Economic
and Social Affairs(UN DESA)

Poverty in Focus 21
Hence, the demand for unskilled urbanand rural labour increases, while demandfor skilled labour decreases: a processdistinctly favouring poor householdsand disfavouring high-income households.These effects augment the programme’sdirect benefits to poor people in ruralareas and extend them to those inurban areas (Figure 1).
Measuring the effect on welfare as thechange in consumption after price andincome effects are taken into account,the study finds that the welfare of thepoorest households increases by up to 9per cent for certain groups in rural areasand by up to 0.2 per cent in urban areas.
On the other hand, the welfare of richhouseholds decreases by 2.0 per cent inrural areas and by 1.5 per cent in urbanareas. Even if wealthy households inurban areas are the only populationgroup that appears to be paying incometaxes in the data used by the model, the
small reduction in this group’s welfareis to be expected, as tax rates only needto increase by 2 per cent to financethe programme.
Land/agricultural productivityAccording to the Zepeda et al.simulation, implementation of theprogramme increases the price of food,which necessarily means an increasein poor people’s cost of living. Yet theincrease is small. For those enrolled inthe programme, the effect might even goundetected. But for poor households notcovered and/or only marginally receivingindirect benefits, the increase has thepotential to be a source of concern.
Thus it may be appropriate tocomplement the implementationof the programme with policies thatsupport poor households unable tojoin the programme or unable to takeadvantage of the increase in the demandfor unskilled labour.
One of the main effectsof an increase in landproductivity is, of course,a fall in the cost of food,which leads to increasesin welfare.
The Act triggers economicreactions that resultin further job creation inrural and urban areas andof jobs that are likely to betaken by poor people, hencereinforcing the benefits topoor households in ruralareas and extendingthem to those inurban areas.
Source: Based on Zepeda et al. (2012).

22 International Policy Centre for Inclusive Growth
implementation ends up imposing, atmost, small reductions in consumptionand welfare among rich urban andrural households.
The increase in land productivityassumed to happen after theimplementation of the Act reinforces theshort-term positive impact on povertyand speaks to the sustainability ofpositive poverty reduction effects.However, the finding that benefitsdo not accrue first and mostly to poorhouseholds is a drawback. Rather thanmilitating against the Act, the findingsuggests the need to reinforce provisionsaimed at improving land productivity inthe lands of poor families, since theresults are to a significant degree drivenby the acute concentration of land.
The NREGA’s employment creation andland productivity activities complementeach other well. For example, whileemployment creation raises the costof living for poor households, the
increase in land productivity reducesit. While the Act’s employment creationdirectly and indirectly redistributesincome, the land productivityconcentrates it. If employment creationhas a primarily short-term effect onpoverty, asset improvements have apotential long-term effect.
The effects of the programme are smallin all cases, but the programme is alsosmall. The programme budget is lessthan 1 per cent of GDP, and total wagepayments of the programme onlyaccount for about 2 per cent ofthe annual national payroll. Furtherexpansion and improvements in theprogramme are appropriate.
Zepeda, E., S. MacDonald, M. Panda,G. Kumar and C. Sapkota (2013). EmployingIndia: Guaranteeing Jobs for the Rural Poor.Washington, DC, and New York, NY,Carnegie Endowment for InternationalPeace and United Nations DevelopmentProgramme, <http://carnegieendowment.org/files/india_rural_employment.pdf>(accessed 7 August 2013).
The simulation addressing the effectsof the land improvement and water-harvesting projects that the programmeundertakes, among others, results inan increase in land productivity of1.5 per cent across all land holdings.
No other change is made, as thesimulation assumes that the increaseis a spin-off from the implementation ofprogramme projects. Results show thatthe increase in productivity leads, asexpected, to increases in economicactivity—for example, agriculture,food processing, services and welfare.
The effects on welfare and consumptionare positive across rural and urbanhouseholds, driving poverty down(Figure 2). One of the main effects of anincrease in land productivity is, of course,a fall in the cost of food, which leads toincreases in welfare.
The distributional impact of increasingland productivity is not as positive.The increase in welfare in richhouseholds is larger than in poorhouseholds. This is an inevitable result.The increase in productivity also has theimmediate effect of reducing the needfor low-skilled labour and hence a fallin poor households’ income at constantprices (Figure 2). This initial negativedistributive effect is accentuated byIndia’s highly concentrated landtenure structure.
To recap, the NREGA’s immediate povertyreduction effect takes place at no cost tothe economy—i.e. to GDP. It generates avirtuous redistributive effect, since theprogramme benefits accruing to poorhouseholds are not limited to the wagesdirectly paid by the Act’s jobs.
The Act triggers economic reactions thatresult in further job creation in rural andurban areas and of jobs that are likelyto be taken by poor people, hencereinforcing the benefits to poorhouseholds in rural areas andextending them to those in urban areas.
Furthermore, the cost of the programmeis manageable. While governmentprogramme expenditures are funded byan increase in income taxes, only paidby rich households in urban areas, its
Source: Based on Zepeda et al. (2012).
Poverty in Focus 23
Studies of patterns of growth andtransformation have shown that for mostcountries agriculture has been a keymotor of development. Historically,successful poverty reduction dependsnot only on overall economic growthbut, indeed, also on how much a givencountry has seen rapid progress in termsof agriculture. Despite a declining shareof output over time, agriculture can makekey contributions to poverty reduction.
These include raising agriculturalprofits and labour income; raising,via linkages, rural non-farm profits andlabour income; lowering prices for food(which increases real wages in both ruraland urban areas); and tightening urbanand rural labour markets (which raisesunskilled wages in the wider economy)(World Bank, 2007).
This classic pattern of structural changehas not occurred in sub-Saharan Africa.Agriculture remains fundamental acrossthe continent: not only does it constituteone third of GDP and half of the totalvalue of exports, but over two thirdsof the population are dependent onagriculture for their livelihoods, and over60 per cent of all employed women havejobs related to the agricultural sector.
Moreover, almost three quarters ofthe economically active rural populationare smallholders, most producing asignificant share of their own foodconsumption (World Bank, 2007).Yet, in Africa, neither the shares of valuedadded or the structure of productionhave changed much in the past 50 years.
Increases in output have occurredalmost exclusively from land extension,due to an extremely slow pace ofimprovements in land and labourproductivity. Production technology
seems frozen in time, with the same levelof fertiliser use and irrigation as in the1970s. Agriculture has not been able toprovide the basis for a structuraltransformation in sub-Saharan Africa,nor to reduce poverty and hunger,as it has for most of rest of the world(De Janvry, 2010).
Thus sub-Saharan Africa remains poorlargely due to the failure of agriculture.What is behind this failure?
First, an adverse environmentalcontext—Africa has soils with poorfertility and extreme heterogeneity anddiversity of agroecological environmentsand farming systems.
Second, a challenging policy andinstitutional context— agriculture insub-Saharan Africa is primarily rain fed,with traditional cultivation practicesoperating in a context of poorlyfunctioning markets, high transactioncosts and low levels of human capital.
Third, antagonistic public policy—thisincludes low public spending, excessiveimplicit and explicit taxation, captureof policymaking by urban elites, foodaid instead of investment in raisingproductivity, and the dismantlingof agrarian institutions understructural adjustment.
Moreover, Africa now faces adifferent international context,with the globalisation of food systems,the emergence of integrated foodvalue chains, major institutional andtechnological changes for agriculture,increasing resource scarcity and climatechange (particularly vulnerability toclimate shocks and risk management), andthe demands on agriculture to serve as aprovider of environmental services, which
by Benjamin Davis, Food and AgricultureOrganization of the United Nations (FAO)
From Protection to Production:Agriculture, Cash Transfers andPoverty Reduction in Sub-Saharan Africa
Almost three quartersof the economicallyactive rural population aresmallholders, most producinga significant share of theirown food consumption.
Cash transfers can servenot just as social protectionbut as a means of promotingfarm- and household-levelproduction gains.
The key insight is thatnon-beneficiaries and thelocal economy also benefitsignificantly from a cashtransfer programme via tradeand production linkages, andthat maximising the incomemultiplier may requirecomplementary interventionswith both beneficiary andnon-beneficiary families.

24 International Policy Centre for Inclusive Growth
provides both new challenges and newopportunities (World Bank, 2007).
Despite this failure, the future of sub-Saharan Africa continues to be more, notless, reliant on agriculture. Studies haveshown that GDP growth originating inagriculture is two to three times aseffective in reducing poverty as GDPgrowth originating outside agriculture(Ligon and Sadoulet, 2007; anddiscussion in World Bank, 2007).
Most of the recent decline in globalrural poverty is attributable to betterconditions in rural areas rather than tooutmigration by poor people. Moreover,despite globalisation, many countriesmust largely feed themselves. Foodremains imperfectly tradable becauseof high transaction costs and theprevalence of lightly traded staplefoods, such as roots and tubers.
At the household level, subsistencefarming serves as a safety mechanismin the face of food insecurity, andsupporting subsistence farmingmay be the best way to deal with highand/or volatile food prices. Increasingand stabilising domestic food production
is essential for food security, and thismeans improving the productivity,profitability and sustainability ofsmallholder farming. Kick-startingpoverty reduction requires acceleratedgrowth in staple output on small familyfarms, driven by increased productivityon those farms (World Bank, 2007).
Focusing poverty reduction: cashtransfers or smallholder productivity?It is cash transfer programmes, however,that are becoming the principal toolof poverty reduction—and socialprotection —in the low- and middle-income countries of sub-Saharan Africa.
While some types of cash transferprogrammes have explicit linkages toagriculture and rural livelihoods, such asthe Productive Safety Net Programme(PSNP) in Ethiopia, many government-ledcash transfer programmes in sub-Saharan Africa originate in the socialsector, where concern about vulnerablepopulations, often in the context of HIV/AIDS, has driven the setting of objectivesand targeting towards an emphasis onpeople who are ultra-poor, labour-constrained and/or caring for orphansand vulnerable children. As a result, mostof these programmes focus on foodsecurity, health, and nutritional andeducational status, particularlyof children.
Most beneficiaries of cash transferprogrammes, however, are subsistencefarmers. Missing or poorly functioningmarkets link production and consumptionactivities of these households.
These include credit, insurance,labour and input market failures,which constrain economic decisions ininvestment, production, labour allocationand risk-taking. ‘Safety first’—usuallyfood security—is the motto, rather thanprofit maximisation.
Livelihoods based on self-employmentactivities have implications for socialobjectives— conditioning labourallocation for adults and children(including domestic chores and care-giving), intra-household decision-making,investment in schooling and health,and food consumption, dietarydiversity and nutrition.
Investments in health and educationinduced by cash transfer programmeshave both short- and long-termeconomic benefits throughimprovements in human capital, whichlead to an increase in labour productivityand employability. However, there isgood reason to believe that cash transferprogrammes will also influence thecurrent productive activities ofbeneficiary households, since thelivelihoods of most beneficiaries in sub-Saharan Africa are predominately basedon subsistence agriculture and rurallabour markets.
The exit path from poverty is notnecessarily the formal (or informal)labour market, but self-employmentgenerated by beneficiary householdsthemselves, whether in or outsideagriculture. When cash transfers areprovided regularly and predictably, theymay help households to overcome creditand insurance constraints and manage risk.This, in turn, can increase productiveinvestments, improve access to marketsand stimulate local economies.
Cash transfers can thus potentiallyserve as an important complementto a broader rural development agenda,including a pro-poor growth strategyfocusing on agriculture. Cash transferscan serve not just as social protection butas a means of promoting farm- andhousehold-level production gains.
What evidence do we have of thelinkages between cash transfersand productive activities?1
Qualitative field work from cash transferprogrammes in Ghana, Kenya andZimbabwe has found that, while inall cases the cash transfer programmesfunction primarily as a safety net, eachhas led to increased investment inhousehold economic activities, in somecases particularly for female-headedhouseholds (OPM, 2013a; 2013b; 2013c).
The programmes were found to increasesocial capital and allow beneficiaries to‘re-enter’ existing social networks, and/orto strengthen informal safety nets andrisk-sharing arrangements. Moreover, inall three countries the cash transferprogrammes allowed householdsto reduce debt levels and increase
Most beneficiariesof cash transferprogrammes, however,are subsistence farmers.
Missing or poorlyfunctioning marketslink production andconsumption activities of these households.
Cash transfers can thuspotentially serve as animportant complementto a broader ruraldevelopment agenda,including a pro-poor growthstrategy focusingon agriculture.

Poverty in Focus 25
programme via trade and productionlinkages, and that maximising theincome multiplier may requirecomplementary interventions with bothbeneficiary and non-beneficiary families(Taylor, Thome and Filipski, 2012;Taylor, Kagin and Thome, 2013).
Despite the importance of smallholderagriculture for poverty reduction, thedirect provision of cash transfers topoor people is ascendant in termsof policy interventions.
The primary objective of most cashtransfer programmes in sub-SaharanAfrica is to improve short-term welfare(through improved consumption) andinduce greater investment in educationand children’s health.
However, what is often phrased as ‘either/or’ in policy discussion and in practiceis a missed opportunity of articulationwith broader rural and agriculturaldevelopment strategy designed toalleviate poverty.
The challenge is to find the right balancein the allocation of resources andprogramme design to optimisecomplementarity.
Asfaw, S., K. Covarrubias, S. Daidone,B. Davis, J. Dewbre, H. Djebbari,A. Romeo and P. Winters (2012).Analytical Framework for Evaluatingthe Productive Impact of Cash TransferProgrammes on Household Behaviour.Methodological Guidelines for the FromProtection to Production Project.Rome, Food and Agriculture Organizationof the United Nations.
Asfaw, S., B. Davis, J. Dewbre,G. Federighi, S. Handa and P. Winters (2013).The Impact of the Kenya CT-OVC Programmeon Productive Activities and LabourAllocation, PtoP project report. Rome,Food and Agriculture Organization ofthe United Nations, <http://www.fao.org/fileadmin/user_upload/p2p/Publications/Kenya_HH_2012.pdf>(accessed 29 July 2013).
Berhane, G., J. Hoddinott, N. Kumarand A.S. Taffesse (2011). The impact ofEthiopia’s productive safety nets andhousehold asset building programme:2006–2010. Washington, DC, InternationalFood Policy Research Institute.
Boone, R., K. Covarrubias, B. Davis and P.Winters (2013). ‘Cash Transfer Programs andAgricultural Production: The Case of Malawi’,Agricultural Economics, 44: 365–378.
Covarrubias, K., B. Davis andP. Winters (2012). ‘From Protection toProduction: Productive Impacts of theMalawi Social Cash Transfer Scheme’,Journal of Development Effectiveness,Vol. 4 No. 1: 50–77.
De Janvry, A. (2010). ‘Agriculture fordevelopment: new paradigm and optionsfor success’, Agricultural Economics, 41 (s1):17–36, November.
Ligon, E. and E. Sadoulet (2007).Estimating the Effects of AggregateAgricultural Growth on the Distributionof Expenditures. Background paper forthe WDR 2008. Washington, DC, World Bank.
OPM (2013a). Qualitative Research andAnalyses of the Economic Impact of CashTransfer Programmes in Sub-Saharan Africa.Ghana Country Case Study Report, PtoPproject report. Rome, Food and AgricultureOrganization, <http://www.fao.org/fileadmin/user_upload/p2p/Publications/Ghana_qualitative.pdf>(accessed 29 July 2013).
OPM (2013b). Qualitative Research andAnalyses of the Economic Impact of CashTransfer Programmes in Sub-Saharan Africa.Kenya Country Case Study Report, PtoPproject report. Rome, Food and AgricultureOrganization of the United Nations,<http://www.fao.org/fileadmin/user_upload/p2p/Publications/Kenya_qualitative_2013.pdf>(accessed 29 July 2013).
OPM (2013c). Qualitative Research andAnalyses of the Economic Impact of CashTransfer Programmes in Sub-Saharan Africa.Zimbabwe Country Case Study Report, PtoPproject report. Rome, Food and AgricultureOrganization of the United Nations, <http://www.fao.org/fileadmin/user_upload/p2p/Publications/Zimbabwe_qualitative.pdf>(accessed 29 July 2013).
Taylor, J.E., K. Thome and M. Filipski (2012).Evaluating Local General EquilibriumImpacts of Lesotho’s Child GrantsProgramme, PtoP project report.Rome, Food and Agriculture Organizationof the United Nations, and Washington, DC,World Bank, <http://www.fao.org/fileadmin/user_upload/p2p/Publications/Lesotho_LEWIE_2013.pdf>(accessed 29 July 2013).
Taylor, J.E., J. Kagin, M. Filipski andK. Thome (2013). Evaluating GeneralEquilibrium Impacts of Kenya’s Cash TransferProgramme for Orphans and VulnerableChildren (CT-OVC), PtoP project report.Rome, Food and Agriculture Organizationof the United Nations, and Washington, DC,World Bank, <http://www.fao.org/fileadmin/user_upload/p2p/Publications/Kenya_LEWIE_2013.pdf>(accessed 29 July 2013).
World Bank (2007). World DevelopmentReport 2008: Agriculture for Development.Washington, DC, World Bank.
creditworthiness—though in manycases households remain risk-averseand reluctant to take advantageof increased access to credit.
Based on quantitative analysisof impact evaluation data, cash transferprogrammes in both Malawi and Kenyahave led to increased investment inagricultural assets, including farmimplements and livestock.
Moreover, both programmes fosterincreased food consumption andimproved dietary diversity, with agreater share of household consumptionacquired via own farm production.
The programme in Malawi has ledto a shift for adults and childrenfrom agricultural wage labourto on-farm wage activities, while inKenya the cash transfer programme isresponsible for a reduction in on-farmchild labour (Covarrubias et al., 2012;Boone et al., 2013; Asfaw et al., 2013).
In Ethiopia, a cash transfer programmecombined with complementary packagesof agricultural support led to increasedfood security, borrowing for productivepurposes, use of improved agriculturaltechnologies and operation of ownnon-farm business activities(Berhane et al., 2011).
When beneficiaries receive the cashtransfer, they spend it. This transmits thetransfer’s impacts from the beneficiaryhousehold to others inside and outsidethe local economy, more often tohouseholds not eligible for the cashtransfer, who tend to own mostof the local businesses.
These income multipliers can bemeasured via general equilibriummodels of the local economy. Modelsconstructed for the Kenya and Lesothocash transfer programmes find incomemultipliers that range from 1.08 to 1.36,respectively, for every dollar transferred,but the multipliers are potentiallylimited by constraints in labour,capital and land markets.
The key insight is that non-beneficiariesand the local economy also benefitsignificantly from a cash transfer
1. A review of the evidence can be found inAsfaw et al., 2012.

26 International Policy Centre for Inclusive Growth
Chhattisgarh is one of the newstates in India, carved out of the stateof Madhya Pradesh in 2000. It currentlyhas a population of around 26 millionpeople, 32 per cent of whom are fromindigenous tribes. About 44 per centof its land area is covered by forests,and 77 per cent of the population livesin its some 20,000 villages. Despite rapideconomic growth and an increasein mining and related industries,Chhattisgarh continues to be oneof the poorest states in the countryin terms of average per capitaconsumption expenditure.
More than 90 per cent of Chhattisgarh’sworkforce is in the informal sector, andthe high level of poverty contributesto a critical situation of food insecurity.In 2005, 47 per cent of the children inChhattisgarh were underweight. Adultmalnutrition was also very high, withmore than one third undernourished(International Institute of PopulationStudies, 2006).
The Public DistributionSystem in ChhattisgarhAs is the case for the other states ofIndia, Chhattisgarh has a numberof food security programmes inoperation. Most are sponsored byIndia’s central government; the PublicDistribution System (PDS) programmebeing the largest.
The PDS was a nationwide programmeuntil 1997, at which point it decreased itscoverage by targeting poor families only.Under this programme subsidised foodgrain is provided to families identified asliving ‘below the poverty line’ (BPL).
Nevertheless, the PDS has been criticisedfor leakages and inefficiency as well aserrors in identifying poor households(Planning Commission, 2005).
In Chhattisgarh specifically theprogramme has suffered from severegaps. Due to its narrow targeting, itused to cover only 42 per cent of thepopulation, meaning it overlooked orleft out around half of the actual poorhouseholds in the state. Delivery wasalso deficient. Surveys conducted by theRight to Food Movement in 2003 showedthat only 28 per cent of the familiesenrolled in the PDS were receivingclose to their entitled quantity of grain.
In 2001, a Public Interest petition wasforwarded to the Supreme Court ofIndia, demanding stronger food securitymeasures in the country. In response, theSupreme Court ordered India’s centraland state governments to ensuredelivery of food entitlements, thusforcing the country’s policymakers toconsider measures to improve the PDS.
As a whole, these circumstancesgalvanised within Indian civil societywhat was by that point an alreadyburgeoning Right to Food Movement.In Chhattisgarh, the movement wasinfluential in mobilising the people.One of the results was that the stategovernment set up a High PoweredCommittee on Starvation in 2004.
This committee made an assessment ofthe PDS in tribal areas. After determiningthat the complete control of privatetraders over food distribution outletswas a leading cause of the state’spoverty, including the poor food securitysituation, it established reforms thathelped Chhattisgarh to overhaulits PDS programme.
Within a year, all the existing fooddistribution outlets in Chhattisgarhwere removed from the private sectorand handed over to local rural electedcouncils (Panchayats), women’s self-help
The PDS was a nationwideprogramme until 1997, atwhich point it decreased itscoverage by targeting poorfamilies only.
Nearly 70 per cent ofChhattisgarh’s populationdepends on agriculture; themajority of the landholdingsbeing below 2 hectares.
Decentralised Procurementof Rice Paddy began in 2002,and its purchase occursvia state-run farmers’cooperatives, which aremore farmer-friendly.No middlemen, traders orcommission agents wereallowed in the process.
Twin Strategies for Food Security andProductive Inclusion — PDS Reforms inChhattisgarh, India by Samir Garg, Advisor to Commissioners
of Supreme Court (Right to Food Case)
Poverty in Focus 27
groups and farmers’ cooperatives.This was followed by de-privatisationof the delivery chain. The financialviability of the outlets was improvedby providing working capital supportand by increasing commissions.
The number of outlets was alsoincreased from 5000 to 10,000 to alloweasier access for poor people enrolled inthe programme. The State Civil SuppliesCorporation was made responsible fortimely delivery of food grains to alloutlets. By 2006, the Right to FoodMovement’s surveys conductedunder the guidance of this author(Garg) showed that two thirds of thebeneficiaries had started to receivetheir entitled quantity.
Altogether, these inroads were an effectof interaction between civil society andstate-level bureaucracy given impetusby a national-level judicial intervention.The tangible improvements in deliveryof the PDS in fact acted as a motivator forthe incumbent political leadership, andfor the first time in many years there waswidespread belief in the PDS.
The Chief Minister, who heads the stategovernment, announced an ambitiousexpansion of PDS coverage beginning inearly 2007, and the state of Chhattisgarhdecided to increase PDS coveragefrom 42 per cent to 70 per cent of thepopulation, using the state’s resources.
The family entitlement of 35kg of grainper month was communicated effectivelyto the masses. People at the village levelgained a great deal of say as to how thePDS was monitored, given that 70 percent of families now had a stake in it.
Moreover, a voluntary group comprisedof 70,000 community health workers (alsoknown as Mitanins, or ‘friends’) in bothrural and urban areas in Chhattisgarh hasbeen playing a critical role in mobilisingcommunities around the PDS, mainly bygiving support to an effective system foraddressing grievances. Appropriate useof information technology at all levels,especially for the procurement anddistribution of food grains, also helpedto improve transparency, measureperformance and reduce delays.A survey conducted by the
Commissioners of the Supreme Courtin 2010 showed that 85 per cent of thebeneficiary families were receivingtheir full entitlement (OCSC, 2010).
Public procurement of riceReforms in the DecentralisedProcurement of Rice Paddy inChhattisgarh also helped ensure thePDS’s success. Nearly 70 per cent ofChhattisgarh’s population dependson agriculture; the majority of thelandholdings being below 2 hectares.
Rice is the most popular crop and isalso seen as the most essential part ofthe local diet. Thus it made considerablesense for Chhattisgarh to start procuringrice from small farmers and in turn makeit available to poor families at asubsidised price via the PDS.
Price support for farmers has existedin India for decades, but effective stateprocurement is a new developmentfor states such as Chhattisgarh. TheDecentralised Procurement of Rice Paddybegan in 2002, and its purchase occursvia state-run farmers’ cooperatives, whichare more farmer-friendly. No middlemen,traders or commission agents wereallowed in the process.
Chhattisgarh has set up 1888procurement centres, spread all over thestate, which means that farmers by andlarge do not have to travel more than10km to sell their produce. While directtransport to rice mills from procurementcentres saves time and money, so toodoes the novel use of on-the-spotcomputer-generated payment cheques,thus reducing corruption and delays.Quick milling and transportation reducesloss of interest, theft, drying and damage.
What’s more, all information is madeavailable to the public via the internet,thus helping ensure transparency.
Since this process started, procurementof rice paddy in Chhattisgarh has goneup from 1.5 million metric tons (MT)to 6 million MT in 2012 alone. This hasensured timely and adequate availabilityof locally grown rice all over the state,and not surprisingly Chhattisgarh hasbecome among the top contributors ofrice to the national pool (3.6 million MT).
Yearly, around 6 million MT of rice paddyworth Indian Rs80 billion (US$ 1.4 billion)is procured from around 1 millionfarmers; translating into employmentto more than 1 million farmingfamilies and another 150,000 workers(in transportation and rice mills)for almost six months a year.
A marketable surplus of rice has dulyincreased, and rice is now also seen asa cash crop and not just for subsistence.Productivity has also improved as a resultof the increased resources and efficiency.
Yet a move to include other localfoods, in addition to rice, in thelocal procurement process still seemsnecessary. The production of traditionalmillets, pulses and oilseeds would alsoincrease if they were part of the publicprocurement programme. Further, toincrease the productive inclusion ofthe poorest two thirds of Chhattisgarhfarmers who currently do not havea marketable surplus, investmentsare needed to promote agricultureproductivity, including improvedaccess to irrigation and to agriculturalextension services, and soil andwater conservation measures.
Altogether, there is compelling evidencethat Chhattisgarh has successfully scaledup and sustained its reforms in fooddistribution and procurement.
The improvement is a result of effortsspread over the last decade and notdependent on any ‘magic bullet’.The child malnutrition rate inChhattisgarh has fallen by 25 per centin the last five years, according to the2011 Nutrition Security Evaluationundertaken by the Public Health
Surveys conducted by theRight to Food Movementin 2003 showed thatonly 28 per cent of thefamilies enrolled inthe PDS were receivingclose to their entitledquantity of grain.
28 International Policy Centre for Inclusive Growth
Development Centre. It has given thestate a lot of confidence in its foodprogrammes, culminating in thelegislation of the Chhattisgarh FoodSecurity Act in December 2012, whichitself will further increase coverage ofthe PDS and reduce the exclusionof poor households.
The state has gained by movingtowards near universalisation and
de-privatisation of the PDS. Poor families’entitlements now include not only ricebut also salt and pulses. Expandingentitlements and budgetary allocationshas been crucial.
The state legislative assembly hasalso adopted a resolution againstany replacement of the PDS withcash transfers, as this would harmthe productive inclusion of farmers.
International Institute of Population Studies(2006). National Family Health Survey-3.Mumbai, International Institute ofPopulation Studies.
Planning Commission (2005). PerformanceEvaluation of Targeted Public DistributionSystem. New Delhi, Programme EvaluationOrganisation, Planning Commission,Government of India.
OCSC (2010). The report of the Office ofCommissioners to the Supreme Court.New Delhi, Office of Commissionersto the Supreme Court.
Over the last year and a half,22 million Brazilians have been liftedout of extreme poverty, a significantachievement whatever the country andtimeframe of comparison. And also anecessary one, given the challenge thecountry posed itself two years ago:to overcome extreme povertyby the end of 2014.
It might seem implausible that sucha target could be achieved in such ashort time, but those who follow Brazil’spoverty reduction efforts know that theframework for this eventual success wasbeing built a decade ago.
This article gives a brief overview of howa combination of political commitment,economic development, innovative toolsand maturation of social programmesprovided the fertile ground in which tocultivate and harvest a comprehensiveapproach to overcoming extreme poverty,the Plano Brasil sem Miséria (BSM–Brazilwithout Extreme Poverty Plan).
We also explore some of the designand implementation features that haveallowed the strategy to start deliveringstructural results rapidly, making themost of the window of opportunityopen until 2014.
Bringing about the conditions for BSMThe process that led to the establishmentof BSM began to gain ground in 2003,with the creation of Bolsa Família (BF), thenational conditional cash transfer (CCT)programme, and the beginning of morewidespread use of the Cadastro Único paraProgramas Sociais (Single Registry forSocial Programmes)—a unified databasewith socioeconomic information onpotential beneficiaries of targetedsocial programmes.
Kicking off this set of transformationswas not a trivial process. The challenges—operational, institutional and politicalalike—were huge and required massivecoordination of sustained effort. BFrepresented the first major Brazilianincursion into large-scale social policiestargeting systemic poverty, a significantparadigm shift for the country.
The programme celebrates its 10th
anniversary this year as one of theworld’s most successful CCT programmestargeting poor people, despite also beingone of the largest such programmes inthe world, reaching over 50 millionpeople. With the intergenerationalcharacter of poverty in mind, BFperfected its transfer mechanisms overseveral years and developed strong
Successive system upgradesand increasingly intensiveuse spurred by an augmentedBF turned Cadastro Únicointo a vital online toolthat involves each ofBrazil’s 5570 municipalities.
BSM’s benefits andservices are not immediatelysuspended once familiescross the extreme povertyline but remain close to it.
To lift millions of people outof extreme poverty overthe entirety of Brazil ina relatively short time,BSM’s actions andprogrammes have adirect focus on extremelypoor households, anda large-scale andnational perspective.
by Tiago Falcão and Patricia Vieira da Costa, Ministry of SocialDevelopment and Fight against Hunger, Brazil
Brasil sem Miséria: Background and DesignFeatures of a Poverty Eradication Strategy

Poverty in Focus 29
federative cooperation involvingthe Federal Government, states andmunicipalities, as well as intersectoralcoordination, especially in the fields ofeducation and health.
The Cadastro Único experiencedits own series of enhancements.In the early years entries were relativelyscarce and otherwise often duplicatedor incomplete, which compromisedits quality.
Today, however, the database provides abroad range of information on 25 millionlow-income families (81.5 million people)across the country.
Successive system upgrades andincreasingly intensive use spurred by anaugmented BF turned Cadastro Único intoa vital online tool that involves each ofBrazil’s 5570 municipalities. To maintain areliable record of the country’s poorestfamilies and their socioeconomicconditions, the Cadastro Único isconstantly updated and periodicallysubjected to intelligence proceduresthat crosscheck its data with otheradministrative records.
Alongside the expansion andimprovements in BF and the CadastroÚnico, the growth of Brazil’s grossdomestic product (GDP), improvements informal employment rates and successiveincreases in the minimum wagethat Brazil has experienced over thepast decade are among other factorscontributing to the impressive povertyreduction the country has achievedin recent years.
Political commitment, measuring progress, changing livesThe developments mentionedabove, precipitated to a great extentby strong political commitment,have paved the way for Brazil’s centraladministration to propose the bold goalof overcoming extreme poverty by theend of its term, which represents yetanother demonstration of the strengthof political leadership and will to setgreat transformations in motion.President Dilma Rousseff has placed thisgoal so high on her priority list that herpresidency’s slogan states ‘A rich countryis a country without poverty’.
One of the first decisions made regardingBSM Plan was about the extreme povertyline to be adopted. The $1.25 per personper day in purchasing power parityestablished by the United Nations forits Millennium Development Goalswas adopted. When the strategy waslaunched in June 2011, this amountequalled approximately R$70 per personper month, which, in fact, was alreadyBF’s parameter for extreme poverty.
Given that poverty is amultidimensional phenomenon,the use of a multidimensional linewas considered. But a monetaryline loses very little comparedto a multidimensional onein terms of reflecting all typesof destitution, and gains a lot interms of simplicity and transparency.Besides, the plan itself was designedwith a multidimensional approach.
In using the monetary line,it must be taken into account thatextremely poor people’s incomesare very volatile.
Therefore, BSM’s benefits and servicesare not immediately suspended oncefamilies cross the extreme povertyline but remain close to it.
The BSM Plan aims to improve thetargeted families’ lives. To that end, theimplementing agencies need to knowexactly who they are, where andhow they live.
The only tool capable of providing suchinformation regarding families spread allover the country is the Cadastro Único.It allows the State to transfer them cashbenefits, invite their members to enrolin professional training courses, offertechnical assistance and rural extensionfor those living in rural areas, and ensurethat they have access to water, amongother BSM objectives.
Municipalities are responsible for theregistration of the families, which giveslocal governments a crucial role in BSM.And all of Brazil’s 26 states, plus theFederal District, have joined the centralgovernment in the Plan, making thefederal cohesion that permeates itone of its main features.
Three pillars of BSM:
The first pillar isdedicated to providing aminimum steady income.
The second involvesproductive inclusionefforts as a meanstoward opportunitiesfor training, occupationand income generation.
The third pertainsto improved access topublic services, especiallyeducation, health careand social assistance,directing the expansionof networks to areas withthe highest incidence ofextreme poverty.
30 International Policy Centre for Inclusive Growth
Most states have launched their ownstrategies for overcoming extremepoverty, leveraging federal actions andadding local ones tailored to the ways inwhich poverty manifests itself in everypart of Brazil.1
Transfers of financial resources thatthe central government already made tohelp states and municipalities manageprogrammes and systems locallyhave been reinforced by BSM.
Design features and resultsDespite the utility of a monetarypoverty line, extreme poverty, of course,manifests itself in multiple ways beyondinsufficient income.
This is a key reason why BSM requiresintersectoral action, and hence a keyreason why the Brazilian Ministry ofSocial Development and Fight againstHunger coordinates actions executedby 22 ministries and other agencies that,along with states, municipalities, theprivate sector and the organised civilsociety, work in the three pillars of BSM.
The first pillar is dedicated toproviding a minimum steady income.
The second involves productiveinclusion efforts as a means towardopportunities for training, occupationand income generation.
The third pertains to improvedaccess to public services, especiallyeducation, health care and socialassistance, directing the expansionof networks to areas with the highestincidence of extreme poverty.
To lift millions of people out of extremepoverty over the entirety of Brazil in arelatively short time, BSM’s actions andprogrammes have a direct focus onextremely poor households, and alarge-scale and national perspective.Yet it also requires regional targetingand a structure that allows fastimplementation and outcomes.
Initiatives prior to BSM that achievedsignificant results in poverty reductionhave been enlarged and invigorated. Butthe plan has also brought innovationssuch as Bolsa Verde (Green Grant).
The intersectorality developed withinthe BF is vital to the BSM. A standoutexample is the way the Bolsa Verde—a cash transfer for poor families livingin conservation areas—is paid throughthe same smart card used by BF.
Other notable synergies include theway the network that checks healthconditionalities enables the paymentof benefits to pregnant women, andlikewise how schools with most BFstudents are given priority in theexpansion of full-time education.2
But BF still had to reinvent itself to facethe challenges of BSM. Transfers havebeen strengthened through a newbenefit whose value varies accordingto each beneficiary family’s povertygap, to allow 22 million people tocross the extreme poverty line.
The ‘active search’ strategy—designed toidentify extremely poor families that arenot yet registered in the Cadastro Único—has enabled the registration of791,000 extremely poor familiesin the programme.
Regarding some of the results inother BSM pillars, 2744 municipalitieshave enrolled 381,500 BF childrenin child care, thus receiving extratransfers of financial resources;267,000 low-income workers haveenrolled in professional trainingcourses; technical assistance, suppliesand grant transfers aimed at productiveactivities have been guaranteed for253,000 extremely poor family farmers;and 270,000 cisterns have been deliveredto the extremely poor populationliving in semi-arid regions.
The results presented so far aresignificant, but the country still hasa long way to go before it achievesthe constitutional goal of eradicatingpoverty. As has been said, the end ofextreme poverty is just a beginning.
1. Ten states complement BF’s transfers, usingthe same banking card. Some have establishedhigher extreme poverty lines for themselvesand fill in the extreme poverty gap for familiesliving in their territories.
2. Most students in Brazil attend part-time schools.
Most states havelaunched theirown strategies forovercoming extremepoverty, leveraging federalactions and adding localones tailored to theways in which povertymanifests itself inevery part of Brazil.
The ‘active search’strategy— designed toidentify extremely poorfamilies that are notyet registered in theCadastro Único—has enabled theregistration of 791,000extremely poor familiesin the programme.

Poverty in Focus 31
Ethical Family Income (EFI), createdin May 2012, is an innovative Chileanpolicy intended to eradicate extremepoverty via sustained efforts to empowerimpoverished families across the country.
EFI is aimed at the 170,000 families inChile identified as living in extremepoverty, which accounts for 2.8 per centof the population (see Figure 1), whichcorresponds to 472,732 people, accordingto the CASEN Survey 2011. Extremepoverty in Chile is defined as living onless than CLP1200 (Chilean pesos) per day(approximately US$2.33).
EFI is characterised by the commitmentbetween beneficiary families and theState to work together in the processof overcoming extreme poverty throughthe autonomy of the family.
Programmes within the EFI frameworkoperate in a targeted and customisedway, encompassing both social andemployment interventions and promotinga broad spectrum of strategies to fightsocial exclusion, including the objectiveof enhancing the capabilities of adultfamily members to find formalemployment within the labour market.
Each of these programmes entailsthe provision of cash benefits by thegovernment to a given household underthe condition that the family complieswith certain targets and duties in termsof health, education and work. Thisarticle describes the main characteristicsof EFI and how it works.
Programmes integralto Ethical Family IncomeThe Axis Programme (Programa Eje)assesses a given family’s socio-occupational and psychosocial situationand provides extended customised
Ethical Family Income:Continuous Support to theMost Vulnerable Families in Chile1
by Ignacio León Cuevas, Regional Director of theSolidarity and Social Investment Fund (FOSIS),Ministry of Social Development
support to those participatingin the programme. The family workswith the social worker to designan ‘Intervention Plan’.
The Family Support Programme is aimeddirectly at the socio-occupational andpsychosocial dimensions of povertyexperienced by families identified inthe Axis Programme as impoverished,whereby the family and/or individual(s)is integrated into an established ‘SupportProgramme’ in accordance with theIntervention Plan prepared inthe Axis Programme.
The Family Support Programmeis based on this customised workplan and intends to strengthen theresources and skills of individuals andfamilies, promoting the developmentand deployment of new resources thatfacilitate the upward mobility of families
EFI is characterisedby the commitmentbetween beneficiaryfamilies and the Stateto work together in theprocess of overcomingextreme poverty throughthe autonomy of the family.
1. This article is based on a report developed by theMinistry of Social Development and FOSIS/Chile.
Source: Ministry of Social Development, CASEN.

32 International Policy Centre for Inclusive Growth
and helping them independentlyimprove their quality of life.
a) Psychosocial Support Programme:for at least 12 months and up to amaximum of 24 months, a designatedprofessional works directly with familymembers to develop skills and
capabilities, help facilitate socialinclusion and empower independentdevelopment. Specifically:
promoting the strengthening anddevelopment of personal and familyresources, skills and capabilitiesneeded to improve living conditions;
strengthening links between familiesand the structure of social, public andprivate opportunity;
promoting and supporting theachievement of family goals througha planning process that includesall family members; and
facilitating positive connectionsbetween resources, skills andcapabilities of individualsand families.
b) Socio-occupational SupportProgramme: also lasting 12 to 24months, for adult family membersalready receiving psychosocial supportbut not currently enrolled in school,aimed at improving employability andcultivating their capacity to generateincome autonomously. For familymembers that are enrolled in the formaleducation system, their studies must becompatible with participation in theprogramme. Specifically:
reducing barriers that causeunemployment or precariousemployment situationsfor individuals;
improving skills for employment;
increasing human capital andtechnical training; and
developing opportunities to find ajob, either hired or self-employed,which will generate income andcontribute to bring family earningsabove the extreme poverty line.
A Specialised Offering intervention,aimed at managing and linkingprogrammes, services and benefitsoffered by the State and private sector,seeks to respond to potential uniqueneeds of individuals and families,providing a range of alternatives tofacilitate access to programmes, servicesand benefits while also strengtheningand developing skills and mitigatingbarriers to employability and betterliving conditions.
For services to reach users all over thecountry in a relevant, adequate andtimely manner, a Territorial Manager is
Source: Author’s elaboration.
Source: Author’s elaboration.

Poverty in Focus 33
designated to establish effectivelinks between the demand offamilies and individuals andthe specialised offerings.
Subsidies: cash transfers providedto families enrolled in the Subsystemof Social Protection and Promotion,along with other (cash) benefitsaimed at a larger population—i.e.not exclusively for extremely poorhouseholds—are meant to immediatelyalleviate poverty and its consequencesbut also tackle systemic issues for theshort, medium and long term byassociating incentives with thegeneration of human capital, particularlyin the area of health and education.
The main subsidies are:
Basic Cash Transfer per Household:lasting for a maximum of 24 months,cash is transferred to beneficiarieseach month as long as participationrequirements are met.
Duty transfers: targeting familiesthat have children less than18 years of age, this subsidyis given when a family meetsthe general requirements of theBasic Cash Transfer while atthe same time meeting requirementsrelated to health and education:
a) health controls for children:the family must have a valid healthychild control ID card; and
b) school attendance: children mustbe enrolled for the school year at aneducational institution accreditedby Chile’s Ministry of Education atthe primary or secondary level andmust meet 85 per cent attendanceduring the year.
They also need to have benefitedfrom the 2012 social allowancetransfer.
Protection transfer: a benefit paid ona monthly basis depending on theoperating period of the psychosocialsupport programme.
Achievement transfers: establishedfor those of the 30 per cent ofChile’s population deemed ‘mostsocioeconomically vulnerable’ whoat the same time, despite hardships,achieve outstanding performancein the areas of education, health,employment, household savingand/or monthly attendance inintensive or residential drugrehabilitation programmes.
o School achievement: childrenmust be enrolled for the schoolyear in an educational institutionaccredited by the Ministryof Education at the primary orsecondary level and be in the top30 per cent of their class in termsof academic achievement.
o Women workers: intended toencourage women and femaleheads of households in the mostvulnerable families in Chile to geta formal job.
Source: Author’s elaboration.
Source: Author’s elaboration.

34 International Policy Centre for Inclusive Growth
Dimensions of Indonesian povertyIn 2012 almost 30 million people livedbelow the poverty line in Indonesia,accounting for about 11.96 per centof the total population—a remarkableimprovement from 10 years earlier, whenthe poverty rate was over 18 per cent.
Indonesia’s poverty alleviationperformance2 has much to do withthe country’s strong economic growthover the last decade, even during the2008–2009 global crisis (Figure 1), whichincluded a declining unemployment rate.
Despite these achievements,consumption inequality has become adefining problem for Indonesia. For thefirst time in five decades the Gini Ratio3
has increased to above 0.4,4 which meansthat, in the context of strong economicgrowth, Indonesia’s poor peoples areattaining wealth at a much slower ratethan the non-poor.
Indonesia also faces a considerablevulnerability problem. The nationalpoverty line is constructed fromconsumption data on basic foodand non-food items collected throughhousehold surveys. Figure 2 shows thedistribution of household monthly percapita consumption, revealing a highconcentration of people living on thecusp of poverty. The vulnerable groupconsists of those who are slightlyabove the poverty line yet who, preciselybecause of their proximity to it, remain atrisk of falling below the poverty line dueto economic shocks including inflation.
Importantly, this concentration ofvulnerable households also means thatmovement around the poverty line willbe sizeable. Analysis of the 2009–2010panel household data found that therewas a 53 per cent chance that thehouseholds that were poor in 2009would have escaped poverty within ayear. However, there was a 22 per cent
chance that those in the vulnerablegroup (defined as those with consumptionlevels above and up to 1.5 times morethan the poverty line) would have slidback under the poverty line withinthe same time-frame.
Moreover, about 5 per cent of thosewhose consumption was already higherthan 1.5 times the poverty line in 2009stood a significant chance of becomingpoor in 2010. This analysis revealsfrequent movements in and out ofpoverty and, therefore, how seriousa mistake it would be for povertyalleviation programmes to only focuson those living below the poverty line.
Poverty alleviation programmes mustalso provide support to those ‘vulnerableto poverty’, to keep this group fromfalling below the poverty line. Socialprotection programmes should also beaddressing the set of social rights towhich this group is entitled.
Another key dimension of Indonesianpoverty is the unequal spatial distributionof the poor population. Indonesia is thelargest archipelago in the world, withmore than 248 million people livingin five major regions and some6000 islands.
The largest population clusteris on Java, with some 130 millioninhabitants (about 60 per cent ofthe country’s population). In 2011,approximately 57 percent of the poorpopulation lived on the island of Java,while about 5 per cent lived on theeastern islands of Maluku and Papua.However, while the poverty rate on themore-developed island of Java is around12 per cent, on Maluku and Papua it isabout three times higher than that. Thisunequal distribution of the populationraises a significant policy dilemma.Government programmes run primarilyin Java, where the majority of the poor
by Suahasil Nazara1
Despite these achievements,consumption inequality hasbecome a defining problemfor Indonesia.
For the first time in fivedecades the Gini Ratio hasincreased to above 0.4,which means that, in thecontext of strong economicgrowth, Indonesia’s poorpeoples are attaining wealthat a much slower ratethan the non-poor.
Poverty alleviationprogrammes mustalso provide support tothose ‘vulnerable to poverty’,to keep this group fromfalling below the poverty line.
Single Registry for Better Targeting ofSocial Protection Programmes in Indonesia
1. Professor in Economics, Faculty of Economics,University of Indonesia (FEUI) and Policy WorkingGroup (PWG) Coordinator at the National Team for theAcceleration of Poverty Reduction (TNP2K), Office ofthe Vice President of the Republic of Indonesia. Viewsexpressed in this article are the author’s alone. They donot represent official views of FEUI, TNP2K or the Officeof the Vice President of the Republic of Indonesia.
2. The Millennium Development Goal target of halvingthe 1990 poverty rate had already been achieved.
3. The Gini Ratio, Index or Coefficient is a numberbetween 0 and 1, where 0 corresponds with perfectequality (where everyone has the same income),and 1 corresponds with perfect inequality(where one person has all the income—and everyone else has zero income).
4. Between the mid-1960s and 2010 Indonesia’s GiniRatio ranged between 0.31 and 0.38.

Poverty in Focus 35
population lives and programmessupporting social infrastructure arereadily available. Poverty alleviationprogrammes consequently spend morein Java than in the more isolated islandsof Maluku and Papua.
This is politically hazardous becausepoverty alleviation programmes areperceived as being unable to reach thepoorest households by neglecting thosein the impoverished eastern islands, evenif the programmes are directed at themajority of the poor population.
Policy coordination challengesIndonesia’s current poverty alleviationefforts are grouped into three clusters.
The first comprises family-basedsocial assistance programmes—namely,the subsidised rice (Raskin), educationassistance (Bantuan Siswa Miskin—BSM),health coverage (Jaminan KesehatanMasyarakat or Jamkesmas) and conditionalcash transfer (Program KeluargaHarapan—PKH) programmes.
The second is the community-basedempowerment programme knownas Program Nasional PemberdayaanMasyarakat (PNPM), through which thegovernment provides direct transfersto communities, and the communitiesin turn decide on how thesefinances will be used.
The third cluster is represented by thedevelopment of micro and smallenterprises under the auspicesof the government’s credit guaranteescheme, known as the Kredit UsahaRakyat (KUR) programme.
The National Team for the Acceleration ofPoverty Reduction (TNP2K, in Indonesian)currently assumes the high-levelcoordination of all the programmeswithin these clusters. The TNP2KNational Planning Committee (or Pleno)effectively serves as a cabinet meeting,chaired by the Vice President of theRepublic of Indonesia, where strategicdirections are determined. TNP2K issupported by a secretariat comprisedof the Policy Working Group (PWG),essentially a professional think-tankwith members drawn from researchinstitutes and universities.
The Secretariat is mandated withpreparing policy inputs to cabinetmeetings and assisting in thecoordination of efforts to achieve thecurrent administration target of an 8–10per cent poverty rate in Indonesia by 2014.
The effectiveness of cabinet-leveldecisions depends on their coordinationwithin the bureaucracy at the technicallevel. The TNP2K Secretariat advocatesa knowledge-based policy process,introducing alterations in policyand programme design based oninternational best practices and evidence.The Secretariat also advocates multi-
stakeholder deliberations: ‘a goodpolicy is a result of good debates’.
The TNP2K Secretariat is taskedwith increasing the effectivenessof the poverty alleviation programmesand, therefore, focuses on addressingimpediments to programmeimplementation. The first among severalfactors preventing the effectivenessof programme coverage was disparateand out-dated targeting of poor andvulnerable households. TNP2K, therefore,mandated the establishment of the‘single registry’ in Indonesia: the UnifiedDatabase (Basis Data Terpadu—BDT).
Source: Statistics Indonesia.
Source: 2012 Susenas.
Figure 1Economic Growth, Unemployment and Poverty Rates, Gini Ratio, Indonesia, 2001–2011
Figure 2Monthly Per Capita Consumption, Indonesia, 2011

36 International Policy Centre for Inclusive Growth
Indonesian single registry:Basis Data TerpaduIdentifying appropriate beneficiariesis essential to the effectiveness of anti-poverty programmes. Cluster 1 programmesinitially used a set of widely differingtargeting mechanisms, whichundermined broad-scale effectiveness.Raskin (rice for poor households)beneficiaries were everyone in thePendataan Program Perlindungan Sosial(PPLS) 20085 database. Jamkesmas (healthinsurance) beneficiaries were decreed byIndonesia’s Minister of Health based onnames and addresses submitted bydistrict heads.6
The 2008–2009 Bantuan LangsungTunai—BLT (a temporary unconditionalcash transfer used as a response to thefinancial and fuel crises combined witha cut in fuel subsidies) made use of the2005 PSE data (as the 2008 PPLS datacollection was incomplete at that time).PKH (conditional cash transferprogramme) used the 2008 PPLS forits 2009–2011 expansion, and BSM(education cash assistance) reliedon school principals to identify poorstudents in their respective schools.
Until 2011, when Indonesia’s singleregistry came into operation, only abouta third of the poorest households—measured as the first per capita monthlyconsumption decile based on figuresfrom national household surveys—received all anti-poverty programmes,meaning there was a great deal ofexclusion error. Raskin had the lowestexclusion error, but simultaneously thehighest inclusion error—meaning thatmany non-poor households received theprogramme. BLT’s exclusion error wasrelatively moderate.
Jamkesmas was the highest in terms ofexclusion error, although it is importantto note that data for this programmewere based on health insurance claimsbeing made when beneficiaries became ill.
A move toward the single registrywas instructed by the TNP2K Plenomeeting in mid-2010. Togetherwith Statistics Indonesia,7 the TNP2KSecretariat designed the registrationmethodology. From September toNovember 2011, Statistics Indonesia
deployed approximately 120,000enumerators to register more than25 million households throughoutIndonesia in a poverty censuscommonly known as the 2011 PPLS.
Using the poverty map of the 2010Population Census, the objective wasto identify and register between 45and 50 per cent of the population whowere considered poor or vulnerableto poverty. Using the data collectedfrom these 45–50 per cent of households,proxy means testing (PMT) models weredeveloped to identify the poorest 40 percent of the population distribution.
Enumerators were instructed toconduct consultation meetings withpoor households to make sure theirvoices were heard. Two or three poorfamilies in each village were assembled,shown prelisted household names fortheir village and asked if there were anyother households in that village whichthe families thought were of similarsocio-economic levels and hence shouldbe included in the registration.
These poor families could add names,whereas the village elites (such as thevillage heads or other local publicfigures) could not, so elite bias wassignificantly suppressed.
After the data were collected andcollated by Statistics Indonesia, the dataprocessing stage was put into motion,which included, first and foremost, theformulation of PMT models for eachdistrict in Indonesia based on thenational household survey that isstatistically representative atthe district level.
A set of asset and socio-economicindicators are used to generatea consumption estimate for eachhousehold using different modelsfor each geographic area.Using these household per capitamonthly consumption estimates, PPLShouseholds can be correspondinglyranked. The BDT is then ready for useby poverty reduction programmes.
The BDT is managed by a unitunder the TNP2K Secretariat. The unithas three important tasks. First is the
5. The 2008 PPLS is the registration conducted byStatistics Indonesia as an update of the previousregistration (2005 PSE). Registration employed14 indicators to identify whether a householdwas eligible to be included in the database.
6. For the 2011 PPLS, the Minister of Health instructeddistrict heads to find potential beneficiaries based onthe 2008 PPLS. However, there was no supervision toensure that such practices were observed by alldistricts, and, more important, there were noconsequences for not doing so.
7. Indonesian Statistics Office (BPS in Indonesian).
8. The BDT website <bdt.tnp2k.go.id> is a good sourceof information in Indonesian for aggregated povertydata. Users can obtain 16 BDT-based indicators thatcan be mapped or extracted as Excel files for allprovinces, districts and subdistricts in Indonesia.The website provides interactive maps and queriesappropriate for use by local and central governmentfor planning purposes.
9. Some local governments do pay for thetransportation costs from the local budget,so beneficiaries can buy the rice at the stated priceof IDR1600/kg. In other instances, the transportationcosts were added to the price.
Raskin’s targeting,compared to otherprogrammes, is quiteprogressive: exclusionof poor households isrelatively low.
It is also important tonote that no data are100 percent flaw-free.Proper grievance andregular update mechanismsmust be in place, andthe programme mustin turn trust the localcommunities to improvebeneficiary lists.

Poverty in Focus 37
BDT programme service to providebeneficiary names and addresses fromthe BDT to all relevant programmes,including the provision of technicalsupport needed by the programmemanagers of national and various localgovernments interested in using the BDT.
The second critical task pertains toresearch to ensure the validity of thepoverty measurement methodology andconsequent targeting mechanisms aimedat improving programme targeting.The BDT unit, in cooperation with theCluster 1 team in TNP2K, conductsvarious studies and micro-simulationsto analyse different aspects of the BDTand compare them with other micro-and macroeconomic data.
The third task pertains to informationtechnology. BDT is managed using thelatest IT systems, to efficiently supportinternal and external clients.8
By the end of 2012 the BDT was usedfor targeting beneficiaries for all of theCluster 1 programmes implemented bythe Ministries of Health, Education andSocial Welfare. This required the BDT toidentify different beneficiary types andprovide the data in different formats.
For example, all poor households amongthe bottom 30 per cent of the BDT areeligible to receive Raskin; poor school-age children among the bottom 10 percent of the BDT are eligible to receiveBSM if they are enrolled in school; andthe poorest families among the bottom5 per cent of the BDT are eligible toreceive PKH. The BDT was able to providea list of potentially eligible beneficiariesbased on their estimated povertylevels and demographic characteristics.This list was then used by eachprogramme to estimate programmebudgets and implementation plans.
However, as stated earlier, the dynamicsof poverty mean that the potentialbeneficiary list could not be 100 percent accurate for any point in time, ashouseholds move in and out of povertyand change locations, demographicstructures and household composition.
Updating mechanisms for the potentialbeneficiary lists were developed specific
to each programme. Research andstudies are being conducted for eachprogramme to assess the impactof the BDT on targeting accuracy.
Using the BDT in the Raskin programmeIn 2011, Raskin distributed rice at asubsidised price to 17.5 millionhouseholds (the poorest 28 per cent).Each household is eligible to receive15kg of Raskin rice per month, at asubsidised price of around one thirdof the market price.
The state-owned company BULOGtransports the rice to a designateddistribution point, and the localgovernments pay for transportationcosts9 from the distribution to sellingpoints (primarily the village office)where the monthly rice transactionoccurs. In the past, targeting of Raskininvolved district heads providing thenames of beneficiaries to villageheads at the selling points.
Figure 3 shows that Raskin’s targeting,compared to other programmes, isquite progressive: exclusion of poorhouseholds is relatively low, whileinclusion of non-poor households isrelatively high. Both Jamkesmas andBLT have much higher rates of exclusionerrors but similar rates of inclusion errors.
Although Raskin sells rice at asubsidised price, there is no guaranteethat poor families actually have enough
money at hand when the rice arrives.Village heads, or the richer members ofthe village, sometimes pay in advanceto allow timely payment tosubdistrict collectors.
However, that comes at a cost—namely the richer households also getto buy the rice, meaning smaller amountsfor the listed beneficiaries. The villagecommunity feels that the distribution ofrice only to prelisted beneficiaries doesnot do justice to other fellow villagers.Indeed, this can be explained in partby Figure 2: concentration around thepoverty line means that vulnerablegroups share relatively similar socio-economic characteristics.
In addition, to minimise potentialconflicts, the village authority may decidethat other perceived poor householdscan be allocated some rice as well, againat the expense of the listed beneficiaries.
In its extremity, there are practices ofequal sharing among all households inthe village. All of these result in inclusionerrors indicated in Figure 3.
Indeed, the National Household Survey(Susenas) indicated that the amount ofRaskin rice received by beneficiaryhouseholds ranges between 4kg and5kg, and this amount was consistentbetween 2004 and 2010. Several otherstudies suggested regional variationsbetween 5kg and 8kg. Only in a handful
Source: 2012 Susenas.

38 International Policy Centre for Inclusive Growth
of localities did the listed beneficiariesever receive their full entitlement of 15kg,and these are usually in places where thelocal government conducts a great dealof monitoring and policy support tothe Raskin programme.
When the instruction was given tothe TNP2K PWG to amend the Raskinprogramme, the issue of targetingquickly became the focus.
The programme review conducted alsoidentified the need for much improvedpublic information and communicationof Raskin’s terms and conditions at boththe household and community levels.Hence, in mid-2012 a series of Raskinreforms were introduced, namely:
The 2012 regional distributionof Raskin allocation to 17.5 millionhouseholds was recalculated amongthe provinces and districts basedon the most recent regional povertyrates, economic growth rates etc.
New names and beneficiaries nameswere issued from BDT for eachdistrict, subistrict and villagebased on the recalculated quotasand the household rankingfrom the 2011 PPLS.
Better communication ofRaskin programme information wasimplemented for communities andhouseholds. Having extracted namesfrom the BDT, it was now possible tohave several things in place toimprove communication atthe local level:
o Posters containing thenames of Raskin beneficiariesare sent to each of the 77,000villages. It was expected thatthese posters would be put ondisplay at the village officeto inform the communityabout Raskin recipients.
o Raskin cards were sent to1.3 million pilot households.This card contained informationabout beneficiaries (names ofhousehold head and spouse,address etc.) and, more importantly,also contained a note on the
household’s rights to Raskinand terms and conditionsof receiving Raskin. Theinformation printed on the cardincluded the entitlement of 15kg/household/month and thesubsidised purchase priceof Raskin of IDR1600/kg.
o Raskin reforms also includeda new mechanism to addressupdating beneficiary data andgrievances. A village communitymeeting can remove specificnames from the list obtainedfrom BDT. Legitimate reasonsfor removing beneficiarynames include:
(i) the beneficiary has movedaway from the village;
(ii) recently deceased;(iii) name duplication; and(iv) too wealthy to continue
as a beneficiary.
Another form is issued for thevillage meeting to list a proposedreplacement beneficiary and tooversee the replacement process.Beneficiaries not includedin the list (exclusion errors)are the priority focus. Thismechanism was designedto improve transparency andaccountability at the communitylevel for beneficiary targeting andupdating Raskin programme data.
Regular research and spot checks werecarried out to evaluate the impacts ofthe reforms. A rigorous impact evaluationwould take time to do; however,several quick spot checks indicatedthat the latest reforms created renewedinterest at the community level andamong local governments regardingthe distribution of Raskin toeligible beneficiaries.
The reforms attracted a lot of mediacoverage, and many complaints weremade regarding local governments’responsibility for the quality, allocations,price and frequency of Raskinrice distributed.
There were challenges about displayingposters at certain communities, as somevillages anticipated social conflicts,
but there were also indications thatbeneficiary households received higherRaskin rice allocations.
The acceptance of the Raskin cardsvaried across regions, but there was earlyevidence that households in areas withthe cards received a greater amountof rice compared to non-card areas.Currently the TNP2K PWG is analysing noless than 5000 village-level Raskin updateand grievances forms.
Closing remarksEstablishing a reliable targeting system isvery challenging, especially in Indonesia,where previous programmes, each withtheir own targeting methodologies,have been in operation over along period of time.
Lessons from previous data collectionsin 2005 and 2008 suggest that datasuch as names and addresses must bemanaged rather than merely collected.
The management of such data mustinvolve efforts to gain trust fromdifferent stakeholders: programmeimplementing agencies, localgovernments, and down to the villagers.
It is also important to note thatno data are 100 percent flaw-free.Proper grievance and regular updatemechanisms must be in place, and theprogramme must in turn trust the localcommunities to improve beneficiary lists.As suggested by the Raskin reform,a single registry can be used toimprove a programme’s targetingand implementation. A single registry isnot only a list of beneficiaries but alsoa crucial tool for communication,updating and facilitationof grievances.
The TNP2K Secretariatis tasked with increasingthe effectiveness of thepoverty alleviationprogrammes and,therefore, focuses onaddressing impediments toprogramme implementation.
Poverty in Focus 39
The mission of the Ministry ofSocial Development (MDS) of Chileis to contribute to the design andimplementation of national and regionalpolicies, plans and programmes aimed atcombating extreme poverty, particularlyby providing social protection tovulnerable families and facilitatingtheir political, economic andcultural inclusion.1
To fulfil its mission, MDS needs togather socioeconomic informationabout vulnerable Chilean families.Social information is essential to theefficacy of public policies aimed ata country’s poorest and mostvulnerable populations.
Therefore, the Ministry’s SocialInformation Division, largely by wayof its Analysis of Social InformationDepartment (ASID), is tasked withmanaging information collectedfrom different institutions and from itsinternal departments, and applyingthis information to the functioningof the various anti-poverty programmesin operation, including the delivery ofprogramme benefits.
The ASID also manages, integratesand analyses social information aboutcitizens (ID level) to provide the necessaryelements for programme monitoring,inter-ministry coordination and the propertargeting of government resources.
ASID is itself divided into twoteams. The Sectoralists Team consistsof business specialists in charge ofcreating and managing the respectivecontracts between the Ministry and anygiven external institution or internaldepartment which has informationon vulnerable families, thus laying the
groundwork for the data exchangebetween the two sides. ASID’s DataManagement Team, on the other hand,is in charge of the database linkage,business intelligence and data mining.
The operating model for the SectoralistsTeam is as follows:
1. Identify a business and informationneed (internal or external institution)
2. Contract signing: agreement andinformation transfer conditions(social programmes and frequencyof information delivery)
3. Contract management: ensurecompliance of all contracts(control transfer of informationand deadlines)
4. Feedback: recognise fundamentalchanges in the contracts and updates.
The exchange of information from onearea to another, as per requests fromdifferent areas of the Ministry or theexternal institutions/organisations,typically follows a certain protocol:
1. Receipt of the request to theSectoralists Team
2. Submission of the Sectoralists Team’srequest to the Data Analysis Team
3. Information exchange by the DataManagement Team, according to thespecific request and standards
4. Once databases are linked and cross-checked against one another theresulting file is reviewed bythe Sectoralists Team.
5. Delivery of informationto the requester.
by Maria José Rivera Jofré, Project Director of the Social InformationAnalysis Department, Ministry of Social Development of Chile
Social Information Systemsfor Enhanced Integration and Impact:Lessons from Chile
Social information isessential to the efficacyof public policies aimed ata country’s poorest and mostvulnerable populations.
One of the futurechallenges is the creationof new contracts with moreinstitutions so as to enrichthe sources of informationavailable for processing,with the overall aim ofbuilding sound publicpolicies inside MDSand for other relevantinstitutions in the areaof social protection.
1. See: <http://www.ministeriodesarrollosocial.gob.cl/>.
2. See: <http://ris.ministeriodesarrollosocial.gob.cl/html/index.html>.

40 International Policy Centre for Inclusive Growth
The ASID also has the objectiveof creating the Register of SocialInformation, which is a data repositoryof all information regarding the benefitsfrom the government received bydifferent people in the country.This information can be consulted online,and the Sectoralists Team is in chargeof website administration.2
Data warehouse implementationTo meet the requests from differentinstitutions, and given the importance ofsocial information for decision-making,a data warehouse was installed, thusproviding a unique data repositoryfor data storage that allows betterintegration and management ofsocial information, as well as highersecurity standards. The data warehouseuses standardised concepts to make iteasier to use the data.
The data warehouse consolidatesand unifies information from differentsource systems, including differentprogrammes and benefits underthe responsibility of MDS and alsoadministrative databases (from thecontracts) that allow the verificationof information for some benefitsand improve the targeting of thesocial programmes.
Figure 1 depicts the way in whichthe data from source systems is loadedinto an operational data store (ODS),integrated with existing data and thentransferred to the data warehouse(DWH) for reporting use.
The main advantages of this new socialinformation approach are the integrationof data from different institutions(administrative databases), throughthe contracts, as well as the efficientfacilitation of requests for informationby internal divisions, departmenst and/orexternal institutions. It has also allowedthe creation of reports using specialsoftware (business intelligence) as well asthe tracking of longitudinal social andeconomic trends via historic informationby way of this same software.
What is MDS’s Social InformationDivision doing today?With the objective of collecting moreinformation for this Register of Social
Information, the SectoralistsTeam continues to monitor currentagreements, modify them when neededand also create new contracts. The DataManagement Team continues to improveaspects of data reporting to contributeto the efficient utilisation of the data fordecision-making.
A Quality Assurance Project is beingdeveloped. This includes thedevelopment and implementation ofnew software to facilitate the ongoingassessment of data quality of the sourcesystems, to apply business rules whichallow the improvement of theinformation according to the businessneeds, and to improve data quality insidethe data warehouse.
Future challengesOne of the future challenges is thecreation of new contracts with moreinstitutions so as to enrich the sources ofinformation available for processing,with the overall aim of building soundpublic policies inside MDS and for otherrelevant institutions in the area of socialprotection. There is also a need to focuson improving the delivery of information
from external institutions to thedepartment in terms of its securityand quality.
There is also a need for continuingto manage the data quality of allour source systems to ensure the goodquality of the information deliveredby the department.
Analysis of the way the data fromexternal agreements are automaticallytransferred to the data warehouse isequally important.
This must include updates to the modelsthat load data, in accordance with newchanges to the business, which is verydynamic. It is also important to improveand consolidate data reporting (businessintelligence), which is managed by theData Management Team in collaborationwith the Sectoralists Team.
All these challenges must be alignedwith the division’s objective ofcontributing to policy decision-making,and with the Ministry to bettertarget public policies to benefitChilean society.
Source: Data bases and archives.
Poverty in Focus 41
Financial inclusion, conceivedas access to and use of quality financialservices by all segments of the population,can increase the impact of governmentsocial policies and programmes andcontribute to the well-being ofvulnerable people by fostering assetcapitalisation and enabling economic,educational and labour opportunities.
Collins et al. (2010) showed that in threedifferent ‘developing’ countries—namely,Bangladesh, India and South Africa—people living in poverty and extremepoverty use a wide range of formal andinformal financial instruments to helpmeet basic needs and manageunexpected events.
This finding is valuable on multiple levels.First, it helps explain how people cansurvive on low, uncertain and irregularincome. It also counters the widespreadmisconception that poor people cannotsave or are incapable of benefitingfrom using financial services. Equallyimportant, it underscores how the needfor financial services is even greateramong poor people than amongother segments of the population.
Around the world, countries are startingto design and implement measures toaddress the lack of access and use ofquality financial services, especially bypoor households. In Peru, as in othercountries, such measures are beingorganised within a financialinclusion strategy.
Access to and use offinancial services in PeruIn the last decade Peru hasexperienced accelerated economicgrowth, accompanied by a significantreduction of poverty. Gross nationalincome (GNI) per capita increased fromUS$1980 in 2001 to US$5500 in 2011.
Furthermore, poverty has decreased from54.8 per cent of the population in 2001 to31.3 per cent in 2010. However, althoughaverages have improved, wide gapsstill remain: 19.1 per cent of the urbanpopulation continues to live in poverty,compared to 54.2 per cent of thepopulation of rural areas.1
These differences are also apparentregarding the access to and use offinancial services. Peru’s businessenvironment for microfinance isconsidered one of the best in the world(Economist Intelligence Unit, 2011).
The country has a capable andprestigious regulatory body in theSuperintendencia de Banca, Segurosy AFP (Superintendency of Banks,Insurance and Pension Funds—SBS);a wide variety of financial institutionsprovides an array of financial servicesto different segments of the population;and a law on electronic money wasissued in December 2012 which couldboost innovation in the financial sector.
Aided by this institutional framework, thenumber of Peruvian adults with a savingsaccount increased by almost 40 percentagepoints from 2007 to 2012 (SBS, 2012).
However, bank penetration, measured asthe ratio of loans to GDP, was only 29.84per cent in June 2012 (ibid.). The presenceof formal financial institutions in ruralareas is scarce, as is the supply offinancial services suited to meet theneeds of the population. As a result,rural citizens in Peru tend to be neitherinformed about the financial system norinclined to use formal financial services.
A financial inclusion strategyfor the vulnerable populationCreated in October 2011, Peru’s Ministeriode Desarrollo e Inclusión Social (Ministry of
Financial Inclusion in Peru’sDevelopment and SocialInclusion Agenda by Gabriel Arrisueño Fajardo,
Ministry of Development and Social Inclusion of Peru
Around the world, countriesare starting to designand implement measuresto address the lack of accessand use of quality financialservices, especially bypoor households.
In Peru, as in other countries,such measures are beingorganised within a financialinclusion strategy.
Rural citizens in Peru tend tobe neither informed aboutthe financial system norinclined to use formalfinancial services.
1. All Peru indicators were obtained fromthe World Bank website,<http://data.worldbank.org/country/peru>(accessed 6 August 2013).

42 International Policy Centre for Inclusive Growth
Development and Social Inclusion—MIDIS)has the main mandate of fostering socialinclusion, understood as the situation inwhich all citizens can exert their rights,access quality public services and possessthe essential capabilities to takeadvantage of the opportunities thateconomic growth currently presents,such that social origin or birthplace donot constitute obstacles to participationin the national community in equalconditions (MIDIS, 2012).
MIDIS is designing a financial inclusionstrategy for Peru’s vulnerable population.As a dimension of social inclusion,financial inclusion can enhance theimpact of different social programmesand policies and contribute to povertyreduction without adding furtherobjectives to any such programmes.
MIDIS’s strategy will be framed withina broader effort, a national strategy forfinancial inclusion, led by the Ministry ofEconomics and Finance, which will targetall population segments.
MIDIS’s financial inclusion strategy isinformed by the notion of financialcapability that transcends financialliteracy. Going beyond the awarenessand comprehension of financialconcepts, financial capability includesknowledge, the ability to act on it, andthe opportunity to act (Johnsonand Sherraden, 2007).
Conditional cash transfer (CCT) programmespresent notable synergies with financialinclusion policies. Financial inclusioninterventions can enhance capabilitiesfor management, accumulation andefficient use of money, thus contributingto the improvement of living standardsof CCT beneficiaries. Among the fivesocial programmes managed by MIDIS,the CCT programme known as JUNTOS(‘Together’) holds the highest potential tocontribute to boosting financial capability.
JUNTOS provides a bimonthly transferof PEN200 (Peruvian Nuevos Soles—approximately US$65) to ruralhouseholds living in poverty andextreme poverty.
It requires beneficiaries to complywith certain conditions related to their
children’s school attendance andmedical check-ups. By the end of 2013,the programme is expected to reachmore than 700,000 households.
Banco de la Nación (BN), the State bank,is responsible for JUNTOS paymentsthrough zero-cost savings accounts.More than half of the beneficiarieshave received a Visa debit card thatcan be used at ATMs and ataffiliated establishments.
BN is the financial institution with thelargest number of branches in Peru, witha presence in locations where no otherfinancial institution operates. In areaswithout a BN presence, BN outsourcespayment delivery to cash transportationcompanies, which deliver transfers atspecific points of payment.
Beneficiaries often travel long distanceson dangerous roads. The fees per transferpaid by JUNTOS to BN to cover theoperational costs are considerablyhigher than those paid when transfersare made at a bank’s branch, sometimeseven higher than the transfer itself.
Furthermore, people paid under thisscheme have virtually no contact withtheir savings accounts; many of themdo not even know they have one.
A study published in 2011 foundthat, from a sample of 1800 JUNTOSbeneficiaries, less than 1 per cent knewwhat a bank statement or an interest ratewas. Furthermore, less than 50 per centknew that they had a savings accountat BN or what the SBS was (Trivelli,Montenegro and Gutiérrez, 2011).
To develop financial capabilities,MIDIS plans to work with vulnerablepopulations through financial educationschemes, information dissemination,and other mechanisms aimedat improving poor people’sfinancial competencies.
Recently, there has been a wide arrayof financial education interventionswith rural populations in Peru.These experiences have generatedsubstantial knowledge that shouldinform the design and implementationof MIDIS’s strategy.
As a dimension ofsocial inclusion, financialinclusion can enhance theimpact of different socialprogrammes and policiesand contribute to povertyreduction without addingfurther objectives to anysuch programmes.

Poverty in Focus 43
On the supply side, MIDIS will promoteaccess to quality financial services.By reaching areas currently untouched,financial institutions could gain asignificant number of new clients.
As Prahalad (2004) points out, activeparticipation of the private sector andthe provision of high-quality servicesare needed for poor households tobenefit from globalisation.
The poorest segments of thepopulation constitute a market thatdemands innovative solutions andoffers financial institutions opportunitiesfor growth.
Creating a market for the paymentof social transfers could prompt anexpansion of bank services to currentlyunderserved locations, through bankingagents, points of sale, mobile bankingand other mechanisms.
Different schemes, from full marketcompetition to cooperation between BNand other private financial institutions,are being assessed.
Holding a savings account can boostfinancial capability, since it facilitates‘learning by doing’ through a person’sinteraction with a financial institution.
Saving in a formal financial institution,compared to saving in assets or‘under the mattress’, allows for a moreefficient and secure use of money, doesnot entail the risks linked with creditand does not have to be linkedto a specific project.
There is also evidence that savingempowers women: it makes them feelmore secure and strengthens theirdecision-making skills (Trivelli,Montenegro and Gutiérrez, 2011).
Additionally, insurance and microinsurance coverage help mitigatethe impact of losses in health, lifeand material assets. They also help anindividual avoid unforeseen eventsthat might risk pushing poor peopleback into poverty.
Therefore, MIDIS’s strategy expectsa gradual introduction of people to
financial services in which payments,savings and insurance coverageprecede credit services. The State,through regulatory mechanisms,continuous monitoring and consumerprotection legislation, should ensurethat financial institutions provide theirservices in ways that allow vulnerablepopulations to benefit.
MIDIS’s vision is ambitious. By 2016,1 million citizens will possess the skillsto use financial services and have access toa supply of quality financial services thatmeet their needs.
This endeavour will take substantialeffort and ingenuity, as well ascoordination with different actors.It will require the design andimplementation of policies basedon evidence, continuous monitoringand evaluation and, above all, afocus on citizens’ needs.
Collins, D., J. Murdoch, S. Rutherfordand O. Ruthven (2010). Portfoliosof the Poor: How the World’s Poor Liveon $2 a Day. Princeton, NJ, PrincetonUniversity Press.
Economist Intelligence Unit (2011).‘Global Microscope on the MicrofinanceBusiness Environment 2011’,<http://issuu.com/idb_publications/docs/global_microscope_2011?mode=window&viewMode=singlePage> (accessed 6 August 2013).
Johnson, L. and M.S. Sherraden (2007).‘From financial literacy to financialcapability among youth’, Journal ofSociology and Social Welfare, 34(3): 119–146.
MIDIS (2012). Una política para eldesarrollo y la inclusión social en el Perú.Lima, Ministerio de Desarrollo e InclusiónSocial, <http://www.midis.gob.pe/files/doc/midis_politicas_desarrollo_es.pdf>(accessed 6 August 2013).
Prahalad, C.K. (2004). The Fortune at theBottom of the Pyramid: Eradicating PovertyThrough Profits. Upper Saddle River, NJ,Wharton School Publishing.
SBS (2012). Perú: Indicadores de InclusiónFinanciera de los Sistemas Financiero,de Seguros y de Pensiones. Lima,Superintendencia de Banca, Seguros yAFP, <https://intranet1.sbs.gob.pe/estadistica/financiera/2012/Junio/CIIF-0001-jn2012.PDF>(accessed 6 August 2013).
Trivelli, C., J. Montenegro and M. Gutiérrez(2011). ‘Un Año Ahorrando: PrimerosResultados del Programa Piloto“Promoción del Ahorro en FamiliasJUNTOS”’, Documento de Trabajo, No. 159.Lima, Instituto de Estudios Peruanos.
Conditional cash transfer(CCT) programmes presentnotable synergies withfinancial inclusion policies.
MIDIS’s strategy expectsa gradual introduction ofpeople to financial servicesin which payments, savingsand insurance coverageprecede credit services.

Pove
rty
in F
ocus
No.
25
- Se
ptem
ber
201
3.
International Policy Centre for Inclusive Growth (IPC - IG)Poverty Practice, Bureau for Development Policy, UNDPSBS, Quadra 1, Bloco J, Ed. BNDES, 13º andar
70076-900 Brasilia, DF - BrazilTelephone: +55 61 2105 5000
E-mail: [email protected] URL: www.ipc-undp.org