poverty, inequality and the labor market · of poverty, inequality and the labor market ,with ......
TRANSCRIPT

Research | Training | Policy | Practice
Poverty, Inequality and the Labor Market
Poverty 101 Workshop
June 3nd, 2013 Tim Smeeding
Professor of Public Affairs and Economics Director, IRP

Ingredients and topics
• This is the way I would approach the 101 course subtopic of poverty, inequality and the labor market ,with segments which you can expand/contract to fit your needs
• There should be overlaps between this presentation and the ones on causes of poverty , the demography of poverty, and on the safety net
• At the same time, I cannot cover everything and many times the way topics are addressed is important: ‘living wage’ s v ‘minimum wage’ is a good example
• I hope you will help me fill in the holes as we move along • Bonus slides on labor market inequality at end

Lecture Outline
A. Introduction to why labor market is important B. Issues to be addressed: B1. Family income package and labor as part: working poor, single parents work barriers B2. The work related safety net – for mothers especially B3. Recent trends and worries: the Great Rescission (GR) unemployment , poor jobs, as well as low wages –especially for young and less educated ; minimum wage B4. The ex incarcerated – a major (not minor) issue C. Wrap up :Back to the income package [Bonus slides at end ]

A. Labor Market Importance
• American Values: - self sufficiency and economic independence - high esteem of work in America - “tax-payer not tax-eater” • Economic mobility and the American dream:
access to home buying and the chance to save • Ability to support a family ( “marriage-ability”) • Changing wage inequality : the GR and the rest
of the 21st century

B1 The Family Income Package:
• What is the proper balance amongst the following elements :
-”SELF” income from earnings ( wages and hours; self-efficacy and value of work is a good -too many work hours at low wages is a bad) -”PUBLIC SECTOR” income support package (universal vs. means tested; cash vs near cash ; refundable tax credits ) - “FAMILY” family and parental support ( “ fathers ”; intergenerational relations ; “ doubling-up” )
• Need for labor income depends on composition and stability of family and on the income support package
B2 Earnings and Economic Independence as a Long Run Goal
• Couples vs. single parents : sharing work and kids and living spaces, pluses and minuses
• Earnings and qualifications ( “human capital”— work skills and knowledge)
• Men ( marriageable ?) vs. women (single parents ) • “Work” goals vs. “income” goals in income
maintenance programs - compare TANF to UK -how many programs should have work requirements ?

The working poor • How much should an able bodied non elderly
person be expected to work? • Can you survive on work/earnings alone or do
you need more ? for example: - help with child care and work expenses ( e.g. a car !) - earnings of partner/ spouse - earnings of ex- spouse or unrelated father of child ( who we presume will be paying child support) -public income support tied to work ?
• Who are the “working poor”?

The poor DO work: earnings shares of income for the poor and the
extreme poor( incomes less than 50% poverty line)
8
05
10152025303540455055
Earnedincome
CashWelfare(AFDC,TANF)
FoodStamps
Unemp.,Worker'sComp.,
Veteran'sPayments
ChildSupport,Alimony
CashWelfare
forDisabled,
SSI
Official Poverty, 2010Extreme Poverty, 2010
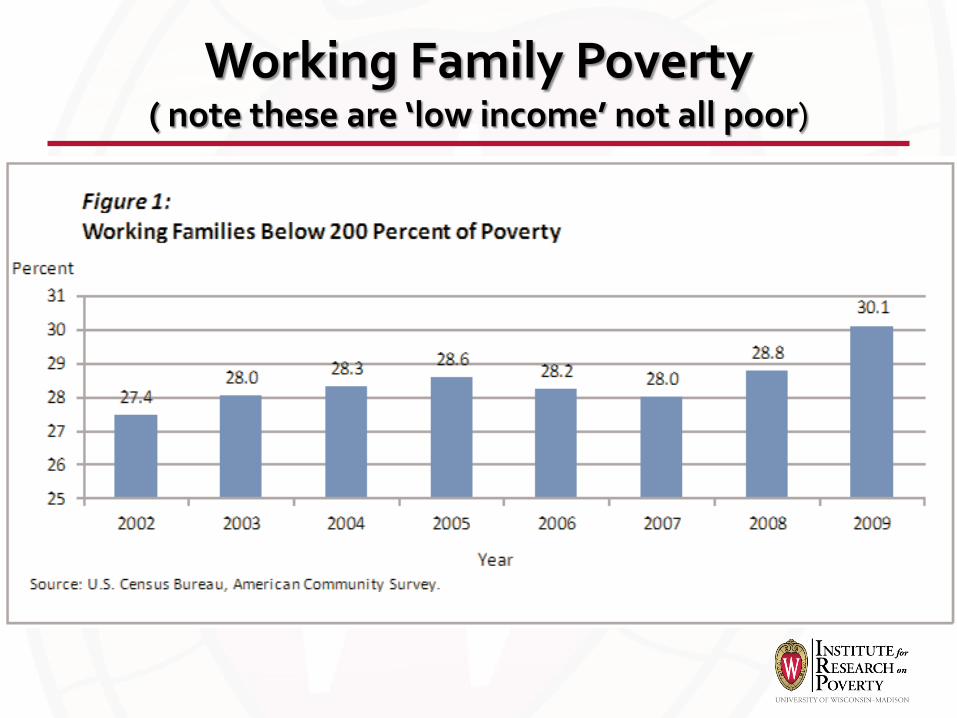
Working Family Poverty ( note these are ‘low income’ not all poor)

Working poor (below 100% poverty line ) [BLS 2013: http://www.bls.gov/cps/cpswp2011.pdf ]

BLS 2013: on working poor ( below 100 % poverty)
• Part-time work is only half the problem. About 4.4 million people who usually worked in full-time jobs were classified as working poor in 2011 (about 4% of all full-time workers., but 14% of part-time workers who were classified as working poor) .
• It’s a lot of hard jobs. The service sector accounted for 3.3 million of the working poor in 2011. About 13% of all service workers were classified as working poor. About 17% of workers in farming, fishing and forestry jobs were part of the working poor.
• Job loss is a leading problem, but not the only one. The working poor made up about 7% of the nation’s labor force in 2011, up from 5.1% in 2007. About 39% of the working poor in 2011 experienced unemployment during the year.
• About 6% of the working poor faced three major problems at some point in 2011: low earnings, unemployment and involuntary part-time work
• Schooling matters. One in five people (20.1%) with less than a high school diploma who were in the labor force for half the year were classified as working poor in 2011 (high school graduates with no college, 9.2%.; workers with an associate’s degree,4.6%.;workers with a bachelor’s degree or higher, 2.4%
Single parent work and family issues
• “Single unmarried parents” are not all “lone” parents • Many low income single parents, especially with young
kids, cannot afford to live alone ( low wages , need for child care, need for help with rent, etc.) , and so family and/or “fathers” often co-reside
• Being a mother and being a parent forced to work to survive makes life difficult
• Unmarried mothers are worse off than divorced mothers ( e.g., in terms of child support received )
• Single parents work more hours than married parents

Multiple barriers to FY-FT work for many unmarried single parents
• Poor education, work experience, work norms, job skills
• Lack of support from father/other parent of child/ children
• Perceived discrimination • Transportation problems • Mental health and substance abuse issues • Physical health problems ( mom or child) • Child care issues

Effects of Barriers on Work (mid 2000’s)
• 81 percent with no barriers worked • 65 percent with 2 barriers worked • 52 percent with 3 barriers worked • But only 35 percent with 4 barriers worked
• Positive effect of having a car on work and
on earnings was larger than having a HS degree !
Work and welfare • Market work trends for former or would be welfare
clients in the 1990s and early 2000s were up and then flat until they fell in great recession
• Employment may have a positive effect in ways other than income sufficiency –e.g. self worth
• Pictures of ‘welfare mothers’ in USA (vs. say UK, CN) : US has few combiners of work and welfare at one time ; some cyclers ; but no more ‘welfare reliant’ mothers due to time limits and state work rules
• Many PT wanting more hours

Helping the working poor with kids make ends meet– the safety net
• How the safety net has changed : - TANF has disappeared in many states - EITC/CTC + SNAP have taken on a huge role - EITC : “on the books” work support program • Other systems play +/- roles too : - “+ or –” family support ??? - “-” Unemployment Insurance (UI) - “-” job training funds - “+” Medicaid, SCHIP and now ACA

Annual Expenditures, Means-Tested Programs (Billions of 2010 Dollars)
How income support programs to help poor families, esp. w/ kids, have changed

THE EITC (and refundable CTC’s) • Humble 1975 start, expanded in 1996 and again in 2009 (
under ARRA) which added more for families with three kids • 99 percent get one time payment –so ‘forced savings’
followed by windfall in late winter and room for infra-marginal changes (car, apartment, etc.)
• Federal refundable EITC and refundable CTC’s were about $76 b. in 2011 and in 2012
• Federal and state EITC, plus refundable child credits, plus over withholding , plus other ARRA tax credits, plus payroll tax holidays --all add up to much more than just fed EITC alone !
• 40 percent wage subsidy up to first ‘kink point’

Basic EITC and rest of credits

More with state add-ons, CTC and other credits : WI (2010 version)
• • Benefits for workers, subsidy rate as high as 40% up to $20,000 (marrieds), then phased out; expanded in 1980s/1990s
• Distributionally, helps those most in the $10K-$30K range • Research: positive effects on LFP of single mothers, zero on
men, small negative on hours of married women • Generally taken as a refund and single mothers use to draw
down debt


“Welfare to Work Programs”: How Well Do They Work?
• Bottom lines on job training: a declining mess but some long term decent returns, if you allow time for training and education to have an effect (e.g., GAIN ;Job Corps; JOBS plus; WIA; Career Academies, some technical college and certificate programs)
• Current issues—work oriented system with no work, should we make public works jobs ?
• What else is valuable in terms of a conditional response to joblessness and/or low wages ? e.g. education instead of work to fulfill TANF requirements; UI ‘lump sum cash outs’ for tuition and training ?

Some Tentative Summary Statements on Work, Single Parents and Poverty
• Most are still poor, even with work and SNAP and most cannot work full-time full-year
• The jobs are not plentiful and the pay is modest at best (earnings alone wont do)
• More ‘work first ‘ and less education has produced an under skilled workforce
• Personal barriers to work are still very large for many
[Now on to more general and recent issues --]

B3. GR ,three big ‘employment crisis’ issues, the working poor and minimum wages
• First , the jobs crisis is cyclical driven by the steep drop in aggregate demand that is still below pre-recession levels , even if real GDP per capita now exceeds the fourth quarter 2007 peak
• Second, the jobs crisis has produced long-term unemployment and skill decay , which moves the situation from cyclical to structural ,with long term joblessness for the least skilled workers
-Result 19 % American men 25-54 ,and 34 percent of all workers 16-64 , are not working –largest fractions ever since 195o, and we have the longest average duration of unemployment since 1950 with 3.5 million out of work 15 months or more • Third, changes in skill and job demand are secular, arising from the
merger of globalization and the I.T. revolution with rising skilled labor productivity and the increasing demands of the workplace for skilled human capital and work flexibility

(Cyclical ?) Employment decline through October 2012 vs. past recessions
Note: GR lasted 18 months, according to NBER Source: Bureau of Labor Statistics. Chart by Amanda Cox and Catherine Rampell, 11-2-12 NY Times

Job changes over the course of the GR

What do these changes say about changing job quality ?
• In the low skill/low wage service sector, especially retailing, businesses find it expedient to keep millions of people who want full-time jobs in part-time work (ACA?)
• Other routine occupations that don’t face daily demand fluctuations, such as warehouse work, have been converted to robotics or to contingent / ‘contracted out’ jobs , to enable management to cuts costs by employing contract employees, without benefits (no health care, pensions, paid leave)
• The high skill sector employs mainly college grads, with good non-cognitive skills who can work independently, multi-task and are paid much better, with benefits
• And you can see growing inequality in pay for each type of job

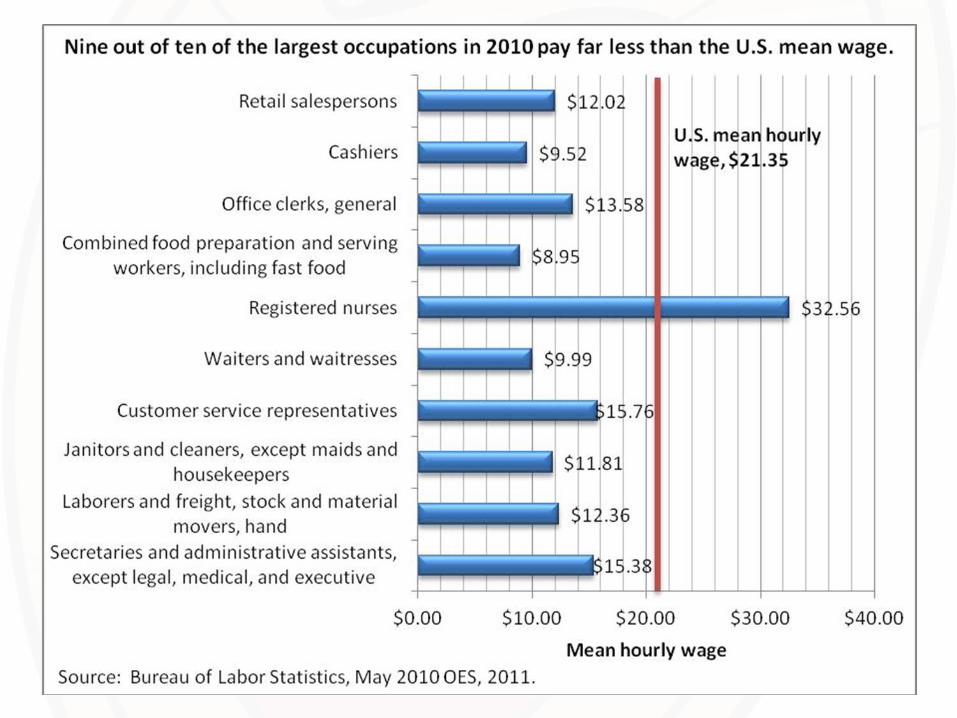
How much do jobs pay and what you need to earn in order to avoid poverty?
• SPM for family of 3 is about $20,000 per year after payroll taxes , child care expenses and health expenses ,so about $12 an hour ‘gross wage’ needed for full year full time work to avoid poverty for 3
• The jobs below don’t all measure up—especially the least skilled ones
• Most single parents cannot work full year full time without help for child care and health care
• Should we expect single parents with a young child to work FY/FT when child is under say age 3?

Popular jobs do not pay well

Pay Issues and “Wage” Issues
• Minimum wage is at $7.50, so far ; while ‘living wage movement’ says $15.00 per hour- or more- is needed
• Minimum wage is one route (have they just about hit limit– or can we do $9.00 an hour ) ?
• “Living wages” are empty term– what is a “living wage “? How is that level determined? Same level in NYC as in Fort Smith , Arkansas ?
• Living Wages are not family size adjusted ( one worker vs. two at this wage level ) !
How about that minimum wage ?
• Tough one– on one hand, higher min. wage makes work more worthwhile, as long as it does not reduce work too much or for the wrong people
• On other hand, more than half of minimum age workers were in middle income or higher households in 2000’s– more in lower income units now
• EITC more target effective for helping working poor) • Minimum wage has deteriorated in real terms (
below), does $9 an hour seems reasonable ?

Erosion of Minimum Wages

B4. The ex-incarcerated Men,Jail and Earnings
• Cumulative risk of imprisonment grows steadily for all types of men, and at all levels of education ,1979 to 2003 (since flat)
• By age 30 , more than half of all black men, and more than 25 percent of other men, who are high school drop outs will have been in prison on parole or on probation at least one time .
• About half of all incarcerated men are fathers

Getting worse—until 2003

Big negative effects on work and earnings

Aggregate earnings changes are huge

And they are concentrated at the bottom

Bottom Line :The GR is the ‘Perfect Storm’ for Younger Undereducated Men
• A perfect storm of adverse events is now being experienced by younger undereducated men, their children, and the mothers of their children. The Great Recession of 2008 to 2010 has severely limited legitimate work opportunities, reflecting longer-term structural as well as cyclical employment issues. High rates of incarceration further limit job opportunities and keep fathers from their children. Most men (and women) who have children early on in life out of wedlock have at least one more child with another partner, and marriage rates are low while divorce rates are subsequently high. Public policy allows child support obligations to build while fathers are in jail or out of work. Few income maintenance programs (e.g. UI) serve this population. As a result of all these forces, young men are suffering rising poverty; their families are extremely unstable; and these fathers, mothers, and many young children are in desperate economic and social situations.
Source : Smeeding, Garfinkel & Mincy , ANNALS May 2011: Introduction

C. Wrap-up : Back to the Income Packaging Problem
We have turned the welfare poor into the working poor--what is needed (besides luck and coordination) to make it work out better and escape poverty in LR ? 1. Child support (coming only slowly, but pass
through seems to work IF absent dad has job ) 2. Work and tax policy The EITC and other tax
credits, but could be better integrated with rest of system
3. SNAP , some large numbers now—but average benefit is still just $401 a month, or less than $5000 a year

What else helps the income package ?
4. Public housing less responsive 5. Child care Who, when, where, how much ( may be biggest issue for work for single parents) 6. Expanded federal role in ECE ? 7. Overcoming work barriers (e.g., ‘Way to Work for car; better health care access; aid for mental illness) 8. Promoting savings to reduce effects of income
instability when employment fails ) 9. Avoid jail at all costs

Questions ?
• Ask, or email [email protected]
• Bonus Slides on earnings, Wages and Inequality ( including the GR and longer term trends follow )
• See also lecture : “The Enduring Effects of the Great Recession” at http://www.wisconsinacademy.org/video/enduring-effects-great-recession

Earnings, Wages and Inequality More Generally
• Summary charts : - The disconnect between wages and
productivity - Differences in employment - Differences in wages - Some WHYs ? - Role of education and skill building • Where has the income growth since the GR
gone ? Capital vs Labor

Summary #1: productivity vs. pay (especially for bottom group)
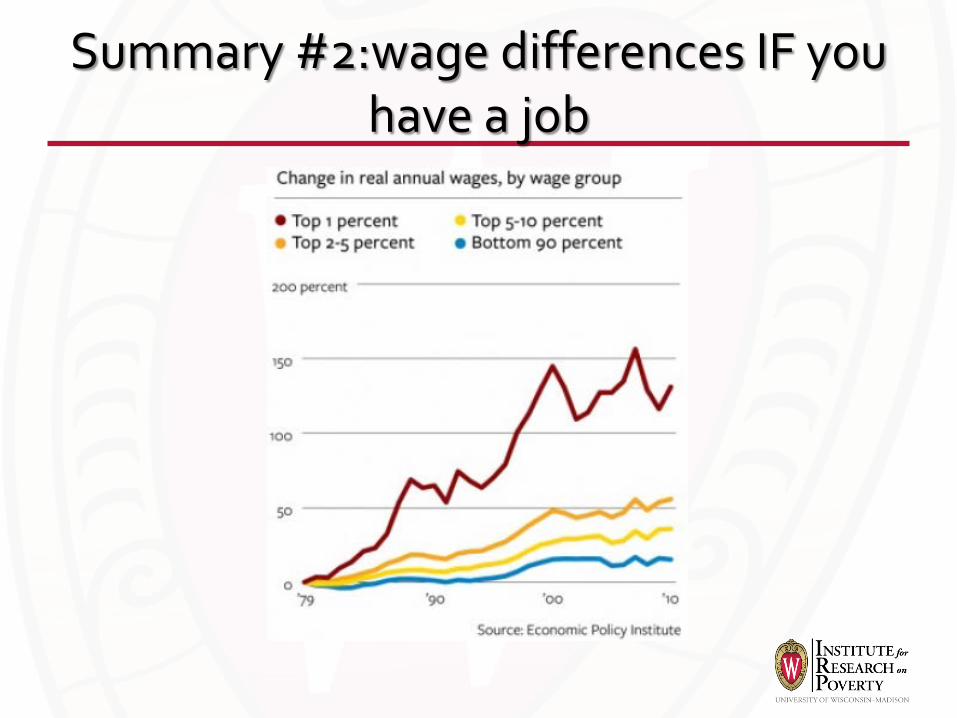
Summary #2:wage differences IF you have a job

Summary #3 :getting a job– who is employed ?

And Summary #4 : at the end of the day, how much do you earn?
Why?
• Declines in manufacturing and construction– the older paths to the middle class for high school students , and with them, the unionization movement
• Who owns the robots ? • The declining value of the minimum wage • The rising returns to education where
demand(and wages) far outstrips supply • Lack of political voice for labor

Decline in Manufacturing Sector

Decline of Labor Unions (now at 11 percent in 2013)

Education and the importance of investments in human capital
• Human capital--skills and knowledge of workers --are paramount in an era of changing skill demands
• 21st century demands more human capital for societies to advance and highest/best trained (especially above BA level) in most nations are increasingly better off
• Not everyone needs a bachelor’s degree to succeed, but all workers need better basic skills , even those with less than a 4 year college/ university education

Unemployment Rate by Educational Attainment (1979 to 2011)
0%
2%
4%
6%
8%
10%
12%
14%
16%
18%
20%
1979 1982 1985 1988 1991 1994 1997 2000 2003 2006 2009
Less than High School
High School Only
Some College
Bachelor's
Advanced Degree
Source: Authors' Analysis of CPS ORG Files (various years), CEPR extracts.

Employment by Education Level:2004-2012
Source: RBC Capital Markets US Market Economics, monthly series, data through June 2012.

Differential and growing college completion rates for persons from low-income and high-income families

So where has the nation’s income growth gone?
• For decades, two-thirds of the income of most rich nations has been wage income; one-third has been dividends, capital gains, interest, rent, etc.
• Since 2000, labor's share of income fallen to about 55 percent, the lowest share of GDP since first record (1947) and capital’s has risen to 45 percent .
• More recently, between 2009 (2) and 2011 (4) corporate profits captured 88 per cent of the growth in real national income while wages and salaries accounted for only slightly more than 1 per cent of the growth in real national income

Corporate Profits/GDP (red) and Wages/GDP (blue)

Who Suffers During Recessions? Hilary W. Hoynes, Douglas L. Miller, and J.Schaller
(NBER Working Paper No. 17951 Marcy 2012)
• We find that the impacts of the Great Recession are not uniform across demographic groups and have been felt most strongly for men, black and Hispanic workers, youth, and low education workers. These dramatic differences in the cyclicality across demographic groups are remarkably stable across three decades of time and throughout recessionary periods and expansionary periods. For the 2007 recession, these differences are largely explained by differences in exposure to cycles across industry-occupation employment.