poverty and the state of nutrition in india - nhriapjcn.nhri.org.tw/server/apjcn/22/3/326.pdf ·...
TRANSCRIPT

326 Asia Pac J Clin Nutr 2013;22 (3):326-339
Review Article Poverty and the state of nutrition in India Kiruba S Varadharajan MD 1, Tinku Thomas PhD2, Anura V Kurpad MD, PhD1,2 1Department of Physiology, St John’s Medical College, Bangalore, India 2Division of Epidemiology and Biostatistics, St John’s Research Institute, Bangalore, India
India is often thought of as a development paradox with relatively high economic growth rates in the past few years, but with lower progress in areas of life expectancy, education and standard of living. While serious ine-qualities in growth, development and opportunity explain the illusion of the paradox at the country level, still, a significant proportion of the world's poor live in India, as do a significant proportion of the world's malnourished children. Poverty and undernutrition coexist, and poor dietary quality is associated with poor childhood growth, as well as significant micronutrient deficiencies. Food security is particularly vulnerable to changes in the eco-nomic scenario and to inequities in wealth distribution. Migration from rural to urban settings with a large infor-mal employment sector also ensures that migrants continue to live in food insecure situations. While food produc-tion has for the most part kept pace with the increasing population, it has been with regard to cereal rather than of pulses and millet production. Oil seeds, sugar cane and horticultural crops, along with non-food crops are also be-ing promoted, which do not address nutrition security, and, coupled with the increase in the consumption of pre-prepared food, may indeed predispose towards the double burden of malnutrition. Access to food is also particu-larly susceptible to poverty and inequality. Many strategies and policies have been proposed to counter undernu-trition in India, but their implementation has not been uniform, and it is still too early to assess their lasting im-pact at scale.
Key Words: poverty, food security, undernutrition, India, agriculture INTRODUCTION India is the third largest economy in the world in purchas-ing power parity (PPP) terms and has been one of the world's best performing economies for over a quarter cen-tury.1 Its GDP grew by 6.2% between 1980 and 2010 compared to a global rate of 3.3%. The economic reforms undertaken in 1992 coupled with a focus on development of national infrastructure have resulted in high growth rates; over 8% annually during most years of the past decade and, due to reliance more on domestic consump-tion, the economy has remained comparatively stable despite the recent global slowdown.2 Unemployment rates have fallen and its GDP per capita (PPP), at US$ 3,652 in 2011, has more than tripled since the 1980’s.3
Yet India is thought of as a development paradox; pro-gress in areas of life expectancy, education and standard of living has been slow and it is ranked 134 among 187 countries on the human development index.4 Over a third of the world's poor live in India, as do over a third of the world's malnourished children; 43 and 48 % of <5 year children are underweight or stunted due to chronic under-nutrition.5 Indeed childhood stunting predicts poor human capital including shorter adult height, lower attained schooling and reduced adult income.6 Anaemia preva-lence in young children continues to remain over 70% in most parts of India.7 Some 40 % of low birth weight (LBW) babies in the developing world are in India.8
The Global Hunger Index (GHI) ranks India 15th, in the league of sub-Saharan African nations. From an extreme-ly alarming situation (GHI ≥30) in the early 1990s,
though India managed to move over to the next lower stratum (alarming, with GHI between 20 and 29.9) early in 1996, progress thenceforth has been somewhat slow, especially when compared with similar emerging econo-mies such as Brazil or China, or neighbours such as Sri Lanka and Bangladesh.9 Equally, there is an increasing burden of overweight, particularly in urban areas that have seen and reaped the benefits of economic growth. This review will explore poverty and its association with food insecurity and some of its dimensions in India. POVERTY IN INDIA Poverty cannot be solely defined on economic terms, yet, an income-based definition remains the most pragmatic choice for studying poverty and is often the sole criterion used to identify potential beneficiaries of poverty allevia-tion programmes.10 World Bank estimates of extreme poverty in 2010 were that over 32.7% of the Indian popu-lation lived on less than $1.25 a day, down from more than 50% in 1994.11 Poverty is projected to fall further to 22.5% in 2015, thereby making India the only nation in South Asia that would have achieved the Millennium
Corresponding Author: Dr Anura V Kurpad, Department of Physiology, St John’s Medical College, Bangalore, India. Tel: +91-80-49466321; Fax: +91-80-49467003 Email: [email protected] Manuscript received 22 March 2013. Initial review completed 16 April 2013. Revision accepted 21 May 2013. doi: 10.6133/apjcn.2013.22.3.19

Poverty and nutrition in India 327
Development Goal of halving extreme poverty.12 Howev-er, a multidimensional approach to measurement of pov-erty, based on 10 indicators from education, health and standard of living had yielded a much higher estimate of 53.7% for 2005-06, while another 16.4% of the popula-tion were considered as being vulnerable to poverty.13
The official poverty line in India was based on the amount needed to buy a certain basket of goods and ser-vices, anchored around a minimum number of calories per day, set at 2400 for rural and 2100 for urban Indians in 1979.14 In 2009, the Tendulkar committee suggested a move away from the calorie norm and use of normative food expenditures that ensured aggregate nutritional out-comes instead, as well as inclusion of spending on educa-tion and health and abolition of different consumption baskets for urban and rural areas.15 The poverty lines thus derived permit daily energy intake of only about 1800 kcal/day, closer to the minimum dietary energy require-ment set by FAO,16 as an aggregate for all ages and ac-tivity levels for the purpose of estimation of undernour-ishment in the population; it is unlikely to allow for a productive daily existence. Nevertheless, the new defini-tion revised the number of poor from 27.2% to 37.2% of the population (41.8% rural and 25.7% urban) for the year 2004-05.15 The latest estimate of population below pov-erty line (BPL), for 2009-10 is 29.8%, or about 350 mil-lion, derived using a monthly consumption cut-off of Rs 859.6 (US $16.2) in urban and Rs 672.8 (US $12.7) in rural areas;17 which could be criticized as being unreason-ably low.
While actual numbers may be controversial, a declin-ing trend is clearly evident, although the magnitude of fall in poverty can be disputed. The proportion living below the poverty line dropped by 7.3% between 2004-2005 and 2009-2010, with rural poverty declining more (8%) than urban (4.8%).17 Such change may still be considered only modest compared to achievements of countries such as Brazil, China and Indonesia and may only reflect move-ment from extreme poverty to a less unpleasant level for most individuals; yet it is a positive step ahead.
Persistent poverty in spite of two decades of high eco-nomic growth indicates a skewed distribution and concen-tration of incomes. Even in 1993, India's Gini coefficient of 0.33 was higher than that of developed nations, such as those of the OECD group. However, it increased to over 0.375 in 2008, a trend also noted in China.18 Estimates based on surveys conducted by National Council of Ap-plied Economic Research (NCAER) reflect this growing inequality; real household consumption increased by around 3% in the top-most quintile of consumption and by less than 1% in the lowest quintile during this period.19 Such unequal growth also has geographic, class and caste dimensions. Based on 2009-10 estimates, India's heart-land states each had close to 40% or more of their popula-tion living BPL, with Bihar and Uttar Pradesh alone ac-counting for over 36% of the total poor in the country. Over one-third of the rural Indian population was BPL, while the corresponding proportion in urban areas was just over 20%. Poverty among socially disadvantaged groups such as scheduled castes (47% rural and 34% ur-ban) and scheduled tribes (42% rural and 30% urban) was much higher than other groups. Further, poverty was
highest among agricultural labourers in rural areas (50%) and casual labourers in urban areas (47%).17
The reasons for poverty and growing inequality in the background of high economic growth and decreasing un-employment levels are many. While overall levels may be low, employment opportunities as measured by the work-er population ratio have reduced by 5% for the poorest, but increased by 3% for the richest over the last decade.3 Further, over 93% of the work force is still employed in the informal sector,20 which is characterized by seasonali-ty of work, geographic and gender differentials in access, and a lack of adherence to minimum wages and access to social security benefits, leading ultimately to underem-ployment and low wages. This preponderance of self-employment and informal sector has in turn been linked to the slow transition in the labour markets.
While the share of agriculture and allied sectors to GDP had fallen to less than 15% in 2011-12, over 50% of the work force was still principally employed in these sectors.21 Rising costs of inputs, decreasing institutional financial support and largely stagnant crop yields have led to a fall in incomes from agriculture.22 The agrarian crisis also has spillover effects as the rural poor migrate to urban areas in search of better livelihoods. While mi-gration to urban areas promises improved economic status, only the rural educated middle class easily attains this.23 Low levels of education, lack of employable skills and inadequate government attention to job creation in the organized sector ensure that the rural poor settle in low level jobs in the unorganized sector and thus continue to face insurmountable odds to overcome poverty.
POVERTY AND NUTRITIONAL STATUS The inter-relationships between poverty and nutrition are well known; poverty restricts access to food required to meet daily requirements or ensure dietary diversity and thus leads to malnutrition, while malnutrition can ad-versely affect educational and economic attainments, thus perpetuating poverty. Therefore, in the existing scenario of unequal growth and poverty, it is not surprising that the burden of malnutrition in India remains high; there is therefore no surprising paradox in the coexistence of rela-tively high aggregated growth rates and high rates of malnutrition. Periodic monitoring of the nutritional status of the population is vital to measure the impact of strate-gies to improve nutrition as well as economic growth, but the latest nationally representative data for India on nutri-tional status is at least seven years old, collected during the National Family Health Survey (NFHS) 3 in 2005-06;24 any gains made in the recent years may not be clear-ly evident.
The proportion of babies born with LBW/intra-uterine growth retardation (IUGR), which is reflective of a life term of malnutrition in general and malnutrition during pregnancy in particular is estimated to be 28%,25 and to-gether with prematurity, accounts for one third of deaths in the neonatal period.26 The decline from around 35% in the 1960s to the present levels has been seriously slow. Socioeconomic differentials are obvious; the prevalence of low birth weight among newborns with reported birth weight in NFHS 3 was 21.5%; babies born in households in the lowest two quintiles of wealth index had an in-

328 KS Varadharajan, T Thomas and AV Kurpad
creased risk of being LBW (OR: 1.6, 95% CI: 1.5-1.8) in comparison to those in the top quintile. Women with 0 or <5 years of education had a 70% higher risk of LBW, compared to women with ≥10 years of education.24
Malnutrition is estimated to play a role in 57% of un-der-five deaths in the country.27 Around 50% of under five children in India were stunted in 2005-06 (NFHS 3), reflecting chronic undernutrition, while the proportion underweight (43%) is almost double that observed in sub-Saharan Africa.24 However, much of the problem of child malnutrition has become somewhat invisible, given that severe cases of acute malnutrition such as kwashiorkor and marasmus have become very rare. A comparison with data from the NFHS 2 (conducted in 1998) underscores the slow progress in combating child undernutrition. Prevalence of stunting and underweight decreased by 6% and 3% respectively, while wasting increased by 3%.28 A recent survey that covered children predominantly from 100 districts in six high-focus states in 2011 found over 58% of children to be stunted and 11% to be wasted; child underweight had fallen from 53% in 2002-03 to 42%.29 The prevalence of child undernutrition is higher in rural areas, poor households and children born to mothers with low education. In the NFHS 3 sample, the preva-lence of stunting, underweight and wasting in rural areas was higher than that in urban areas, by 11.1%, 12.9% and 3.8% respectively. Children born to mothers with no or <5 years of education were at higher odds for stunting (OR: 3.5, 95% CI: 3.3-3.7), wasting (OR: 1.9, 95% CI: 1.7-2.0), and underweight (OR: 3.7, 95% CI: 3.5-3.9). The highest odds for undernutrition were in households falling in the poorest and poorer quintiles of the wealth index.
Nationally representative data on nutritional status of school-aged children and adolescents is not available in India. However, surveys conducted by the National Nutri-tion Monitoring Bureau (NNMB) in rural parts of 9 large states in 2006 indicate that stunting and underweight are widespread even among these age groups. About 30% of 6-9 year old children were stunted and this increased to 34.2% and 36.2% respectively among 10-13 and 14-17 year olds. About 57% of 10-13 year old children and 30% of 14-17 year old children were underweight.30
More than 35% of women in the age group 15-49 and 34% of men aged 15-54 sampled in NFHS 3 were under-weight. Among ever-married women, underweight de-creased from 36% to 33% between NFHS 2 and 3.24
These figures broadly concur with prevalence estimated in the NNMB surveys, which show a slow decline in un-derweight among men and women over the years; from 54% in the late 1970’s to 37% in 2004-05 for men, and from 52% to 38% for women.30 In the NFHS 3 sample, higher risk for being underweight was associated with poverty, rural residence, low educational status and scheduled caste/tribe status.
Micronutrient deficiencies are commonly encountered in India, exemplified by iron deficiency manifesting as anaemia. Inadequate dietary iron, low folate and vitamin B-12 intake and poor bioavailability of dietary iron from the fibre and phytate rich Indian diets are some important factors associated with the high prevalence of anaemia in India.31-33 About 70% of children aged 6 to 60 months in
the NFHS 3 sample were found to be anaemic with 43% being moderately to severely anaemic.24 While more than 97% of adolescent girls surveyed in the District level Household Survey (DLHS) 2 in 2002-03 were classified as anaemic,34 recent studies including NFHS 3 indicate a smaller burden: more than half of adolescent girls and over 30% of adolescent boys suffer from anaemia. About 56% of adult women and 25% of adult men in NFHS 3 were anaemic, while 58% and 63% of pregnant and lac-tating women had anaemia. These figures are much lower than the 80% or more prevalence reported in NNMB sur-veys, DLHS 2 and ICMR Micronutrient survey.30,34,35 The lower prevalence of anaemia reported in NFHS for all age groups has been suggested to be due to methodological issues described previously.36 Among all age groups however, it has been noted that low socioeconomic status is associated with higher risk of anaemia. Anemia is simply one example of deficiency; the possibility that several other micronutrients are also likely to be deficient in poor quality and monotonous diets is very real. THE DOUBLE BURDEN While undernutrition is the predominant form of malnu-trition in India, there are reports of increasing prevalence of overweight/obesity, especially among higher socioeco-nomic groups and in urban areas. Unlike developed na-tions, where the risk of overweight is higher in lower so-cioeconomic groups, in India, higher prevalence contin-ues to be associated with urban residence, increasing edu-cation and higher wealth. It has also been noted that the urban poor and slum dwellers are at an increased risk of overweight compared to rural poor.37 While the social and economic factors leading to overweight are outside the scope of this review, it is evident that several dimensions of food production and access that are linked to poverty are, by nature of unequal distribution, linked to over-weight as well. Among all social groups, BMI ≥25 kg/m2 is more common among women, with prevalence being 15% among ever married adult women in NFHS 3, up from 11% in 1998, while about 9% of men were over-weight/obese.24
Disaggregating these estimates to the state level shows that states such as Bihar, Madhya Pradesh, Chattisgarh, Jharkhand, Orissa, West Bengal, Rajasthan, Uttar Pradesh, Tripura and Assam have overweight/obesity levels below 10%, while undernutrition levels persist at more than 35% However, it is noteworthy that all states that have over-weight/obesity prevalence above 15% continue to have underweight prevalence more than 25%, except Delhi, Kerala and Punjab.24 While the correlation coefficients of state per capita GDP for underweight are at most only moderately strong (-0.37 for women and -0.35 for men, p <0.05), overweight (0.66 for women and 0.68 for men, p <0.001) appears to be strongly associated with state in-come, indicating a greater potential for increase in over-nutrition with increasing affluence. Economic growth is often cited as a way forward in eradicating undernutrition, but Figure 1 would suggest that this effect is likely to be modest, and that societal initiatives are also needed.
FOOD SECURITY High levels of undernutrition signify inadequate and in-

Poverty and nutrition in India 329
equitable access to food, which is measured as a lack of food security. Food security has come to be defined in terms of the following dimensions: availability, access, utilization and stability.39 An analysis of these dimensions from the Indian perspective can be illuminating in under-standing the slow progress in combating malnutrition. Food availability From a country that depended on food grain imports to feed its population just after its independence, India has moved on to a position of self-sufficiency in the produc-tion of food grains, with stocks enough to tide over tran-sient lean seasons. As seen in Figure 2, food grain pro-duction has climbed steadily from a mere 50 million tonnes in 1950-51 and has reached a record output of 252 million tonnes in 2011-12, with the growth rate averaging 3.5% over this period. While agricultural growth during the early 60's occurred mainly due to increase in land under cultivation, starting in the late 60s, the Green Revo-lution took it to a different level, with the introduction of high yielding, resistant crop varieties, increased use of fertilizers, expansion of irrigation facilities and increased institutional support through credit and extension pro-grammes.40 The growth in production of cash crops such as oil seeds and sugar cane has also been impressive with over 3-fold and 6-fold increases, respectively.21 The out-put of fruits and vegetables has also increased, while from the mid-1980s, animal foods such as milk, dairy products and eggs have registered impressive increases in produc-tion. Meat production has received a fillip during the last decade.41
After the green revolution passed, agricultural policy has shifted towards securing gains in productivity and
sustaining agriculture solely through subsidies on power, fertilizers and increases in minimum support prices for procurement from farmers. The last two decades for ex-ample, have seen no major innovations in agricultural technology, nor any major projects to improve irrigation or power facilities. Yield rates of major crops including rice and wheat have become stagnant in the last decade, though production has not fallen. Oil seeds, sugar cane and horticultural crops, along with non-food crops are being increasingly promoted and have been encroaching upon the total land under cultivation, which has remained more or less unchanged. This has led to a decrease in the area under food grains cultivation from 75.5% of total cropped area in 1970-71 to 63.5% in 2007-08.40 Increas-ing diversion of surface water towards water-intensive sugarcane farming and processing is perceived to contrib-ute to water shortages in the drought prone areas of Ma-harashtra; with implications for local food crop produc-tion. Projected demand for most food groups is higher than projected growth in domestic production and sizea-ble gaps are evident, especially in case of pulses and veg-etables;42 the sustainability of the current policy approach in meeting the nutritional needs of the country's growing population, especially with uncertainties brought on by global climatic change is debatable.
Figure 3 depicts trends in per capita daily net availabil-ity (production plus imports minus exports) of certain foodstuffs. Per capita availability represents how far food production trends have been able to keep pace with popu-lation growth. Availability of the major cereals, rice and wheat has increased since independence. Quantity of oils and sugar available per day has more than tripled.21 From less than 130 g per day, the quantity of milk available per
Figure 1. Association of underweight and overweight/obesity among women in Indian states with per capita state net domestic product. A stronger association between aggregate measure of affluence and overweight/obesity than underweight at state level is evident. R2 for association of underweight prevalence with per capita state GDP=0.134, p=0.015. R2 for association of overweight/obesity prevalence with per capita state GDP=0.408, p<0.001. Underweight, Overweight/obesity, linear trend of association between under-weight prevalence and per capita state net domestic product, linear trend of association between overweight prevalence and per capita state net domestic product. Underweight is defined as BMI ≤18.5 kg/m2 and Overweight/obesity as BMI ≥25 kg/m2. Data sources: 24, 38.

330 KS Varadharajan, T Thomas and AV Kurpad
Figure 2. Trends in production of food groups, India, 1951 to 2012. Cereals and Millets, Pulses, Vegetables,
Fruits, Vegetable Oils, Sugarcane, Milk, Eggs, Fish and Meat. Production of all food groups in million metric tonnes, except i) Vegetable Oils (x 10,000 metric tonnes); ii) Eggs (‘million numbers); and iii) Fish and Meat (x 10,000 metric tonnes). Data Sources: 21, 41.
Figure 3. Per capita daily availability of food groups, India, 1950-51 to 2010-11. Cereals and Millets, Pulses,
Vegetables, Fruits, Vegetable Oils, Sugarcane, Milk, Eggs, Fish and Meat. Net availability (after accounting for industrial uses and trade) is plotted for cereals & millets, pulses, sugar and vegetable oils; estimates for other food groups are based on production alone. Quantity in gram for all food groups, except Eggs (in numbers). Data Sources: 21, 41.
Poverty and nutrition in India 331
day has more than doubled to reach 273 g in 2009-10. The quantity of eggs available has grown more than ten times, while in the past decade or so, availability of meat has also registered an increase.41 On the other hand, availability of millets and pulses has almost halved since 1950-51.21
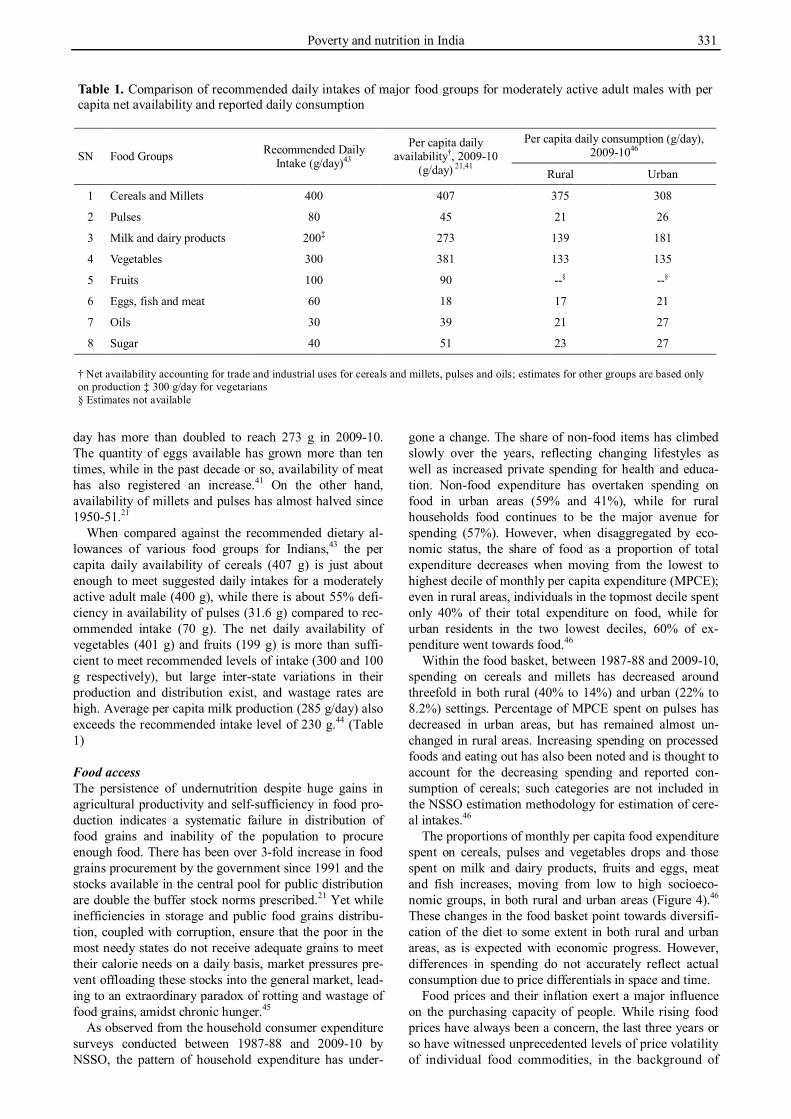
When compared against the recommended dietary al-lowances of various food groups for Indians,43 the per capita daily availability of cereals (407 g) is just about enough to meet suggested daily intakes for a moderately active adult male (400 g), while there is about 55% defi-ciency in availability of pulses (31.6 g) compared to rec-ommended intake (70 g). The net daily availability of vegetables (401 g) and fruits (199 g) is more than suffi-cient to meet recommended levels of intake (300 and 100 g respectively), but large inter-state variations in their production and distribution exist, and wastage rates are high. Average per capita milk production (285 g/day) also exceeds the recommended intake level of 230 g.44 (Table 1) Food access The persistence of undernutrition despite huge gains in agricultural productivity and self-sufficiency in food pro-duction indicates a systematic failure in distribution of food grains and inability of the population to procure enough food. There has been over 3-fold increase in food grains procurement by the government since 1991 and the stocks available in the central pool for public distribution are double the buffer stock norms prescribed.21 Yet while inefficiencies in storage and public food grains distribu-tion, coupled with corruption, ensure that the poor in the most needy states do not receive adequate grains to meet their calorie needs on a daily basis, market pressures pre-vent offloading these stocks into the general market, lead-ing to an extraordinary paradox of rotting and wastage of food grains, amidst chronic hunger.45
As observed from the household consumer expenditure surveys conducted between 1987-88 and 2009-10 by NSSO, the pattern of household expenditure has under-
gone a change. The share of non-food items has climbed slowly over the years, reflecting changing lifestyles as well as increased private spending for health and educa-tion. Non-food expenditure has overtaken spending on food in urban areas (59% and 41%), while for rural households food continues to be the major avenue for spending (57%). However, when disaggregated by eco-nomic status, the share of food as a proportion of total expenditure decreases when moving from the lowest to highest decile of monthly per capita expenditure (MPCE); even in rural areas, individuals in the topmost decile spent only 40% of their total expenditure on food, while for urban residents in the two lowest deciles, 60% of ex-penditure went towards food.46
Within the food basket, between 1987-88 and 2009-10, spending on cereals and millets has decreased around threefold in both rural (40% to 14%) and urban (22% to 8.2%) settings. Percentage of MPCE spent on pulses has decreased in urban areas, but has remained almost un-changed in rural areas. Increasing spending on processed foods and eating out has also been noted and is thought to account for the decreasing spending and reported con-sumption of cereals; such categories are not included in the NSSO estimation methodology for estimation of cere-al intakes.46
The proportions of monthly per capita food expenditure spent on cereals, pulses and vegetables drops and those spent on milk and dairy products, fruits and eggs, meat and fish increases, moving from low to high socioeco-nomic groups, in both rural and urban areas (Figure 4).46
These changes in the food basket point towards diversifi-cation of the diet to some extent in both rural and urban areas, as is expected with economic progress. However, differences in spending do not accurately reflect actual consumption due to price differentials in space and time.
Food prices and their inflation exert a major influence on the purchasing capacity of people. While rising food prices have always been a concern, the last three years or so have witnessed unprecedented levels of price volatility of individual food commodities, in the background of
Table 1. Comparison of recommended daily intakes of major food groups for moderately active adult males with per capita net availability and reported daily consumption
SN Food Groups Recommended Daily Intake (g/day)43
Per capita daily availability†, 2009-10
(g/day) 21,41
Per capita daily consumption (g/day), 2009-1046
Rural Urban
1 Cereals and Millets 400 407 375 308
2 Pulses 80 45 21 26
3 Milk and dairy products 200‡ 273 139 181
4 Vegetables 300 381 133 135
5 Fruits 100 90 --§ --§
6 Eggs, fish and meat 60 18 17 21
7 Oils 30 39 21 27
8 Sugar 40 51 23 27 † Net availability accounting for trade and industrial uses for cereals and millets, pulses and oils; estimates for other groups are based only on production ‡ 300 g/day for vegetarians § Estimates not available

332 KS Varadharajan, T Thomas and AV Kurpad
high food inflation persisting since 2008. Trends in Wholesale Price Index (WPI) of various commodities during the seven years from 2004-05 to 2011-12 are plot-ted in figure 5, showing that WPI for food articles has
been higher than that for non-food articles during most years. This diagram also shows that increases in WPI for food groups such as pulses and vegetables is higher and show greater degrees of fluctuation than other common
Figure 6. Change in share of cereals to total food expenditure with food price inflation (linearized trends), India, 2004-05 to 2009-10.
linear trends for rural low income groups, linear trends for rural middle income groups, linear trends for rural high income groups, linear trends for urban low income groups, linear trends for urban middle income groups, linear trends for urban high income groups. MPCE = Monthly Per Capita Expenditure. MPCE decile classes 1 to 3 have been designated low income groups, MPCE decile classes 4 to 7 as middle income groups and MPCE decile classes 8 to 10 as high income groups. Change in share of expenditure for cereals in monthly food expenditures is calculated from the year 2004-05. The base year of the cur-rent series of Wholesale Price Index (WPI), used as a measure of inflation in India, is 2004-05 and the corresponding value of WPI is 100. Data Sources: 46, 48-51.
Figure 7. Trends in per capita daily consumption of chief food groups, India, 1993-94 to 2009-10. Cereals, Millets and Cereal substitutes, Pulses and Pulse products, Vegetables, Milk and dairy products , Eggs, Fish and Meat, Vegetable Oils. Data Source: 46.
Figure 4. Variation in share of food groups to total monthly per capita food expenditure across different MPCE decile classes, India, 2009-10. Cereals, Millets and Cereal substitutes, Pulses and Pulse products, Milk and Dairy products, Vegetable Oils, Eggs, Fish and Meat, Vegetables, Fruits, Sugar, Salt and Spices, Beverages, Processed foods etc. MPCE = Monthly Per Capita Expenditure. Data source: 46.
Figure 5. Trends in food price inflation, India, 2004 – 2012. Cereals and Millets, Pulses, Vegetables, Milk, Eggs, Fish and Meat, Vegetable Oils, Sugar, Non-food articles. The base year of the current series of Wholesale Price Index (WPI), used as a measure of inflation in India, is 2004-05 and the corresponding value of WPI is 100 for all items. Data Source: 47.

Poverty and nutrition in India 333
food groups such as rice, sugar and edible oils. The asso-ciation of food price inflation with spending on cereals in urban and rural areas is shown in Figure 6. As inflation continued to rise between 2004-05 and 2009-10, the pro-portionate spending on cereals declined among all eco-nomic groups, with the greatest decrease noted in rural and urban poor (11% and 8% respectively), invoking the spectre of chronic energy deficiency.46,48-51
Figure 7 shows the trends in consumption of different food groups in rural and urban India across the four re-cent NSSO surveys from 1993 to 2009. Intake of cereals and millets has notably decreased both in rural and urban areas. The consumption of edible oils, vegetables, milk, eggs and meat has shown an increasing trend, with cur-rent consumption levels more in urban than rural areas. Consumption of pulses has doubled (but is still low) across these decile groups in both rural (13 to 31 g) and urban (16 to 34 g) areas.46 A comparison of these average consumption data with dietary recommendations for Indi-ans indicate deficient intakes of all major food groups, across all economic strata, but more pronounced in the lower classes.
Nutrient intakes estimated from NSSO consumption data have indicated a steady but small drop (6% decrease between 1993-94 and 2009-10) in daily consumption of calories in both rural and urban India.52 This decline has been discussed previously; even accounting for shortcom-ings in NSSO estimation procedures, it has been argued to reflect, at least partly, changes in energy requirements due to decreasing activity levels.53 Rural and urban Indi-ans consumed about 55 and 54 g protein/day respectively in 2009-10 and the drop in daily per capita protein intake was 8.6% for rural areas and 6.4% for urban areas be-tween 1993-94 and 2009-10.52 Current intakes are lower than the RDA for energy and protein for moderately ac-tive Indians and are broadly in agreement with rural in-
takes obtained from other recent surveys such as the NNMB. Energy and protein intakes are even lower among the poor (Figure 8).
Cereals are still the mainstay of energy and protein in-take in India. About 60% and 50% of rural and urban energy and protein intakes respectively are through cere-als. Cereals also constitute over two-thirds of the dietary energy intake and protein for lower economic groups. Pulses account for 9% and 10% of protein intakes, while milk and other dairy products contribute 9% and 13% in rural and urban Indians respectively.52 Vegetables and fruits are the major sources of minerals, vitamins and fibre in Indian diets. Cereals and pulses provide contribu-tions to minerals such as calcium and iron, but their bioa-vailability is likely to be low. Such dietary profiles are similar to the rural cereal-based diets obtained in the NNMB surveys, whose protein quality adjusted protein-energy ratios fall below 9%, indicating deficiency in qual-ity protein intake. Consumption of pulses, which have higher quantities of essential amino acids in comparison to cereals, is falling, as noted above, due to decreased production and increasing prices. Milk and dairy products are increasingly consumed across all classes, but their affordability is still problematic for the poor. Other sources of animal proteins such as eggs, meat and fish are nutritively superior, but their availability and costs pre-clude wider consumption. In addition to its superior pro-tein content, milk is also a good source of many micronu-trients and improving its affordability may provide solu-tions to the twin problems of protein and micronutrient deficiency. Food utilization From a brief biological perspective, which is relevant here, the consumption of food, its nutritive value and ul-timately its utilization in the body are affected by
Figure 8. Daily energy and protein intake across MPCE decile classes, India, 2009-10. energy intake in rural areas, en-ergy intake in urban areas, protein intake in rural areas, protein intake in urban areas. MPCE = Monthly Per Capita Ex-penditure. Data Source: 46.

334 KS Varadharajan, T Thomas and AV Kurpad
knowledge and cooking practices, as well as access to safe water, sanitation and hygiene. Knowledge of nutri-tive values of foods and healthy cooking practices has been reported to be low among children, adolescent girls and women in individual studies across the country.54-56 While access to safe drinking water has improved sub-stantially in urban as well as rural areas, due to initiatives such as the Accelerated Water Supply Programme, 96% urban and 84% rural households had access to an im-proved water source in 2008; however, India's achieve-ment in securing access to sanitary toilets for households is dismal, especially in rural areas where only 21% had access in 2008.57 Open-air defecation is a major contribu-tor to the burden of food and water-borne enteric infec-tions and geohelminthiases, which not only cause morbid-ity and mortality, but also lead to malabsorption and mal-nutrition. STRATEGIES TO ADDRESS MALNUTRITION AND POVERTY The bidirectional relationships between poverty and mal-nutrition are well established. Both are capable of exert-ing intergenerational influences and poverty alleviation programs can help reduce hunger, undernutrition and their effects over generations. The neglect in provision of
primary education, a basic anti-poverty tool, in India, especially for females, is well known. It is therefore not surprising that other strategies focussed primarily at pov-erty alleviation, have yielded modest benefits at most,58
(summarized in Table 2). Recent efforts towards achiev-ing universal access to primary education are welcome, even if delayed.61
Wage employment programmes have received renewed attention in India recently. Originally introduced in 1980-85 to help the rural poor tide over agricultural lean sea-sons as well as droughts and famine, these suffered from top-down planning and implementation, a non-participa- tory approach and corruption, and were soon deemed failures.58 A careful reappraisal of these schemes has led to the recent launch of the Mahatma Gandhi National Rural Employment Guarantee Act (MNREGA) Scheme, enacted through a central legislation in August 2005. This flagship scheme of the government provides for a legal guarantee of at least 100 days of employment in every financial year to adult members of any rural household willing to do unskilled manual work at statutory mini-mum wages. Despite reports of poor implementation and corruption, there is some evidence from the NSSO and independent evaluations that the MNREGA scheme may have increased rural incomes and curbed distress migra-
Table 2. Poverty alleviation schemes (centrally sponsored) in India SN Programme Beneficiaries Components
Poverty alleviation and employment generation 1 Mahatma Gandhi National Rural Employment
Guarantee Act (MNREGA) Scheme Rural poor (BPL) 100 days of guaranteed wage employment
(unskilled manual work) per year to every household (one-third participation of women)
2 National Rural Livelihood Mission (NRLM) / Swarnjayanti Gram Swarozgar Yojana (SGSY) – Aajeevika
Rural poor (BPL) Bank credit and government subsidy for income-generating assets, formation of self help groups, training and skills devel-opment (50% beneficiaries from SC/STs, 15% from minority groups, 3% from per-sons with disability)
3 Swarnajayanti Shahari Rozgar Yojana (SJSRY) Urban unemployed/ un-deremployed /poor
Creation of self-employment or wage em-ployment opportunities
Social protection Programmes 1 Aam Aadmi Bima Yojana (AABY) Individuals aged 18 to 59
years BPL or marginally APL
Life and disability insurance, with 50% premium provided by central government
2 Rashtriya Swasthya Bima Yojana (RSBY) BPL families in unor-ganized sector
Smart-card based cashless health insur-ance on a family floater basis with 75% central assistance towards premium
Infrastructure development 1 Indira Awas Yojana (IAY) Rural households Housing assistance 2 Pradhan Mantri Gram Sadak Yojana (PMGSY) NA Road connectivity 3 Nirmal Bharat
Abhiyan Rural households Construction of sanitary latrines
4 Rural water supply programme Rural households Safe drinking water through piped water supply
5 Jawaharlal Nehru National Renewal Mission Urban poor Creation of housing and other basic amenities
NA – Not Applicable, BPL – Below Poverty Line, APL – Above Poverty Line. Data Sources: 59, 60

Poverty and nutrition in India 335
tion. About 24% of rural households accessed the scheme and on average each household received wage employ-ment for 37 person-days, during 2009-2010.62 The impact of this scheme on nutritional and health outcomes in ben-eficiary households is yet to be studied.
India's Public Distribution System (PDS) was designed as a general entitlement scheme for the entire population, but it predominantly served urban consumers until 1992. In the post-economic reform era, it was revamped as the targeted PDS (TPDS) in 1997 to benefit households be-low the poverty line, which are eligible to receive 20 kg of cereals per month at subsidized rates. Several states have included other provisions such as sugar, pulses and kerosene through PDS. In the last quarter of 2012, the central government had also approved distribution of pulses at subsidized rates to those below the poverty line through the PDS, though no progress has been made in implementation yet. While traditionally beset with prob-lems such as poor quality and diversion of grains to the open market, recent data show that the utilization of PDS has increased from 24.4% in 2004-05 to 39.1% in 2009-10 in rural areas, while in urban areas it increased from 13.1% to 20.5%. The share of PDS to total food grain consumption also seems to have increased;63 however, estimates based on NSSO 2009-10 data reveal that only 41% of PDS grain actually reached beneficiaries.64
Nutritional supplementation schemes have targeted pregnant women and children, who are at higher risk of undernourishment due to increased needs. The Integrated Child Development Services (ICDS) provides food sup-plements for pregnant and lactating women, as well as pre-school children. Coverage under the scheme has gradually increased over the years due to judicial and civil society interventions, yet utilization of services re-mains low, reflecting low awareness levels or poor quali-ty of service delivery. NFHS 3 data reveal that while over 80% of under five children and pregnant/lactating women lived in areas with an ICDS centre, even among the poor-est sections, less than 30% of under-five children and 25% of women had received food supplements. 24 The National Programme for Nutritional Support to Primary Education (NPNSPE) launched in 1995 is a centrally sponsored scheme that entitles all primary school children in the country to hot cooked meals that provide 450 Calo-ries and 12 g of protein along with adequate quantities of micronutrients at lunch time.65 Increasing coverage and overall improvements in school enrolments and retention have been reported, but nutritional benefits achieved have been far less than the educational benefits.66,67
Other strategies that could impact food security and poverty are those directed towards improving access to health systems. Improved utilization and quality of care have been reported in public health facilities after the launch of the National Rural Health Mission in 2004, especially for services targeting women and children. However, coverage of essential strategies such as delay-ing childbirth, comprehensive antenatal care, breastfeed-ing, immunization, iron folate supplementation and man-agement of infections is still suboptimal.6 Iron and folate supplementation during pregnancy is only around 65% overall, with significant socioeconomic differentials; less than 50% of women from the poorest stratum receive
supplements, compared to 86% of those in the richest stratum. Access to iron supplements and deworming med-ication for under-five and school-age children remains low despite their provision by a number of government agencies.24
The intersectoral nature of the problems of poverty and malnutrition require a coordinated response from various governmental departments and non-governmental agen-cies. Dealing with malnutrition, for example requires that several links in the chain be fixed; these include agricul-ture, food distribution, water, sanitation, health and care. This entails an enormous challenge for countries such as India, where intersectoral coordination is still far from optimal. Instead, it is likely for malnutrition to be left out of the development debate, especially since much of it has become invisible. The fear that nutrition is becoming everybody's business, but nobody's responsibility, seems not entirely baseless.68
RECENT DEVELOPMENTS AND CONCLUSIONS Recent debates over the state of nutrition in India have centred on the proposed National Food Security Bill (NFSB), a comprehensive piece of legislation that entitles every citizen to the right to food security. Despite calls from nutrition and food security experts to make coverage universal and provide cereal entitlements of 14 kg per month per capita, the final version of NFSB to be tabled in the Parliament only provides for 5 kg of grains per month per individual for 67% of the population (75% rural and 50% urban) at 1-3 Indian Rupees per kilogram, while the poorest of poor households (10%) would be able to buy 35 kg of cereals per month.69 Regrettably, the NFSB is still cereal-centric, with no mention of pulses and other food groups such as vegetables and fruits.
Arguments for universal coverage focus on anticipated nutritional benefits, drawing on the experience of in-creased utilization of PDS in states such as Tamil Nadu and Kerala which have universal PDS, as well as on the difficulties involved in identifying beneficiary households for targeted PDS schemes.63,64 Against these arguments is the realization on the government's part that such a rights-based approach would require enormous amounts of gov-ernment intervention to increase production, and improve procurement and storage systems that may adversely af-fect overall efficiency of the PDS; besides causing a bal-looning of food subsidies and indirectly, open market prices.69,70 The unique ID system that has been launched recently is perceived as a solution to problems in the identification of target households. Computerization of TPDS and integration with the unique ID system has al-ready started; this may reveal its actual utility in targeting.
A related development is the contentious issue of sub-stitution of food subsidies with cash transfers, an idea that seems to be increasingly favoured by a government under pressure from international agencies to cut subsidies that are difficult to target. Conditional cash transfers (CCTs) have been shown to have a positive impact on health and education and helped families break out of the vicious cycle of poverty in many Latin American and African countries. CCTs have also been linked to diet diversifica-tion.71-74 There is some evidence that CCTs can work in India too; the Janani Suraksha Yojana under NRHM has

336 KS Varadharajan, T Thomas and AV Kurpad
resulted in an increase in institutional deliveries.75 In the era of unique ID systems, the transfer of cash through computerized systems could actually help target the really needy and weed out corruption. It has been estimated that if all of the money the government spends in subsidies for poor families through various state and central schemes is instead provided in cash to the beneficiary, a poor house-hold will on average receive Rs 2140 (US $ 39) per month.76 A partial pilot of this strategy, wherein govern-ment funding for some 29 schemes, excluding food and fertilizer subsidy, will be directly transferred to bank ac-counts of beneficiaries, has already been kick-started in 51 districts across the country.
However, cash transfers proposed as replacements to food subsidies are hardly conditional and the example of CCTs do not seem directly applicable in case of food sub-sidies. The behaviour of food prices in the open market and its impact on the poor, after the removal of the buff-ering effect of PDS is unclear. Further, assumptions that such cash transfers may lead to wasteful expenditures may not be totally baseless. However, a small pilot 'cash-for-food' project in urban slums of Delhi sponsored by the UNDP has found that cash transfers in place of PDS enti-tlements, could promote dietary diversity without com-promising food security or increasing wasteful expendi-tures.77 Similar studies on larger samples are required before any conclusion on cash transfers for food is made.
While the developmental effects of economic reforms continue to be debated, the Indian government has opened yet another sector for foreign direct investment (FDI) in retailing, which accounts for 14% of GDP and employs about 3.3% of the population. Much of the retailing in-dustry presently is informal: only 4% of retail outlets in 2010 were in the organized sector and these were concen-trated in big cities.78 While its informal nature ensures livelihoods for millions, it has also meant limited cold chain infrastructure development in the country, resulting in the perishing of a variably reported 5-72% of horticul-tural produce. On the one hand, FDI could possibly in-crease availability of fruits and vegetables from the nutri-tional standpoint. It is also claimed that organized retail could enhance agricultural revenues through the abolition of middlemen.79 On the other hand, concerns such as the loss of livelihoods for small traders and middlemen, price controls, monopolistic practices and the dumping of cheaper goods remain to be addressed, in addition to the potential disease burdens that come with increased access to refined and processed foods in supermarkets. In addi-tion, the procurement practices of farm products by for-eign supermarkets could also reinforce the cycle of low wages, poverty and economic insecurity.80 Predatory pressures on developing country food suppliers to reduce costs or production rates at short notice, in effect, transfer costs and risk burdens back to the supplier.80
In conclusion, there is little doubt that almost every be-nevolent policy to improve the state of nutrition in pov-erty has been considered and passed into legislation in India. These range from micronutrient supplementation in pregnancy, early childhood and adolescence, to cooked food provisions for very young and for school children, to the provision of subsidized grain and employment for the families in poverty. Notwithstanding the several criti-
cisms that could be made of its different facets, policy-making has responded to the situation. But the persistence of poverty and malnutrition are symptoms of a systemic failure of implementation in India that needs immediate redress. Given the conflicting forces that drive the econ-omy, it is unlikely malnutrition will disappear in the near future. As pressures such as environmental sustainability, climate change and international trade in commodities increase, the challenge for Indian agriculture and food distribution systems to keep up with production and ac-cess will become ever greater. India is a large country, and judgement of progress by aggregated indicators will inevitably hide inequalities. Even so, some of the national programs proposed could be great instruments of change if properly implemented. However, other policies that may lead to general economic volatility along with in-creased migration will mean that predictions of results in the state of nutrition will be difficult. ACKNOWLEDGEMENTS The authors thank Jonathan Wells and Prakash Shetty for help-ful suggestions. AUTHOR DISCLOSURES The authors received no funding/support for this review. AV Kurpad has consulted for Solae and McCain, and his honoraria go entirely to charity. The other authors declare no conflict of interest. REFERENCES 1. World Bank. World Data Bank. World Development
Indicators 2013. [cited 10 March, 2013]; Available from: http://databank.worldbank.org/data/views/variableSelection/selectvariables.aspx?source=world-development-indicators#c_i
2. Bhatt RK. Recent global recession and Indian economy: an analysis. Int J Trade Econ Financ. 2011;2:212-16.
3. NSSO. Key Indicators of Employment and Unemployment in India, 2009-10. Kolkata: National Sample Survey Organization office. Ministry of Statistics and Programme Implementation, Government of India; 2011.
4. UNDP. Human Development Report 2011. Sustainability and Equity: A Better Future for All. New York: United Nations Development Programme; 2011. ISBN: 9780230363311
5. UNICEF. India – Nutrition 2010. [cited 10 March, 2013 ]; Available form: http://www.unicef.org/india/nutrition. html
6. Sachdev HP. Overcoming challenges to accelerating linear growth in Indian children. Indian Pediatr. 2012:49:271-5. doi: 10.1007/s13312-012-0035-3
7. Kotecha PV. Nutritional Anemia in Young Children with Focus on Asia and India. Ind J Com Med. 2011;36:8-16. doi: 10.4103/0970-0218.80786
8. Dharmalingam A, Navaneetham K, Krishnakumar CS. Nutritional Status of Mothers and Low Birth Weight in India. Matern Child Health J. 2010;14:290-8. doi: 10.1007/s10995-009-0451-8
9. IFPRI. Welt hunger life and concern worldwide. Global Hunger Index 2012 report. The challenge of hunger: Ensuring sustainable food security under land, water, and energy stresses. Cologne: DFS Druck; 2012.
10. Sen A. The possibility of social choice. Am Econ Rev. 1999; 89:349-78. doi: 10.1257/aer.89.3.349
11. World Bank. Poverty and Equity Databank. India, 2013. [cited 10 March, 2013]; Available form: http://povertydata. worldbank.org/poverty/country/IND

Poverty and nutrition in India 337
12. United Nations. The Millennium Development Goals Report 2011. New York: United Nations Press; 2011.
13. Alkire S, Santos ME. Acute Multidimensional Poverty: A New Index for Developing Countries. OPHI Working paper No. 38. University of Oxford: Oxford Poverty and Human Development Initiative; 2010.
14. Planning Commission. Report of the Task Force on Projections of Minimum Needs and Effective Consumption Demand. New Delhi: Perspective Planning Division, Planning Commission, Government of India; 1979.
15. Planning Commission. Report of the Expert group to review the methodology for estimation of poverty. New Delhi: Planning Commission, Government of India, 2009.
16. FAO. FAO methodology for the measurement of food deprivation. Updating the minimum dietary energy requirements. Rome: FAO Statistics Division; 2008.
17. Planning Commission. Press Note on Poverty Estimates, 2009-10. New Delhi: Planning Commission, Government of India; 2012.
18. OECD. Divided We Stand: Why Inequality Keeps Rising. OECD Publishing; 2012. doi: 10.1787/9789264119536-en
19. Shukla R. How India Earns, Spends, and Saves: Unmasking the Real India. New Delhi: NCAER Centre for Macro Consumer Research & Sage; 2010.
20. NSSO. Informal Sector and Conditions of Employment in India, 2004-05. Kolkata: National Sample Survey Organization office. Ministry of Statistics and Programme Implementation, Government of India; 2006.
21. Directorate of Economics and Statistics. Agricultural Statistics at a Glance 2012. New Delhi: Ministry of Agriculture, Government of India; 2013.
22. Chand R, Raju SS, Pandey LM. Growth crisis in agriculture: severity and options at national and state levels. Econ Polit Weekly. 2007;42:2528-33.
23. Goldar B, Aggarwal SC. Informalization of industrial labour in India: are labour market rigidities and growing import competition to blame? New Delhi: Indian Statistical Institute; 2010.
24. IIPS & Macro International. National Family Health Survey (NFHS-3), 2005-06 India: Volume I. Mumbai: International Institute for Population Sciences; 2007.
25. WHO. World Health Statistics, 2012. [cited 10 March, 2013]; Available from; http://www.who.int/gho/publicatio ns/world_health_statistics/2012/en/index.html
26. The Million Death Study Collaborators. Causes of neonatal and child mortality in India: a nationally representative mortality survey. Lancet. 2010;376:1853-60. doi: 10.1016/ S0140-6736(10)61461-4
27. Pelletier DL, Frongillo Jr EA, Schroeder DG, Habicht JP. A methodology for estimating the contribution of malnutrition to child mortality in developing countries. J Nutr. 1994; 124(10 Suppl):2106S.
28. IIPS and Macro International. National Family Health Survey (NFHS-2), 1998-99 India. Mumbai: International Institute for Population Sciences; 2000.
29. Naandi Foundation. Fighting Hunger and Malnutrition: The HUNGaMA Survey Report 2011. Hyderabad: Naandi Foundation; 2011.
30. NNMB. Diet and nutritional status of population and prevalence of hypertension among adults in rural areas. NNMB Technical Report No: 24. Hyderabad: National Institute of Nutrition; 2006.
31. Thankachan P, Muthayya S, Walczyk T, Kurpad AV, Hurrell RF. An analysis of the etiology of anemia and iron deficiency in young women of low socioeconomic status in Bangalore, India. Food Nutr Bull. 2007;28:328-36.
32. Thankachan P, Muthayya S, Walczyk T, Kurpad AV,
Hurrell RF. Iron absorption in young Indian women: the interaction of iron status with the influence of tea and ascorbic acid. Am J Clin Nutr. 2008;87:881-6.
33. Nair KM, Iyengar V. Iron content, bioavailability & factors affecting iron status of Indians. Indian J Med Res. 2009; 130:634-45.
34. IIPS. Nutritional status of children and prevalence of anemia among children, adolescent girls and pregnant women. District Level Household Survey (DLHS) 2 on Reproductive and Child Health 2002-04. Mumbai: International Institute for Population Sciences; 2005.
35. Kalaivani K. Prevalence & consequences of anaemia in pregnancy. Indian J Med Res. 2009; 130:627-33.
36. Kapoor SK, Kapil U, Dwivedi S, Anand K, Pathak P, Singh P. Comparison of HemoCue Method with Cyanmethemo-globin Method for Estimation of Hemoglobin. Indian Pediatr. 2002;39:743-6.
37. Anuradha R, Ravivarman G, Jain T. The prevalence of overweight and obesity among women in an urban slum of Chennai. J Clin Diagn Res. 2011;5:957-60.
38. RBI. Handbook of Statistics on the Indian Economy (2011-12). Mumbai: Reserve Bank of India; 2012.
39. FAO. World Food Summit Rome Declaration on World Food Security. Rome: FAO; 1996.
40. Kannan E, Sundaram S. Analysis of Trends in India’s Agricultural Growth. Working paper 276. Bangalore: The Institute for Social and Economic Change; 2011.
41. DAHDF. Basic Animal Husbandry statistics, 2012. AHS series 13. New Delhi: Ministry of Agriculture, Government of India; 2012.
42. Mittal S. Demand-Supply Trends and Projections of Food in India. Working Paper No 209. New Delhi: Indian Council for Research on International Economic Relations, (ICRIER); 2008.
43. NIN. Dietary Guidelines for Indians: A manual. Hyderabad: National Institute of Nutrition; 2010.
44. Rao BSN. Fruits, vegetables, milk and animal foods in balanced Indian diets - a critical appraisal. NFI Bulletin. 2013;34;1-4.
45. Posani B. Hunger amidst Plenty: The Policy and Politics of Food Security in India. University of Oxford; 2010.
46. NSSO. Level and Pattern of Consumer Expenditure: NSS 66th Round, 2009-10. Kolkata: National Sample Survey Organization office. Ministry of Statistics and Programme Implementation, Government of India; 2011.
47. Wholesale Price Index Data, Office of the Economic Adviser to the Government of India, [cited 10 March, 2013]; Available from: http://eaindustry.nic.in/
48. NSSO. Level and Pattern of Consumer Expenditure: NSS 61st Round, 2004-05. Kolkata: National Sample Survey Organization office. Ministry of Statistics and Programme Implementation, Government of India; 2006.
49. NSSO. Household Consumer Expenditure in India: NSS 62nd Round, 2005-06. Kolkata: National Sample Survey Organization office. Ministry of Statistics and Programme Implementation, Government of India; 2007.
50. NSSO. Household Consumer Expenditure in India: NSS 63rd Round, 2006-07. Kolkata: National Sample Survey Organization office. Ministry of Statistics and Programme Implementation, Government of India; 2008.
51. NSSO. Household Consumer Expenditure in India: NSS 64th Round, 2007-08. Kolkata: National Sample Survey Organization office. Ministry of Statistics and Programme Implementation, Government of India; 2009.
52. NSSO. Nutritional Intake in India 2009-10. NSS 66th Round, 2009-10. Kolkata: National Sample Survey Organization office. Ministry of Statistics and Programme Implementation,

338 KS Varadharajan, T Thomas and AV Kurpad
Government of India; 2012. 53. Deaton A, Dreze J. Food and nutrition in India: facts and
interpretations. Econ Polit Weekly. 2009;54:42-65. 54. Vijayapushpam T, Menon KK, Rao DR, Antony GM. A
qualitative assessment of nutrition knowledge levels and dietary intake of school children in Hyderabad. Public Health Nutr. 2003;6:683-8. doi: 10.1079/PHN2003478
55. Upadhyay S, Kumar AR, Raghuvanshi RS, Singh BB. Nutritional status and knowledge of Hill women on anemia: effect of various socio-demographic factors. J Hum Ecol. 2011;33:29-34.
56. Abbi R, Christian P, Gujaral S, Gopaldas T. Mothers' nutrition knowledge and child nutritional status in India. Food Nutr Bull. 1988;10:51-4.
57. Population Reference Burea. Population using improved water supply and improved sanitation, by region. [cited 10 March, 2013]; Available from: http://www.prb.org/Data Finder/Topic/Rankings.aspx?ind=33
58. Yesudian CAK. Poverty alleviation programmes in India: A social audit. Indian J Med Res. 2007;126:364-73.
59. Ministry of Finance. Economic Survey 2012-13. New Delhi: Ministry of Finance, Government of India; 2013.
60. Planning Commission. Draft 12th Five Year Plan 2012-17. New Delhi: Planning Commission, Government of India; 2012.
61. ASER Centre. Annual Status of Education Report 2012. New Delhi: Pratham; 2012.
62. NSSO. Employment and Unemployment Situation in India. NSS 66th Round, 2009-10. Kolkata: National Sample Survey Organization office. Ministry of Statistics and Programme Implementation, Government of India; 2011.
63. NSSO. Public Distribution System and Other Source of Households Consumption 2009-10. NSS 66th Round. Kolkata: National Sample Survey Organization office. Ministry of Statistics and Programme Implementation, Government of India; 2012.
64. Khera R. Trends in diversion of PDS grain. Working Paper No 198. New Delhi: Centre for Development Economics, Delhi School of Economics; 2011.
65. NPSPE. National Programme of Nutritional Support to Primary Education, 2006. New Delhi: Ministry of Human Resource Development, Government of India; 2006.
66. Planning Commission. Performance Evaluation of Cooked Mid-Day Meal (CMDM). New Delhi: Programme Evaluation Organisation, Planning Commission, Government of India; 2010.
67. Laxmaiah A, Sarma KV, Rao DH, Reddy G, Ravindranath M, Rao MV, Vijayaraghavan K. Impact of mid-day meal program on educational and nutritional status of school children in Karnataka. Indian Pediatr. 1999;36:1221-8.
68. Haddad L. Let's make malnutrition visible. In Series: Why poverty? BBC Magazine; 2012. [cited 10 March, 2013 ]; Available from: http://www.bbc.co.uk/news/magazine-20523986
69. Standing Committee. Report of the Standing Committee on Food, Consumer Affairs and Public Distribution (2012-13). New Delhi: Ministry of Consumer Affairs, Food And Public Distribution, Lok Sabha Secretariat, Government of India; 2013.
70. Gulati A, Gujral J, Nandakumar T. National Food Security Bill Challenges and Options. New Delhi: Commission for Agricultural Costs and Prices, Ministry of Agriculture, Government of India; 2012.
71. Soares FV. Cash Transfer Programmes in Brazil: Impacts on Inequality and Poverty, Working Paper, No 21. Brazil: International Poverty Centre; 2006.
72. Zepeda E. Addressing the Employment-Poverty Nexus in Kenya: Comparing Cash Transfer and Job Creation Programmes, Working Paper, No 40. Brazil: International Poverty Centre; 2007.
73. Sridhar D, Duffield A. A Review of Impact of Conditional Cash Transfer on Child Nutritional Status and Some Implications. Unpublished Paper for Save the Children, UK; 2006.
74. Aguero JM, Cartyer MR, Woolard I. Impact of Unconditional Cash Transfers on Nutrition: The South African Child Support Grant, Working Paper, No 39. International Poverty Centre, Brazil; 2007.
75. Lim SS, Dandona L, Hoisington JA, James SL, Hogan MC, Gakidou E. India's Janani Suraksha Yojana, a conditional cash transfer programme to increase births in health facilities: an impact evaluation. Lancet. 2010;375: 2009-23. doi: 10.1016/S0140-6736(10)60744-1.
76. Kapur D, Mukhopadhayay P, Subramanian A. The case for direct cash transfers to the poor. Econ Polit Weekly. 2008;43:37-41,43.
77. SEWA. An experimental pilot cash transfer study in Delhi. New Delhi: SEWA Bharat; 2012.
78. India Retail Forum. The India Retail Report, New Delhi: IMAGES; 2007.
79. Singh J. Impact of Organized Retail Chains on Revenue of Farmer (A Case Study of Mother Dairy Centres in Haryana). New Delhi: Department of Industrial Policy And Promotion, Ministry Of Commerce & Industry, Government Of India; 2011.
80. ActionAid. Who Pays? How British supermarkets are keeping women in poverty. [cited 30 March, 2013]; Available from: http://www.actionaid.org.uk/doc_lib/ action aid_who_pays_report.pdf

Poverty and nutrition in India 339
Review Article Poverty and the state of nutrition in India Kiruba S Varadharajan MD 1, Tinku Thomas PhD2, Anura V Kurpad MD, PhD 1,2 1Department of Physiology, St John’s Medical College, Bangalore, India 2Division of Epidemiology and Biostatistics,St John’s Research Institute, Bangalore, India
印度的貧窮與營養狀況
印度在過去幾年有相當高的經濟成長率,但在平均餘命、教育及生活水平方
面的進展卻較緩慢,故常被視為發展的矛盾。雖然成長、發展及機會的嚴重
不平等解釋了國家層次的矛盾假象,印度的貧困人口及營養不良兒童仍佔世
界的一大部分。貧窮與營養不足共存,貧乏的飲食品質與不良的孩童生長及
主要的微量營養素缺乏攸關。糧食安全特別容易受到經濟狀況及財富分配不
均而改變。從鄉村移居到都市區域者,大多數找不到正式工作,因此造成移
居者繼續生活在糧食不安全的狀態。雖然糧食生產大部分跟得上日益增加的
人口數,但那是指穀類,豆類及小米生產卻不盡然。含油種子類、甘蔗及蔬
果作物,及非食用作物也被推廣,但這對營養保障並無多大助益。且由於預
製食品的消費增加,可能朝向營養不良的雙頭負擔。貧窮及不平等對於食物
的可近性也深具影響。很多措施及政策已被提出,以解決印度的營養不足,
但是它們的執行卻沒有一致性,要評估它們有規模的持續效應仍為時太早。
關鍵字:貧窮、糧食安全、營養不足、印度、農業