poverty and microfinance: an investigation into the role
TRANSCRIPT

The Whitehead Journal of Diplomacy and International Relations
Poverty and Microfinance: An Investigationinto the Role of Microcredit in Reducingthe Poverty Level of Borrowing Householdsin Bangladesh and the Philippines
M. Jahangir Alam Chowdhury
It is often argued that the formal and informal financial sectors in developingcountries have failed to serve the poorer section of the community. Collateral, creditrationing, a preference for high income clients and large loans, and lengthybureaucratic procedures of providing loans keep poor people outside the boundaryof the formal sector financial institutions in developing countries.1 On the otherhand, the informal financial sector has also failed to help the poor. Monopolisticpower, excessively high interest rates, and exploitation through the undervaluation ofcollateral have restricted the informal financial sector in providing credit to poorpeople for income generating and poverty alleviation purposes.2
The limitations of both financial sectors in providing financial services,especially credit, have encouraged microcredit programs to evolve. These programswere initiated with the objective of providing poor people with small credit withoutcollateral. The harmony among group members, the strict discipline in providingcredit and collecting repayments, and supervision of borrower’s activities in themicrocredit system have replaced the provision of collateral. Muhammad Yunus, theNobel Peace Prize winner in 2006 and founder of the Grameen Bank in Bangladesh,calls this process of collateral substitution the “freeing of credit from the bondageof collateral.”3 He further criticized collateral provisions for keeping poor peopleoutside the credit facilities of formal financial sector institutions, stating that itconstitutes a form of “financial apartheid.”4
In 1976, Muhammad Yunus initiated the first microcredit program inBangladesh with the promise of providing credit without collateral, in an attempt toalleviate poverty and unleash the creative potential of the poor. Years later, in 1986,Yunus founded the Grameen Bank, thus paving the way for future microcreditprograms in developing and developed countries. In a speech at the microcreditsummit in Washington, D.C. in 1997, Yunus compared his dream to eradicate poverty
M. Jahangir Alam Chowdhury is an Associate Professor in the Department of Finance, and theExecutive Director of the Center for Microfinance and Development at the University of Dhaka.
19

CHOWDHURY
The Whitehead Journal of Diplomacy and International Relations
completely from this world with man’s desire to fly 100 years ago. He mentionedthat, in their first successful attempt in 1903, the Wright Brothers could stay in theair for only 12 seconds and fly for only 120 feet. Sixty-five years later, however, manwas able to go to the moon and successfully return to Earth. Yunus mentioned thathe would also be able to go to his moon, a poverty-free world, in fifty-five years timethrough microcredit.5 Keeping this in mind, it is therefore important to evaluate thepoverty alleviation capacity of microcredit programs.
The present article is intended to analyze how effective microcredit programsare in alleviating the poverty level of borrowing households in Bangladesh and thePhilippines. A quasi-experimental design has been formulated to achieve thisobjective. The survey design covers two types of households, program householdsand comparison households. Program households are those which have alreadyreceived more than one loan from a microcredit program. Comparison householdsare those which have just joined a microcredit program and therefore have notreceived any loans from that program. There will be a comparison between thepoverty level of both households to assess the impact of microcredit on borrowinghouseholds.
LITERATURE REVIEW
The empirical evidence on the impact of microcredit on poverty is very mixed.While some impact evaluation studies have found that access to credit by the poorhas a positive, large, and permanent effect on living standards, other studies havefound that poverty is not reduced through microcredit. They have shown that poorhouseholds simply become poorer through the additional burden of further debt.
Some studies, for example, Bruntrup et. al (1997), have only used descriptivestatistics for analysis.6 They have not used any multivariate techniques to determinethe impact of microcredit on poverty and poverty related aspects of borrowinghouseholds. Other studies, such as Mustafa et. al (1996) and Hussain (1984), werebiased in selecting the sample households.7 Mustafa, et. al (1996) selected 200additional so-called “success households” non-randomly for data collection. So far,only four studies, Hussain (1988), Hussain eds. (1998), Khandker and Chowdhury(1996), and Chowdhury et al. (2005) have directly assessed the impact of microcrediton poverty.8 These studies analyzed poverty and economic welfare from the point ofview of objective poverty.
POVERTY IN BANGLADESH
Poverty has multidimensional characteristics in Bangladesh. The level of povertyis relatively high due to the fact that employment opportunities are limited andaverage income level is low. Poverty in Bangladesh is not only a phenomenon of lowincome; it is also a phenomenon of the poor quality and limited access to basicservices like education, healthcare, water, shelter, and sewerage. In terms of povertyand inequality, large differences exist between rural and urban areas. The per capita
20

POVERTY AND MICROFINANCE
Summer/Fall 2008
GDP of Bangladesh is one of the lowest in the world. In 2000, it was approximately$400; it rises to $1900 when the purchasing power parity is considered. Poverty is themain problem of Bangladesh, as a majority of the population lives under the worldpoverty line.9 Since the independence of Bangladesh in 1971, poverty alleviation hasbeen declared as the main macroeconomic objective of all ruling parties, but theirefforts have remained very limited in achieving this objective.
TABLE 1-POVERTY IN BANGLADESH (IN PERCENTAGE)10
A glance at table 1 indicates that the poverty situation did not experience anyimprovement during the period 1963–2000. The level of poverty in rural areas in2000 was about 9 percentage points higher than that of 1963–64. In 1963–64, thepercentage of the rural population living under the poverty line in the country, thenEast Pakistan, was about 44 percent. In 2000, it was about 53 percent.15 Comparedto the poverty situation immediately after independence, the country hadexperienced about a 6 percent decrease in poverty in twenty-two years. Thepercentage of the rural population living under the poverty line went down from 60percent in 1973–74 to 53 percent in 2000. The poverty level sharply deterioratedimmediately after independence due to the destruction of infrastructure and
21
www.journalofdiplomacy.org
Region 1963-64
1973-74
1981-82
1983-84
1991-92
1995-96 2000
HouseholdExpenditureSurvey
Rural 43.6
Urban -
Muqtada (1986)11
Rural 59.9
Urban 37.8
Urban 32.3
Osmani andRahman (1986)12
Rural 65.3 79.1 49.8
Urban 62.0 50.7 39.5
BBS (1990/92),(1995), (1996),(2000)13
Rural 73.8 61.9
Urban 66.0 67.7
World Bank(2002)14
National 58.8 51.0 49.8
Rural 61.2 55.2 53.0
Urban 44.9 29.4 36.6

CHOWDHURY
The Whitehead Journal of Diplomacy and International Relations
production systems during the liberation war in 1971 and severe drought and floodsduring the period 1972–1974.
POVERTY IN THE PHILIPPINES
In 1997, 4.5 million families—26.8 million Filipinos—were living under thepoverty line. Poverty incidence in the population was estimated at 36.8 percent in1997 (Table 2). This means their annual per capita income fell below the poverty line,which was estimated to be P12,577 for urban areas and P10,178 for rural areas in1997. In the same year, the incidence of poverty was higher in rural areas comparedto that of in urban areas. The incidence of poverty in urban areas was 17.9 percentin 1997, whereas it was 44.4 percent in rural areas.
TABLE 2-POVERTY INCIDENCE OF FAMILIES IN THE PHILLIPINES16
In 1997, within various regions, the incidence of poverty was the highest (57.5percent) in the Autonomous Region of Muslim Mindanao (ARMM). During thesame year, the incidence of poverty was the lowest (6.4 percent) in the NationalCapital Region (NCR), i.e. Metro Manila. However, in 1991, the CordilleraAdministrative Region (CAR) had the highest incidence of poverty (57 percent),whereas Metro Manila had the lowest incidence of poverty (13.2 percent). Duringthe period 1991–1997, the poverty situation deteriorated in the ARMM, butimproved in the CAR. During the following two years, 1997–1998, the overallpoverty situation in the Philippines worsened. In 1997, the incidence of poverty inthe Philippines was 31.8 percent; it increased to 40.6 percent in 1998. The maincontributors towards deterioration were the Asian financial crisis and the adverseenvironmental effects caused by El Niño.
THE MICROFINANCE SECTOR IN BANGLADESH
Bangladesh has experienced exceptionally rapid growth in the microcredit sectorsince 1990. Prior to 1990, only a handful of organizations were operating in themicrocredit sector. Following the innovation and success of the Grameen Bank inproviding small collateral free loans to poor people for income generating activities,many non-governmental organizations (NGOs) adopted microcredit technology andstarted mobilizing poor people for microcredit activities. In the beginning, some of
22
1985 1988 1991 1994 1997
Phillipines 44.2 40.2 39.9 35.5 31.8
Urban 33.6 30.1 31.1 24.0 17.9
Rural 50.7 46.3 48.6 47.0 44.4
POVERTY AND MICROFINANCE
Summer/Fall 2008
these NGOs, such as the Bangladesh Rural Advancement Committee (BRAC) andthe Association for Social Advancement (ASA), experimented with the GrameenBank’s microcredit delivery system. Gradually, they developed their own. Currently,apart from the Grameen Bank, more than 1000 NGOs are operating microcreditprograms, and many more new ones are joining the microcredit revolution inBangladesh.
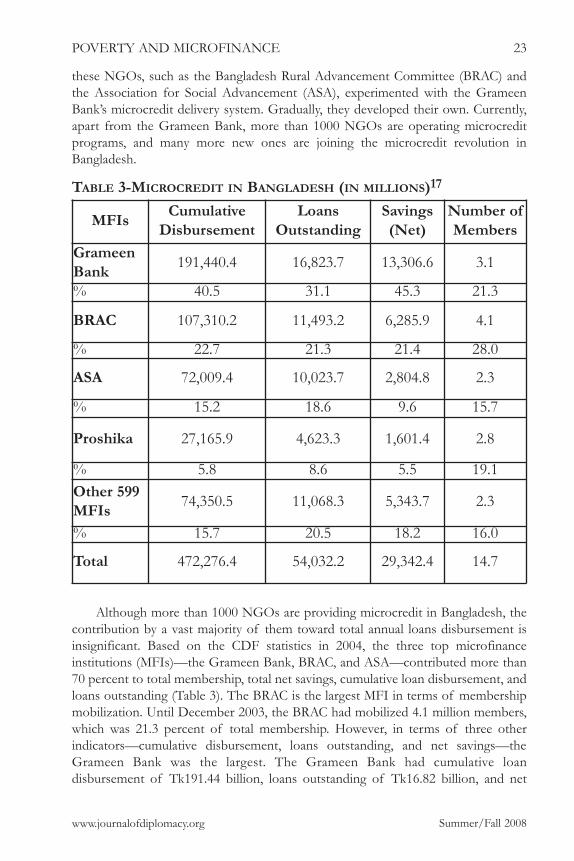
TABLE 3-MICROCREDIT IN BANGLADESH (IN MILLIONS)17
Although more than 1000 NGOs are providing microcredit in Bangladesh, thecontribution by a vast majority of them toward total annual loans disbursement isinsignificant. Based on the CDF statistics in 2004, the three top microfinanceinstitutions (MFIs)—the Grameen Bank, BRAC, and ASA—contributed more than70 percent to total membership, total net savings, cumulative loan disbursement, andloans outstanding (Table 3). The BRAC is the largest MFI in terms of membershipmobilization. Until December 2003, the BRAC had mobilized 4.1 million members,which was 21.3 percent of total membership. However, in terms of three otherindicators—cumulative disbursement, loans outstanding, and net savings—theGrameen Bank was the largest. The Grameen Bank had cumulative loandisbursement of Tk191.44 billion, loans outstanding of Tk16.82 billion, and net
23
www.journalofdiplomacy.org
MFIs CumulativeDisbursement
LoansOutstanding
Savings(Net)
Number ofMembers
GrameenBank 191,440.4 16,823.7 13,306.6 3.1
% 40.5 31.1 45.3 21.3
BRAC 107,310.2 11,493.2 6,285.9 4.1
% 22.7 21.3 21.4 28.0
ASA 72,009.4 10,023.7 2,804.8 2.3
% 15.2 18.6 9.6 15.7
Proshika 27,165.9 4,623.3 1,601.4 2.8
% 5.8 8.6 5.5 19.1Other 599MFIs 74,350.5 11,068.3 5,343.7 2.3
% 15.7 20.5 18.2 16.0
Total 472,276.4 54,032.2 29,342.4 14.7

CHOWDHURY
The Whitehead Journal of Diplomacy and International Relations
member savings of Tk13.31 billion. The cumulative loan disbursement of theGrameen Bank constituted approximately 41 percent of total disbursement, whereasthe BRAC accounted for approximately 21 percent. In 2003, the loans outstandingand net savings of the Grameen Bank were 31 percent and 45 percent of the total,respectively. In the same year, the BRAC contributed 21.3 percent of total loansoutstanding and 21.4 percent of total net savings. The ASA, in relation to these twoMFIs, is quite small in terms of the indicators stated above. In 2003, the share of theASA in total loan disbursement was 15.2 percent. The ASA, at the end of December2003, had mobilized 2.3 million members.
THE MICROFINANCE SECTOR IN THE PHILIPPINES
There is no specific information about the current size of the microfinancesector in the Philippines. In their 1995 study, Chua and Llanto made an attempt tocalculate the size of the microfinance sector.18 According to their report, there were2,762 MFIs in the Philippines. The estimated total outreach of these organizationswas 666,000; the average outreach of each organization was about 240. On the basisof Chua and Llanto’s study, and the assumption that the microfinance sectorexperienced a growth rate of 10 percent per annum during the period of 1995–2007,it is estimated that the size of the total outreach of the microfinance sector wasabout 2.3 million by the end of 2007.
TABLE 4-MICROFINANCE IN THE PHILLIPINES
Table 4 shows the outreach and the gross loan portfolio of 67 microfinanceinstitutions in the Philippines. It illustrates that these 67 microfinance institutionshad a total outreach of 1.7 million and a total gross portfolio of USD 292 million in2007.
24
Type ofInstitution Number
Gross LoanPortfolio (in US$)
ActiveBorrowers
Bank 2 2,987,317 19,124Cooperatie/Credit Union 8 1,650,312 13,682
Non-Profit (NGO) 25 3,802,568 40,471
Other 1 3,433,401 62,430Rural Bank 31 5,635,603 14,794Grand Total 67 292,378,424 1,680,523

POVERTY AND MICROFINANCE
Summer/Fall 2008
Currently, there are three types of players in the microfinance sector in thePhilippines: rural and development banks, cooperative banks, and NGOs. Before1998, governmental organizations were also active in the microfinance sectorthrough different types of targeted credit programs. During the period between 1994and 1996, as many as eighty-six targeted credit programs of the government wereactive in the microfinance sector. In 1998, as part of the financial liberalizationprogram, the government under President Estrada dismantled all of abovementioned targeted credit program and encouraged the private sector to play theleading role in the microfinance sector. In their 1995 study, Chua and Llanto failedto incorporate the contribution of rural and development banks towards thecalculation of the total outreach of the microfinance sector. Rural and developmentbanks also conduct microfinance activities as part of their different bankingactivities; however, specific information regarding the size of microfinance activitiesof these banks is not available. It is really difficult to distinguish the total volume ofmicrofinance activities of these banks from other activities. Among the developmentbanks, Land Bank of the Philippines played the most important role in financingpoverty alleviation activities until 1996. It was established by the government of thePhilippines to finance agricultural reform and to extend credit to the growingagricultural sector.
In 1994, Land Bank of the Philippines established the Peoples Credit andFinance Corporation (PCFC), an apex microfinance institution, to free itself fromthe task of financing poverty alleviation activities so that it could concentrate fullyon agricultural reform lending and agricultural finance. The PCFC began operationsin 1996. In April 2002, the PCFC had 279 partner organizations (POs). Out of these279 POs, 86 were inactive. The total amount of loans outstanding was about P1.5billion. With 193 active POs, the PCFC served 581,249 borrowers. The average loansize was P5,732. During the same time, the recovery rate of the PCFC was 98.32percent.
Microfinance institutions in the Philippines follow three types of methodologiesin conducting their microfinance activities: the Grameen methodology, the ASAmethodology, and the indigenous methodology. The Grameen methodology wasdeveloped by the Grameen Bank in Bangladesh. The ASA methodology wasdeveloped by Association for Social Development (ASA) in Bangladesh. Mostrecently, the ASA methodology has become famous for its cost-effective microcreditlending approach. Local microfinance practitioners in the Philippines havedeveloped the indigenous methodology. Approximately 160 MFIs have adopted theGrameen methodology to conduct their microfinance activities. In a project initiatedand financed by the United Nations Development Program (UNDP), sixteen MFIsthat participated adopted the ASA methodology during the period 2001–2002. Apartfrom these, other MFIs follow their own methodology.
25
www.journalofdiplomacy.org

CHOWDHURY
The Whitehead Journal of Diplomacy and International Relations
ESTIMATION STRATEGY
The impact of any development intervention, such as microcredit, can beestimated using the following empirical specification:
Yij=Hijαy+Ljθy+Mijβy+µij (1)
where Yij is the outcome of the household i, in the village j, on which we want tomeasure the impact. Hij is the vector of household characteristics; Lj is the vector ofvillage level characteristics; and Mij is the vector of microcredit variables αy,θy, βy,and µij are the parameters to be estimated, and represents the unmeasuredhousehold and village characteristics that determine outcomes. Consider thefollowing equation, which determines the extent of influence of different householdand village characteristics on the decision to participate in the microfinanceprograms or the decision to borrow the amount of money from the microcreditprograms.
Mij=Hijαy+Ljθy+εij (2)
where Mij, Hij, and Lj are the same as those in equation 1; and εij represents theunmeasured household and village characteristics that determine the decision toparticipate in the microfinance programs, or the decision to borrow the amount ofmoney from the microcredit programs.
The estimations will be biased if µij and εij are correlated. Two types ofselection biases make these two terms correlated: (1) non-random selection ofhouseholds to participate in microfinance program and (2) non-random selection ofplaces to establish branches of microfinance institutions.
MFIs all over the world accept those people as members who fulfill somecriteria. This process generates the first of the two types of biases mentioned above.
In addition to the selection criteria of MFIs, the self-selection of programparticipants is also another source of the first bias. Since it is expected thathouseholds with greater entrepreneurial capability are more likely to join theprogram, this may also bias the econometric estimation of program benefits. Thenon-random program placement also creates biases in estimating benefits of theprogram. For example, if microcredit programs are implemented in those areaswhich have more business opportunities, better communication infrastructure, moredynamic leaders, or are poorer, then such criteria for selecting places for programimplementation create biases in estimating program benefits.
On the basis of the above arguments, we can say that a comparison between agroup of program participants who are self-selected, and a group of non-participants who are not self-selected, would generate a bias in estimating the impactof microcredit on outcome variables. In the same way, the estimates will be biased if
26

POVERTY AND MICROFINANCE
Summer/Fall 2008
program group members are selected from a place that has been non-randomlyselected by MFIs on the basis of certain characteristics and if the comparison groupmembers are selected from a place without those characteristics. On the basis of theabove understanding, the present study uses an alternative survey method than iscommonly employed.20 We selected new members, who just received their first loan,as members of the compariosn group. Since the comparison group members areself-selected like the program members, the bias arising from self-selection inestimating program benefits is expected to disappear. In our investigation,households of both groups were from the same location. Therefore, the bias, whicharises from non-random program placement, is also avoided from our sample. Now,the program impacts can be estimated through using a single equation:
Yij=Hijαy+Ljθy+Mijβy+νij (3)
where Yij, Hij, and Mj are defined as above; and vi represents the error of themodel that arises from the household and village level variables that are not included.In equation 3, Mij is the microcredit variable of household j in the area i. This modelhas been estimated using two specifications of the microcredit variable. The firstspecification is a simple linear specification, like the one in equation 3. The secondis a quadratic specification:
Yij=Hijαy+Ljθy+M2ijβ2+νij (4)
The second specification has been designed to observe the non-linearity in theimpact of microcredit on different outcome variables.
The variables included in the vector of household characteristics Hij areoccupation, education, and the demographic composition of households. Thevariables included in the vector of village-level characteristics Lij are the existence ofschools, markets, roads, and dummies for localities where sample respondents reside.Models 3 and 4 have been estimated using the logit regression technique.
DATA FROM BANGLADESH
A four-stage random sampling technique has been applied in selecting programhouseholds and comparison households. In the first stage, one district had beenrandomly selected out of sixty-four districts in Bangladesh. In the second stage ofrandom sampling, three branches of the Grameen Bank—two branches for selectingprogram households and the other for selecting comparison group households—hadbeen selected randomly for data collection purposes. Program households had beenselected from two branches that were more than eight years old (program branches).Comparison households had been selected from a newly established Grameen Bankbranch (comparison branch). In the third stage, we randomly selected thirty-fivecenters from the comparison branch and sixty centers from two program branches.21
In the fourth and final stage, the study randomly selected five members from each
27
www.journalofdiplomacy.org

CHOWDHURY
The Whitehead Journal of Diplomacy and International Relations
of the program branch centers and six members from each of the comparisonbranch centers.
In total, the study collected information from 210 member households of thecomparison branch. However, during the examination of the completedquestionnaires of comparison households, it was found that some questionnairescontained illogical as well as incomplete answers. The study dropped thesequestionnaires. This left the study with 205 useable questionnaires from thecomparison branch. In the program branch, the study grouped all members of eachrandomly selected center into three groups on the basis of the length ofparticipation in the program: 2–4 years, 5–7 years, and 8 years or more (8+). Thestudy randomly selected two program members from each group. Since 60 centerswere selected randomly for data collection, the study expected 120 randomly selectedprogram members from each group. In some centers, the study did not find anymembers belonging to the 2–4 year program group and/or the 8+ program group.In some centers, the study substituted missing members of the 2–4 year programgroup and the 8+ program group with the 5–7 year program group members. Finally,the study was able to collect information from households of ninety five 2–4 yeargroup members, one hundred sixty 5–7 year members, and one hundred five 8+group members. However, the study found some answers of respondents illogicaland also found some questionnaires incomplete. These questionnaires were dropped.Finally, the study found that seventy-eight respondents from the 2–4 year groupfilled in questionnaires that were usable; one hundred twenty-three respondents fromthe 5–7 year group filled in questionnaires that were usable; and one hundred fifteenfrom the 8+ group filled in questionnaires that were useable, giving a total of 316filled in, usable questionnaires from the two program branches. In total, the studyhad 521 (N=521) useable questionnaires from all program and comparison branches.The survey was conducted from February to April 1999.
DATA FROM THE PHILIPPINES
The Negros Women for Tomorrow Foundation (NWTF) is an NGO located inthe Negros Occidental area of the Philippines. It has been established with theobjective of giving collateral free credit to women to help them achieve self-sufficiency and self-reliance through increasing their income and thus, improving thefulfilment of basic needs. Project Dungganon (PD) is a microcredit project of theNWTF. It was stared in 1988 as a Grameen Bank replication.
The data used in this study was collected by the International Rice ResearchInstitute (IIRI) located in Los Baños in the Philippines as part of a research project.The 197 sample respondents of PD were drawn from the three municipalities ofNegros Occidental, namely, Himamaylan, La Castellana, and Escalante. These threestudy sites were selected based on geographical representation to capture theintensity of poverty in the whole province served by the program. Himamaylan islocated in the southwest part of Negros Occidental. La Castellana is in the centralpart, while Escalante is situated in the north.
28

POVERTY AND MICROFINANCE
Summer/Fall 2008
Twenty percent of the total number of centers under PD branches from thethree municipalities were selected using a table of random numbers for the survey.Sample respondents were randomly selected from every center. One member wasrandomly selected from each group of five people. This is under the assumption thateach group is homogeneous and any member can be a representative of the wholegroup. All primary data were generated from a total of 197 member householdsbelonging to 30 centers and 3 branch offices of PD. The survey was conducted fromMay to June 1998.
RESULTS FROM BANGLADESH
The poverty status of households is determined on the basis of a poverty linebased on the cost of a minimum calorie requirement of 2112 and 58 grams ofprotein per person for maintaining a healthy productive life. The poverty line isestimated at Tk147 per week per equivalent adult male person. If the weekly perequivalent adult male person consumption expenditure of a household falls belowTk147.00, the household is classified as poor and coded as “1” (pov=1). If theweekly per equivalent adult male person consumption expenditure of a householdexceeds Tk147.00, the household is classified as not poor and coded as “0” (pov=0).
TABLE 5-DISTRIBUTION OF POVERTY STATUS OF PROGRAMHOUSEHOLDS AND COMPARISON HOUSEHOLDS BY MEMBERSHIPDURATION(BANGLADESH)22
Table 5 shows the distribution of the poverty status of program as well ascomparison households by membership duration. The table shows that the povertystatus of program households of the Grameen Bank improves with the increase inthe membership duration. In the comparison group category, 64 percent ofhouseholds are poor. Thus, 36 percent of comparison households are not poor. Inthe first membership duration category of program households, 13–48 months, thepercentage of poor households’ declines to 44 percent of program households andconsequently, 56 percent of households are not poor. The percentage of poorhouseholds further declines in the second membership duration category, 49–84
29
www.journalofdiplomacy.org
Poor Not PoorNumber ofHouseholds % Number of
Households %
ComparisonGroup 127 64.47 70 35.53
Program Groups12-48 Months 37 44.44 41 52.5649-84 Months 49 40.83 71 59.1785-Above Months 40 38.46 64 61.54

CHOWDHURY
The Whitehead Journal of Diplomacy and International Relations
months, of program households. In this category, 41 percent of programhouseholds are poor and 59 percent of program households are not poor. In the lastcategory of membership duration, while 38 percent of program households arepoor, 62 percent of program households are not poor. The poverty status ofprogram households in the last membership duration category, 84 months or more,is approximately 26 percent less than that of comparison households. This differencebetween program households and comparison households in terms of the povertystatus indicates that microcredit significantly alleviates poverty of borrowinghouseholds.TABLE 6-LOGIT ANALYSIS OF THE PROBABILITY OF A HOUSEHOLDFALLING BELOW THE POVERTY LINE23
Notes: Ratio of coefficient to its standard error shown in brackets. Equations alsoinclude control variables, but coefficients are not reported. *** p<0.01, ** p<0.05, *p<0.1FIGURE 1-POVERTY AND MICROCREDIT
30
Independent Variable
Dependent Variable: PovertyLinear Model Quadratic Model
Microcredit -0.0160***(0.0039)
-0.0277*(0.016)
Microcredit20.0000121(0.00016)
Number of Obs 500 500LR chi2(26) 165.74 166.28Prob > chi2 0.0000 0.0000Pseudeo R2 0.2391 0.2399

POVERTY AND MICROFINANCE
Summer/Fall 2008
Table 6 shows the results of the logit models that have been formulated foranalyzing the impact of microcredit on poverty of borrowing households inBangladesh. On the right hand side of the models, the membership duration ofhouseholds in the microcredit program of the Grameen Bank has been used as aproxy of microcredit. In the linear specification, the sign of the coefficient of themicrocredit variable is negative. The negative sign of the microcredit variableindicates that poverty of households is decreasing with the increase in membershipduration. The coefficient is significant at less than a 1 percent level. Therefore, it isevident from the results that microcredit significantly reduces poverty of borrowinghouseholds.
In the quadratic specification of the logit model, the coefficient of themicrocredit variable, “Microcredit”, which represents microcredit programmembership duration, is statistically significant at a 10 percent level and it has anegative sign. The sign and the significance level of this coefficient also signify thatmicrocredit program membership significantly reduces poverty of borrowinghouseholds. The sign of “Microcredit2”, which represents the square of microcreditprogram membership duration and has been included to examine the non-linearityin the relationship between microcredit and poverty of households, is positive, but itis not significant at the expected level. The negative sign of “Microcredit” and thepositive sign of “Microcredit2” indicate that microcredit reduces poverty ofborrowing households at a declining rate. Figure 1 also illustrates this finding. Itsuggests that the relationship between microcredit and the poverty level ofborrowing households is negative and this negative relationship is not linear. It alsosuggests that poverty of borrowing households reduces at a faster rate up to amembership duration of sixty months and after that membership duration, thepoverty reduction capacity of microcredit declines. After membership duration ofsixty months, poverty of borrowing households reduces at a slower rate.
Perhaps the reason behind this declining trend in poverty reduction is thateconomies of scale do not exist in micro-enterprises of borrowing households aftersixty months of membership duration due to the limited infrastructural facilities inrural areas of Bangladesh. In short, markets are small in size. When borrowinghouseholds want to increase production of their micro-enterprises, they fail to do itbecause of the shortage in the demand for produced goods and services. Thissituation reduces the ability of borrowing households to increase their incomesignificantly beyond a certain level and reduce poverty at a faster rate.
RESULTS FROM THE PHILIPPINES
A poverty line has been estimated for the survey area, Negros Occidental, on thebasis of the poverty line provided by the National Statistical Coordination Board(NSCB) in 2000. The estimated poverty line is P140.63 per week per adult person.Households with per capita weekly total consumption less than P140.63 have beenregarded as poor and coded as “1” (pov=1). Households with per capita weekly totalconsumption equal to or greater than P140.63 have been regarded as non-poor and
31
www.journalofdiplomacy.org

CHOWDHURY
The Whitehead Journal of Diplomacy and International Relations
coded as “0" (pov=0).TABLE 7-DISTRIBUTION OF THE POVERTY STATS OF PROGRAMHOUSEHOLD AND COMPARISON HOUSEHOLDS BY THE NUMBER OF
LOANS TAKEN
Table 7 shows the distribution of the poverty status of program as well ascomparison households by the number of loans taken. It shows that the povertystatus of borrowing households improves with the increase in the number ofmicrocredit loans taken. In the comparison group category, 61 percent ofhouseholds are poor and thus, 39 percent of comparison households are not poor.In the first category of program households which took 2–4 loans, 59 percent ofhouseholds are not poor. The incidence of poverty among these households is 3percent lower than that of comparison households. The percentage of poorhouseholds further declines in the second category of program households. Thesehouseholds took 5 or more microcredit loans. In this category of programhouseholds 54 percent are poor and 46 percent are not poor. The extent of povertyin these program households is 7 percent lower than that of comparison households.The declining trend in the poverty status of borrowing households with the increasein the number of loans taken signifies the poverty reduction capacity of microcreditin the Philippines.
TABLE 8-LOGIT MODELS ON POVERTY IN THE PHILIPPINES25Notes: Ratio of coefficient to its standard error shown in brackets. Equations alsoinclude control variables but coefficients not reported. *** p<0.01, ** p<0.05, *
32
Poor Not PoorNumber ofHouseholds % Number of
Households %
Comparison Group 20 60.6 13 39.3Program Groups2-4 Loans 57 58.8 40 41.25-Above Loans 34 54.0 29 46.0
IndependentVariable
Dependent Variable: PovertyLinear Model Quadratic Model
Microcredit -0.0000393*(0.000024)
0.0000114(0.000063)
Microcredit2-1.49e-09(1.99e-09)
Number of obs 176 176LR chi2(21) 30.51 31.49Prob > chi2 0.0823 0.0865Pseudo R2 0.1274 0.1315

POVERTY AND MICROFINANCE
Summer/Fall 2008
p<0.1
FIGURE 2-MICROCREDIT AND POVERTY OF BORROWING HOUSEHOLDS
Table 8 shows the results of the logit models that have been formulated foranalyzing the impact of microcredit on poverty of borrowing households in thePhilippines. In the right hand side of the models, the current amount of microcreditof borrowing households has been used as a proxy of microcredit. The coefficientsof the microcredit variables in linear as well as quadratic logit models indicate thatpoverty of borrowing households reduces with the increase in total amount ofmicrocredit. The coefficient of the microcredit variable, “Microcredit”, in the linearmodel is significant with the expected negative sign. This means microcredit reducespoverty of borrowing households significantly. The coefficient of “Microcredit” inthe quadratic model does not have the expected negative sign, but “Microcredit2”has the expected negative sign. The net effect of these two variables, “Microcredit”and “Microcredit2”, is negative, which is illustrated in figure 2. This means theparticipation in microcredit programs reduces poverty of borrowing households.However, the declining trend in poverty is slower up to a loan amount of P20,000.The same trend increases after P20,000 and it continues up to P45,000. The decliningtrend again becomes slower after a loan amount of P45,000. This is perhaps due tothe fact that a loan amount of P20,000 is not adequate compared to the requirementof households and a loan amount more than P45,000 is too big to manage thesehouseholds.
33
www.journalofdiplomacy.org

CHOWDHURY
The Whitehead Journal of Diplomacy and International Relations
CONCLUSION
In developing countries, especially in Bangladesh and the Philippines, poorpeople are excluded from the formal financial sector credit services due to thecollateral requirements needed to obtain a loan. Informal financial sector sources,especially moneylenders, are exploitative in nature. Therefore, poor people do notreceive the minimum amount of capital, which is required to start any incomegenerating activities, from either of the financial sector sources. In Bangladesh,Professor Muhammad Yunus initiated the microcredit program in 1976 andestablished the Grameen Bank in 1986, to alleviate poverty of poor households byproviding them with the minimum amount of capital as credit without collateral andexploitation. Following the success of the Grameen Bank, its model has beenreplicated in more than 100 countries all over the world.
This paper has assessed the impact of microcredit on the poverty level ofborrowing households in Bangladesh and the Philippines. The results fromBangladesh and the Philippines show that the poverty of borrowing householdsdecreases with the increase in microcredit program membership duration andmicrocredit loan size. The negative relationship between microcredit programparticipation and poverty of borrowing households is not linear in both thecountries. In the case of Bangladesh, the poverty reduction capacity of microcreditdeclines after the membership duration of sixty months. In the Philippines, thedeclining trend in poverty, due to the participation in the microcredit program, isslower up to a loan amount of P20,000. The same trend becomes faster afterP20,000 and it continues up to P45,000. The declining trend again becomes slowerafter a loan amount of P45,000. Nonetheless, the overall results from Bangladeshand the Philippines indicate that participation in microcredit programs does, indeed,reduce the poverty of borrowing households.
Notes1 P.K. Bardhan, “Interlocking Factor Markets and Agrarian Development: A Review of Issues,” OxfordEconomic Papers 35 (1980); Amit Bhaduri, The Economic Structure of Backward Agriculture (India: Macmillan IndiaLimited, 1983); Prabhu Ghate et al., Informal Finance: Some Findings from Asia (Asian Development Bank,Oxford University Press, 1992); Dipak Ghosh, “Monetary Dualism in Developing Countries,” Economies etSocietes 20 no. 2 (Feb 1986): 19-30; J. Mohan Rao, “Interest Rates in Backward Agriculture: Notes andComments,” Cambridge Journal of Economics 4 (1980): 159-167.2 Ibid.3 Mohammad Yunus, Plenary Opening Speech (Microcredit Summit, Washington, D.C., February 2-4).4 Ibid.5 Ibid.6 Michael Bruntrup, Afroza Huda, S. M. Alauddin and Mizanur Rahman, “Impact Assessment of ASA.”Dhaka: Association for Social Advancement (ASA, 1997).7 Shams Mustafa et al., “Beacon of Hope: an Impact Assessment Study of BRAC's Rural DevelopmentProgramme,” Bangladesh Rural Advancement Committee (BRAC); Mahabub Hussain, “Credit for the Poor,”Research Monograph, No. 4, Bangladesh Institute of Development Studies (1984).8 Mahabub Hussain, “Credit for Alleviation of Rural Poverty: The Grameen Bank in Bangladesh,”International Food Policy Research Institute, February, 1988. Available at:http://www.ifpri.org/pubs/ABSTRACT/rr65.asp (accessed June 23, 2008); Mahbub Hussain and A. M.Muazzam, eds., Poverty Alleviation and Empowerment: The Second impact Study of Brac’s Rural Development Program
34

POVERTY AND MICROFINANCE
Summer/Fall 2008
(Dhaka: BRAC, 1998); Shahidur R. Khandker, and Osman H. Chowdhury, “Targeted Credit Programmes andRural Poverty in Bangladesh,” The World Bank, 1996; M.J.A.D. Chowdhury, D. Ghosh and R. E. Wright, “TheImpact of Micro-credit on Poverty: Evidence from Bangladesh,” Progress in Development studies 5, no. 4 (2005):1-12.9 UNDP, “Human Development Report 1999,” (New York: Oxford University Press, 2000).10 Binayak Sen, “Rural Poverty Trends, 1963-64 to 1989-90,” in Rethinking Rural Poverty, eds. Hossain ZillurRahman and Mahbubur Hossain (New Delhi: Sage Publications, 1995); Mustafa Kamal Mujeri,“Measurement Techniques of Poverty and Poverty Trend in Bangladesh (in Bangla),” in Rushidan IslamRahman, Poverty and Development (Dhaka: Bangladesh Institute of Development Studies, 1997); PovertyReduction and Economic Management Sector Unit, South Asia Region, “Poverty in Bangladesh: Building onProgress,” The World Bank, December, 2002. Available at:http://wwwwds.worldbank.org/servlet/WDSContentServer/WDSP/IB/2003/07/26/000094946_03050804024314/Rendered/PDF/multi0page.pdf (accessed June 23, 2008).11 M. Muqtada, “Poverty and Inequality: Trends and Causes,” in Bangladesh-Selected Issues in Employment andDevelopment, eds. R. Islam and M. Muqdata (New Delhi: ILO-ARTEP ,1986).12 S.R. Osmani and A. Rahman, “Income Distribution in Bangladesh,” Bangladesh Institute of DevelopmentStudies (Dhaka), 1986. 13 BBS (various Years); Household Expenditure Survey; Dhaka: Bangladesh Bureau of Statistics (BBS),Government of the Peoples Republic of Bangladesh.14 Poverty Reduction and Economic Management Sector Unit, South Asia Region, “Poverty in Bangladesh:Building on Progress.” 15 Sen, “Rural Poverty Trends”; Mujeri, “Measurement Techniques of Poverty”; (1997); Poverty Reductionand Economic Management Sector Unit, South Asia Region, “Poverty in Bangladesh: Building on Progress.”16 ADB, “Poverty in the Philippines: Income, Assets, and Access,” Asian Development Bank, January, 2005.Available at: http://www.adb.org/Documents/Books/Poverty-in-the-Philippines/Poverty-in-the-Philippines.pdf (accessed June 23, 2008).17 CDF, “CDF Statistics: Microfinance Statistics of NGOs and Other MFIs, Volume 11,” Dhaka: Credit andDevelopment Forum (CDF, 2004).18 Ronald Chua and Gilberto M. Llanto, “Assessing the Efficiency and Outreach of Microfinance Schemes,”(working paper, ILO, Geneva, 1995). Available at:http://www.microfinancegateway.org/files/1384_01384.htm (accessed June 23, 2008).19 Data from The Mix Market, “Profile for ASA Philippines,” (ASA Philippines Foundation). Available at:http://www.mixmarket.org/en/demand/demand.show.profile.asp?ett=2396 (accessed June 23, 2008).20 Chowdhury, “Microcredit, Enhancement of Entitlement”;Chowdhury et al., “The Impact of Micro-crediton Poverty”; Coleman, B.E, “The Impact of Group Lending in Northeast Thailand,” Journal of DevelopmentEconomics (1999): 105-141.21 Each Grameen Bank branch consists of 50-60 centers, each centre consists of 8 groups and each groupconsists of 5 members. 22 Author’s calculations.23 Author’s calculations; Ratio of coefficient to its standard error shown in brackets. Equations also includecontrol variables, but coefficients are not reported. *** p<0.01, ** p<0.05, * p<0.124 Author's calculations.
35
www.journalofdiplomacy.org
