potw sludge sampling and analysis guidance … states environmental protection agency office of...
TRANSCRIPT
United States Environmental Protection Agency
Office Of Water EPA 833-B-89-100 (4203) August 1989
EPA POW Sludge Sampling And Analysis Guidance Document
TABLE OF CONTENTS
Page
ACKNOWLEDGEMENTS ............................................ vi
1. INTRODUCTION ........................................... 1-1
2. SLUDGE SAMPLING ........................................ 2-1
2.1 BACKGROUND INFORMATION............................ 2-1
2.1.1 2.1.2
2.2 SAMPLE
2.2.1
2.2.2
2.3 SAMPLE
2.3.1 2.3.2
2.4 SAMPLE
2.5 SAMPLE
Solids Content and Viscosity ............... 2-1 Processed Sludge Characteristics ........... 2-2
2.1.2.1 Anaerobically Digested Sludge ..... 2-2 2.1.2.2 Aerobically Digested Sludge ....... 2-3 2.1.2.3 Dewatered Sludges ................. 2-3 2.1.2.4 Compost Product ................... 2-3 2.1.2.5 Dried Powder ...................... 2-3
POINT SELECTION ............................ 2-4
General Considerations ..................... 2-4
2.2.1.1 Sample Point Representation of the Entire Sludge Stream .......... 2-4
2.2.1.2 Availability of Flow Data and/or Solids Data ....................... 2-7
Sludge Sample Points ....................... 2-8
COLLECTION ................................. 2-8
Sampling Equipment ......................... 2-11 Proper Sampling Practices .................. 2-12
SIZE, SAMPLE TYPE, AND SAMPLING FREQUENCY . . 2-14
PREPARATION AND PRESERVATION ............... 2-19
Sample Container Material .................. 2-20 Sample Container Preparation ............... 2-20 Sample Preservation ........................ 2-21 Holding Time Prior to Analysis ............. 2-22
2.5.1 2.5.2 2.5.3 2.5.4
2.6 PACKAGING AND SHIPPING................................. 2-22
2.6.1 Packaging .................................. 2-22 2.6.2 Transportation Regulations ................. 2-22
iii
TABLE OF CONTENTS (Continued)
Page
2.7 DOCUMENTATION..................................... 2-24
2.7.1 Sample Labeling ............................ 2-24 2.7.2 Chain-of-Custody ........................... 2-26 2.7.3 Sampling Log Book .......................... 2-27
2.8 SAFETY CONSIDERATIONS.............................. 2-27
3. ANALYTICAL PROCEDURES................................. 3-1
3.1 CONVENTIONAL AND INORGANIC POLLUTANT PARAMETERS... 3-2 3.2 METALS ........................................... 3-6
3.2.1 Analyte Isolation/Preparation Overview..... 3-6 3.2.2 Analytical Techniques for Metals........... 3-8
3.2.2.1 Sample Preparation/Digestion ...... 3-8 3.2.2.2 Analytical Detection Methods ...... 3-9
3.3 ORGANICS . . . . . . . . . . . . . . . . . . . . . . . . . . 3-18
3.3.1 Overview of Analyte Extraction and Isolation.................................. 3-18
3.3.2 Recommended Analytical Techniques for Organics................................... 3-22
3.3.2.1 Methods 1624C and 1625C ........... 3-23 3.3.2.2 Methods 624-S and 625-S ........... 3-25
3.4 PATHOGENIC MICROORGANISMS.......................... 3-26
4. QUALITY ASSURANCE...................................... 4-1
5. SAMPLING AND ANALYTICAL COSTS.......................... 5-1
5.1 MANPOWER REQUIREMENTS ............................. 5-1 5.2 IN-HOUSE ANALYTICAL COSTS ......................... 5-2 5.3 CONTRACT ANALYTICAL COSTS ......................... 5-4 5.4 SAMPLING EQUIPMENT COSTS .......................... 5-4 5.5 Opportunities for Cost Savings .................... 5-7
6. REFERENCES............................................. 6-1
A. APPENDIX A: Chain of Custody Form...................... A-1
B. APPENDIX B: Determination of Volatile Solids Reduction. B-1
iv
LIST OF TABLES
Table
2.1
2.2
2.3
2.4
2.5
3.1
3.2
3.3
3.4
3.5
3.6
5.1
5.2
Sludge Flow Measurement Devices .......................
Sludge Sampling Paints ................................
Containers, Preservation, Holding Times, and Minimum Sample Volume .........................................
Potential Interferences Associated with Sampling Shipping and Storage ..................................
Standard Preservatives Listed in the Hazardous Materials Table (49 CFR 172.101) Used by EPA for Preservation of Water, Effluent, Biological, Sediment and Sludge Samples ....................................
Analytical Techniques for Conventional and Inorganic Pollutants in Sludge ..................................
Recommended Preparation Technique for Elemental Analysis of Sludge Samples ............................
Comparison-Summary of ICAP and AAS ....................
Recommended Inductively Coupled Wavelengths and Estimated Instrumental Detection Limits ...............
Atomic Absorption Flame and Furnace Instrumental Detection Limits for Wastewater Samples ..............
Analytical Techniques for Determination of Pathogenic Microorganisms in Sewage Sludge .......................
Sampling Manpower Needs ...............................
Typical Contract Analytical Costs for Commonly Analyzed Sludge Parameters ............................
Page
2-9
2-9
2-15
2-23
2-25
3-3
3-10
3-12
3-14
3-16
3-29
5-2
5-5
V
ACKNOWLEDGMENTS
This guidance document was completed under the direction of
Cristina Morrison, of the U.S. EPA's Office of Water Enforcement
and Permits (OWEP), with assistance from Tom Wall, also of OWEP.
This document was prepared by Science Applications International
Corporation (SAIC) under EPA Contract No. 68-01-7043. The
document was revised to address peer review comments under EPA
Contract No. 68-C8-0066.
The SAIC Work Assignment Manager was Werner H. Zieger.
Significant contributions were made by Jorge McPherson, John
Sunda, and Mark Klingenstein.
This document has been peer reviewed. EPA wishes to
acknowledge the valuable review and comments provided by the
following entities:
•
•
•
•
•
•
•
•
•
•
•
•
•
•
•
•
EPA Region 3
EPA Region 5
EPA Region 9
EPA Region 10
EPA Environmental Monitoring Support Laboratory
AMSA
California State Water Resources Control Board
Connecticut Department of Environmental Protection
Eli Lilly and Company
Eugene Oregon Public Works Department
LA County Sanitation District
Missouri Department of Natural Resources
Nampa, Idaho Wastewater Division
Ohio EPA
Unified Sewerage Agency of Washington County
John F. Morrison, P.E., American Society of Quality
Control Engineers
1. INTRODUCTION
The passage of the 1987 amendments to the Clean Water Act
brought about significant changes in the regulation of the use
and disposal of municipal sewage sludge. Although the Clean
Water Act had required since 1977 that EPA develop technical
standards for sludge use and disposal, the 1987 amendments
required that these standards, when promulgated, be implemented
through permits. The amendments also state that prior to
promulgation of the technical standards, EPA must include sludge
conditions in NPDES permits issued to publicly-owned treatment
works or take other appropriate measures to protect public health
and the environment from pollutants in sewage sludge. This
requirement has initiated a program for "case-by-case" permitting
to ensure protection of the environment prior to the issuance of
final sludge standards which are scheduled for promulgation in
October 1991.
This focus on sludge permitting places increased emphasis on
the need to assess sewage sludge quality. In policy and guidance
documents that EPA has developed for implementing the sludge
requirements of the Clean Water Act, the Agency has recommended
that POTWs sample and analyze their sludge at least annually to
determine if the sludge quality is such that the sludge may be
safely reused and recycled or disposed. Accurate character-
ization of sludge composition spots operational problems at the
treatment works and may also signal adverse environmental
impacts. In addition, sludge sample and analysis is needed to
assess compliance with current requirements (e.g., 40 CFR Part
257 requirements for cadmium and PCBs).
1-1
In view of the variability of municipal sludge quality, appropriate procedures must be followed to collect and analyze samples that accurately represent each POTW's sludge quality. This manual was developed to provide that guidance to POTW operators, engineers, managers, chemists and permit writers. It was intended to provide guidance in developing and implementing a sampling and analysis program, to gather information on sludge
quality and determine compliance with permit conditions. This
manual is based on current, state-of-the-art field and laboratory
practices and therefore is recommended for all sludge sampling and analysis programs.
1-2
2. SLUDGE SAMPLING
2.1 BACKGROUND INFORMATION
Depending on the use or disposal practice, it may be
necessary to sample various sludge types throughout a given POTW.
In order to sample a sludge stream effectively, it is necessary
for sampling personnel to be aware of the physical
characteristics of the sludge stream(s) at intended sampling
locations.
2.1.1 Solids Content and Viscosity
Two important physical characteristics of sludge with
respect to sampling and analysis are viscosity and solids
content. Solids content is the percent, by weight, of solid
material in a given volume of sludge. Sludges have a much higher
solids content than most wastewaters. Solids content and solids
settling characteristics determine whether a given sludge will
separate into different fractions which increases the potential
of obtaining a nonrepresentative sample.
Viscosity is the degree to which a fluid resists flow under
an applied force. The viscosity of a sludge is only somewhat
proportional to solids content. This property affects the
ability to automatically sample a liquid, since friction through
pipes is proportional to liquid viscosity. In general, sludges
of up to 20 percent solids may be conveyed by means of a pump.
Sludge with a greater solids content, often referred to as sludge
cake, must be conveyed by mechanical means. Automatic samplers
that rely on pumps may be useful only for liquid sludges with a
solids content of less than 20 percent. However, sludge cakes
require manual grab sampling. Other problems created by sludge
2-1
solids (see Section 2.3.1) generally preclude the use of auto-
matic samplers.
Solids content is also significant from an analytical stand-
point. Increased solids content may require sample dilution and
cause a corresponding increase in experimental error and
detection limits. Also, water removal through dewatering can
either concentrate parameters of interest in the sludge and
increase analytical accuracy, or carry away pollutants and
decrease pollutant concentration and analytical accuracy.
Analytical precision (repeatability) and accuracy (closeness to
true value) may also decrease as the concentration of interfering
compounds and matrix effects increase, due to higher solids
content after dewatering.
2.1.2 Processed Sludge Characteristics
The quantity and quality of sludge generated depends on raw
wastewater characteristics and the sludge treatment practices.
The sludge to be sampled may be in the form of a liquid,
dewatered cake, compost product, or dried powder. Some of the
physical characteristics of each sludge type are described below.
2.1.2.1 Anaerobically Digested Sludge
Anaerobically digested sludge is a thick slurry of
dark-colored particles and entrained gases. When well digested, it dewaters easily and has a non-offensive odor. The addition of
chemicals coagulates a digested sludge prior to- mechanical
dewatering. The dry residue of digested sludge contains 30 to 50
percent volatile solids. Depending on the mode of digester
operation, the percent solids of digested sludges ranges from 4
to 8 percent.
2-2
2.1.2.2 Aerobically Digested Sludge
Aerobically digested sludge is a dark-brown, flocculent, relatively inert waste produced by long-term aeration of sludge. The suspension is bulky and generally difficult to thicken. The odor of aerobically digested sludge is not offensive. The
percent solids of aerobically digested sludge is less than that of the influent sludge (if not decanted), because approximately 50 percent of the volatile solids are converted to gaseous end products during aerobic digestion.
2.1.2.3 Dewatered Sludges
Dewatering converts sludge from a flowing mixture of liquids and solids to a cake-like substance more readily handled as a
solid. The characteristics of dewatered sludge depend on the type of sludge, chemical conditioning, and treatment processes employed. The percent solids content of dewatered cake ranges from 15 to >40 percent. Cake with a lower percent solids is similar to a wet manure, while cake with a higher percent solids
is a chunky solid.
2.1.2.4 Compost Product
Composting is a process in which organic material undergoes biological degradation to a stable end product. Properly composted sludge is a sanitary, nuisance-free, humus-like material containing 75 to 80 percent solids. Approximately 20 to
30 percent of the volatile solids are converted to carbon dioxide
and water.
2.1.2.5 Dried Powder
Dried powder is the residue from heat drying processes. Sludge drying reduces water content by vaporization of water to permit sludge grinding, weight reduction, and to prevent
2-3

continued biological action. The moisture content of dried sludge is less than 10 percent.
Incinerator ash is a product of the incineration of sewage sludge. Ash is therefore not covered under the sampling or analysis of sewage sludge. It is covered under RCRA Subtitle C if it is a hazardous waste and if not it falls under Subtitle D.
2.2 SAMPLE POINT SJZLECTION
2.2.1 General Considerations
NPDES, pretreatment and sludge program officials need sludge quality data in order to determine whether sludge use or disposal may pose a threat to public health or the environment. Thus, as a general rule, sludge samples should be drawn from an appropriate sampling point and in such a manner that the sample represents, as well as possible, the quality of the sludge as it will be disposed of or used. When selecting a specific sample point, the following two factors should be carefully considered:
0 Does the sample point represent the entire sludge stream?
0 Are the sludge stream flow or mass flux data available?
The following paragraphs examine both factors and present recommendations on means to address each factor.
2.2.1.1 Sample Point Representation of the Entire Sludge Stream
Often it is not possible to obtain a wholly representative sample of a given wastestream at any one time. Effort must be
made, however, to ensure that a sample is obtained that is as representative as possible. Three cLncerns that need to be
2-4
addressed to ensure that the sample points selected will provide representative samples of the entire sludge stream are: obtaining samples that are representative of the cross-section of the entire flow; obtaining well mixed samples; and obtaining
samples of multiple sludge streams.
A particular concern in any sampling program is to obtain samples which represent the entire flow past the sample point throughout the sample period. Each discrete sample should
represent the cross-section of the entire flow at the sampling point. Each composite sample of multiple contributory streams should represent the cross-section of the entire flow of the combined stream.
Samples should be obtained from points where the sludge is well-mixed. While some pollutant parameters are predominantly
associated with the solids fraction (particularly precipitated
metals), others are more associated vith the liquid-fraction
(many dissolved organics). Failure to acquire a sample with
representative solid/liquid fractions can significantly affect the analytical results of a given sample. This is particularly
true of sludge streams wit:? high percent solids and large flee
particles. Since turbulence ensures mixed samples, these recommendations should be followed:
0 In sludge processing trains, samples from taps ,on the discharge side of sludge pumps are well mixed since flow at this point in the system is turbulent with no solids separation within the flow stream.
0 If a sample is drawn from a tap on a pipe containing sludge which is distant from the sludge pumps, the average flow velocity through the pipe should be greater than 2 feet per second (fpsl. Average velocities of less than 2 fps result in solids separation and settling, and affect samr;le solids content, depending on the location of the tap (top,
2-5
side or bottom of the pipe). Given a choice, a tap on the side of the pipe is preferable. In addition, the tap should be a large size to encourage draw from the entire cross-section of flow when fully open.
At times it may be necessary to sample a poorly mixed open channel flow. If this cannot be avoided, then each sample must be a composite consisting of grabs taken at several levels (l/4,
l/2 and 3/4 depth, for example) in order to minimize sample bias caused by solids stratification. For sampling solid sludges (i.e. dewatered cake, compost, etc.), stratification can be avoided by not only sampling at various depths, but at numerous locations over the entire sludge pile.
Although it is preferable to sample sludge just prior to its exit from the treatment plant in a combined stream, sometimes that is not possible. Therefore, a consideration in many sludge sampling situations is the need to produce a composite sample from confluent streams. PLn example is the sampling of sludge flows from several parallel sources which later combine downstream in an unsafe or inaccessible location. Several options exist to accommodate multiple streams. The most appropriate choice depends on the sludge flow and solids flux information available, the parameters being sampied and the purpose of the generated data. Several options are as follows:
0 The simplest oFtion is to withdraw equal volumes of sample from each of the multiple sludge streams tc create a composite sample. This approach is justified in the case of identical units receiving equal flow and generating equal sludge amounts.
0 A second option is to weight the grab samples in each composite according to the wastewater flow to each unit (or in the case of filter cake, the thickened sludge flow to each unit;. This approach recognizes that for different sized units ;rith different design flows, the volume of sludge produced *dill theoretically be
2-6
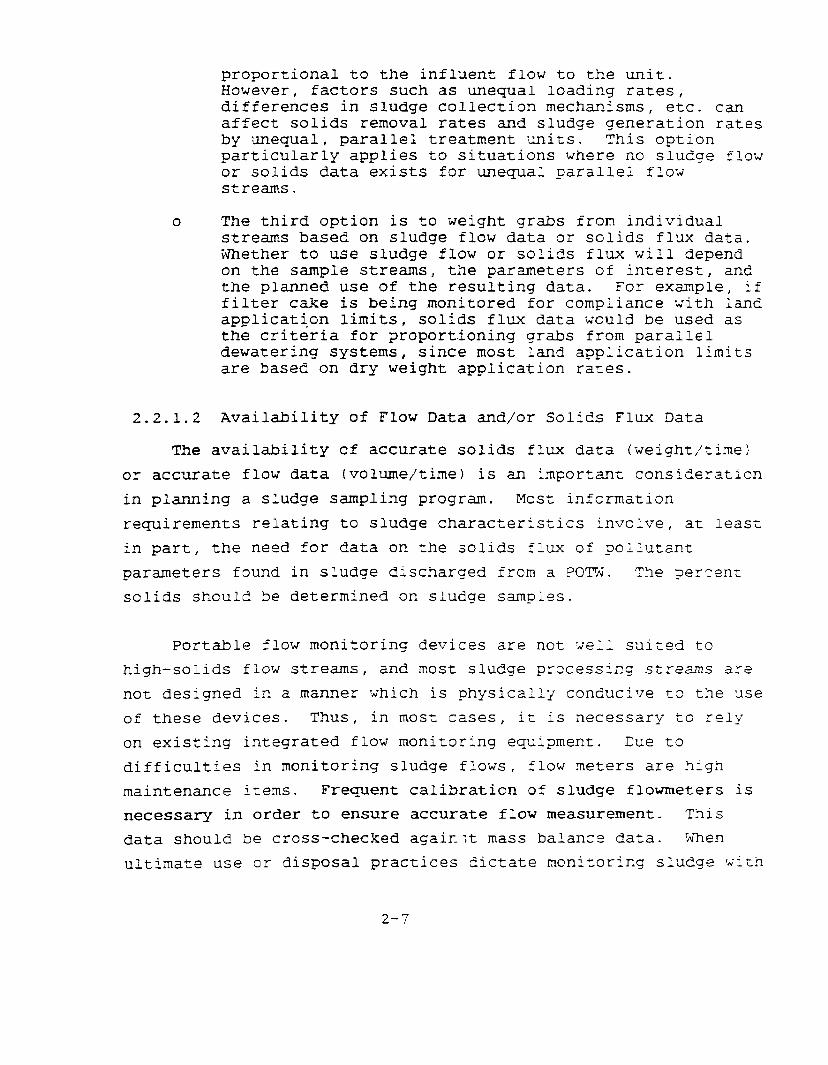
proportional to the influent flow to the unit. However, factors such as unequal loading rates, differences in sludge collection mechanisms, etc. can affect solids removal rates and sludge generation rates by unequal, parallel treatment units. This option particularly applies to situations where no sludge flow or solids data exists for unequa: parallel flow streams.
0 The third option is to weight grabs from individual streams based on sludge flow data or solids flux data. Nhether to use sludge flow or solids flux will depend on the sample streams, the parameters of interest, and the planned use of the resulting data. For example, if filter cake is being monitored for compliance ;ylith land applicati.on limits, solids flux data would be used as the criteria for proportioning grabs from parallel dewatering systems, since most land appiication limits are based on dry weight application rates.
2.2.1.2 Availability of Flow Data and/or Solids Flux Data
The availability of accurate solids flux data (weighti'time; or accurate flow data (volume/time) is an Inportanc, consideration in planning a sludge sampling program. Most information
requirements relating to sludge characteristics involve, at least in part, the need for data on the solids flux of 2o;lutant
parameters found in sludge discharged from a ?073~. T3e 3erclnt - - - solids should be determined on sludge sampies.
Portable flow monitoring devices are not well suited to high-solids flow streams, and most sludge prccessing streams are not designed in a manner which is physicall;r conducive to the use of these devices. Thus, in most cases, it is necessary tc rely
on existing integrated flow monitoring equipment. Due to
difficulties in monitoring sludge flows, flow meters are high
maintenance items. Frequent calibration of sludge flowmeters is
necessary in order to ensure accurate flow measurement. This
data should be cross -checked agair_;t mass balance data. ~Xhen
ultimate use cr disposal practices dictate monic,oring sludge with
2-7

a high solids content, liquid flow meters are replaced by gross weight scales. Table 2.1 summarizes the types of flow measurement equipment employed to monitor various sludge flows.
2.2.2 Sludcre SamDle Points
The determination of the appropriate sludge sampling point is dependent on the rationale behind the sampling. For permits and regulation enforcement, sludge samples must come from the treatment unit process immediately preceding disposal or use. For example, if a POTS disposes of its dewatered filter cakes in
a sanitary landfill, then sampling activity focuses on the output sludge stream from the dewatering device (i.e., vacuum filter, belt filter, etc.). The sludge treatment processes commonly employed are stabilization, dewatering, drying, cornposting, and thermal reduction. Table 2.2 surmnarizes sampling points for these processes. Other sludges sampling points may be necessary to examine the origin or fate of pollutants within a POT,, (i.e., additional sludge samples from influent and output of other processes may be needed).
2.3 SAMPLE C3LLXTION
Having selected appropriate sampling points for a sludge sampling program, it is then necessary to determine the method and equipment by which sampling *dill be.carried out. In ccing
so I the following objectives should be considered:
0 Each grab sample, or aliquot of a composite sample, must be as representative as possible of the total stream flow passing the sampling point
0 Effort must be made to minimize the possibility of sample contamination
0 The selected sampling method should be safe, convenjent and efficient.
2-8
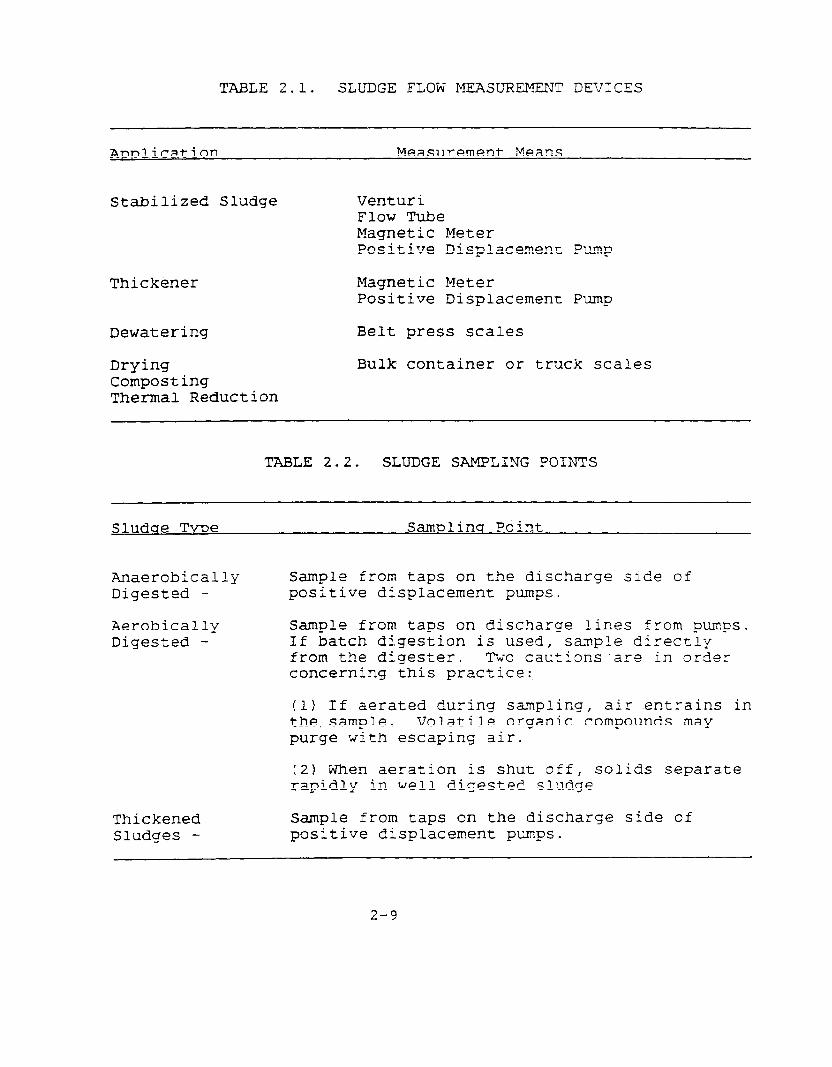
TABLE 2.1. SLUDGE FLOFi MEASUREMENT DEVICES
Aoplication 9easurement Means
Stabilized Sludge Venturi Flow Tube Magnetic Meter Positive Displacement Pump
Thickener Magnetic Meter Positive Displacement Pump
Dewatering Belt press scales
Drying Composting
Bulk container or truck scales
Thermal Reduction
TABLE 2.2. SLUDGE SAMPLING POINTS
Sludge TvDe Samplins Point
Anaerobically Sample from taps on the discharge side of Digested - positive displacement pumps.
Aerobically Digested -
Sample from taps on discharge lines from pumps. If batch digestion is used, sa-rtple directly from the digester. Twc cautions'are in order concerning this practice:
(1) If aerated during sampling, air .entrains in the.sample. Volatile organic compounds may purge with escaping air.
(2) When aeration is shut off, solids separate rapidly in well digested sludge.
Thickened Sludges -
Sample from taps on the discharge side of positive displacement pmps.
2-9
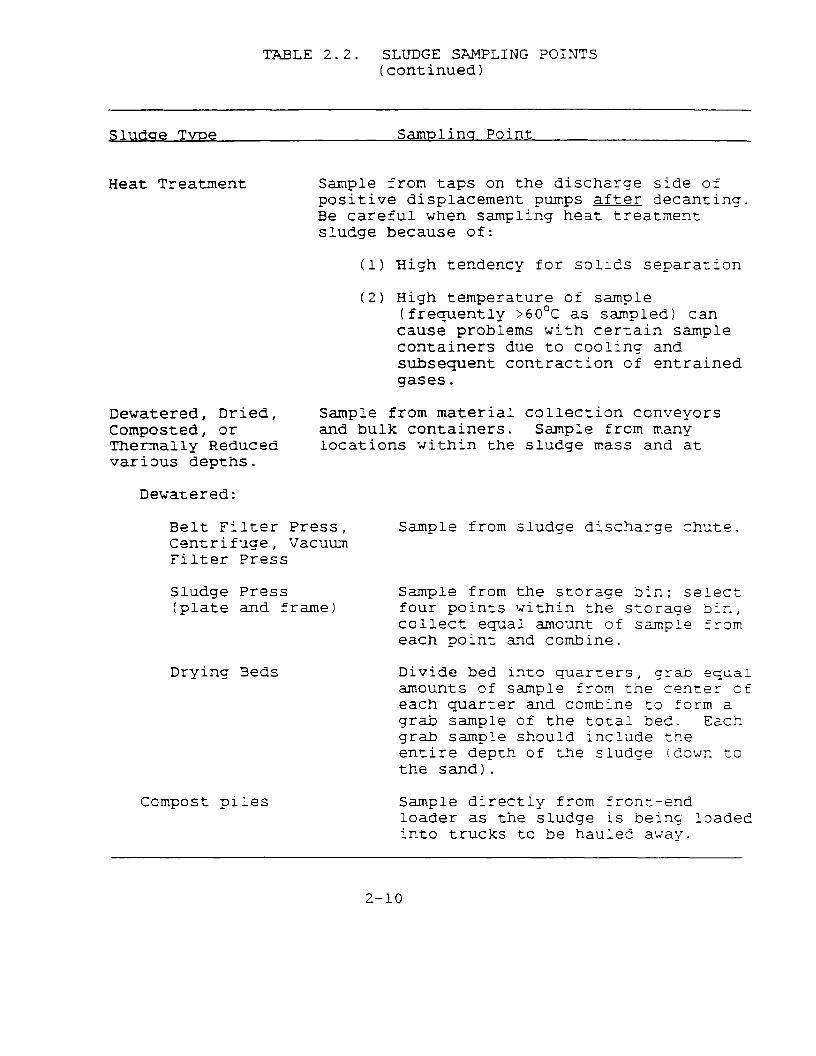
TABLE 2.2. SLUDGE SAMPLING POINTS (continued)
Sludge Tvoe Samolins Point
Heat Treatment Sample from taps on the discharge side of positive displacement pumps after decanting. Be careful when sampling heat treatment sludge because of:
(1) High tendency for solics separation
(2) High temperature of sample (frequently >60°C as sampled) can cause problems with certain sample containers due to cooling and subsequent contraction of entrained gases.
Dewatered, Dried, Sample from material collection conveyors Composted, or and bulk containers. Sample from many Thermally Reduced locations within the sludge mass and at various depths.
Dewatered:
Belt Filter Press, Centrifuge, Vacuum Filter Press
Sludge Press (plate and frame)
Drying Beds
Sample from sludge discharge rhute.
Sample from the storage bin; select four points within the storage bin, collect equal amount of sample from each point and combine.
Divide bed into quarters, arab equal amounts of sample from the center of each quarter and combine to form a grab sample of the total bed. Each grab sample should include z;?e entire depth of the sludge (<own to the sand).
Compost piles Sample directly from front-end loader as the sludge is beins loaded into trucks to be hauled away.
2-10
Except for limitations on the use of automatic sampling devices, the actual,sampling techniques for sludges are similar to those found in wastewater sampling. The following sections describe two important considerations for selecting appropriate sludge sampling methods: sampling equipment and proper sampling practices.
2.3.1 Samnlins Ea-uioment
In general, automatic sampling devices, which are widely used for wastewater streams, do not work well for sludge streams because of the solids content and viscosity of sludges. Automatic samplers which use pumps to draw samples up a suction tube cause solids separation if flow velocity in the suction and discharge tube iS too low. This increases pump head requirements and limits the range of tubing diameter. A second problem which occurs in the use of automatic samplers is fouling of tubing and/or pump structure by sludge solids. This results in contamination of subsequent aliquots during composite sampling. Sludge particles may also plug the sample tube or pumpAng mechanism and interrupt sample collection. Yherefora, it is preferable to sample liquid sludge streams manually, partic-Jlarly if sample taps can be provided on pump discharge lines.
Sampling equipment must be made of materials 'Nihich vi11 not contaminate or react with the sludge. The best material choices are Teflon, glass, and stainless steel because they are relatively inert. When the cost of Teflon and stainless steel equipment prohibits or restricts their use, plastic, steel and/or aluminum may be substituted for most sampling activities. (If steel equipment is used, ensure that galvanized or zinc coated items are not used because these materials will readily release zinc into the sample.1
2-11
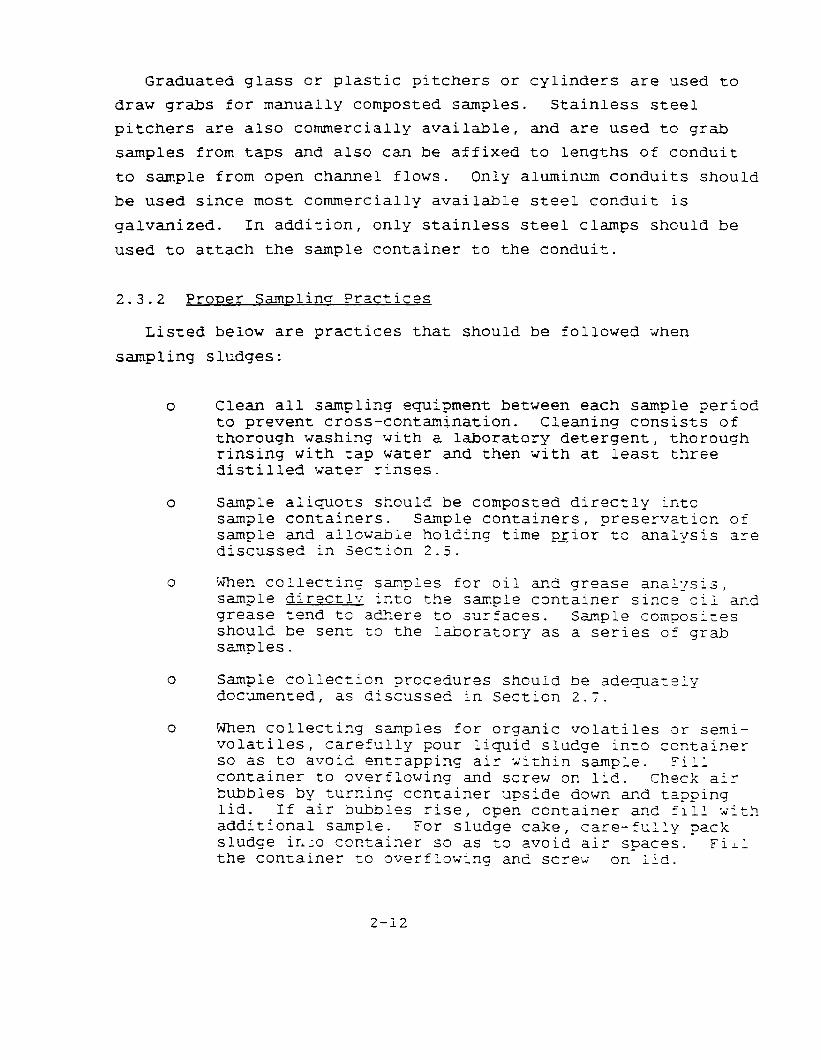
Graduated glass or plastic pitchers or cylinders are used to draw grabs for manually composted samples. Stainless steel pitchers are also commercially available, and are used to grab samples from taps and also can be affixed to lengths of conduit to sample from open channel flows. Only aluminum conduits should be used since most commercially available steel conduit is galvanized. In addition, only stainless steel clamps should be used to attach the sample container to the conduit.
2.3.2 Proper Sampling Practices
Listed below are practices that should be followed ;Ihen
sampling sludges:
0
0
0
0
0
Clean all sampling equipment between each sample period to prevent cross-contamination. Cleaning consists of thorough washing with a laboratory detergent, thorough rinsing with tap water and then ;rith at least three distilled water rinses.
Sample aiiquots should be composted directly into sample containers. Sample containers, preservation of sample and allowable holding time pyior tc analysis are discussed in Section 2.5.
When collecting samples for oil and grease anal:Jsis, sample directlv into the sample container since cil and grease tend to adhere to surfaces. Sample composites should be sent t,o the laboratory as a series of grab samples.
Sampie collecti on procedures should be adequar,oly documented, as discussed in Secticn 2.7.
When collecting samples for organic volatiles or semi- volatiles, carefully pour liquid sludge into ccntainer so as to avoid entrapping air *d:thin sample. -,,1 c; 1
container to overflowing and screw on 11c!. Check air bubbles by turning container upside down and tapping lid. If air bubbles rise, open container and fill Xlth additional sample. For sludge cake, care-fully pack sludge ir,:o container so as to avoid air spaces. Fill the container to overflowing and screld on iid.
2-i2
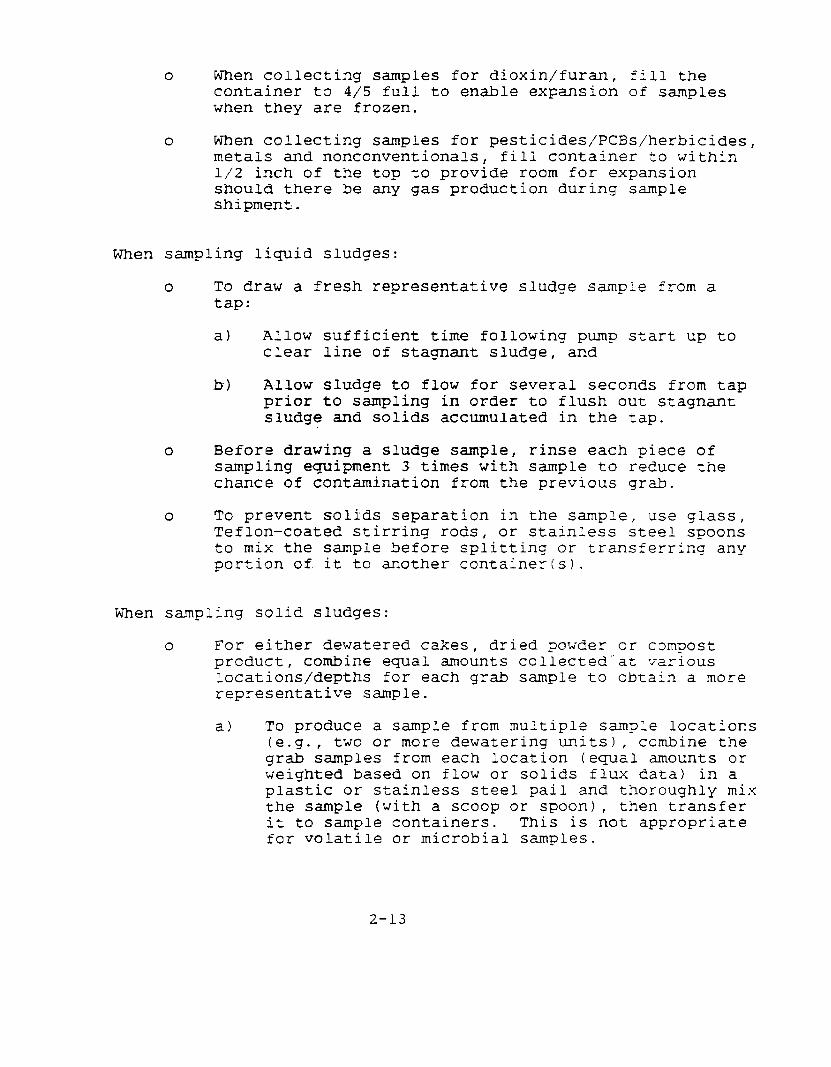
0 When collecting samples for dioxin/furan, fill the container to 4/5 full to enable expansion of samples when they are frozen.
0 When collecting samples for pesticides/PCBs/herbicides, metals and nonconventionals, fill container to within l/2 inch of the top to provide room for expansion should there be any gas production during sample shipment.
When sampling liquid sludges:
0 To draw a fresh representative sludge sample from a tap:
a) Allow sufficient time following pump start up to clear line of stagnant sludge, and
b) Allow sludge to flow for several seconds from tap prior to sampling in order to flush out stagnant sludge and solids accumulated in the tap.
0 Before drawing a sludge sample, rinse each piece of sampling equipment 3 times with sample to reduce the chance of contamination from the previous grab.
0 To prevent solids separation in the sample, use glass, Teflon-coated stirring rods, or stainless steel spoons to mix the sample before splitting or transferring any portion of it to another container(s.1.
When sampling solid sludges:
0 For either dewatered cakes, dried powder or compost prcduct, combine equal amounts collected"at various locations/depths for each grab sample to obtain a more representative sample.
a) To produce a sample from multiple sample locations (e.g., two or more dewatering units), combine the grab samples from each location (equal amounts or weighted based on flow or solids flux data) in a plastic or stainless steel pail and thoroughly mix the sample (with a scoop or spoon), then transfer it to sample containers. This is not appropriate for volatile or microbial samples.
2-13
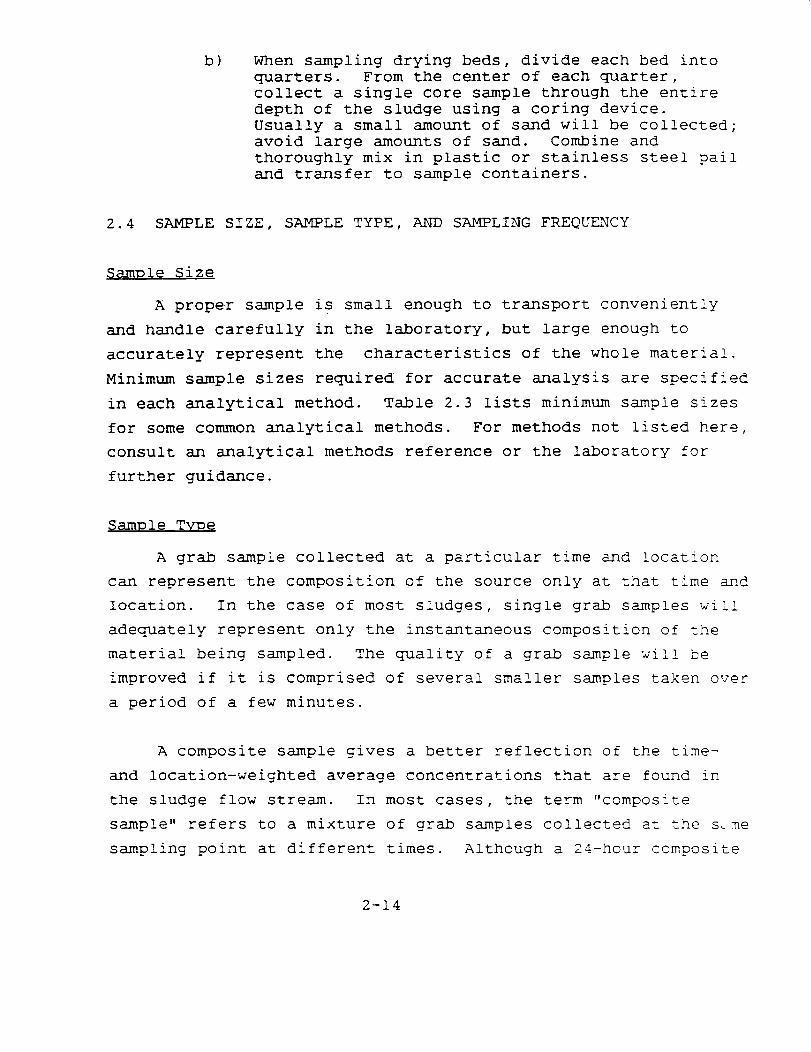
b) When sampling drying beds, divide each bed into quarters. From the center of each quarter, collect a single core sample through the entire depth of the sludge using a coring device. Usually a small amount of sand will be collected; avoid large amounts of sand. Combine and thoroughly mix in plastic or stainless steel pail and transfer to sample containers.
2.4 SAMPLE SIZE, SAMPLE TYPE, AND SAMPLING FREQUENCY
Sample Size
A proper sample is small enough to transport conveniently and handle carefully in the laboratory, but large enough to accurately represent the characteristics of the whole material.
Minimum sample sizes required for accurate analysis are specified
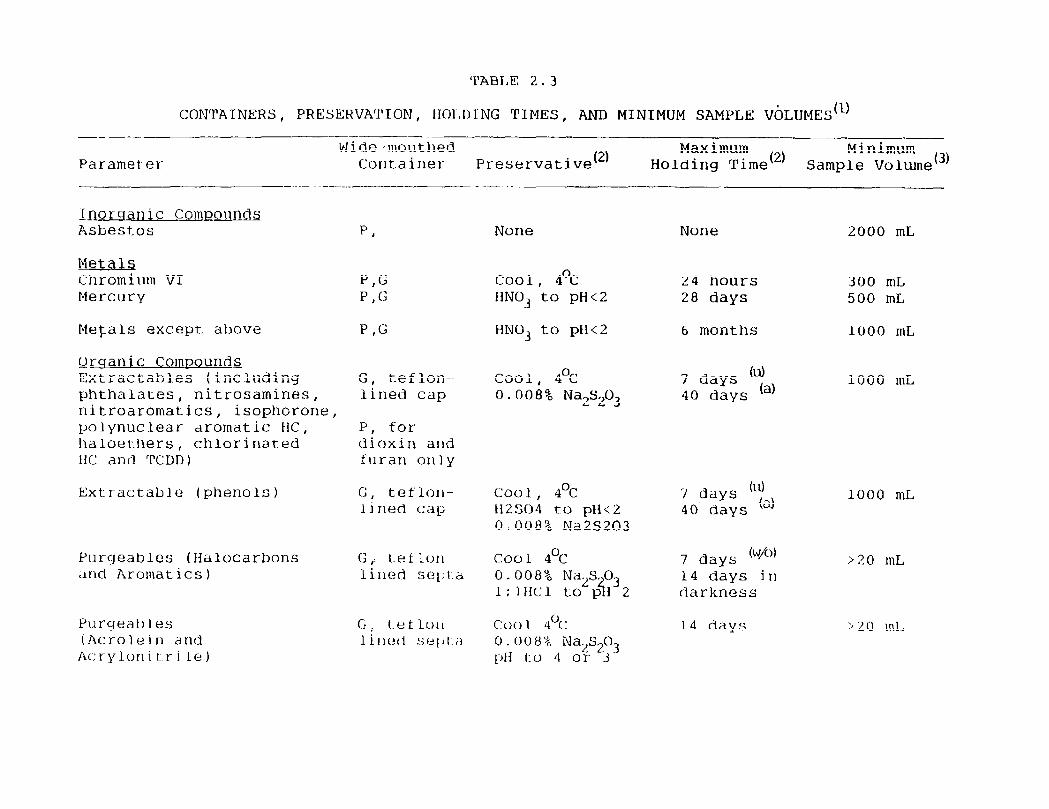
in each analytical method. Table 2.3 lists minimum sample sizes
for some common analytical methods. For methods not listed here,
consult an analytical methods reference or the laboratory for further guidance.
Sample Tvpe
A grab sample collected at a particular time and location can represent the composition of the source only at that time and location. In the case of most sludges, single grab samples will adequately represent only the instantaneous composition of the material being sampled. The quality of a grab sample xi:1 be improved if it is comprised of several smaller samples taken over a period of a few minutes.
A composite sample gives a better reflection of the time- and location-weighted average concentrations that are found in the sludge flow stream. In most cases, the term "composite sample8' refers to a mixture of grab samples collected at the s,ne sampling point at different times. Although a 24-hour composite
2-14
'l'ABT,F 2. 3
CONTATNERS, PRESERVATION, IIOI,D1‘NG TIMES, AND MINIMUM SAMPLE V6LUMES(') -__--..
Parameter Wide-moutlred
Container -
Pr-eservative(*) Maximum
Holding Time (2)
.-...
IInorganic Coinpoun& Asbestos p,
Meta& Chromium VI Mercury
P,G P ,G
Metals except. above P,G
Qrqanic Compounds Extractables (including phthalatcs, nitrosamines, nitroaromatics, isophorone, polynuclear aromatic HC, haloethers, chlorinated tlC and TCDD)
G, teflon- lined cap
P, for dioxin and furan 0111~
Extr-actable (phenols)
Purqeablcs (Halocarbons ,lnd Aromatics 1
Puryeai) I es (Atrroleiin and Act-ylorl i t r i le )
None
cool, 4OC HN03 to pHt2
HN03 to pH<2
Cool, 4OC 0.008% Na2Y203
Coo1 , 4Oc LI2SO4 to pH<2 0.008% Na2S203
None 2000 mL
24 hours 28 days
6 months
7 days (ill 40 days (a)
300 mL 500 mL
1000 mL
1000 mL
7 days b.qto) 14 days in darkness
1.4 clays
1000 mL
>20 mL
;20 ml,
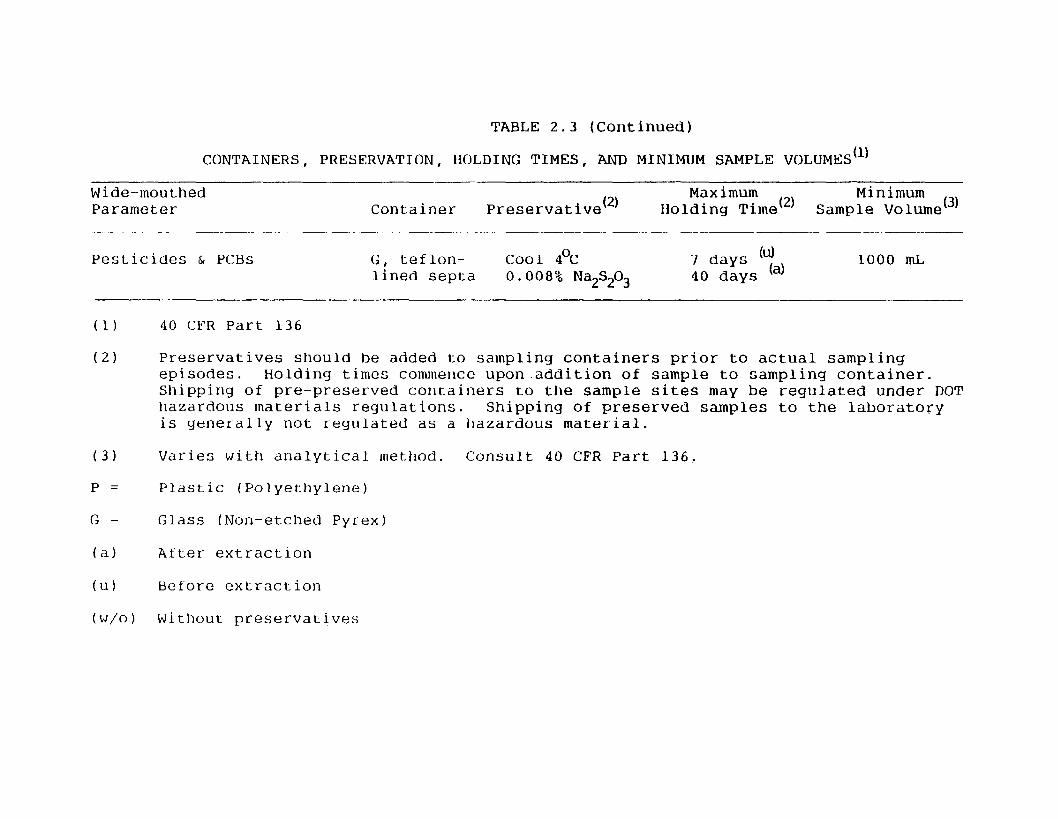
TABLE 2.3 (Continued)
CONTAINERS, PRESERVATION, HOLDING TIMES, AND MlNIMUM SAMPLE VOLUMES('
Wide-mouthed Parameter Container Preservative(*)
Maximum (2) Holding Time
Pesticides 6, PCBs C! teflon- Cool 4Oc 1000 mL lined septa 0.008% Na2S203
(1)
(2)
40 CFR Part 136
Preservatives should he added to sampling containers prior to actual sampling episodes. Holding times commerlce upon addition of sample to sampling container. Shipping of pre-preserved containers to the sample sites may be regulated under DOT hazardous materials regulations. Shipping of preserved samples to the laboratory is generally not regulated as a hazardous material.
(3) Varies with analytical method. Consult 40 CFR Part 136,
P= Plastic (Polyethylene)
(; x Glass (Non-etched Pyrex)
(a) Atter extraction
(u) Before extraction
(w/o) Without preservatives
sample (consisting of a number of time- or flow-weighted grab samples) is more representative than a grab sample, it can give a
picture of only one day's sludge quality. Historical data is necessary to truly represent the sludge quality. A composite for volatile components analysis is produced in the lab from grab samples collected in the field.
Samplinc Freo-uencv
As sludge quality is directly related tc wastewater influent quality (which can vary from day to day and hour to hour),,a POTW should sample and analyze its sludge frequently to cbtain representative data. Collection of representative sludge data is crucial because the permitting authority will use the resultant
analytical data to establish permit monitoring parameters and
frequencies, and thereafter, to assess compliance with the permit and to ascertain if there is a potential for adverse environ-
mental impacts. POTW operators should be aware that EPA's
"Strategy for Interi!! Implementation in Permits Issued to ?OT?Js"
(draft June 1988) to be finalized during the fourth quarter of 1989) sets forth minimum recommended mcnitorlng frequencies to be included in the NPDES permit when it Ls reissued. The Interim Strategy is scheduled to be finalized in the summer of 1989. The NPDES permit ;Jriter may decide based on hisiher best professicnal judgment (BP;) that more frequent monitoring is needed. The sampling frequency will be set out in the POTX's permit.
To the extent practicable, the POT% should have a sludge sampling program k'hich adequately addresses random and cyclic variation within the system and the potential for human exposure to sludge once it is disposed of or used.
0 Anticipated cyclical variation in pollutant loadings - although they are difficult tc accurately predict, anticipated cycles include daily industrial production
2-17
cycles, weekly industriai production cycles, and other known or suspected production cycles, particularly those associated with intermittent batch discharges by significant industries. Longer-term production cycles, including seasonal and annual/multi-year production cycles (e.g., business cycles!, do not need to be considered in determining monitoring frequency unless they are known to affect short-term variation in sludge quality.
0 Risk of environmental exposures - As the risk of environmental exposure from sludge use/disposal increases, a PO'IW should increase its sampling frequency to provide better information about potential variation in sludge quality. For example, a sludge that is applied to food-chain croplands should be sampled more frequently than sludge that is disposed of in a landfill that has an impermeable liner and a groundwater monitoring system.
Other factors that should be considered in determining sampling frequency include:
0 Size - As influent flow increases, day-to-day sludge variability increases, as does outflow volume. Thus, where high volumes exist, the risk of adverse exposure is higher. Since variability and potential impact are major considerations, many sampling programs are based on size alone (e.g. 40 CFR Part 503 proposed rule). Size is also an easy factor to measure.
0 Percentage of industrial flow - hXile sludge quality variability is directly related to the individual characteristics of each POTW, POTws ;lith little or no commercial/industrial contributors in the system can expect relatively small variation in sludge qua1lt.y. POTWs with significant industri al contributions can expect to have monthly, weekly and even daily -variation in sludge quality.
0 Treatment plant characteristics - As either detention time or mixing increases within a treatment plant, sampling frequency can be reduced since treatment processes will effectively composite sludge to a greater degree. For example, high rate digestion and storage/blending facilities will provide mechanical mixing of sludge. Other plant technologie such as anaerobic digestion, aerobic digestion and Storage,
2-18

provide longer sludge detenti.on times, enabling greater mixing through physical processes such as diffusion, convection, etc. For combined sewer systems, a sampling strategy may be designed to monitor the effects of storm events on sludge quality.
Another consideration is the type(s) of information a POTW wishes to collect. If, for example, a POTW desires to measure daily variation over a typical week, the POTW may collect and
analyze seven or more 24-hour composite samples for the
pollutant. Similarly, if a POTW wishes to measure variation
within a single day, the POTW may collect and analyze several
grab samples taken at different times curing the day.
2.5 SAMPLE ?REPARATION AND PRESERVATION
There is the potential for errors of varying severity to be introduced during Sample collection and storage which affect analytical determinations. To avoid potential errors and
maintain sample integrity, POTW operators should carefully
consider the following:
0 Sample Container Yaterial 0 Sample Container Preparation
0 Sample ?reservation
0 Holding Time Prior to .Analysis.
Table 2.3 lists recommended container materials, preservatives, holding times, and minimum sample volumes for the
analysis of sludges. For method-specific details concerning all
facets of sample preparation and preservation, consult the references cited in 40 CFR Part 136, "Guidelines for Establishing
Test Procedures for the Analysis of Pollutants."
2-19
2.5.1 Sample Container Material
The requirements for sample containers are method-specific, but containers are usually made of Teflon, glass or polyethylene. Sample containers should be wide-mouthed for sludge sampling, particularly for solids Icake) sampling. Teflon containers are typically supplied with Teflon caps. Glass containers frequently are supplied with caps which can cause sample contamination (phenol, phthalate compounds). For organic parameters, these glass container caps should be fitted with Teflon liners; aluminum liners could be used but they must be fitted precisely within the circumference of the cap to prevent tearing and possible sample leakage.
2.5.2 Sample Container Preparation
Proper sample container preparation is necessary to prevent contamination of the sample by material left from the container manufacturing process or that has otherwise been introduced into the unused sample containers. All containers should be uashed with a good qua lity laboratory detergent, thoroughly rinsed -;ith tap wat 0~ ---, and then rinsed at least 3 times with distilled ';ater prior to air drying. Additional container preparations for analysis of particular parameters are described below:
0 Extractable Organics - I;se glass containers with Teflcn-lined caps only. Wash containers as above an3 rinse with solvent (typically nethylene chloride) ; air- dry.
0 Volatile Organics - Prepare containers by washing and rinsing as described above, and then bake both vials and septums at 105'C until dry. Cool in an organic-free atmosphere.
0 Metals - Wash and rinse as described above. Then rinse *dith dilute acid cl part deionized, distilled *dater to 1 part nitric acid !HNGJ j, followed by t;lo rinses ~5th deionized, distilled water.
Z-20
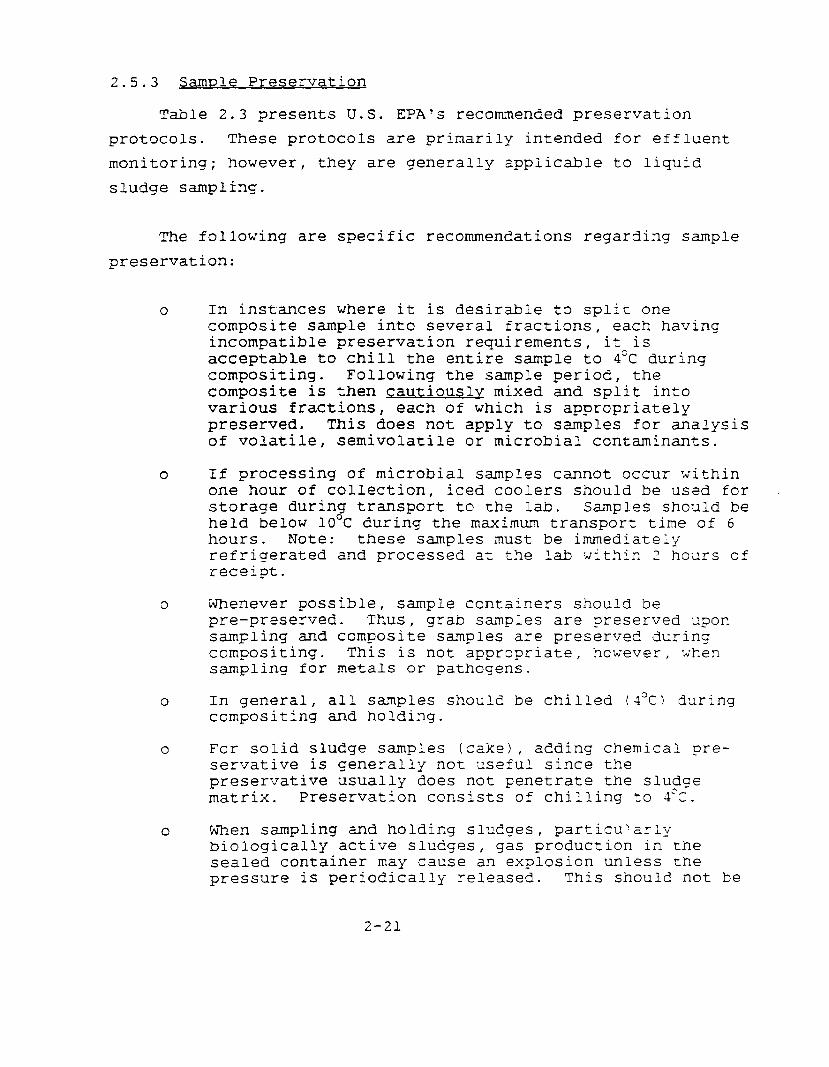
2.5.3 Sample Preservation
Table 2.3 presents U.S. EPA?s recommended preservation
protocols. These protocols are primarily intended for effluent monitoring; however, they are generally appiicable to liquid
sludge sampling.
The following are specific recommendations regarding sample
preservation:
0 In instances where it is desirable to split one composite sample into several fractions, each having incompatible preservation requirements, it is acceptable to chill the entire sample to 4°C during compositing. Following the sample period, the composite is then cautiouslv mixed and split into various fractions, each of which is appropriately preserved. This does not apply to samples for analysis of volatile, semivolatile or microbial contaminants.
0 If processing of microbial samples cannot occur within one hour of collection, iced coolers should be used for storage during transport to the lab. Samples should be held below 10°C during the maximum transport time of 6 hours. Note: these samples must be immediately refrigerated and processed at the lab sjlthin 2 hours cf receipt.
3 Xhenever possible, sample containers should be pre-preserved. Thus, grab samples are preserved upon sampling and ccmposite samples are preserved during compositing. This is not appropriate, however, Then sampling for metals or pathogens.
0 In general, all samples should be chilled (4°C) during cornpositing and holding.
0 For solid sludge samples (cake), adding chemical pre- servative is generally not *useful since the preservative usually does not penetrate the slu_dge matrix. Preservation consists of chilling to ?'C.
0 When sampling and holding sludges, particu'arlk- biologically active sludges, gas production in the sealed container may Cause an explosion unless the pressure is periodically released. This should not be
2-21

2.5.4
done however if volatile or semivolatile pollutants are to be analyzed.
Holdinq Time Prior to AnalVSiS
Table 2.3 lists the maximum holding times for various pollutant samples. Table 2.4 lists some potential interferences
that may affect samples during shipping and storage. There are
many more interferences associated with particular analytical
methods, which are discussed further in chapter 3 as well as in the particular methodology.
2.6 PACXAGING AND SHIPPING
When analysis will be performed away from the sampling locale, samples must be packaged and transported.
2.6.1 Packaqinq
Sample containers must be packaged in order to protect them and to reduce the risk of leakage. Containers should be held upright and cushioned from shock. In addition, sufficient insulation and/or artificial refrigerant ("blue ice") shculd be provided to maintain a sample temperature of 4'C for the duration, of transportation.
2.6.2 TransDortation ReUUlatiOnS
The following guidelines control the shipment of xastewater and sludge samples: . .
0 Unpreserved normal (i.e., not heavily contaminated) environmental samples are not regulated under DCT Hazardous Material Regulations. These samples may be shipped following the packaging guidelines in Section 2.6.1, and using a commercial carrier, etc. To ass-;lre proper sample temperature, transit time should be held to less than 24 hours.
2-22
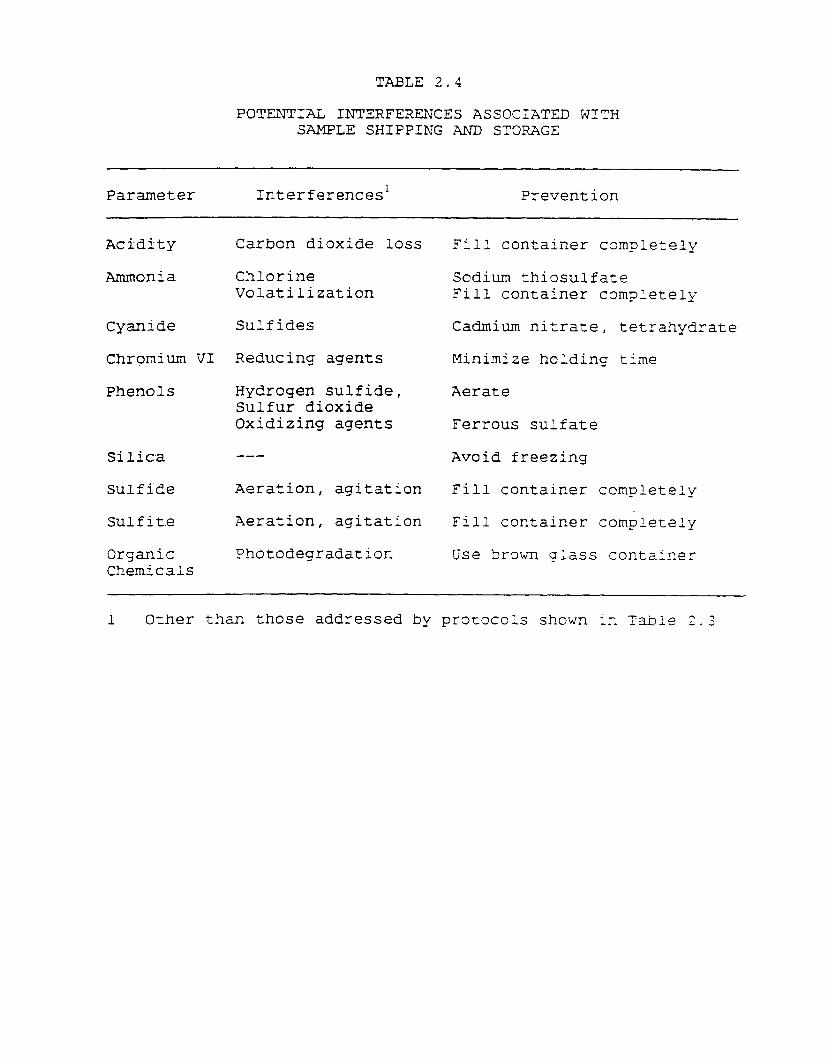
TABLE 2.4
POTENTIAL INTZRFERENCES ASSOCIATED WITH SAMPLE SHIPPING AND STO-RAGE
Parameter Interferences' Prevention
Acidity Carbon dioxide loss
Ammonia Chlorine Volatilization
Cyanide
Chromium VI
Phenols
Silica
Sulfide
Sulfite
Organic Chemicals
Sulfides
Reducing agents
Hydrogen sulfide, Sulfur dioxide Oxidizing agents
Aeration, agitation
Aeration, agitation
Photodegradation
Fill container completely
Sodium thiosulfate Fill container completely
Cadmium nitrate, tetrahydrate
Minimize holding time
Aerate
Ferrous sulfate
Avoid freezing
Fill container completely
Fill container completely
Use Srown glass container
1 Other than those addressed by protocols shown in Table 2.3
0 When environmental samples are preserved as recommended (see Table 2.51, they may be shipped as non-hazardous samples.
The guidelines above assume no material is present in the
samples at concert,, +T-ations ;Ihich would result in a flhazardousfl DOT
rating. Should hazardous material (as defined by DOT) be
present, DOT regulations concerning packaging, transportation and labeling must be followed Isee 49 CFR parts 172, 173 and 178). A material is considered hazardous hy DOT if it fails one of the four characteristic tests of: corrosivity, ignitability,
reactivity and EP Toxicity [see "Test Xethods for Evaluating
Solid Waste, SW 846, 1986 for exact methods]. Municipal sewage
sludges labeled as hazardous are usually from failed EP Toxicity tests and occasionally from reactivity tests.
2.7 DOCUMEXTATION
Adequate documentat ion of sludge sampling activities (1) is
important for general program qualit y assurance/quality control,
and (2) is req-ulred by most monitoring regulations. Proper
sampling activity documentation includes proper sample labeling,
chain-of- custody procedures and a log book of sampling activities. The number of people in the chain of cu.st,ody shculd
be kept to a minimum to limit the possibility of contamination and to increase accountability.
7 L. 7.1 Sample Labelinq
It .-is important that each sample label include the following information iitems In bold text are minimum elements!:
0 Sampling Organizaticn Xame 0 Facility Name (being sampled) 0 Bottle Number (specific to container
2-24
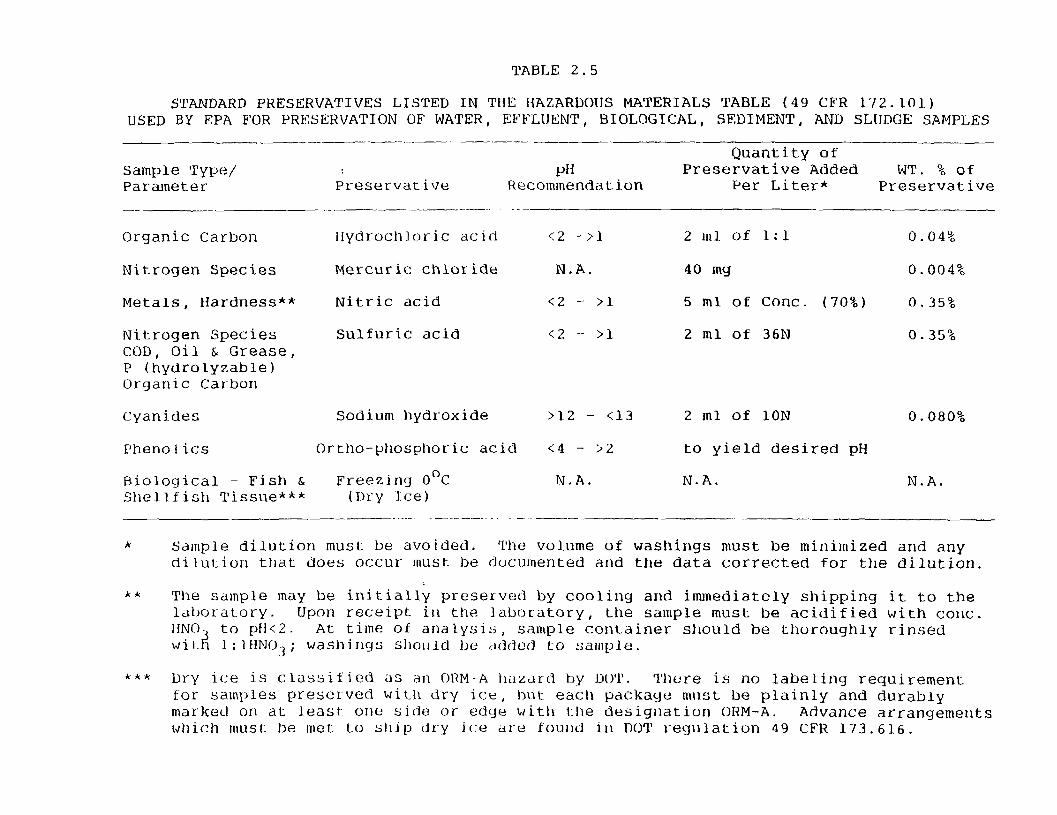
TABLE 2.5
STANDARD PRESERVATIVES LISTED IN THE HAZARDOIJS MATERIALS TABLE (49 CFR 172.101) USED BY EPA FOR PRESERVATION OF WATER, EFFLUENT, BIOLOGICAL, SEDIMENT, AND SLIJDGE SAMPLES
_.____ -___ -- . . -. -.---
Sample Type/ Parameter Preservative -- _____I- ----_--.
Organic Carbon fiydrochloric acid
Nitrogen Species Mercuric chloride
Metals, lfardness** Nitric acid
Nitrogen Species Sulfuric acid COD, Oil & Grease, P (hydrolyzable) Organic Carbon
Quantity of Pf-I Preservative Added WT. % of
Recommendation Per Liter* Preservative
c2 ->l 2 ml of 1:l 0.04%
N.A. 40 mg 0.004%
<2 - >1 5 ml of Cont. (70%) 0.35%
(2 - >l 2 ml of 36N 0.35%
Cyanides sodium hydroxide >12 - (13 2 ml of 10N 0.080%
Phenolias Ortho-phosphoric acid <4 - >2 to yield desired pH
Biological - Fish & Freezing O*C N.A. N.A. N.A. SlJellfish Tissue*** (Dry Ice)
~_~ -. .-___-_._. - ___ ___
*
kk
kkk
Sample dilution must be avoided. The volume of washings must be minimized and any dilution that does occur must be documented and the data corrected for the dilution.
The sample may be initially preserved by cooling and immediately shipping it to the laboratory. Upon receipt itr the laboratory, the sample must be acidified with cont. ffNO- wit d
to pH<Z. At time of analysis, sample container should be thoroughly rinsed 1 : lfJNC13 ; washings shOllld be iJddt?tl to SdlIl~-‘~~.
Dry ice is classified ;Is s3Jl ORM-A Jlazard by DOT. There is no labeling requirement for samples preserved with dry ice, but each package moist be plainly and durably marked on at least one side or edge with the desigrlation ORM-A. Advance arrangements which must be met: to sllip tlr-y ice ;II-~ fou~~tl in DOT regulation 49 CFR 173.616.
Sample Number (specific to sampling event i.e. location) Type of sample, i.e., grab, 24 hour composite, etc. Date, Time (24 hour time is preferable, i.e., 1600 vs.
4:00 p.m.1 Sample Location Preservatives Analytical Parameter(s) Collector Special Conditions or Remarks.
Labels and ink should be waterproof. Fix labels to ccn- tainers with clear waterproof tape. Tape completely around container and over label to prevent accidental label loss or ink smear during shipping and handling.
2.7.2 Chain-of-Custody
Each sample shipment requires a chain-of-custody record. A chain-of-custody document provides a record of sample transfer from person to person. This document helps protect the integrity of the sample by ensuring that only authorized persons have custody of the sample. In addition, the chain-of-custody procedure ensilres an enforceable record of sample transfer ~b.=ict= is necessary if the sample results are to be used in a judicial proceeding alleging violations of sludge standards. Tl-liS
document shall record each sample's collection and 3and1inc history from time of collection until analysis as Yell as t:ie information listed on each sample bottle. All personnel 3&ndlinc the sample shall sign, date and note the time of day on the . chain-of-custody document. A sample chain-of-c?Jstody dot.nent Is provided in Appendix A.
2-26
2.7.3 Samnlins Log Book
All sampling activities should also be documented in a bound log book. This book duplicates all information recommended for the chain-of-custody document above, and notes all relevant observations regarding sample stream conditions.
2.8 SAFETY CONSIDERATIONS
Safety is important in sludge sampling, especially since many sampling points preclude direct collection of grab samples, Several safety considerations are noteworthy given the potential health-related effects of sewage and sludge, and the hazards associated with treatment plant equipment (water, electricity, moving components, etc.).
Personal hygiene is important for all personnel involved in sludge sampling efforts. Sludge presents a unique health hazard, not only because of the potential presence of toxic substances, but also because of the abundance of pathogens (bacteria, viruses and worms). As a precautionary measure, inoculations are
recommended for all personnel who have direct contact with sludge (as well as any wastewater) samples. As a ,minimu.m, inoculation should include diseases such as typhoid and tetanus. Avcidance of direct sl.Jdge contact is preferred and is possible if proper precautions are taken. Wear rubber or latex gloves at all times, especially while collecting or handling samples, and use waterproof garments when the risk of splashing exists. Kash any
cuts or scrapes thoroughly and treat immediately.
Gas production from biclogically active sludge samples may cause pressure build UP, especially if the samples are not stored at 4'c as recommended in Table 2.3. Treating samples with the appropriate preservatives (e.g., acids for metals samples) as
2-27

well as refrigeration will significantly suppress biological activity and therefore gas evolution. However, except for volatile and semi-volatile analysis samples, pressure may need to be periodically released to prevent explosions of the sealed sampling containers. The field control sample should also be vented to expose it to the same potential contaminants.
There are several universal safety precautions that are
applicable to sludge sampling as well. 'When sampling sludge in confined areas, particularly around anaerobic digesters, dangerous gases may be present. These gases may include either explosive vapors (methane), poisonous mixtures (including hydrogen sulfide), or oxygen-deprived atmospheres (carbon dioxide). Explosive vapors require care to avoid sparks and possible ignition. These situations necessitate adequately ventilated equipment, gas detection meters and backup breathing apparatus. Exercise care around open pits or uncovered holes. Proper lighting increases the visibility of such hazards. Loose or dangling garments (ties, scarves, etc.) should not be worn around equipment with moving parts, especially pumps. Zxercise extra awareness around pumps contrclled by intermittent timers. Finally, be very careful when sampling high pressure sludge lines or lines containing high temperature, thermally-ccnditioned sludges (i.e., Zimpro or Porteus) in order to avoid injury by either high pressure streams or burns.
z-28
3. ANALYTICAL PROCEDURES
Sewage sludge is compositionally diverse, rich in organic
matter; and highly variable in physical and chemical properties.
Sewage sludge analysis is difficult because of the inherent
complexity of sludge matrices. Matrix complexity often results
in significant analytical interference which can lead to poor
analytical accuracy and precision with a resultant loss of data
reliability. For example, matrix interference, which is
exacerbated in sludges, can both mask the identity of analytes by
suppressing instrumental response, or falsely contribute to a
positive response.
Variations in the physical and chemical properties of sewage
sludge often make it difficult to obtain samples which represent
the material as a whole. The diversity of sludge
characteristics, coupled with the heterogeneous nature of
sludges, presents a considerable challenge to precise and
accurate determinations of trace levels of pollutants in sludges.
Often sludge samples must be diluted to attain analytical
results. A tenfold sample dilution means a tenfold increase in
the detection limit (e.g., 1 ppm to 10 ppm). This increases the
complexity of attaining accurate, precise data.
The following sections provide a summary of the analytical
techniques available for characterization of the sewage sludge
and soil constituents considered important in the selection of
use or disposal options. Analytical techniques for conventional
pollutants, inorganics, priority pollutant metals, priority
pollutant organics, and pathogenic organisms are discussed.
3-1
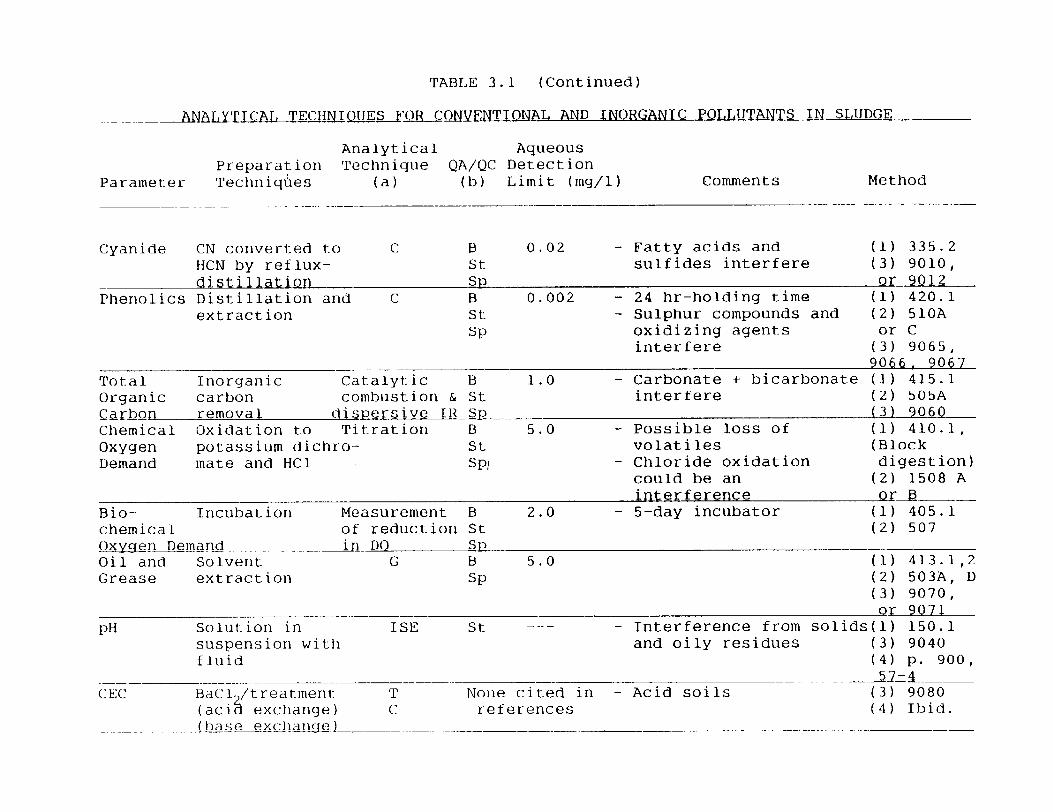
3.1 CONVENTIONAL AND INORGANIC POLLUTANT PARAMETERS
Conventional pollutant parameters have historically been the
focal point of sewage sludge analyses. The parameters normally
associated with this group include total suspended solids, pH,
oil and grease, BOD and fecal coliform. Inorganics, which have
also been of concern, include phosphorus species, nitrogen
species, phenolics, and total cyanide. As Table 3.1 indicates,
the analytical protocols commonly employed for these analyses are
adaptations of gravimetric or calorimetric techniques developed
for aqueous samples.
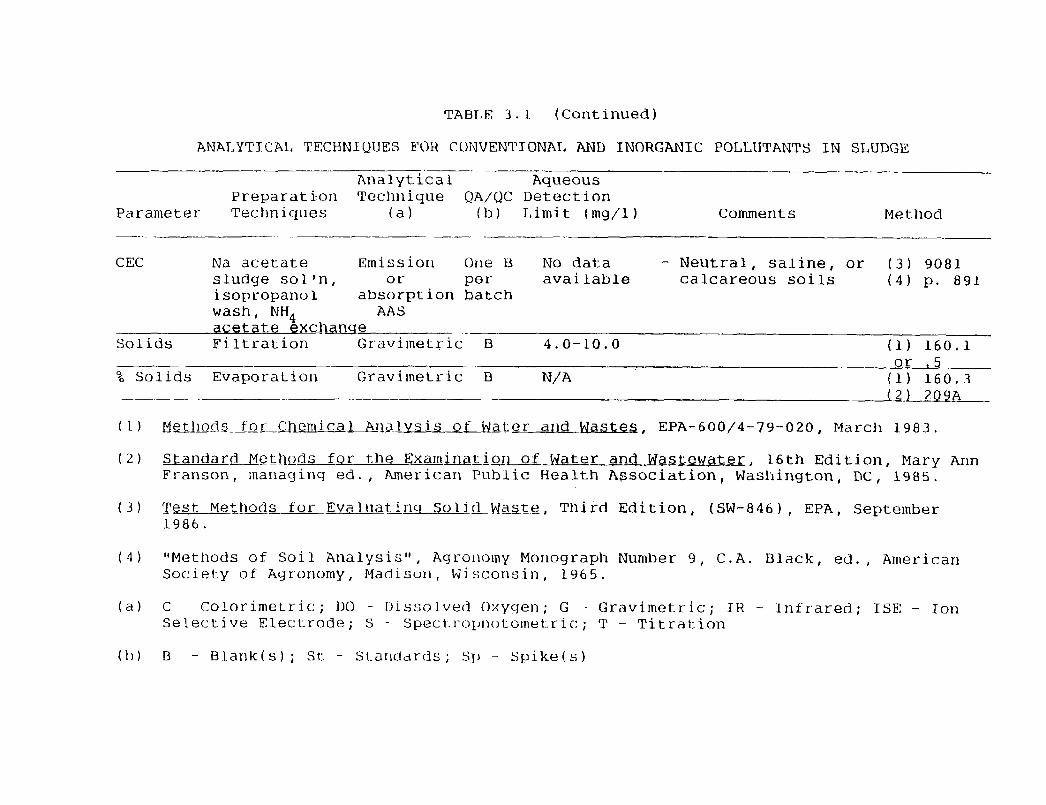
Existing federal regulations (40 CFR Part 257) require POTWs
that apply sludge to food-chain croplands to measure the pH of
the sludge-soil mixture and background soil cation exchange
capacity (CEC). Soil pH should be measured using a 1:1 solution
of sludge-soil mixture and deionized sister (see Table 3.1). For
distinctly acid soils, CEC should be measured using the summation
method (see Table 3.1). For neutral, saline, or calcareous
soils, the sodium acetate method should be used (see Table 3.1;.
Another inorganic of more recent concern is asbestos.
Asbestos is a generic term which refers to naturally occurring,
commercially useful fibrous silicate mineral. There are two
types. Chrysotile, which comprises 93 percent of the current
asbestos production, is a hydrated magnesium silicate which
exhibits a much higher cancer risk for textile workers.
Amphibole, which occurs in five forms, crocidolite, amosite,
actinolite, tremolite and anthrophyllite, is a hydrated silica
associated with various lung carcinogenic trace metals (nickel,
chromium, aluminum and iron). Crocidolite poses the greatest
health risk of all asbestos types and is the riskiest to miners
and millers.
3-2
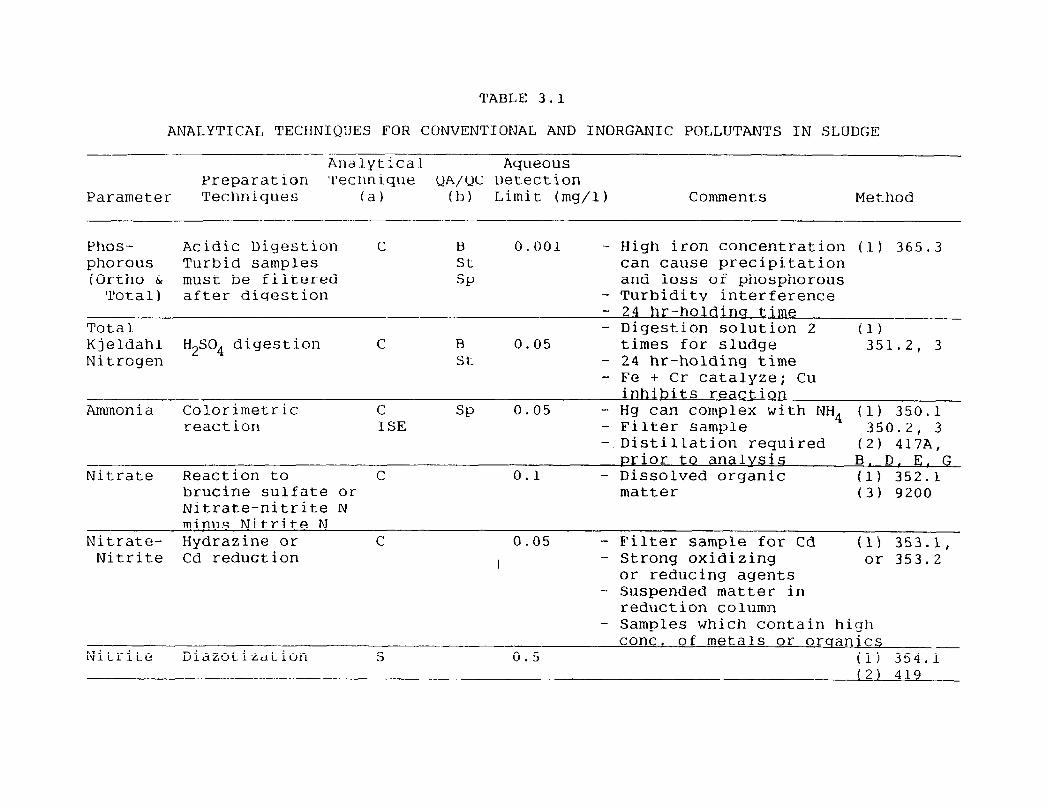
TABLE 3.1
ANALYTICAL TECHNIQlJES FOR CONVENTIONAL AND INORGANIC POLLUTANTS IN SLUDGE I_ -
Analytical Aqueous Preparation Technique QA/QC Detection
Parameter Techniques (a) ( b ) Limit (mg/l) Comments Method
Phos- Acidic Digestion C B 0.001 - High iron concentration (1) 365.3 phorous Turbid samples St can cause precipitation (Ortho & must be filtered SP and loss of phosphorous
Total 1 after digestion - Turbidity interference - 24 hr-hol~mq time
Total - Digestion solution 2 (1) Kjeldahl Nitrogen
H2S04 digestion C B 0.05 times for sludge 351.2, 3 St. - 24 hr-holding time
- Fe t Cr catalyze; Cu inhibits reaction
Ammonia Calorimetric C SP 0.05 reaction ISE
- Hg can complex with NH4 (1) 350.1 - Filter sample 350.2, 3 -.Distillation required (2) 417A,
Prior to analvsis B. D. E. G Nitrate Reaction to C 0.1 - Dissolved organic (11 352.1
brucine sulfate or matter (3) 9200 Nitrate-nitrite N
Nitrate- Hydrazine or C 0.05 - Filter sample for Cd (1) 353.1, Nitrite Cd reduction I - Strong oxidizing or 353.2
or reducing agents - Suspended matter in
reduction column - Samples which contain high
cont. of metals or orqanics Nitrite Diazotization S 0.5 (1) 354.1
121 419
'J'ARLE 3 . 1 (Continued)
Analytical Aqueous Preparation Technique QA/QC Detection
Parameter Techniques (a) lb) Limit (my/l 1 Comments Method _- --__--_ ____ -.--- --.- -_ ..--- ,... -.--
Cyanide CN converted to c B 0.02 - Fatty acids and (1) 335.2 HCN by reflux- St. sulfides interfere (3) 9010, dist.illation SP OK 90-2
Phenolics Distillation and C B 0.002 - 24 hr-holding time (1) 42i.l extraction St - Sulphur compounds and (2) 5lOA
SP oxidizing agents or C interfere (3) 9065,
9066. 9Q67 Tot-al Inorganic Catalytic B 1.0 - Carbonate + bicarbonate (I) 415.1 Organic carbon combustion & St- interfere (2) 505A Carbon removal di ~pers ive IRS12 _..._,_, (3) 9060 Chemical Oxidation t-o Tit-rat ion B 5.0 - Possible loss of (1) 410.1, Oxygen potassium dichro- St volatiles (Block Demand mate and HC 1 SPI - Chloride oxidation digestion)
could be an (2) 1508 A interference or-E
Bio- Incubation Measurement B 2.0 - 5-day incubator (1) 4K-l- chemical of reduction St (2) 507 Oxvsen2mand . --.--.A~- DO Sp Oil and Solver1t G B 5.0 (1) 413.1,2 Grease extraction SP (2) 503A, D
(3) 9070, or 9071
pH Solution in ISE St -__- - Interference from solids(l) 150.1 suspension with and oily residues (3) 9040 fluid (4) p. 900,
--- --- ---- -- -_-uzrf. CEC RaCl. /treat.ment:
4 T None cited in - Acid soils (3) 9080
(aci exctianye) C references (4) Ibid. .f hrlseexc!ldmt'l-~ _..._. __________.__-
TA6T.E 3.1 (Continued)
ANALYTICAL TECHNIQUES FOR CONVENTIONAL AND INORGANIC POLLUTANTS IN SLUDGE .~. .__~._.
Analytical Aqueous Preparation Technique QA/QC Detection
Parameter Techniques (a) (b) r,imi t (mg/l ) Comments Method --.-. ~. ---. .~
CEC Na acetate Emission Otle B No data - Neutral, saline, or (3) 9081 sludge sol'n, Ok per available calcareous soils (4) p. 891 isopropanol absorption batch wash, NH4 AAS acetate @xc-e
Solids Filtration Gravimetric B 4.0-10.0 (1) 160.1 -- 5
% Solids Evaporation Gravimetric B N/A 1;; i60.3 - --.lu-d~
(1)
(2)
(3)
(41
(a)
( 1:1 1
Metltodg for memica Arlalvsis of Water and Wastes, EPA-600/4-79-020, March 1983.
Standard Metl1od.s for the Exarrlirlio!) of Water and WasLew+ter, 16th Edition, Mary Ann Franson, managing ed. , American Public Health AFsociation, Washington, DC, 1985.
Test Mews for Evalllat,-incl Soli&Wst.e_, Third Edition, (SW-8463, EPA, September 1986.
@'Methods of Soil Analysis", Agrollotny Monograph Number 9, C.A. Black, ed. , American Society of Agronomy, Madison, Wisconsin, 1965.
C Calorimetric; DO - Dissolved Oxygen; G Gravimetric; IH - Infrared; ISE; - Ion Selective Electrode; S -. Speci_1-(.)I)l~o~olnel..ric: ; T - Titrat:ion
B - Blank(s); St. - St.anclards; S1' - Spike(s)
In certain cases, such as when large scale asbestos removal is/will occur during the permit term or in municipalities ;Ihere asbestos industries are located, the permit xriter or the permittee may feel that sampling the sewage sludge for asbestos is warranted. Consult Table 2.4 for the appropriate sample
sizes, containers, preservatives and holding times. Unless sample preparation will be within 43 hours, the sample should be refrigerated or stored in the dark to prevent bacterial growth.
Although there are tests which differentiate between the various asbestos types, current research does not associate
health risk with specific types. The risk from asbestos is directly proportional to the concentration of airborne respirable particles. Thus current recommended analytical detection methods count fibers per area. Respirable particles are those with a diameter (length in this case) of less than 2 microns, which can only be detected using transmission electron microsropy (TS?!!!. The polarized light microscopy (PLM? method does not detect respirable particles.
3.2 METALS
There are several analytical techniques used for the determination of metals in sewage sludge, ulth variations in both the sample preparation and analysis steps. A discussion of these techniques follows.
3.2.1 Analvte Isolation/Preparation Overvie?;
Two approaches are currently used to evaluate the concentrations of metai contaminants in sludges. The most frequently used approach involves determination of the total metal content or other materials of interest, without retard to
izns chemical form. The analyt ical techn iques for such determinat
3-6
are designed to solubilize all of the metal species (bound to organic particulates and mineralogicaily bound). In the other approach, often referred to as the "leachate approach," the proportion of the total contaminant loading which will become available or mobilized under environmental conditions is determined. Thus, leachate techniques are designed to mimic a given environmental scenario. With either approach, the complexity and variability of sludge matrices has made the development of Sample preparation techniques a great analytical
challenge.
The t;Jo primary steps for sample preparation of metals in sewage sludge are (1) dissolution of the sample portion containing the metal components of interest, and (2) elimination of inorganic and organic interferences. The preparation procedure must be capable of effectively liberating the analytes from. the solid constituents, solubilizing the elemental .sTecles, homogenizing the sample phase(s) of interest, as well as completely oxidizing the associated organlcs. Sludge matrices are challenging in this regard because of the high or.ganlc Ievois and solids leadings characteristics.
All state-of-the-art sample preparation procedures for total metal determinations depend on ac id-mediated diges-,ions and #chemical or physical oxidation techniques. The approach involves the use of strong acid and elevated temperature digestion procedures in combination with chemical or physical oxidants. The modifications which have been used include variations in
acids, oxidation reagents, physical oxidation techniques, reaction conditions, and/or the sequence in which components are
employed. Acids used most frequently include nitric acid (HNO,), hydrofluoric acid (HF), hydrochloric acid (HCL), and perchloric acid (HCLC,! ; while hydrogen peroxide and perchloric acid are
3-7
common oxidizing reagents. High temperature (SSO'OC) combustion and low temperature plasma ashing (LTPA) have been used success- fully as physical oxidants. Closed system digestion procedures are also used successfully.
Two closely related techniques to estimate the amount of inorganic and organic contaminants which may be leached from the
sludge after disposal in landfills or surface impoundments are
the Extraction Procedure protocol and the Toxicity Characteristic Leachate Procedure. In both procedures the sludge is maintained in an aqueous siurry under a given set of conditions, after which contaminant levels are measured on the filtered aqueous media. The Extraction Procedure (EP) test developed by EPA (in response to RCRA legislation) to evaluate the impact of landfill waste disposal practices on subsurface and surface waters (40 CFR Part 261 Appendix II) evaluates criteria fo-r 8 metals and 6 pesticides. The proposed Toxicity Characteristic Leaching Procedure (TCLP) 51 Federal Reaister 21648 Is expected to be promulgated in August/September of 1989. The TCLP test which evaluates the same 8 metals and 6 pesticides and an additional 38 compounds -dill replace the Z? Zest after promulgation.
3.2.2 Analvtiral Technioues for Metals
3.2.2.1 Sample Preparation/Digestion
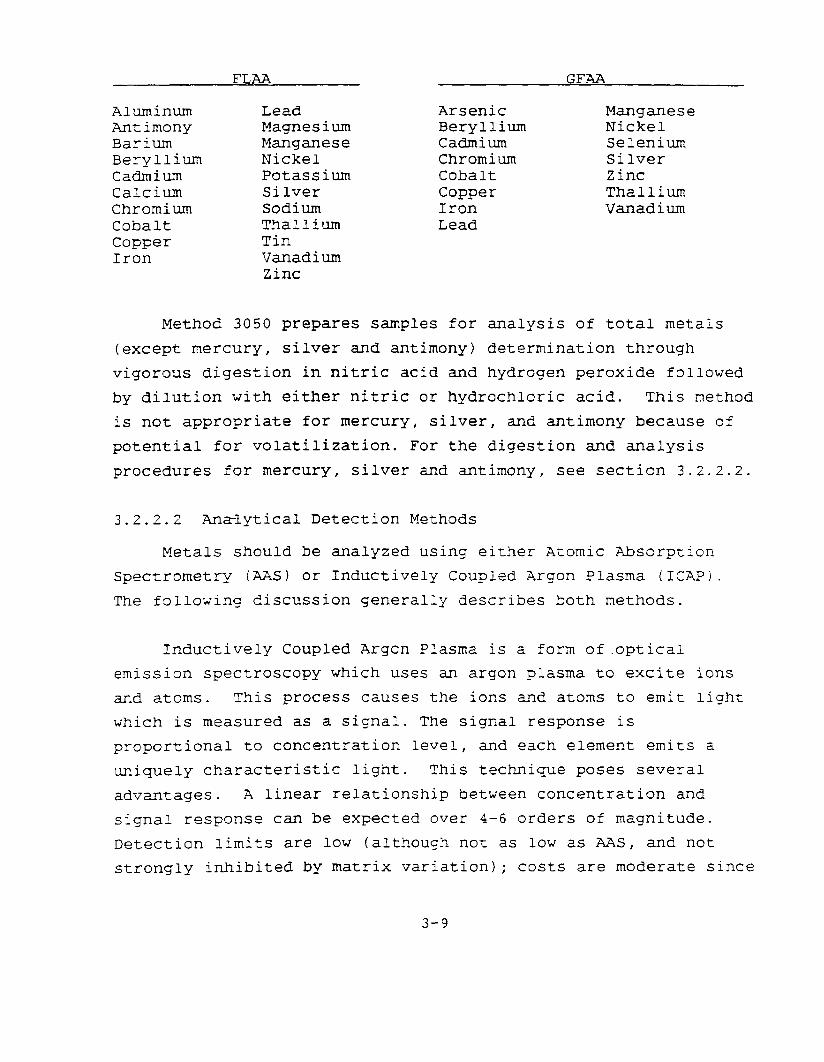
Table 3.2 shows the sample preparation/digestion :echnlqe recommended by the USEPA. Method 3050 (SW-846, 3rd ed.) is an acid digestion procedure used to prepare sediments, sludges, and soil samples for analysis by flame or furnace atomic absorption spectroscopy (FLAA and GF?&, respectively) or by inductively coupled argon plasma spectroscopy (ICAP). Sampies prepared by this method may be analyzed by ICAP for all the metlis listed below, or by FLAA or GFAA as indicated:
3-8
FLAA GF.AA
Aluminum mtimony Barium Beryllium Cadmium Calcium Chromium Cobalt Copper Iron
Lead Magnesium Manganese Nickel Potassium Silver Sodium Thallium Tin Vanadium Zinc
Arsenic Beryllium Cadmium Chromium Cobalt Copper Iron Lead
Manganese Nickel Selenium Silver Zinc Thallium Vanadium
Method 3050 prepares samples for analysis of total metals
(except mercury, silver and antimony1 determination through vigorous digestion in nitric acid and hydrogen peroxide followed by dilution with either nitric or hydrochloric acid. This method
is not appropriate for mercury, silver, and antimony because of
potential for volatilization. For the digestion and analysis
procedures for mercury, silver and antimony, see section 3.2.2.2.
3.2.2.2 Analytical Detection Methods
Metals should be analyzed using either Atomic Absorption Spectrometry (AAS) or Inductively Coupled Argon Plasma (ICAP). The following discussion generally describes both methods.
Inductively Coupled Argcn Plasma is a form of.optical emission spectroscopy which uses an argon plasma to excite ions and atoms. This process causes the ions and atoms to emit light which is measured as a signal. The signal response is proportional to concentration level, and each element emits a uniquely characteristic light. This technique poses several
advantages. A linear relationship between concentration and
signal response can be expected over 4-6 orders of magnitude. Detection limits are low (although not as low as AAS, and not strongly inhibited by matrix variation); costs are moderate since
3-9
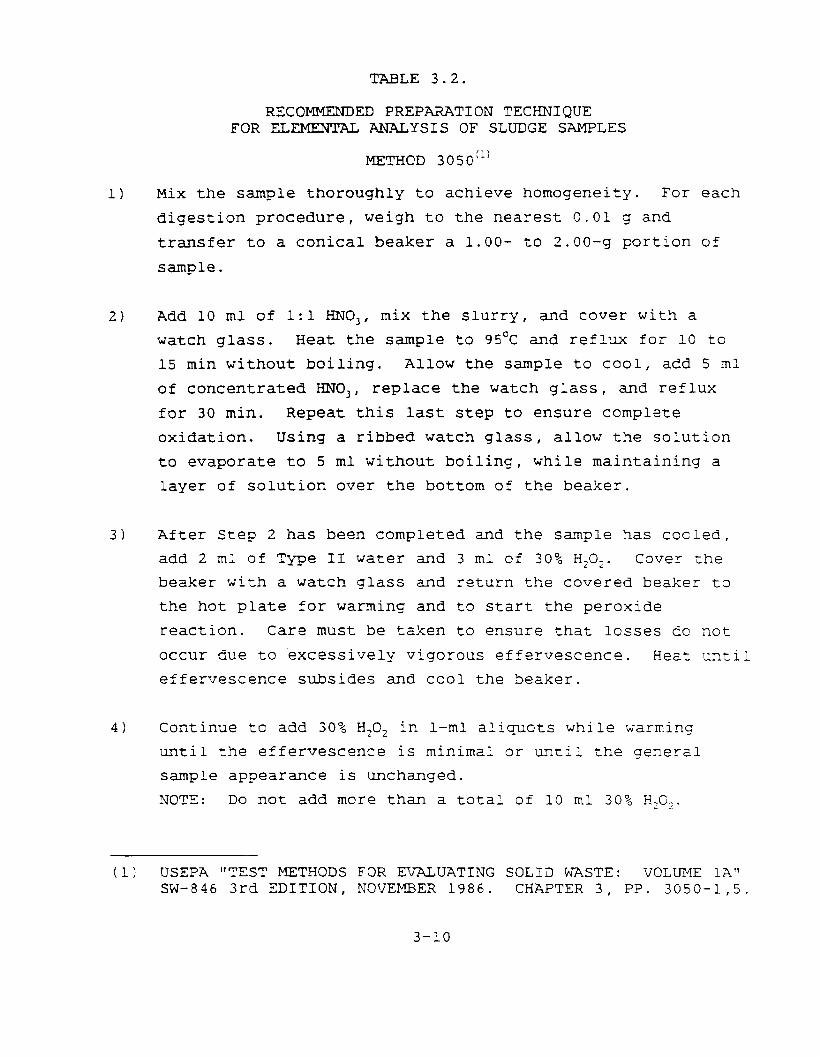
TABLE 3.2.
RECOMMENDED PREPARATION TECHNIQUE FOR ELEMENTAL ANALYSIS OF SLUDGE SAMPLES
METHOD 3050"'
1) Mix the sample thoroughly to achieve homogeneity. For each
digestion procedure, weigh to the nearest 0.01 g and
transfer to a conical beaker a l.OO- to 2.00-g portion of sample.
2) Add 10 ml of 1:l HNO,, mix the slurry, and cover with a watch glass. Heat the sample to 95*C and reflruc for 10 to 15 min without boiling. Allow the sample to cool, add 5 ml
of concentrated HNO,, replace the watch glass, and reflux
for 30 min. Repeat this last step to ensure complete oxidation. Using a ribbed watch glass, allow the solution
to evaporate to 5 ml without boiling, while maintaining a layer of solution over the bottom of the beaker.
3) After Step 2 has been completed and the sample has cocled, add 2 ml of Type II water and 3 ml of 30% H,Qi. Cover the beaker with a watch glass and return the covered beaker to the hot plate for warming and to start the peroxide reaction. Care must be taken to ensure that losses do not occur due to excessively vigorous effervescence. Heat until effervescence subsides and cool the beaker.
4) Continue to add 30% H,O, in l-ml aliquots while warming until the effervescence is minimal or until the general sample appearance is unchanged. NOTE : Do not add more than a total of 10 ml 30% HiCz.
(1) USEPA "TEST METHODS FOR EVALUATING SOLID WASTE: VOLUME 1A" SW-846 3rd EDITION, NOVEMBER 1986. CHAPTER 3, PP. 3050-1,5.
3-10

many elements may be determined at once; and anaiysis time is fairly rapid. The primary drawbacks are: matrix interferences (as with all analyses); the fact that soiid samples cannot be analyzed directly as in AAS; and the high cost of purchasing ICAP instruments (more than $100,000).
The basic principle behind atomic absorption spectroscopy is
the opposite of the emission method, ICAP. In AAS, the analyze (metal) is dissociated into atoms in a flame or furnace, and passed through a light beam from the reference source. This reference source emits a beam of the characteristic atomic spectrum of the analyte. The analyte in the sample ~-ill absorb this energy thus decreasing the original signal to the detector from the reference beam. Since absorption is directly proportional to concentration, the analyte concentration can be determined. Selection of a specific wavelength which corresponds to one of the more intense characteristic line of the analyte's spectra allok;s for high eiement specificity. For this reason, AAS is more responsive than IGAP to lower concentrations of metals in sludge. However, this very precise nature of .VLS Is also the cause of its major drawback: cnly cne elemental determination per sample is possible at a time. Thus, cAhe total analysis time of AAS is significantly greater than that of ICA? when many metals are present in the sample.
Fn sewage sludge applications, it is important to reailzo
that both of these analytical techniques are reliable tools and neither offers a significant technical advantage over the other. However, ICAP's capability to simultaneously analyze multiple elements is a tremendous advantage in terns of sample throughput and labor savings, which may outweigh the noted limitations.- For sludge applications, EPA recommends either method and leaves the
3-11
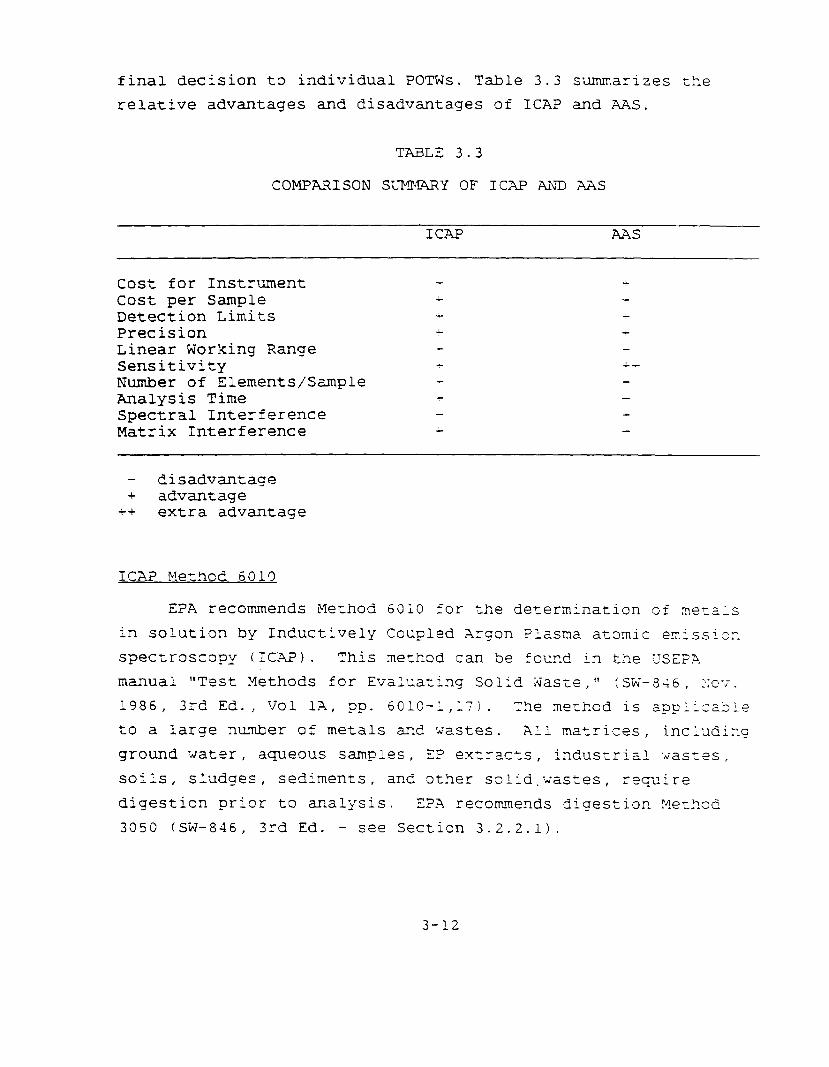
final decision to individual POTWs. Table 3.3 s;lmmarizes the relative advantages and disadvantages of ICAP and .AAS.
TABLE 3.3
COMPARISON S~X?G'RY OF ICAP ?JJQ AAS
ICAP AA.5
Cost for Instrument Cost per Sample Detection Limits Precision Linear Working Range Sensitivity Number of Elements/Sample Analysis Time Spectral Interference Matrix Interference
+ L
i f +
t Lb
c L
- disadvantage + advantage
++ extra advantage
EPA recommends Nethod 60i0 for the deternination of net,a-ls in solution by Inductively Ccupled Argon Plasma atomic emissisr. spectroscopy (ICAP). This method can be found in the CTSEP?, manual "Test Methods for Evaluating Solid Na.sc,e," (S'W-246 , >;c-r. 1986, 3rd Ed., Vol lA, 9~. 601O-1,171. 2.e mezkod is a23plicable to a large number of metals and wastes. All matrkes , including ground ;Jater, aqueous samples, EP extracts, industrial .tiastes, soils, sludges, sediments, and ot:?er solld.wastes, require digestion prior to analysis. EPA recommends digestion yethod 30.50 (57-846, 3rd Ed. - see Section 3.2.2-l).
3-12
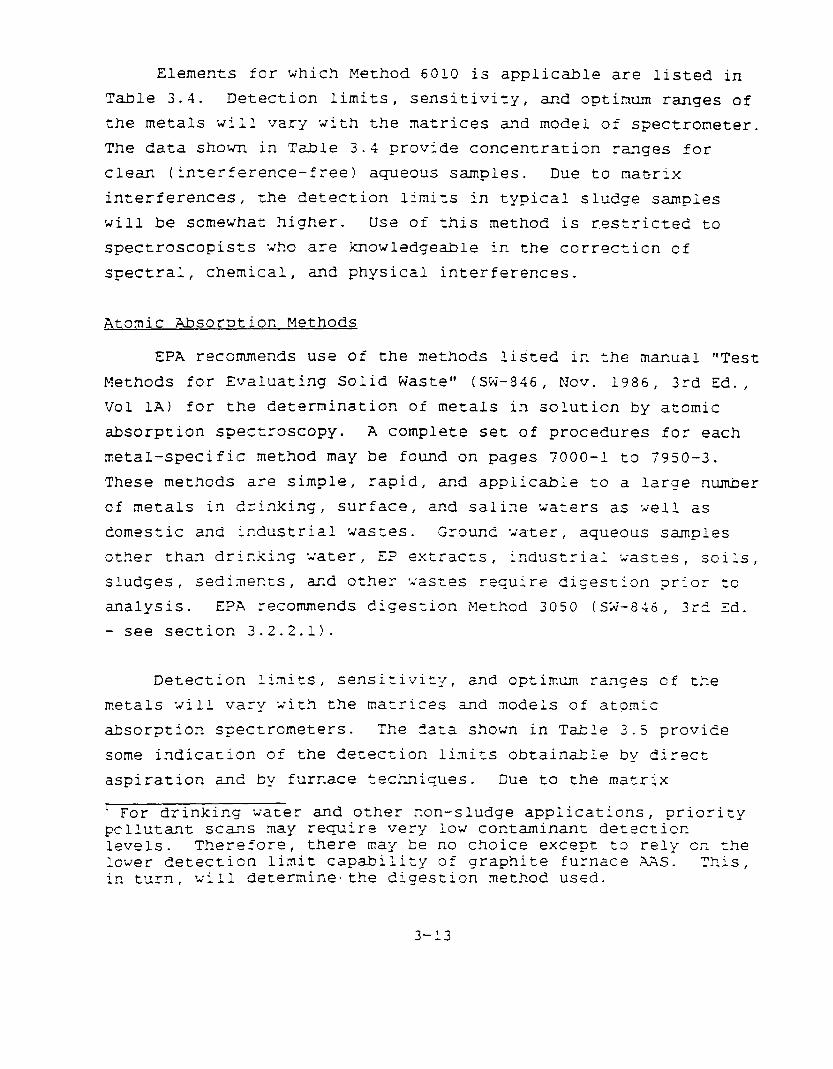
Elements for which Kethod 6010 is applicable are listed in Table 3.4. Detection limits, sensitivity, and optimum ranges of the metals will vary *dith the matrices and model of spectrometer. The data shown in Table 3.4 provide concentration ranges for clean (interference-free) aqueous samples. Due to matrix interferences, the detection limits in typical sludge sampies will be somewhat higher. Use of this method is restricted to spectroscopists ;iho are knowledgeable in the correction cf
spectral, chemical, and physicai interferences.
Atomic ?&sorption Methods
EPA recommends use of the methods listed in the manual "Test
Methods for Evaluating Solid Kaste" (W-846, Nov. 1986, 3rd Ed.,
Vol 1A) for the determination of metals in solution by atomic
absorption spectroscopy. A complete set of procedures for each metal-specific method may be found on pages 7000-L to 7950-3. These methods are simple, rapid, and applicable to a large number cf metals in drinking, surface, and saline 'daters as '.4ell as domestic and industrial wastes. Ground *;ater, aqueous samples other than drinking vater, EP extracts, industrial wastes, soils,
sludges, sediments, and other ~'astes require digestion prior tc analysis. EPA r ecommends digestion Nethod 3050 (.5X-846, 3r2 Ed. - see section 3.2.2.1).
Detection limits, sensitivity, and optimum ranges cf t:?e metals will vary vitih the matrix es and models of atomic absorption spectrometers. The data shown in Table 3.5 provide some indication of the detection limits obtainable by direct aspiration and by furnace techniques. Due to the matrix
' For drinking crater and other non-sludge appiications, priority pollutant scans may require very low contaminant detection levels. Therefore, there may be no choice except t3 rely cn the lower detection limit Capability of graphite furnace .VCG. This, in turn, t;ill determine-the digestion method used.
3-13
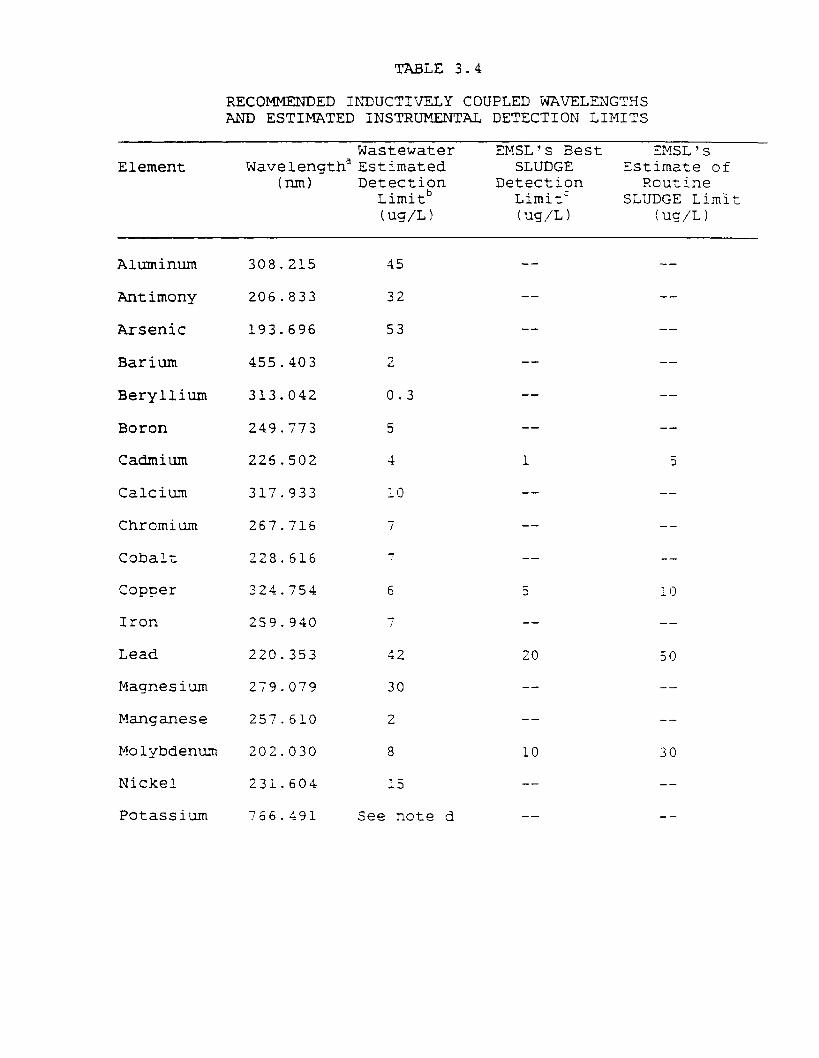
TABLE 3.4
RECOMMENDED INDUCTIVELY COUPLED WAVELENGTHS AND ESTIMATED INSTRUMENTAL DETECTION LIMITS
Wavelength3 (ml)
Wastewater ZMSL's Best E?J?SL?s Estimated SLUDGE Estimate of Detection Detection Routine
Limitb Limit' SLUDGE Limit tug/L) (ug,/L) fug/L)
Element
Aluminum 308.215
Antimony 206.833
Arsenic 193.696
Barium 455.403
Beryllium 313.042
Boron 249.773
Cadmium 226.502
Calcium 317.933
Chromium 267.716
Cobalt 228.616
Copper 324.754
Iron 2'59.940
Lead 220.353
Magnesium 279.079
Manganese 257.610
Molybdenum 202.030
Nickel 231.604
Potassium 766 .491
45
32
53
2
0.3
5
4
10
6 5 1 I)
7
42
30
2
8
15
See note d
-- --
--
--
--
1
--
--
S
20 50
10
--
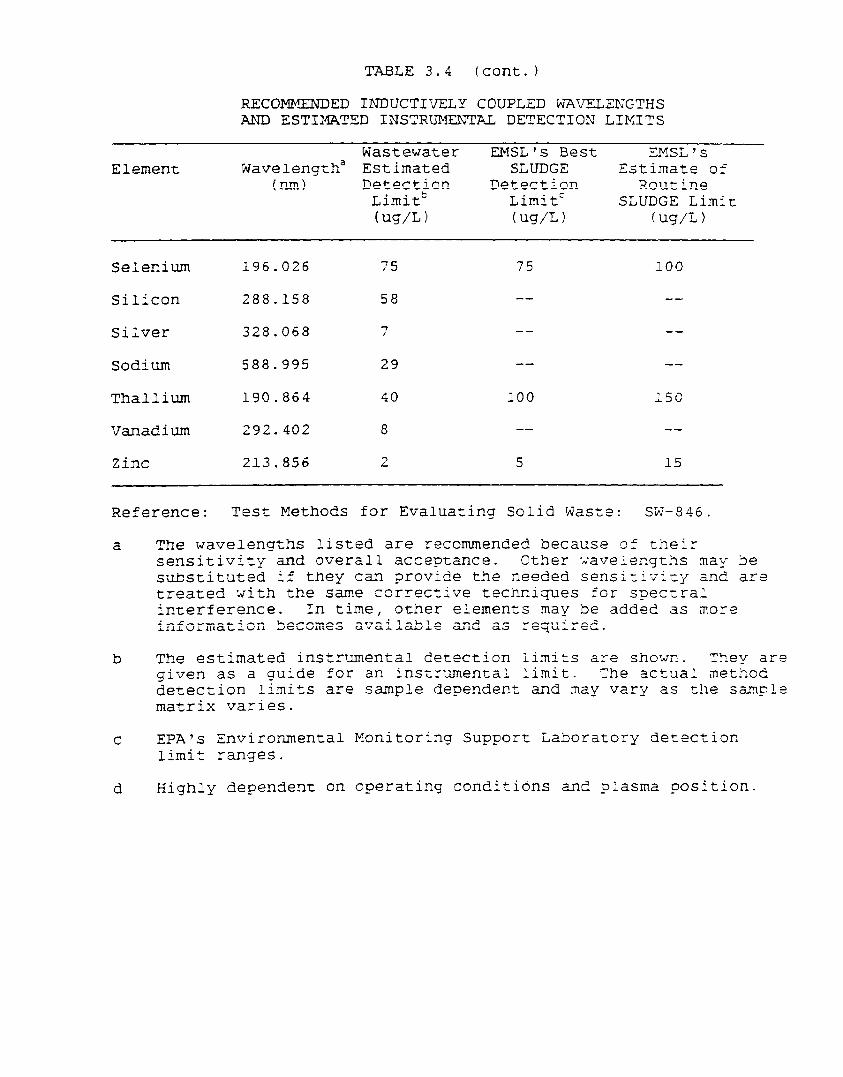
TABLE 3.4 (cont.)
RECOMMENDED INDUCTIVELY COUPLED ~JXVELENGTHS AND ESTIMATED INSTRUMENTAL DETECTION LIMITS
Element Wastewater EMSL's Best ZMSL'S
Wavelengtha Estimated SLUDGE Estimate of (I-lttl) Detection Detection Routine
Limit" Limit' SLUDGE Limit (ug/L) fug/L) fug/L)
Selenium 196.026 75 75 100
Silicon 288.158 58
Silver 328.068 7 -- --
Sodium 588.995 29 -- --
Thallium 190.864
Vanadium 292.402
100
--
150
--
Zinc 213.856 2 5 15
Reference: Test Methods for Evaluating Sclid Waste: .5X-846.
a The wavelengths listed are recommended because of their sensitivity and overall acceptance. Cther vavelengt:hs may be substituted if they can provide the needed sensizivlty and are treated ;Jith the same corrective techni,ques for spectral interference. In time, other elements may be added as more information Becomes available and as required.
b
C EPA's Environmental Monitoring Support Laboratory detection limit ranges.
d Highly dependent on operating conditions and plasma position.
The estimated instrumental detection iimits are shown. Thev are _ given as a guide for an instrumental limit. The ac+Lla' c - method detection limits are sample dependent and may vary as t!le sample matrix varies.
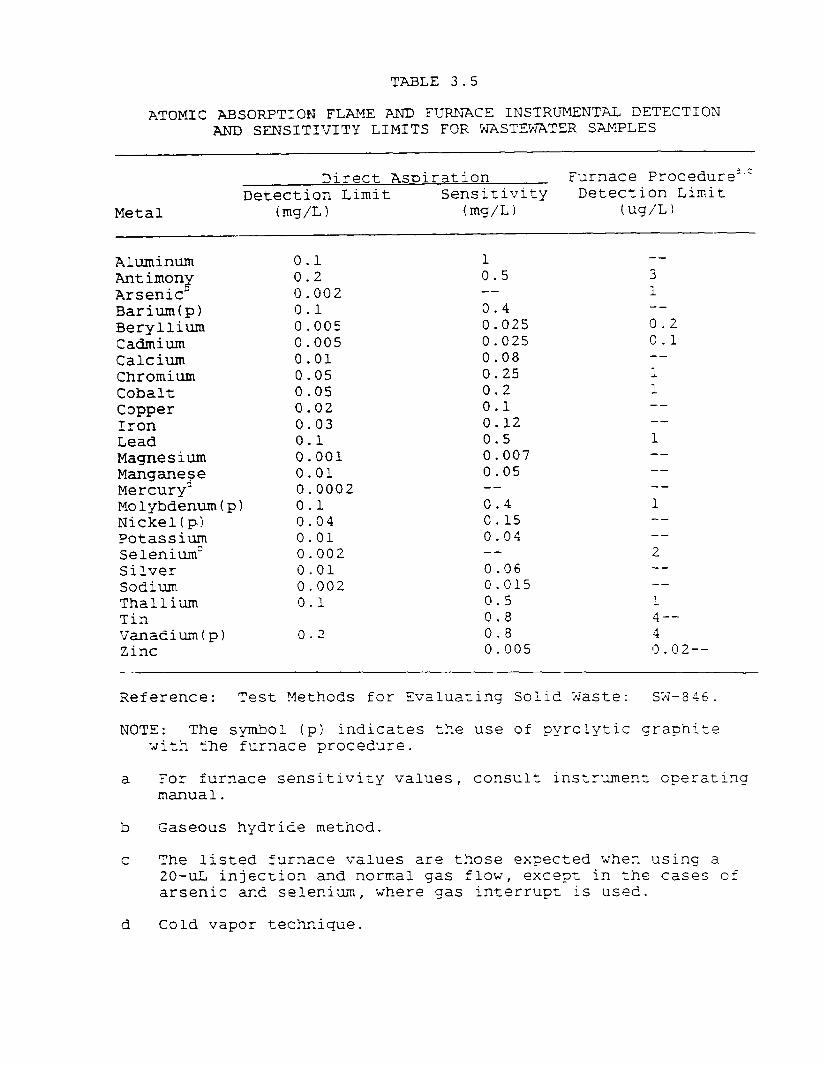
TABLE 3.5
ATOMIC ABSORPTION FLAME AND FTJRKXCD, INSTRUMENTAL DETECTION AN-D SENSITIVITY LIMITS FOR WGTZ'ISATER SAKPLES
Metal
Direct Aspiration Furnace Procedure'.' Detection Limit Sensitivity Detection Limit
(mg/L) (mg;L) tug/L)
Aluminum 0.1 1 --
Arsenic Antimony 0.2 0.5 3 0.002 -- 1
Barium(p) 0.1 0.4 -- Beryllium 0.005 0.025 0.2 Cadmium 0.005 0.025 0.1 Calcium 0.01 0.08 -- Chromium 0.05 0.25 1 Cobalt 0.05 0.2 1 copper 0.02 0.1 -- Iron 0.03 0.12 -- Lead 0.1 0.5 1 Magnesium 0.001 0.007 -- ManganeSe 0.01 0.05 -- Mercury' 0.0002 -- -- Molybdenumfp) 0.1 0.4 1 Nickel(p) 0.04 0.15 -- Potassium 0.01 0.04 -- Selenium' 0.002 -- 2 Silver 0.01 0.06 -- Sodium 0.002 0.015 -- Thalli*um 0.1 0.5 1 Tin 0.8 4-- Vanadium(p) 0 .2 0.8 4 Zinc 0.005 0.02-- - .
Reference: Test !qethods for Evaluating Solid Xaste: sx-846.
NOTE: The symbol (pj indicates the use of pyrolytic graphite tJith the furnace procedure.
a F or furnace sensitivity values, consult instr-.xnent cperating manual.
b Gaseous hydride method.
C The listed furnace values are those expected xher, using a 20-u-L injection and normal gas flow, except in the cases cf arsenic and selenium, where gas interrupt is used.
d Cold vapor technique.
interferences, the detection limits for typical sludge samples will be somewhat higher.
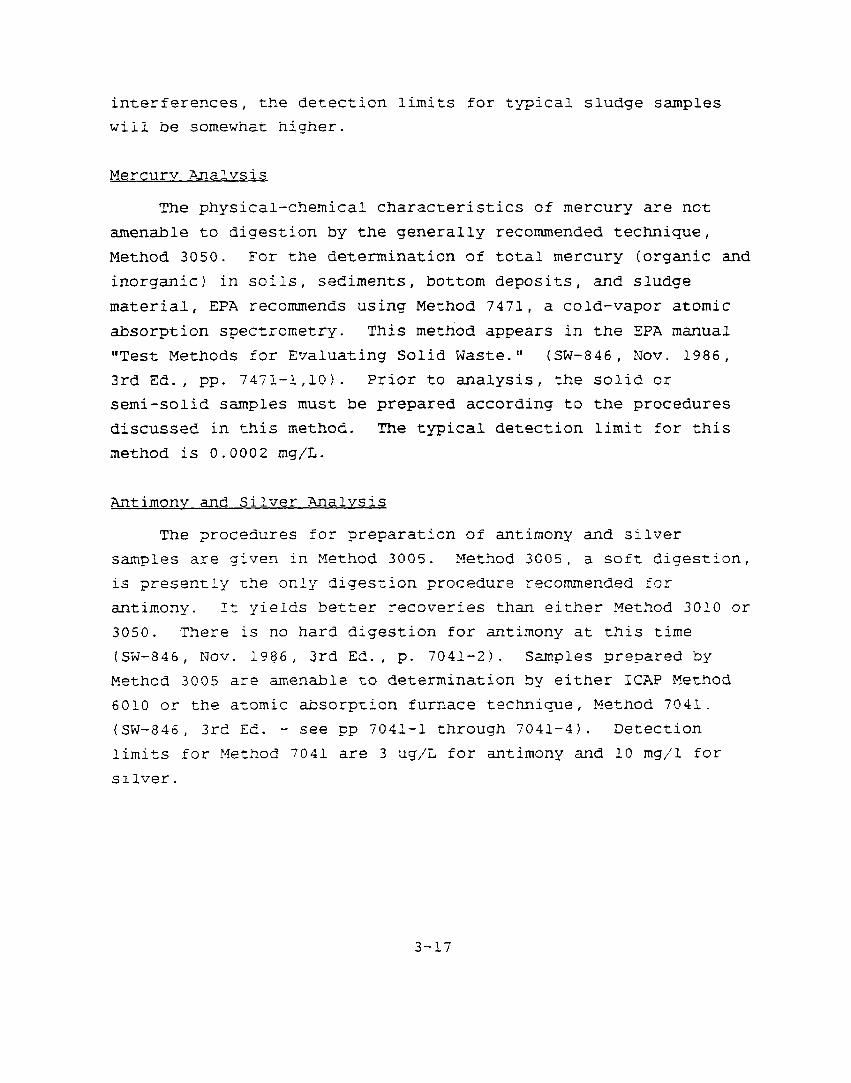
Mercurv Analvsis
The physical-chemical characteristics of mercury are not amenable to digestion by the generally recommended technique, Method 3050. For the determination of total mercury (organic and inorganic) in soiis, sediments, bottom deposits, and sludge
material, EPA reccmmends using Method 7471, a cold-vapor atomic
absorption spectrcmetry. This method appears in the EPA manual "Test Methods for Evaluating Solid TWaste." (SW-846, Nov. 1986, 3rd Ed., pp. 7471-1,101. Prior to analysis, the solid or semi-solid samples must be prepared according to the procedures discussed in this method. The typical detection limit for this
method is 0.0002 mg/L.
Antimony and Silver .Analvsis
The procedures for preparation of antimony and silver samples are given in Method 3005. Wethod 3005, a soft digestion, is presently the only digest: 'on procedure recommended for antimony. It yields better r ecoveries than either Method 3020 or
3050. There is no hard digestion for antimony at this time (SW-846, Nov. 1986, 3rd Ed., p, 7041-2). Samples prepared by Method 3005 are amenable to determination by either IChp Method 6010 or the atomic absorption furnace technique, l!ethod 7045. (SW-846, 3rd Ed. - see pp 7041-l through 7041-41. Detection
limits for Method 7041 are 3 ug/L for antimony and 10 mg/l for silver.
3-17
3.3 ORGANICS
The evolution of analytical techniques for organic contaminants has involved a number of modifications to a basic method in order to widen potential applications. Because the instrumentation is complex and the number of possible analytes is large, quality control is difficult to monitor and several analytical techniques are required. As with analyses for metals
and other elements, the organic-rich ccmplex matrices character-
istic of sewage sludges often mean that analyte extraction/isolation procedures play a significant role in the reliability of the resultant analytical data.
3.3.1 Overview of Analvte Extraction and Isolation
For a number of reasons, EPA has focused regulatory attention on two categories of contaminants: volatile organics and semi-volatile organics. 'While the classification of these groups is founded upon inherent physical/chemical properties, extraction and isolation techniques are the functional basis for the distinction.
Volatile Oroanics
Two methods are available for extraction and isolation cf volatile organics in aqueous and solid matrices: headspace techniques and purge and trap techniques. Several versions of these procedures have been sanctioned by regulatory agencies and/or developed for use in specific applications. For POTW sludge sampling and analysis, EPA recommends t-do analytical methods (:624C, 624-S! which both extract via purge and trap (see Section 3.3.2).
3-18

Purge and trap requires moderate sample preparation. The method relies upon a stripping process in which an inert gas is bubbled through the sample to remove the volatile organics. The volatilized organics are transferred from the aqueous/solid phase to the gaseous phase and subsequently trapped on a solid adsorbent column. The adsorbent column is then heated and the trapped organics are thermally desorbed and swept into the analytical instrument.
Semi-volatile Organics
The first Step in all procedures for determination of semi-
volatile organics is solvent extraction. (Note: For extraction procedures recommended by EPA for sludge analysis see Section 3.3.2). The sample material is mixed and agitated with a
solvent, causing the organic analytes to be preferentially
partitioned into the solvent phase. Extractions are typically performed at both acidic and basic pH ranges to facilitate
extraction of ionizable organics. Modifications to the extraction method are usually based upon the manner in which the sample-solvent mixture is agitated and post-extraction cleanup procedures.
The organic solvent used most frequently for extraction of semi-volatile analytes is methylone chloride, either singly or in combination with a more polar solvent. Extraction techniques which are applicable to sludge and solid matrices include:
0 Sonication extraction 0 Continuous liquid-liquid extractors 0 Soxhlet extraction
0 Mechanical agitation (shaker table, homogenization, or wrist-action shaker).
3-19
Sonication relies on the mechanical energy developed from ultra-sonic devices to affect agitation and solvent-solid contact. The best approach involves the use of a sonication horn which is immersed into the solvent-sample mixture, rather than a sonication bath. This technique has also been proven effective in sludge and sediment applications.
Continuous liquid-liquid extractors and Soxh:et extractors
employ the same basic principle of operation. The extraction solvent is distilled from a reservoir, condensed above the sample material, and subsequently. rains down through the sample. The distillation-condensation process continues until a volume of solvent has collected sufficient force to establish a siphon, at which point the extraction solvent is siphoned back into the reservoir. The cycle is repeated with freshly distilled solvent and is generally allowed to occur for 12-24 hours. The continuous liquid-liquid extraction procedure can only be used on low solids 1<5%) sludges, while the Soxhlet technique is most useful for materials with low water content.
A variety of mechanical agitation techniques have been llsed for extractable organics determinations, including hcmogen- ization, wrist-action shakers and platform shakers (shaker tables). The objective of each technique is to maximize the contact between the extraction solvent and. the solid partlclcs. Wrist-action and platform shakers have both proven adequate, with wrist-action shakers generally preferable for smaller sample containers and platform shakers preferable for larger extracticn vessels. Homogenization relies on agitation of the solvent-solid mixture, rather than agitation of the entire extraction vessel. This technique has been used quite successfully in sludge applications as a result of its supericr agitation. Zowever,
3-20
sand, a fairly common constituent of sewage sludge, literally chews up high speed homogenizers.
As a result of the complexity of sludge matrices, fractionation and/or cleanup procedures are often required after sample extraction to minimize interference. The basic concept used in virtually all cleanup techniques is selective adsorption of the interfering components. Although a variety of cleanup procedures have been developed for specific analytes, the techniques commonly employed for the listed applications include:
0
0
Cleanup procedures can be used FndivLdLally or in combination
Gel permeation resins - broad spectrum cleanup and higher molecular weight biogenic organics
Activated carbon - fractionation and general purpose cleanup
Alumina adsorbent - inorganic adsorbent
Florisil adsorbent - inorganic adsorbent
Silica gel adsorbent - inorganic adsorbent
Copper and mercury - removal cf sulfur-containing compounds.
with other procedures, depending upon the need of the particular application and the complexity of the sample.
For more detail regarding extraction and isolation
techniques, consult the references cited in 40 CFR Part 136, "Guidelines for Establishing Test i'rocedures for the Analysis of Pollutants."
3-21
3.3.2 Recommended Analytical Techniaues for Orsanics
For determining concentrations of organic pollutants in
sludge, EPA recommends two methods designed for qualitative and quantitative analysis of municipal and industrial wastewater treatment sludges:
0 Volatile Organics - 624-S (EPA 1984b) or 1624C (EPA 1988a)
0 Semi-Volatile Organics - 625-S (EPA 1984b3 or 1625C (SPA 1988a)
Each of these two methods employ gas chromatography/mass spectrometry (GC/MS).
GC/MS is a combination of tW0 microanalytical techniques: gas chromatography (a separation tec.hnique) and mass spectrometry (an identification technique). h sample allquot is prepared for extraction, extracted, then introduced to the GC/?lS system. The extract is vaporized quickly at an elevated temperature and carried by an inert gas (mobile phase) througih a coated coLumn (stationary phase). Separation of the extract components Is effected by their differential partitioning bet-Geen s-,ationary and mobile phases. The separated components exit the column and enter the mass spectrometer (MS) rc;here they are decomposed to specific unimolecular species. The manner in 7hic.i a component fragments is rharacteristic af that component and is -,he basis for identification. The MS detector quantifies a compound by responding with a signal prDportiona1 to the detected amount of the compound.
The GC/MS system is calibrated by measuring signal response to three to five analyte standard solutions of various concentrations (e.g., 29-160 ng;/ml). The solutions are carefully
3-22
prepared mixtures of pollutants suspected to be present in the sample, as well as a few labeled pollutant analogs known as internal standards. The accumulated measurements form an instrument response curve. Samples are spiked with the same internal standards at a fixed ccncentration immediately prior to analysis. If the MS detects any sample-originated pollutants, the generated signal for each pollutant is measured against both the internal standard and the response curve.
GC/MS analysis affords several advantages over other techniques:
0 Provides qualitative and quantitative information about a wide range of organic compounds.
0 Confirms specific information from a small sample size.
0 Produces a spectrum with a fragmentation pattern, or fingerprint, which can be used to identify an unknown.
3.3.2.1 Methods 1624C and 1625C
Methods 1624C and 1625C are draft methods for analyzing volatile organics (Method 1624C) and base/neutral, non and semi- volatile organics (Method 1625C) in sludge. These methods were developed by the USEPA Office of Water Industrial Technology Division, and are derived from previous methods 1624 and 1625 (see 40 CFR Part 136) for analyzing wastewaters.
The 1624C/1625C (and 1624/1625! test procedures are isotope dilution techniques. In conventional GC/MS, up to six internal
standards are used to quantify the response of perhaps several
dozen analytes. Isotope diluticn GC/MS employs stable, isotopicall y labeled analogs of the compounds of interest, which is analogous to providing a separate internal standard for each analyte. The result is that isotope dilution GC/MS is sensitive
3-23
to even minute contaminant concentrations. Methods 1624C/1625C
and 1624/1625 are similar in this respect but differ in sample preparation.
Method 1624C sample preparation for sludge samples consists of the following three routes, depending on the percent (%I
solids content of the sludge. If the solids content is less than
one percent, stable isotopically labeled analogs of the compounds
of interest are added to a 5 gram sample and the sample is purged in a chamber designed for soil or water samples. If the solids
content is 30 percent or less, the sample is diluted to one
percent solids with reagent water, and labeled compounds are
added to a 5 gram aliquot of the sludge/water mixture. The
mixture is then purged. If the solids content is greater than 30
percent, five ml of reagent water and the labeled compounds are added to a 5 gram aliquot of sample. The mixture is then purged.
Method 1625~ sample preparation for sludge.samples consists of the following three routes, depending on. the percent (%I solids content of the sludge. If the solids content is less than one percent, a one liter sample is extracted with methylene chloride using continuous extraction techniques. If the solids content is 30 percent or less, the sample is diluted to one percent solids rjith reagent water, homogenized ultrasonically, and extracted. If the solids content is greater than 30 percent, the sample is extracted using ultrasonic techniques. Each extract is subjected to a gel permeation chromatography (C-X) cleanup.
These methods are currently undergoing revision at EPA's Environmental Monitoring and Support Laboratory for problems relating to the sample preparation portions. They are the
3-24
methods used in the National Sewage Sludge Survey (which EPA is conducting to provide a current data base to be used to set pollutant limits, evaluate risks of use and disposal practices, and evaluate the impacts of the proposed rule) and also are discussed in the 40 CFR Part 503 regulation proposed on February
6, 1989 and now out for comment. Depending on the results of the comment period, the isotope dilution methods may be exclusively required for priority pollutant organics analysis when 40 CFR Part 503 is finalized.
3.3.2.2 Methods 624-S and 625-S
Methods 624-S and 625-S are existing methods for the measurement of organic priority pollutants in sludges. These test procedures were derived from previously developed methods 624 and 625 for analyzing wastewaters (see 40 CFR Part 136). The 624-S/625-S techniques are conventional GC/MS and operate as described Lz Section 3.3.2. Method 624-S is used to analyze for volatile organic compounds. Method 625-S is used for semi-volatile or nonvolatile organics.
In Method 624-S, an inert gas is bubbled through. a 10-z-L sludge aiiauot contained in a purging chamber at ambient temperature. The purgeable compounds are transferred from the
aqueous phase to the vapor phase. The vapor is carried through a sorbent col.umn where the purgeables are trapped. After purging is completed, the sorbent column is heated and backflushed vith the inert gas to desorb the purgeables into a gas chromatographic column. The gas chromatograph is temperature programmed to separate the purgeables which are then detected with a mass
spectrometer.
Method 625-S uses repetitive solvent extraction (see section 3.3.1 ) aided by a high-speed homogenizer. The extract is
3-25
separated by centrifugation and removed with a pipette or syringe. Extracts containing base/neutral compounds are cleaned by silica gel or florisil chromatography or by gel permeation chromatography (GPC). Extracts containing the acidic compounds are cleaned by GPC. The organic priority pollutants are determined in the cleaned extracts by capillary column or packed column GC/MS. Option A, i.e., extract cleanup by silica gel cr florisil chromatography and analysis by capillary column K/MS IHRGC/MS) is preferred since HRGC/MS allows easier data interpretation.
While Methods 1624C/162SC provide lower detection limits, in
some cases, than Methods 624-S/625-S, these methods are also more
costly. Presently, Methods 1624C/1625C cost about $2,200-$2,400 per sample, which is approximately $200-$400 more than a similar analysis by Methods 624-S/625-S. The extra cost reflects the Method 1634/1635 isotope spikes and approximately two weeks cf zor!c necessary to prepare additional spectra; libraries.
Neither Methods 624-.5/625-S or Methods 1624Ci1625C detect pesticides at very low concentrations. Xithcut megabcre c2 1,a-m analysis, which may cost an additional $1,900, none of Liese methods ziil do better than the detection limits, 20-50 ppb. "or some highly mixed pesticides such as chlordaze, these methods ran only rJ,ersect ZOO-300 ppb. At this time, EfA is not.reccmmendlrg megabore column pesticide analysis naticnzlly. However, in situations where lower detecticn :ixTllts are crucial such as In PCB or pesticide analysis, megaboie column analysis is necessary.
3.4 P?VTHOGENIC KCROORGAXISMS
A pathogen or pathogenic agent is an‘; blologlcal species t:iat can cause dicease in the host organism !primarily humans). These organisms fall into four bread categories: viruses,
3-26
bacteria, parasites, and fungi. From these categories, species commonly found in sewage sludge include fecal coliforms, fecal streptococci, salmonella, and ascaris (helminth). Wastewater sludge disinfection, the destruction or inactivation of pathogenic organisms in the sludge, is carried out to minimize public health concerns regarding these and other microbial agents.
The 40 CFR Part 257 regulations issued under joint authority of Subtitle D of the Resource Conservation and Recovery Act (RCRA) and Section 405(d) of the Clean Water Act establish requirements for the disposal of solid waste which include pathogens in sewage sludge. The regulations (40 CFR Part 257.3-6) require that sewage sludges applied to the land surface or incorporated into the soil be treated by a Process to Significantly Reduce Pathogens (PSRP). Public access must be controlled for at least twelve months after sludge applications and grazing by animals whose products are consumed Sy humans must be prevented for at least one month after application. Treatment by a Process to Further Reduce Pathogens IPFRP) is required for sewage sludge applied to the land surface or incorporated into the soil if crops for direct human consumption are grown within eighteen months after application, if the edible portion of the crop will touch the sludge.
Rather than requiring a specific reduction or concentration for given pathogens, the process-based regulation (see Appendix II of 40.CFR Part 257) describes and sets numerical requirements for unit processes and operating conditions that qualify as PSRP and PFRP (e.g., criteria for process time and temperature and for volatile solids reduction). Thus permit compiiance is based on
meeting process requirements, not pathogen reduction per se.
Appendix II of 40 CFR Part 257 allows methods or operating
3-27
conditions other than those listed under PSRP or PFRP if pathogens and vector attraction are reduced commensurate vith the reductions attainable from listed methods. Appendix II (of 40 CFR Part 257) does not prescribe the operation mode (i.e., batch or continuous) for digesters. The regulation also does not specify a method for calculating volatile solids reduction. Fcr a comprehensive discussion of the ways that volatile solids reduction may be calculated and their Iimitations, refer to Appendix B of this guidance document.
Although the 40 CFR Part 257 regulations are based on specific processes rather than on meeting specific pathogen reduction levels, the regulations do provide that other processes
"may be acceptable if pathogens are reduced to an extent equivalent to the listed processes.Tt In order to provide guidance on the equivalence of these other methods EPA has a panel of experts, the Pathogen Equivalency Committee (TEC), which evaluates the acceptability of the process based on the level of pathogen reduction, as determined by standardized analytical tests. For more comprehensive information on pathogen and guidance on whether alternative processes provide equivalent levels of pathogen reduction consult the draft "Guidance for Controlling Pathogens in Municipal Wastewater Sludge" PEC/EPA Yay 1989 (to be finalized July/August 19891.
Sampling techniques for determining pathogens in sewage sludge are no different than for other tests except that no preservatives are used. In the absence cf definitive sludge methods for determining bacteria concentrations, modified standard wastewater methods are often utilized. The analYytir,al methods for analysis of pathogens and indicator organisms are provided in Table 3.6. Unfortunately no standardized rethods exist for parasitic determinations.
3-28
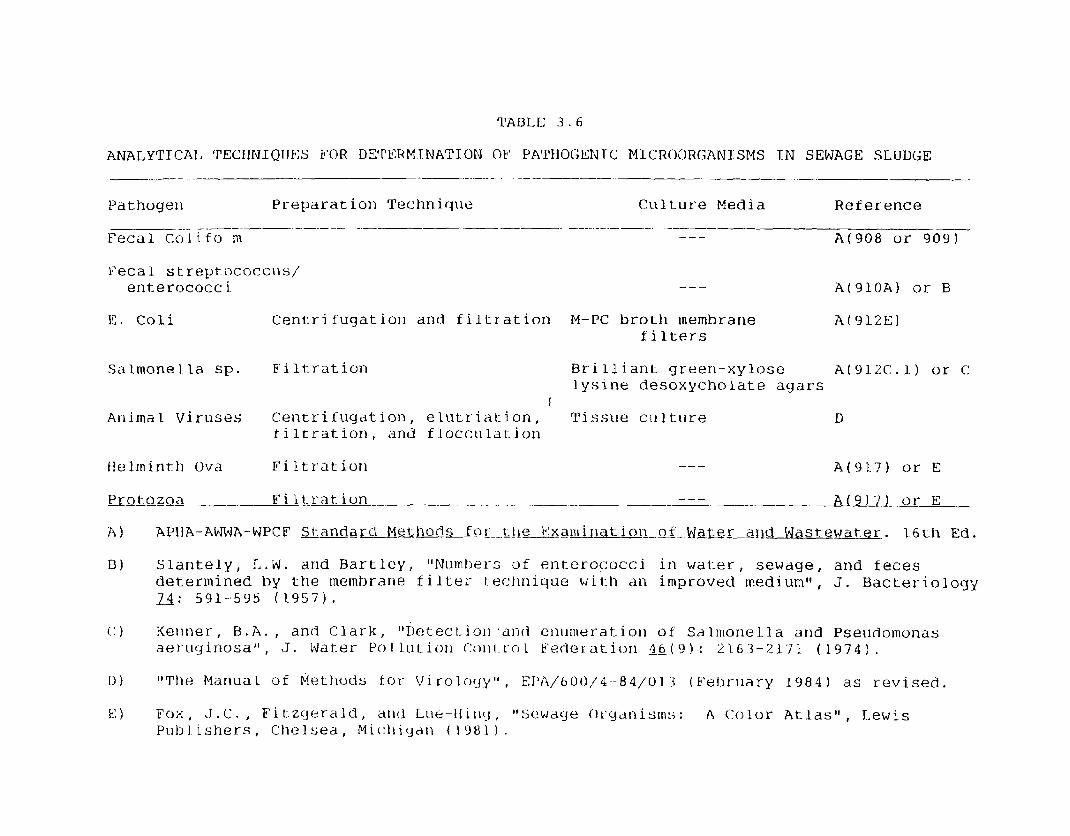
1’ABLE 3.6
~ALyTTCAI, TECtJNIQI.lE:S b’C)R DE’I’ERMTNATION OF PATHOGENTC MICROORGANISMS IN SEWAGE SLUDGE -- _- --- .-_.-_.- ..- -____- --..-
Pathoge11 Preparation Technique Culture Media Reference ___ -_--.
Fecal Colifo m --- A(908 or 909)
enter
E. COli
Salmone
cocci. --- A( 91OA
Centrifugatioli and filtration M-PC broth membrane h(912E filters
la sp. E’i ltr’at ion Br i 11 i ant green-xylose A( 9I%C lysine desoxycholate agars
or B
1) or C:
I Animal Vi ruses Centrifuyation, el.utriation, Tissue cl1 1 ture D
f i It-ration, and flocculation
Hclminth Ova Filtration --- A(91.7) or E
Protozoa Fi 11,1’at. ion --- . .._ ---___ -.-- --lGLU.1- or E
A) APIIA-AWWA-WPCF St-.andarc.l Methods ftsi--.t-lle Fxami rlat iorl of .Hater and Wast.ewat.er . 1.6th Ed.
B) Slantely, I,. W. and Bart ley , auNrlmtu?rs of enterococci in water, sewage, and feces determined by the membrane filter technique with an improved mediumll, J. Bacteriology 74: 591-595 (1957).
D 1 41Ttle Manual of Methods J.or Vi rolo~~y” , EPA/GOti/4--84/o] 3 (February 1984) as revised.
E ) FOX, J.C., Fitzr~erald, arlrl Lue-11 i 11(-j , “:<ewdye Ill.cjallisms: A Color Atlas”, Lewis Publ,ishers, Chelsea, Mic:llicjdn (1981 ) .
The effectiveness of many PSRPs and PFRPs for reducing pathogens can be estimated by measuring the effects on fecal indicator organism densities (e.g., fecal coliform and/or fecal streptococcus). These tests are less expensive and easier to r than tests for specific pathogens and also provide good control data.
li
3-30
4. QUALITY ASSURANCE/QUALITY CONTROL
An essential part of a sampling and analysis program includes a well designed quality assurance/quality control
(QA/QC) program. The extent of the QA/QC program should mirror the intent and purpose of the sampling effort. It should be noted that the facility is ultimately responsible for the quality of the data even if a contractor is used. Therefore, it behooves
the POTW to have a good QA/QC program.
If the purpose of the sampling and analysis program is to determine compliance with permit conditions, or to provide critical data for making a major cost decision, then the QA/QC program should be extensive and be able to demonstrate the precision, accuracy, representativeness, comparability and completeness of the data. The determination of these QA/QC parameters and their definitions are as follows:
• QA is an overall program which guarantees the quality of the product. It includes a QC auditing process to prevent future defects. QA is synonymous with process control, continuous improvement and prevention of poor quality. QC is the examination of the product to determine ii it meets the specifications of the QA program. QC is part of the overall QA program. QC is synonymous with appraisal after the fact. An example of QC is that lab duplicate results must be within a certain percentage of each other or else the whole batch must be redone.
• Laboratory QA includes prevention of data contamination during laboratory procedures. Contamination may be due to various other tests that are run in the lab at any given time. In order to assure that any sample contamination that does occur does not contaminate lab data, a lab QA sample, usually a deionized water "blank (or other "clean" appropriate material), is run along with the actual field samples. Lab QA also includes doing duplicates and spikes of the actual samples. Field QA serves the same purpose, to prevent data from being erroneous. However, it is virtually
4-1
•
•
•
•
impossible to prevent contamination of the samples since the sampling environment is not controllable. Therefore, the field blanks are subject to the same conditions as the samples, i.e., the containers are exposed to the environment as long as the sample containers are open, the sample and field "blank" are transported together.
Accuracy, which is closeness to actual values, of all sample testing and analyses should be evaluated at a minimum frequency of 5 percent of the samples tested (i.e., at least one in every 20 Samples), using spiked samples. Accuracy is calculated from the known and analytically derived values of spiked parameters, and expressed as percent recovery. The accuracy required in the quality assurance program for the analyses is specified in each of the EPA methods (e.g., EPA 600 or 1600 Series or EPA Methods for Chemical Analysis of Water and Wastes).
Precision, which is repeatability of results, of sample analyses should be evaluated at a minimum frequency of 5 percent (i.e., at least one in every 20 samples), using spiked samples in duplicate. Precision is calculated from the analytical results of the. spiked analytes in each set of duplicate samples., and expressed as percent relative standard deviation. The precision required in the quality assurance program for the analyses is specified in each of the EPA Methods (e.g., EPA 600 or 1600 series or EPA Methods for Chemical Analysis of Water and Wastes).
Completeness is calculated as the ratio of valid measurements obtained to the number of valid measurements needed to reach a predefined statistical level of confidence in the resulting data. Completeness is determined and evaluated on the basis of data sets for each specific measurement process. Data are considered to be valid if both the accuracy and precision of the measurements meet the data quality objective (i.e., accuracy, precision, and compliance with analysis method protocol).
All sampling should be performed using methods, procedures, and controls that ensure the collection of representative samples which thus ensures that the analytical results are representative of the media and the conditions being measured.
4-2
0 Comparability is a more qualitative QA measurement. All analytical data must be calculated and reported in units consistent with those specified in the applicable permit. Previously developed data generated for each facility abcut to be inspected is reviewed to ensure that no difficulties of data comparability will be encountered by following the specifications of the permit. If no previous data exist and the permit requirements are incomplete or ambiguous, data should be reported in the standard units prescribed in the appropriate EPA Methods (e.g., EPA 600 or 1600 series or EPA Methods for Chemical Analvsis of Water and Wastes).
These QA/QC procedures are necessary for ensuring data quality. On the other hand, if the purpose of the sampling effort is to monitor plant performance for routine operation and maintenance
(O&M) decisions, a simplified QA program that includes sample replicates and a field blank might suffice.
Sludge sampling and analysis programs for determining compliance with permit conditions should include a written QA
Plan. EPA guidance for the development of a QA Program (EPA Quality Assurance Project Plans (QAPP), 1983) identifies 16 elements which should be addressed in a QA plan:
Title Page
Table of Cont ents
Project Description
Project Organization and Responsibility
QA Objectives for Measurement Data in Terms of Precision, Accuracy, Completeness, Representativeness, and Comparability
Sampling Procedures and Frequency
Sample Custody
Calibration Procedures and Frequency
4-3
Analytical Procedures
Data Reduction, Validation and Reporting
Internal Quality Control Checks
Performance and System Audits
Preventive Maintenance
Specific Routine Procedures Used to Assess Data Precision, Accuracy and Completeness
Corrective Action
Quality Assurance Reports to Management
In preparing a QAPP, the QA parameters and specifications of the analytical program should be dictated by the analytical parameters. The QA parameters are specified in each analytical protocol. There are situations (particularly for enforcement actions) in which more stringent protocols will be desired.
In preparing the QA plans, the collection of field blanks (blanks to reflect sample handling effects) and sample replicates should be addressed. At a minimum, field blanks should be collected every day that sampiing is performed. Fieid blanks should be prepared at the beginning of each sampling event, at
7 ' each discrete sampling site, by pouring American Society for Testing and Materials (ASTM) Type II reagent-uater'into prepared sample bottles. These sample bottles are randomly selected from the supply of prepared sample bottles; a sample container should be selected that is appropriate for each type of analysis for which environmental samples are being collected (see Table 2.:). The field blanks should be handled and analyzed in the same manner as environmental samples. Because field blanks and environmental samples are collected under the same conditions, field blanks analyses should be used to indicate the presence cf
4-4
external contaminants that may have been introduced into samples during collection.
One f' leld replicate for every 20 samples or less should be collected at a preselected POTW monitoring point. Field replicates should be collected at the same time and in the same manner as the other environmental samples. Results of the field replicate analyses should be used primarily to assess the precision of the field sampling methods.
In preparing and evaluating the analytical report, attention should be given to the data quality, and the impact of both the sampling and analysis data quality to the overall interpretation of the analytical results. Both the data from the field QA samples and the laboratory QA samples should be evaluated for the presence of contaminants. Additionally, statistical procedures should be used for the deCe.mination of precision, accuracy and completeness. The QApP 1983 document provides a description of the statistical procedures and their applications. All reports of analytical data should contain a separate section ;crhich assesses zhe quality of the reported data.
The sample procedures and frequency section of the quality assurance plans should address, among other elements, sample hoiding times, sample preservation procedures, and sample chain-of-custody. Maximum sample holding times are presented in Tabie 2.4. Section 2.5.3 addresses sample preparation. Section 2.7.2 addresses sample chain-of-custody.
The section of the quality assurance plan on internal quality control checks specifically discuss how the following activities sill be addressed:
4-5
Qruanic Prioritv Pollutants
0 Instrument tuning and calibra 0 Method blank analysis 0 Surrogate spike analysis 0 Matrix spike/matrix spike dup 0 Internal standards analysis
tion
licate analysis
Inorganic Prioritv Pollutants
0 Initial calibration verification
0 Continuing calibration verification 0 InstrumeIlt response and linearity verifica,tion 0 Calibration and preparation blank analyses 0 Interference check sample analyses 0 Spike sample analyses
0 Duplicate sample analyses 0 Quality control sample analyses 0 Serial dilution analyses (if applicable) 0 Instrument detection limit determination 0 Method of standard additions application.
4-6
5. SAMPLING AND ANALYTICAL COSTS
The cost of carrying out a sludge sampling program can vary depending on the number and type of samples, parameters analyzed, and whether analytical services are contracted out. The following discussion examines sampling and analytical costs as of April 1989.
5.1 MANPOWER REQUIREMENTS
Manpower requirements fall into two categories: (1) supervisory and program development, and (2) sampling/analytical. All sampling programs should be designed and supervised by qualified personnel. Developmental and supervisory needs will vary according to the following factors:
• Type and number of samples
• Number of streams to be sampled
• Number of facilities/locations
• Availability of suitable sample points
• Parameters to be analyzed
• Experience and qualifications of field and laboratory personnel.
The number of factors influencing supervisory needs makes estimating average Costs for these needs impractical. Costs will vary according to the hours needed for each program and according to the salary range of qualified personnel within a given organization.
Sampling manpower needs will also vary widely depending on the conditions listed above. For 24-hour composite sampling, a
5-1
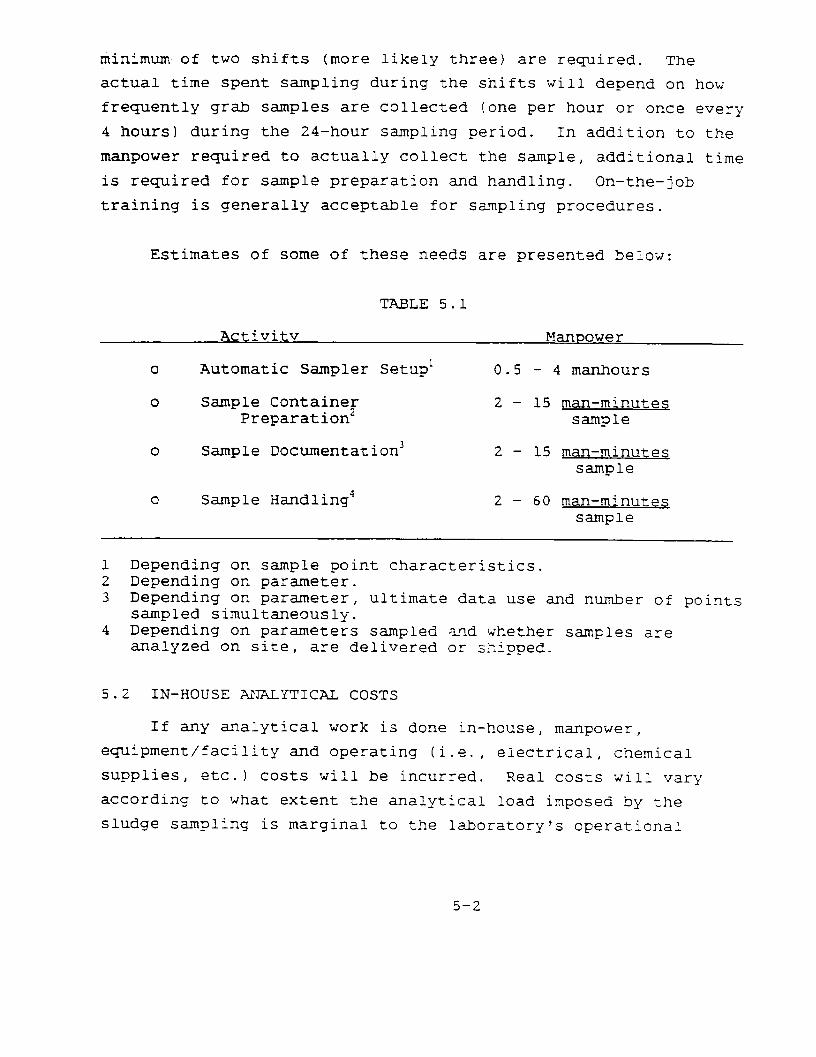
minimum of two shifts (more likely three) are required. The actual time spent sampling during the shifts will depend on how frequently grab samples are collected (one per hour or once every 4 hours) during the 24-hour sampling period. In addition to the manpower required to actually collect the sample, additional time is required for sample preparation and handling. On-the-job training is generally acceptable for sampling procedures.
Estimates of some of these needs are presented below:
TABLE 5.1
Activity manpower
• Automatic Sampler Setup' 0.5 - 4 manhours
• Sample Container 2- 15 Preparation2
man-minutes sample
• Sample Documentation3 2- 15 man-minutes sample
• Sample Handling4 2- 60 man-minutes sample
1 Depending on sample point characteristics. 2 Depending on parameter. 3 Depending on parameter, ultimate data use and number of points
sampled simultaneously. 4 Depending on parameters sampled and whether samples are
analyzed on site, are delivered or shipped.
5.2 IN-HOUSE ANALYTICAL COSTS
If any analytical work is done in-house, manpower, equipment/facility and operating (i.e., electrical, chemical supplies, etc.) costs will be incurred. Real costs will vary according to what extent the analytical load imposed by the sludge sampling is marginal to the laboratory's operational
5-2

capacity. Two extremes serve as examples of this cost variability.
A plant electing to do in-house analysis which has no laboratory would need to make a sizable expenditure for an adequate facility and the necessary analytical equipment and
supplies. In addition, qualified [B.S. Chemistry or equivalent) laboratory personnel must be put on the payroll. Given these circumstances, it would generally not be practical to do in-house
analysis. Instead, it is likely that this plant would contract out for analytical services.
A second plant, conducting a similar sludge sampling
program, also elects to do all related analytical work in-house. This plant, however, has an analytical laboratory in place which is capable of performing all analyses required. In addition, the laboratory is presently operating below capacity. The additional load imposed by the sludge sampling program will not require any capital expenditure, and will require little, if any, additional laboratory manpower (any additional manpower needs can be accommodated by limited overtime rather than new employee hires) . In the case of this plant, in-house analysis for a sludge sampling program can be accomplished at a very low real cost,
Because of the wide range of real costs possible for sampling and in-house analytical work, no attempt is made herein to quantify these costs on a dollars per sample basis. Rather, each sampling program must be analyzed in light of applicable salary scales, sampling program complexity and in-house analytical capabilities.
5-3
5.3 CONTRACT ANALYTICAL COSTS
Many sludge sampling programs, particularly those conducted by small municipalities or authorities, will utilize contract laboratories for analytical work. In contrast to sampling costs,
which vary greatly due to a wide variety of factors, contract analytical costs. fall within a relatively narrow range. Table
5.2 presents typical analytical costs for parameters commonly run
on sludge samples. These cost estimates were obtained in a March
1988 and 1989 telephone survey of analytical laboratories.
Two factors must be considered in estimating contract analytical costs for sludge sampling programs. The first is tlhe
need, depending on parameters, for additional preparation of
sludge samples prior to analysis. Fany laboratories charge an
additional fee for this preparation, which can be as much as
$100, depending on the parameters to be run.
The second factor impacting analytical costs is the practice by most laboratories of offering discounts on per sample prices for multiple sample analysis. These discounts vary from laboratory to laboratory, and can be substantial depending on the number of samples involved. Of particular importance is the number of samples being received simultaneously by the laboratory (i.e., a greater disccunt *Jill typically be offered for 10 sam- pies if ail are tc be analyzed at one time rather than if one is to be delivered to the lab each ;ieek for i0 weeks).
5.4 SAMPLING EQUIPMENT COSTS
The cost of sampling equipment and containers is typically a relatively small fraction of the overall cost of a sludge sampling program. In general, the manual collection methods used for sludge sampling require only simple, relatively inexpensive
5-4
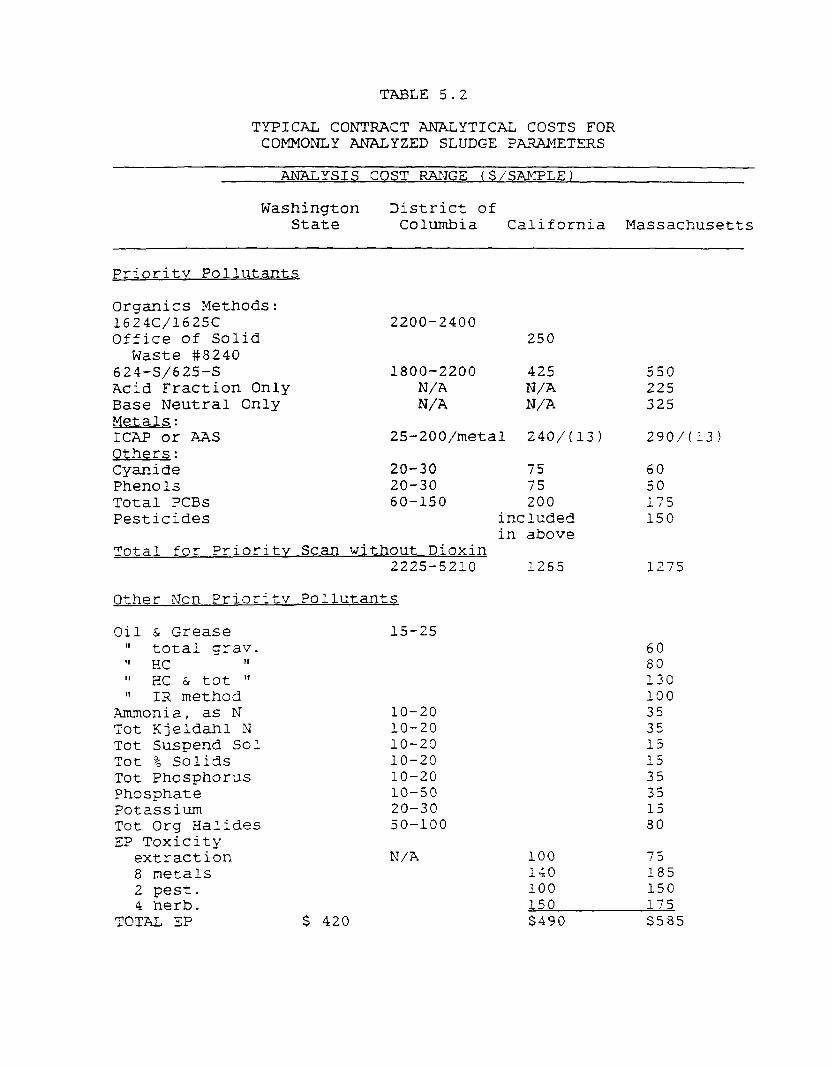
TABLE 5.2
TYPICAL CONTRACT ANALYTICAL COSTS FOR COMMONLY ANALYZED SLUDGE PARAMETERS
ANALYSIS COST RANGE ($/SAMPLE)
Washington District of State Columbia California Massachusetts
Prioritv Pollutants
Organics Methods: 1624Cj1625C Office of Solid
Waste #8240 624-S/625-S Acid Fraction Only Base Neutral Only Metals: ICAP or ?AS Others: Cyanide Phenols Total PCBs
2200-2400
1800-2200 425 550 N/A N/A 225 N/A N/A 325
25-200/metal
20-30 20-30 60-1.50
250
240/(13)
75 75 200
Pesticides included in above
Total for Priority Scan without Dioxin 2225-5210 1265
Other Non PriOritv Pollutants
Oil & Grease 15-25 II total grav. v HC 11 1, EC & tot " 11 III method
Ammonia, as N Tot Kjeldahl N Tot Suspend Sol Tot % Solids Tot Phosphorus Phosphate Potassium Tot Org Halides EP Toxicity
extraction N,‘A 8 metals 2 pest. 4 herb.
TOTAL EP $ 420
10-20 10-20 10-29 IO-29 10-20 10-50 20-30 50-190
290/(13)
60 50 i75 150
15 27
60 80 130 100 35 35 15 15 35 35 15 80
100 75 140 185 100 150 150 175 $490 $585
equipment. The following paragraphs highlight the primary equipment cost items in a typical sludge sampling program.
0 Sample Containers - Sample container costs are related to: (1) the number of containers needed, and (2) the type of container needed, depending on parameter(s) to be analyzed. The following are typical per-container prices for some commonly used containers:
Container
Teflon 1 liter s 35 - 40 Graduated Glass 1 liter s 3-4
(w/Teflon-lined cap) Polypropylene 1 liter .s 2 Polypropylene 0.5 liter $ 1.50 Polypropylene 10 liter $ 15 Glass 0.5 liter S<l-2
(w/Teflon lined cap)
Approx. Price
As with analytical costs, suppliers of containers often offer substantial discounts for volume purchases.
0 Automatic Samplers - In most sludge sampling programs the use of automatic sampling equipment will be precluded due to sample characteristics. If automatic sampling is utilized in a given sampling program, automatic sampler costs will typically con.stitTute the majority of sampling equipment costs. Portable, battery-powered peristaltic-type samplers tlypically cost from $1000 to $3000, depending on features such. as computerized controls, etc. "neumatically operated plunger-type samplers will vary in price according to application and capacity.
0 Manual Sampling Equipment - In general, equipment costs for manual sludge sampling are minimal. Stainless steel pitchers (2 liter!, which are useful for sampling from either a tap or an open channel flow, are available for approximately $20. Polypropylene pitchers typically cost about l/2 of the price of stainless steel. Stainless steel scoops used for sludge cake sampling cost approximately $40 CdependLng on size), while aluminum scoops of similar size are available for less than $10.
0 Preservatjves - Reagent grade chemicals should be used as preservatives. Since each sample will typically
5-6
require very small amounts of preservatives, cost on a per sample basis is negligible.
5.5 OPPORTUNITIES FOR COST SAVINGS
To provide a representation of sludge quality over a fixed duration, sewage sludge can be composited (i.e. mixed), reducing the number of samples to be analyzed. In light of the high costs
associated with analysis of priority pollutant organics in sewage
sludge, cornpositing samples provides an opportunity to substantially lower analytical costs. ?ield campositing is not an appropriate teclhnique to use when the sample sill Se analyzed for volatile components. Lab personnel can composite grab
samples in the lab.
When interested in daily variation in sludge constituents, a POTW can collect and analyze 24-hour composite samples, each consisting of six or more grab samples. This represents a
significant cost savings when compared to separately analyzing many individual, non-composited samples. Smaller POTXs, with
less variation in sludge quality, may elect to composite samples
over several days as opposed to 24-hotlr composites. The
suitability cf a multi-day ccmpositing prxedure w:ll Cepend upon whether the specific sludge constituent can be adequately preserved in the sludge sample. Table 2.3 shows tkr,e recommended preservatives and maximum sample holding times for organic and metal pollutants.
Another way to reduce costs wculd be to sample more frequently for parameters that are relatively inexpensive zo
analyze such as metals, nitrogen, phosphorus, and potassium, and to test for organic pollutants (expensive) less frequently, so long as some data are available indicating that the levels of organic contaminants in the sludge are acceptable.
5-7
6. REFERENCES
APHA-AWWA-WPCF. 1976. "Standard Methods for the Examination of Water and Wastewater". Washington, D.C.: APHA-AWWA-WPCF.
Black, C.A. (ed.). 1965. "Methods of Soil Analysis, Agronomy Monograph No. 9." Madison, Wisconsin: American Society of Agronomy.
Colby, Bruce N., and Ryan, Philip W. 1986. "Initial Evaluation of Methods 1634 and 1635 for the Analysis of Municipal Wastewater Treatment Sludges by Isotope Dilution GC/MS". Washington, D.C.: U.S. Environmental Protection Agency, Office of Water Regulations and Standards.
"Criteria for Classification of Solid Waste Disposal Facilities and Practices," 40 CFR Part 257. Washington, D.C.: National Archives and Records Administration, Office of the Federal Register.
EPA. 1974. "Process Design Manual for Sludge Treatment and Disposal", EPA625/1-74-006. Washington, D.C.: U.S. Environmental Protection Agency, Office of Technology Transfer,
EPA. 1976. " Analytical Methods for Trace Metals", EPA-430/l-76-002. Cincinnati, OH: U.S. Environmental Protection Agency, National Training and Operational Technology Center.
EPA. 1977. "The Sources and Behavior of Heavy Metals in Wastewater and Sludges", EPA-600/2-77-070. Cincinnati, OH: U.S. Environmental Protection Agency, Municipal Environmental Research Laboratory.
EPA. 1978a. "Microbiological Methods for Monitoring the Environment, Water and Wastes", ETA-600/8-78-017. Cincinnati, OH: U.S. Environmental Protection Agency, Environmental Monitoring and Support Laboratory.
EPA. 1978b. "Validity of Fecal Coliforms, Total Coliforms, and Fecal Streptococci as indicators of Viruses in Chlorinated Primary Sewage Sludge Effluents", EPA-600/J-78-175. Cincinnati, OH: U.S. Environmental Protection Agency, Environmental Monitoring and Support Laboratory.
EPA. 1979a. "Methods for Chemical Analysis of Water and Wastes", EPA-600/4-79-020. Cincinnati, OH: U.S. Environmental Protection Agency, Environmental Monitoring and Support Laboratory.
6-1
EPA. 1979b. "Process Design Manual - Sludge Treatment and Disposal", EPA 625/l-79-011. Cincinnati, OH: U.S. Environmental Protection Agency, Municipal Environmental Research Laboratory.
EPA. 1981. "Parasites in Southern Sludges and Disinfection by Standard Sludge Treatment", EPA-600/2-81-166. Cincinnati, OH: U.S. Environmental Protection Agency, Municipal Environmental Research Laboratory.
EPA. 1983a. "Process Design Manual - Land Application of Municipal Sludge", EPA-625/l-83-016. Cincinnati, OH: U.S. Environmental Protection Agency, Municipal Environmental Research Laboratory.
EPA. 1983b. "Interim Guidelines and Specifications for Preparing Quality Assurance Project Plans". PB83-170514, QAMS-005/80. Office of Research and Development.
EPA. 1984a. "Multielemental Analytical Techniques for Hazardous Waste Analysis: The State-of-the-Art", EPA-600/4-84-028. Las Vegas, NV: U.S Environmental Protection Agency, Environmental Monitoring Systems Laboratory.
EPA. 1984b. "Interim Methods for the Measurement of Organic Priority Pollutants in Sludges". Cincinnati, OH: U.S. Environmental Protection Agency, Environmental Monitoring and Support Laboratory.
EPA. 1984c. "Development of Analytical Test Procedures for the Measurement of Organic Priority Pollutants in Sludge", EPA-600/4-84-001. Cincinnati, OH: Environmental Monitoring and Support Laboratory.
EPA. 1984d. "USEPA Manual of Methods of Virology", EPA-600/4-84-013. Cincinnati, OH: U.S. Environmental Protection Agency, Environmental Monitoring and Support Laboratory,
EPA. 1986a. "Proceedings: Workshop on Effects of Sewage Sludge Quality and Soil Properties on Plant Uptake of Sludge - Applied Trace Constituents". Las Vegas, NV: U.S. Environmental Protection Agency, Office of Research and Development.
EPA. 1986b. "Test Methods for Evaluating Solid Waste, SW-846". Washington, D.C. : U.S. Environmental Protection Agency, Office of Solid Waste and Emergency Response.
EPA. 1987. "Preparation Aid for HWERL's Category II Quality Assurance Project Plans". Cincinnati, OH: U.S. Environmental Protection Agency, Office of Research and Development.
6-2
EPA. 1988a. 'VAnalytical Methods for the National Sewage Sludge Survey". Washington, D.C.: U.S. Environmental Protection Agency, Office of Water Regulations and Standards.
EPA. 1988b. "Draft Guidance for Writing Case-by-Case Permit Requirements for Municipal Sewage Sludge". Washington, C.C.: U.S. Environmental Protection Agency, Office of Water Enforcement and Permits.
EPA. 1988c. "Strategy for Interim Implementation of Sludge Requirements in Permits". Washington, D.C.: U.S. Environmental Protection Agency, Office of Water Enforcement and Permits (fin&l due August 1989).
EPA. 1989. flControl of Pathogens in Municipal Wastewater Sludge for Land Application". (Draft May 1989, final due August 1989).
"Guidelines for Establishing Test Procedures for the Analysis cf Pollutants,11 40 CFR Part 136. Washington, D.C.: National Archives and Records Administration, Office of the Federal Register.
"Memorandum: Pathogen Equivalency Committee," U.S. Environmental Protection Agency, Office of Water, November 2, 1987.
Metcalf and Eddy, Inc. 1979. Wastewater Engineering. Treatment, Disposal, Reuse. New York: McGraw-Hill 3ook Company.
6-3
APPENDIX A
CHAIN OF CUSTODY RECORD
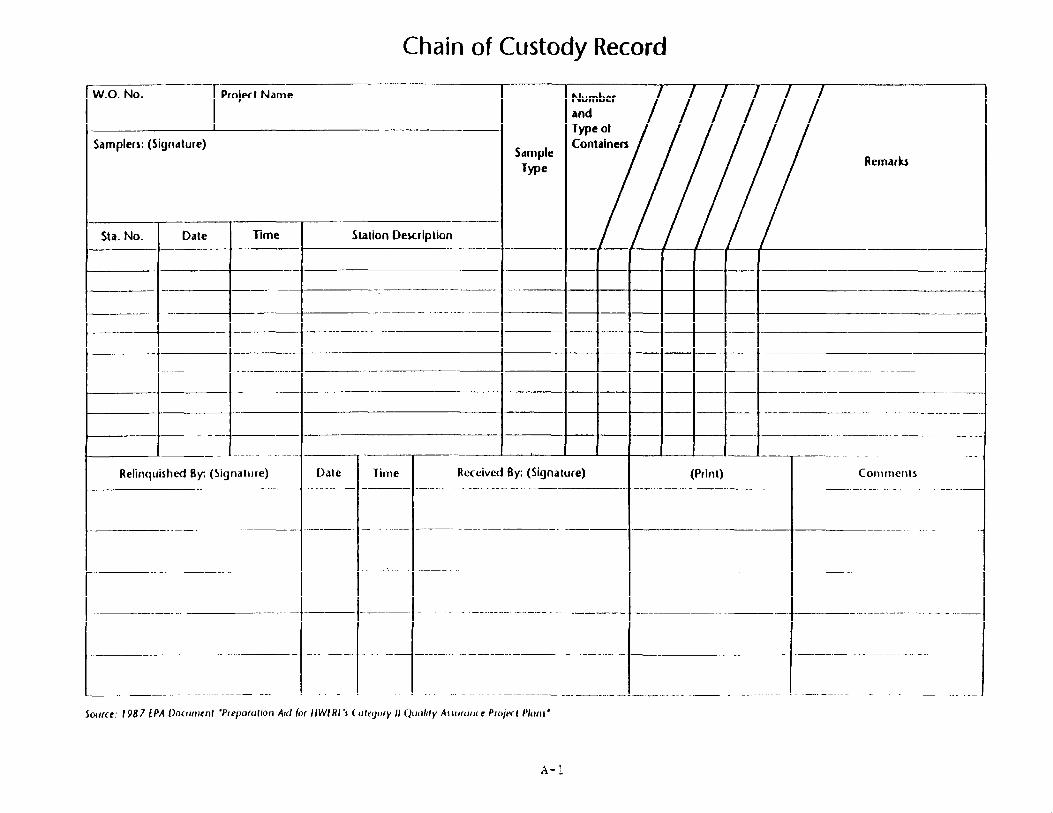
Chain of Custody Record
Source: 1987 EPA Document "Preparation Aid for HWERL's Category II Quality Assurance Project Plans"
A-1
APPENDIX B
DETERMINATION OF VOLATILE SOLIDS
DETERMINATION OF VOLATILE SOLIDS
REDUCTION IN DIGESTION1
By J.B. Farrell
INTRODUCTION
When sewage sludge is utilized on land, Federal regulations require that
it be treated by a “process to significantly reduce pathogens” (PSRP) or a
“process to further reduce pathogens” (PFRP). A requirement of both of these steps is a reduction in “vector attraction” of the sludge. If the PSRP or PFRP is anaerobic or aerobic digestion, the requirement for vector attraction reduction is achieved if volatile solids are reduced by 38 percent. As
Fischer’ has noted, the Federal regulation2 does not specify a method for
calculating volatile solids reduction. Fischer observed that the United Kingdom has a similar requirement for volatile solids reduction for digestion
(40 percent), but also failed to prescribe a method for calculating volatile
solids reduction. Fischer has provided a comprehensive discussion of the
ways that volatile solids reduction may be calculated and their limitations. He presents the following equations for determining volatile solids reduction:
1. Full mass balance equation
2. Approximate mass balance equation
3. “Constant ash” equation
4. Van Kleeck equation
The full mass balance equation is the least restricted but requires more
information than is currently collected at a wastewater treatment plant. The
approximate mass balance equation assumes steady state conditions. The
“cons tan t ash” equation requires the assumption of steady state conditions as
well as the assumption that ash input rate equals ash output rate. The Van
Kleeck equation, which is the equation generally suggested in publications
originating in the United States3 is equivalent to the “constant ash”
equation. Fischer calculates volatile solids reduction using a number of
l Source : “Control of Pathogens in Municipal Wastewater Sludge,” EPA, to be published August, 1989.
B-l
examples of considerable complexity and illustrates that the different methods
frequently yield different results. He closes with the recommendation,
obviously directed to rulemakers, that “if it is necessary to specify a
particular value for FVSR (fractional volatile solids reduction) then the
specification should indicate the method of calculation of FVSR.”
Fischer’s paper is extremely thorough and is highly recommended for
someone trying to develop a deep understanding of potential complexities in
calculating volatile solids reduction. However, it was not written as a
guidance document for field staff faced with the need to calculate volatile
solids reduction in their own plant. The nomenclature is precise but so
detailed that it makes comprehension difficult. In addition, two important
troublesome situations that complicate the calculation of volatile solids
reduction--grit deposition in digesters and decantate removal--are not
explicitly discussed. Consequently, this presentation has been prepared to
present guidance that describes the major pitfalls likely to be encountered in calculating volatile solids reduction and assists the practitioner of
digestion to the best route to take for his situation.
The recommendation of this presentation is not the same as Fischer's. He
suggests that the authorities should have provided a calculation method when
they required specific volatile solids reductions. From a review of Fischer’s results and this presentation, it will be clear that sometimes very simple calculations will give correct results and in other cases the simple methods will yield results seriously in error. Selecting one method and requiring that it be followed is excessively restrictive. The best solution is to require that the calculation be done correctly and then provide adequate
guidance. This- presentation attempts, belatedly, to provide that adequate
guidance.
It is important to note that the calculations of volatile solids
reduction will only be as accurate as the measurement of volatile solids
content in the sludge streams. The principal cause of error is poor sampling. Samples should be representative, covering the entire charging and withdrawal periods. Averages should cover extended periods of time during which changes
in process conditions are minimal. For some plants it is expected that
B-2
periodic checks of volatile solids reduction will produce results so erratic
that no confidence can be placed in them. In this case, adequacy of
stabilization can be verified by the method suggested in the text--
periodically batch digest the product for 40 days. If VS reduction is less
than 15X, the product is sufficiently stable.
The Equations for FVSR
The equations for fractional volatile solids reduction (FVSR) that will
be discussed below are the same as developed by FischerI, except for omission
of his “constant ash” equation. This equation gives identical results to the
Van Kleek equation so it is not shown. Fischer’s nomenclature has been
avoided or replaced with simpler terms. The material balance approaches are
called “methods” rather than “equations. I’ The material balances are drawn to
fit the circumstances. There is no need to formalize the method with a rigid
set of equations.
In the derivations and calculations that follow, both VS (total volatile
solids content of :he sludge or decantate on dry solids basis) and FVSR are
expressed throughout as fractions to avoid the frequent confusion that occurs
when these terms are expressed as percentages. “Decan ta te” is used in place
of the more commonly used “supernatant” to avoid the use of “s” in subscripts.
Similarly, “bottoms” is used in place of “sludge” CO avoid use or’ “s” in
subscripts.
The “full mass balance” method
The “full mass balance” method must be used when steady conditions do not
prevail over the time period chosen for the calculation. The chosen time
period must be substantial, at least twice the nominal residence time in the
digester (nominal residence time = average volume of sludge in the digester +
average volumetric flow rate. Note: when there is supernatant withdrawal,
volume of sludge withdrawn should be used to calculate average volumetric flow
rate). The reason for the long time period is to reduce the influence of
short-term fluctuations in feed or product flow rates or compositions. If
input compositions have been relatively constant for a long period of time,
then the time period can be shortened.
B-3
An example where the full mass balance method would be needed is an
aerobic digester operated as follows:
1. Started with the digester l/4 full (Time zero).
2. Raw sludge is fed to the digester daily until digester is full.
3. Supernatant is periodically decanted and raw sludge is charged into the digester until not enough settling occurs to accommodate daily feeding. (Hopefully this will not occur until enough days have passed for adequate digestion.)
4. Draw down the digester to about l/4 full (final time), discharging the sludge to sand beds.
The full mass balance is written as follows:
Sum of total volatile solids inputs in feed streams
during the entire digestion period = sum of volatile
solids outputs in withdrawals of decantate and bottoms A
loss of volatile solids + accumulation of volatile
solids in the digester. (1)
Loss of volatile solids is calculated from Equation 1. FVSR- is calculated by
Equation 2:
FVSR = loss in volatile solids sum of volatile solias inputs (2)
The accumulation of volatiie solids in the digester is the final volume
in the digester after the drawdowns times finai volatile solids.concentration
less the initial volume at time zero times the initial volatile solids
concentration.
To properly determine FVSR by the full mass balance method requires
determination of all feed and withdrawal volumes, initial and final volumes in
the digester and determination of volatile solids concentrations on all
streams. In some cases, which will be discussed later, simplifications are
possible.
B-L,
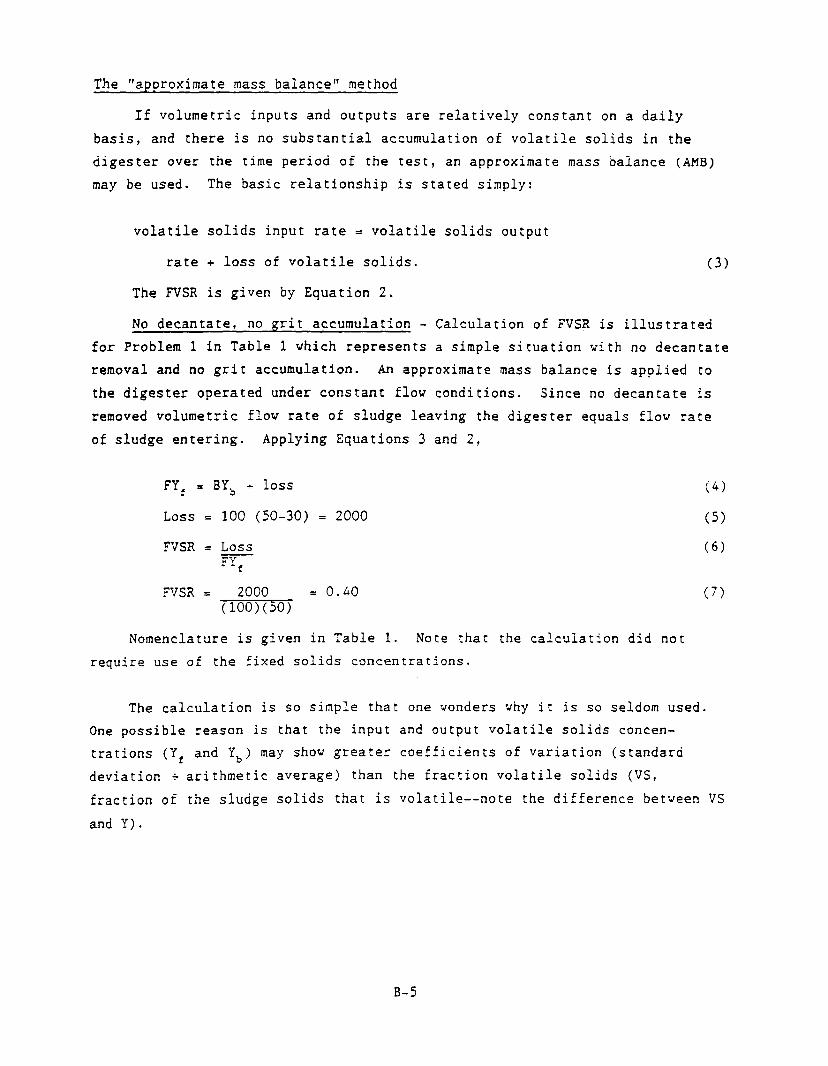
The “approximate mass balance” me thod
If volumetric inputs and outputs are relatively constant on a daily
basis, and there is no substantial accumulation of volatile solids in the
digester over the time period of the test, an approximate mass balance (AMB)
may be used. The basic relationship is stated simply:
volatile solids input rate = volatile solids output
rate + loss of volatile solids. (3)
The FVSR is given by Equation 2.
No decantate, no grit accumulation - Calculation of FVSR is illustrated
for Problem 1 in Table 1 which represents a simple situation with no decantate
removal and no grit accumulation. An approximate mass balance is applied to
the digester operated under constant flow conditions. Since no decantate is
removed volumetric flow rate of sludge leaving the digester equals flow rate
of sludge entering. Applying Equations 3 and 2,
FY, = BY, + loss (4)
Loss r 100 (50-30) = 2000 (5)
FVSR = Loss (6)
FYf
FVSR = 2000 = 0.40 (7) (100)(50)
Nomenclature is given in Table 1. Note that the calculation did not
require use of the fixed solids concentrations.
The calculation is so simple that one venders vhy it is so seldom used.
One possible reason is that the input and output volatile solids concen-
trations (YF and Y, ) may show greater coefficients of variation (standard
deviation + arithmetic average) than the fraction volatile solids (VS,
fraction of the sludge solids that is volatile-- note the difference between VS
and Y).
s-5
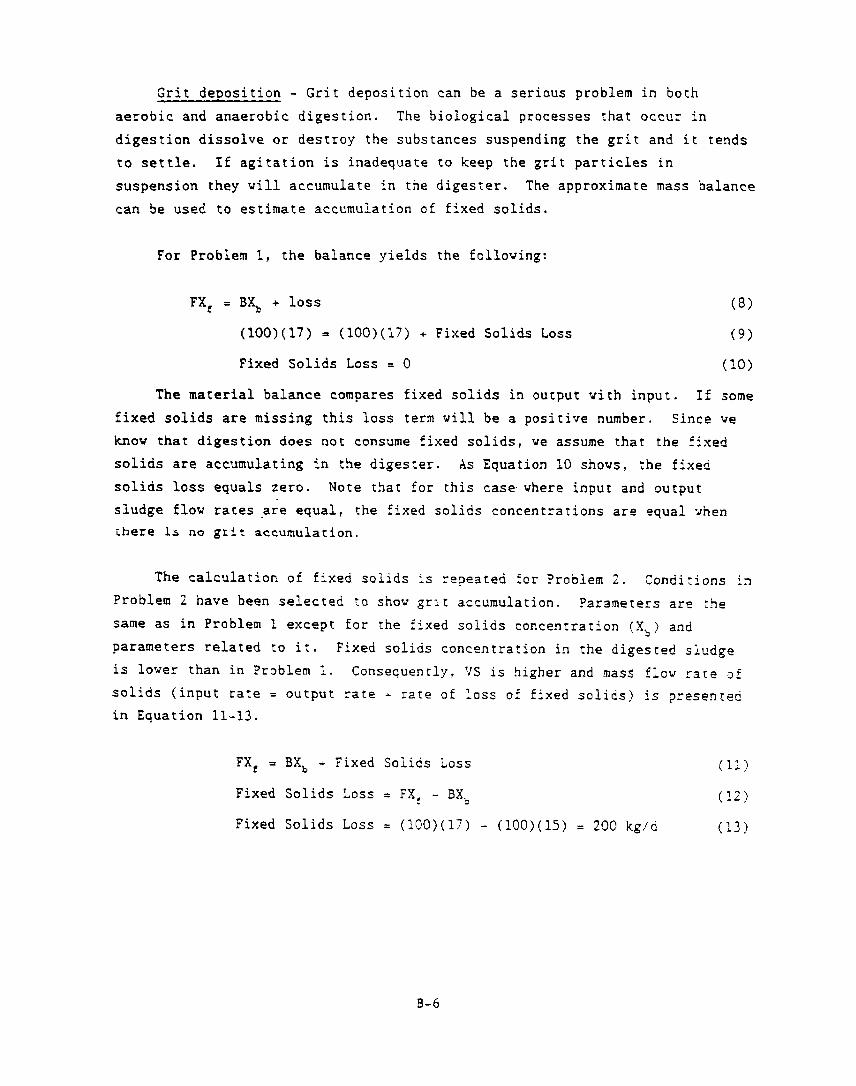
Grit deposition - Grit deposition can be a serious problem in both
aerobic and anaerobic digestion. The biological processes that occur in
digestion dissolve or destroy the substances suspending the grit and it tends
to settle. If agitation is inadequate to keep the grit particles in
suspension they vi11 accumulate in the digester. The approximate mass balance
can be used to estimate accumulation of fixed solids.
For Problem 1, the balance yields the folloving:
FX, = BX, + loss (8)
(100)(17) = (100)(17) + Fixed Solids Loss (9)
Fixed Solids Loss = 0 (10)
The material balance compares fixed solids in output vith input. If some
fixed solids are missing this loss term vi11 be a positive number. S ince ve
know that digestion does not consume fixed solids, ve assume that the fixed
solids are accumulating in the digester. As Equation 10 shows, the f ixed
solids loss equals zero. Note that for this case, vhere input and output
sludge flow races -are equal, the fixed solids concentrations are equal ken
rhere is no grit accumulation.
The calculation of fixed solids is repeated for Problem 2. Conditions in
Problem 2 have been selected to show grit accumulation. ?arameters are :he
same as in Problem 1 except for the fixed solids concentration (X,) and
parameters related to it. Fixed solids concentration in the digested sludge
is lover than in ?roblem 1. Consequently, VS is higher and mass flow race of
solids (input rate = output rate A rate of loss of fixed solids) is presented
in Equation 11-13.
Fxf = BX, + Fixed Solids Loss (11)
Fixed Solids Loss = FX, - BX, (121
Fixed Solids Loss = (lCO)(l?) - (lOO)(lS) = 200 kg/d (13)
B-6
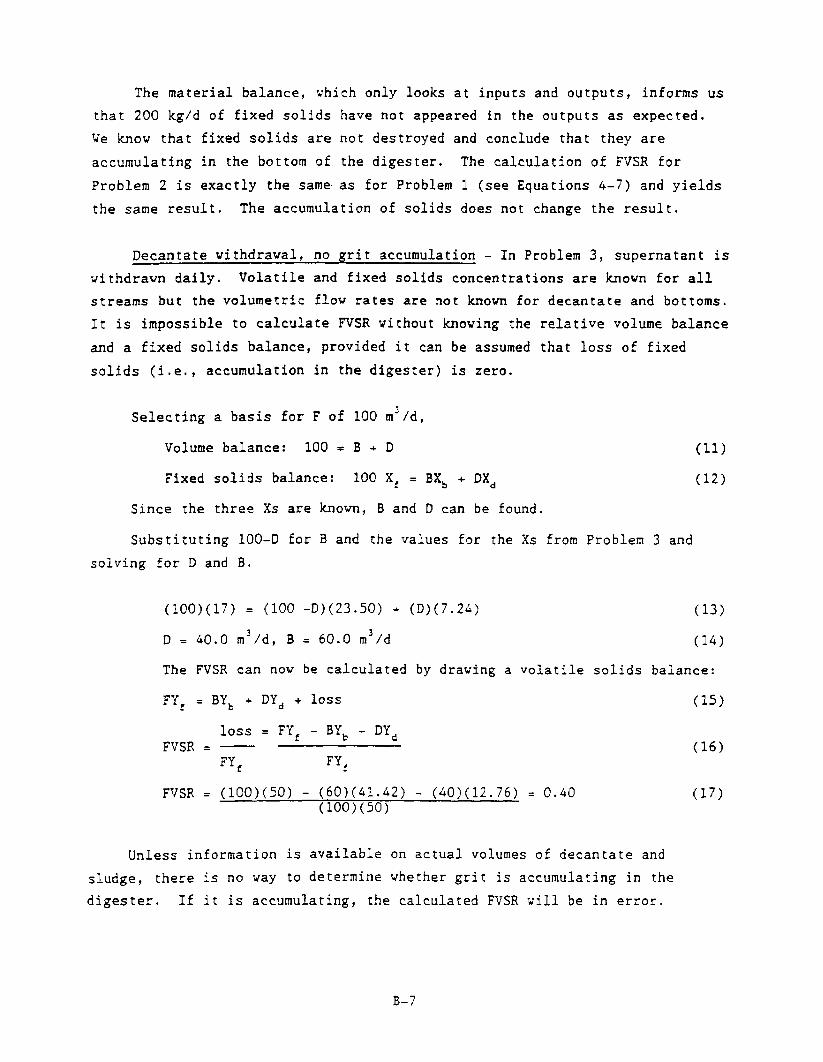
The material balance, which only looks at inputs and outputs, informs us
that 200 kg/d of fixed solids have not appeared in the outputs as expected.
We know that fixed solids are not destroyed and conclude that they are
accumulating in the bottom of the digester. The calculation of FVSR for
Problem 2 is exactly the same as for Problem 1 (see Equations 4-7) and yields
the same result. The accumulation of solids does not change the result.
Decantate vi thdrawal, no grit accumulation - In Problem 3, supernatant is
withdrawn daily. Volatile and fixed solids concentrations are known for all
streams but the volumetric flow rates are not known for decantate and bottoms.
It is impossible to calctllate FVSR vithout knowing the relative volume balance
and a fixed solids balance, provided it can be assumed that loss of fixed
solids (i.e., accumulation in the digester) is zero.
Selecting a basis for F of 100 m’/d,
Volume balance: 100 = B + D
Fixed solids balance : 100 Xt = BX, + DX,
Since the three Xs are known, B and D can be found.
(II)
(12)
Substituting 100-D for B and the values for the Xs from Problem 3 and
soiving for D and B.
(100)(17) = (100 -D)(23.50) + (D)(7.24) (13)
D = 40.0 m3/d, B = 60.0 m3/d (14)
The FVSR can now be calculated by drawing a volatile solids balance:
F-f, = BY, + DY, + loss (15)
loss = FY, - BY, - DY, FVSR = - (16)
FY, F-f:
FVSR = (100)(50) - (60)(41.42) - (40)(12.76) = 0.40 (17) (100)(50)
Unless information is available on actual volumes of decantate and
sludge, there Is no way to determine whether grit is accumulating in the
digester. If it is accumulating, the calculated FVSR will be in error.
B-7
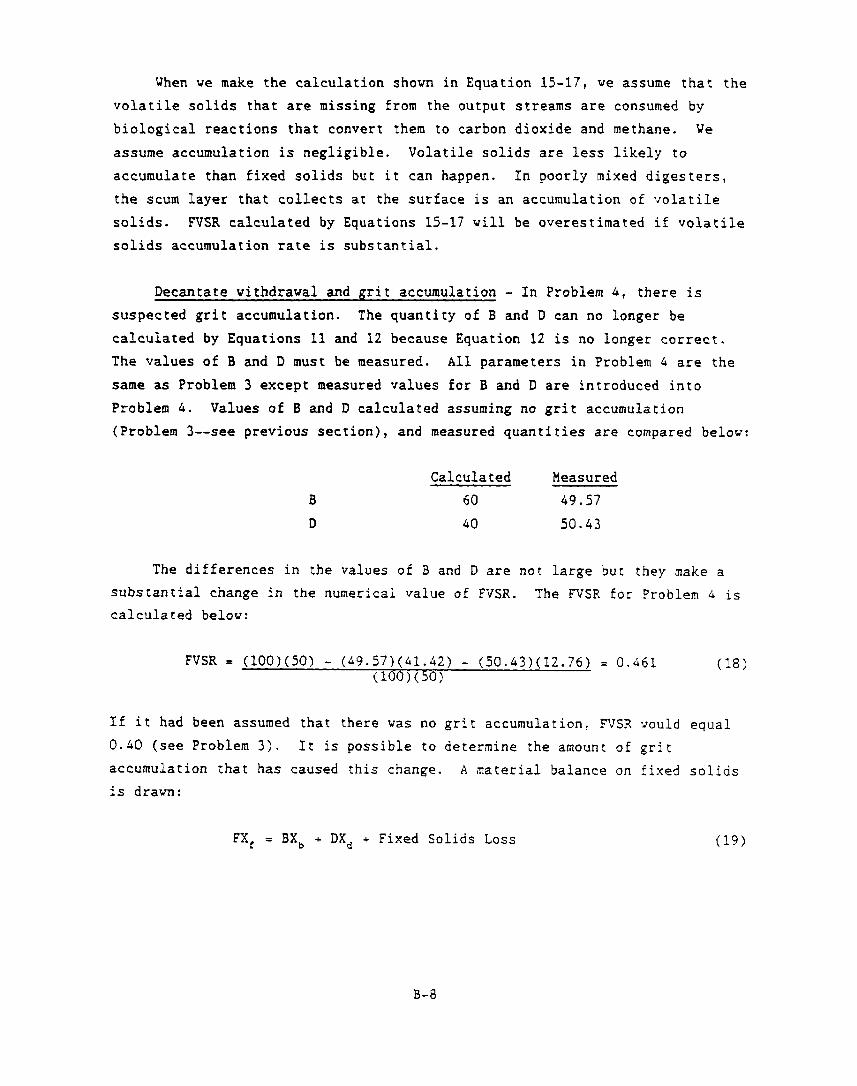
When we make the calculation shown in Equation 15-17, we assume that the
volatile solids that are missing from the output streams are consumed by
biological reactions that convert them to carbon dioxide and methane. We
assume accumulation is negligible. Volatile solids are less likely to
accumulate than fixed solids but it can happen. In poorly mixed digesters,
the scum layer that collects at the surface is an accumulation of volatile
solids. FVSR calculated by Equations 15-17 will be overestimated if volatile
solids accumulation rate is substantial.
Decantate withdrawal and grit accumulation - In Problem 4, there is
suspected grit accumulation. The quantity of B and D can no longer be
calculated by Equations 11 and 12 because Equation 12 is no longer correct.
The values of B and D must be measured. All parameters in Problem 4 are the
same as Problem 3 except measured values for B and D are introduced into
Problem 4. Values of B and D calculated assuming no grit accumulation
(Problem 3--see previous section) , and measured quantities are compared below:
B
D
Calculated Measured
60 49.57
40 50.43
The differences in the values of B and D are not large but they nake a
substantial change in the numerical value of FVSR. The FVSR for Problem 4 is
calculated below:
FVSR = (100) (50) - (49.57)(41.42) - (50.43)(12.76) = 0.461 (100)(50)
(18)
If it had been assumed that there was no grit accumulation, FVSR ,Jould equal
0.40 (see Problem 3). It is possible to determine the amount of grit
accumulation that has caused this change. A material balance on fixed solids
is drawn:
Fx, = BX, + DX, + Fixed Solids Loss (19)
B-8
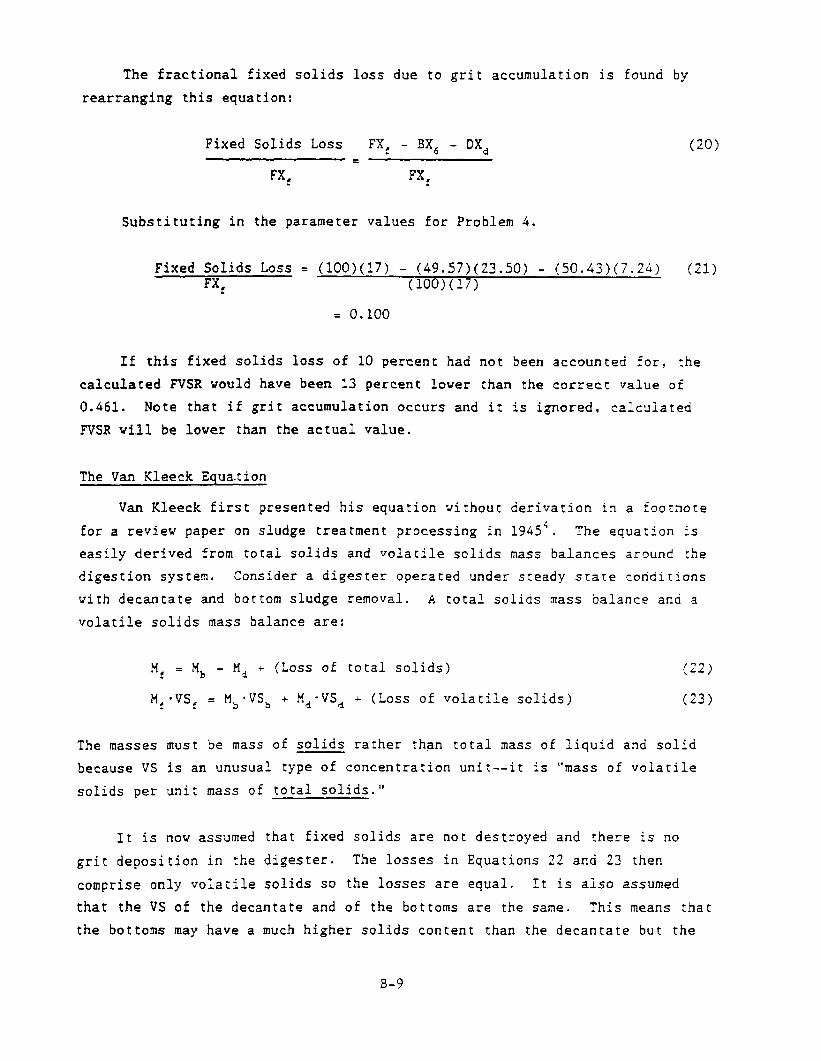
The fractional fixed solids loss due to grit accumulation is found by
rearranging this equation:
Fixed Solids Loss FX, - BX, - DX, (20)
FX, = FXf
Substituting in the parameter values for Problem 4.
Fixed Solids Loss = (100)(17) - (49.57)(23.50) - (50.43)(7.24) (21) FXf (lOO>(li)
= 0.100
If this fixed solids loss of 10 percent had not Seen accounted for, :he
calculated NSR uould have been 13 percent lover than the correct value of
0.461. Mote that if grit accumulation occurs and it is ignored, calculated
NSR vi11 be lower than the actual value.
The Van Kleeck Equa.tion
Van Kleeck first presented his equation vithout derivation in a footnote
for a review paper on sludge treatment processing in 1945’. The equation Is
easily derived from :otal solids and volatile solids mass balances around [Se
digestion sys tern. Consider a digester operated under steady srate conditions
with decantate and bottom sludge removal. A total solids mass balance and a
volatile solids mass balance are:
M, = M, r M, + (Loss of total solids) (22)
M;VS, = M;VS, + M;VS, i (Loss of volatile solids) (23)
The masses must be mass of solids rather than total mass of liquid and solid
because VS is an unusual type of concentration unit--it is “mass of volatile
solids per unit mass of total solids.”
It is now assumed that fixed solids are not destroyed and there is no
grit deposition in the digester. The losses in Equations 22 and 23 then
comprise only volatile solids so the losses are equal. It is also assumed
that the VS of the decantate and of the bottoms are the same. This means that
the bottoms may have a much higher solids content than the decantate but the
B-9
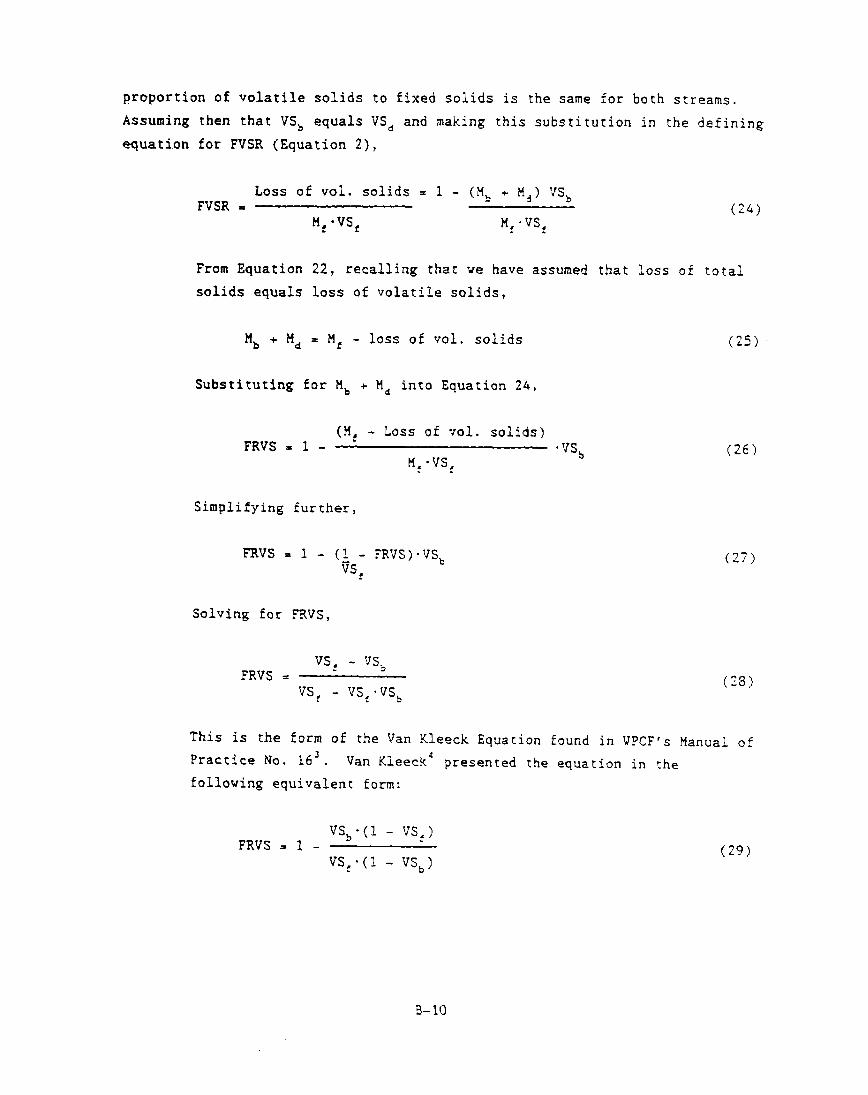
proportion of volatile solids to fixed solids is the same for both streams.
Assuming then that VS, equals VS, and making this substitution in the defining
equation for FVSR (Equation 2),
FVSR = Loss of vol. solids = 1 - (Ms + Hd) VS,
(241 H, l vs, M, a ‘Js,
From Equation
solids equals
% + %
22, recalling that ve have assumed that loss of total
loss of volatile solids,
= Me - loss of vol. solids (25)
Substituting for H, + nd into Equation 24,
Wf - Loss of vol. solids) FRVS = 1 -
n: -vs, * vs,
Simplifying further,
(26)
FRVS = 1 - (1 - WE+‘JS, TS,
(27)
Solving for FRVS,
(23) FRVS = vs, - ‘JSj
VS, - vsc *vs, -
This is the form of the Van Kleeck Equation found in UPCF’s Manual of
Practice No. 163. Van Kleeck4 presented the equation in the following equivalent form:
FRVS = 1 - VS;(l - VS,)
vs, ‘(I - VS,) (29)
B-10
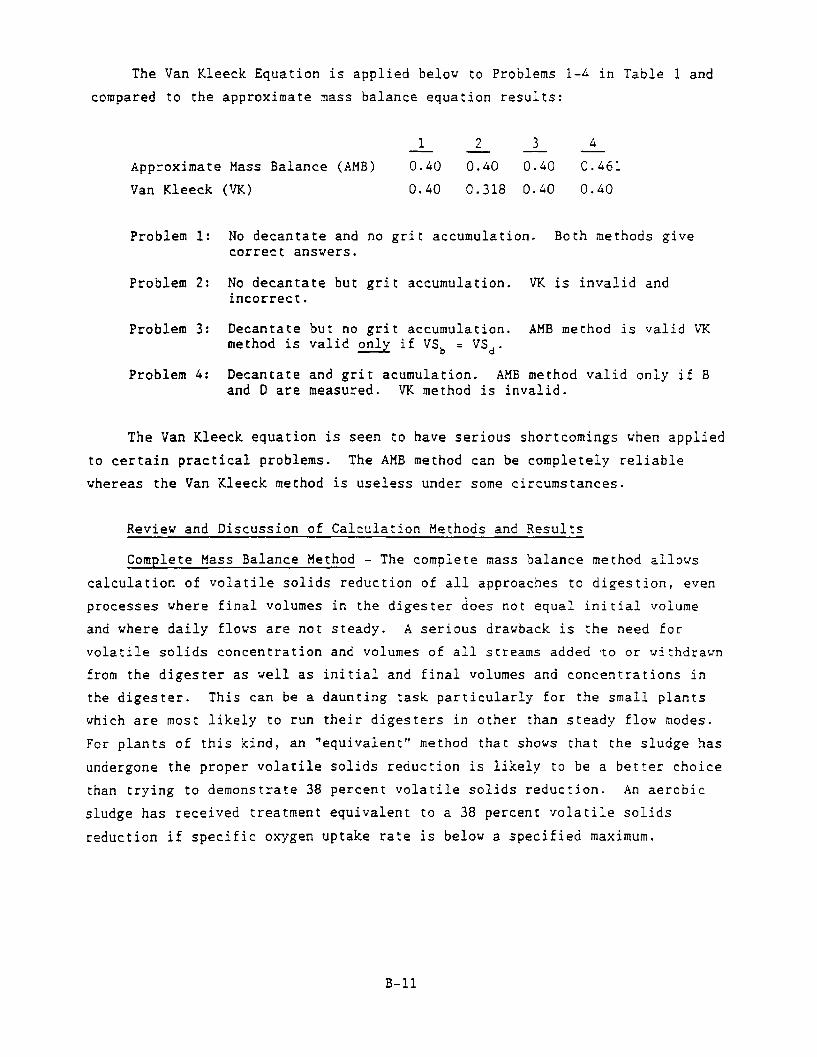
The Van Kleeck Equation is applied below to Problems 1-4 in Table 1 and
compared to the approximate mass balance equation results:
1 2 3 4
Approximate Mass Balance (AMB) 0.40 0.40 0.40 O.L6L
Van Kleeck (VK) 0.40 0.318 0.40 0.40
Problem 1: No decantate and no grit accumulation. Both methods give correct answers.
Problem 2: No decantate but grit accumulation. VK is invalid and incorrect.
Problem 3: Decantate but no grit accumulation. AMB method is valid VK method is valid only if VS, = VS,.
Problem 4: Decantate and grit acumulation. AHB method valid only if B and D are measured. VK method is invalid.
The Van Kleeck equation is seen to have serious shortcomings when applied
to certain practical problems. The AHB method can be completely reliable
whereas the Van Kleeck method is useless under some circumstances.
Review and Discussion of Calculation Methods and Results
Complete Mass Balance Method - The compiete mass balance method allows
calculation of volatile solids reduction of all approaches to digestion, even
processes where final volumes in the digester ioes not equal initial volume
and where daily flows are not steady. A serious drawback is the need for
volatile solids concentration and volumes of all streams added to or withdrawn
from the digester as vell as initial and final volumes and concentrations in
the digester . This can be a daunting task particularly for the small plants
which are most likely to run their digesters in other than steady flow modes.
For plants of this kind, an “equivalent” method that shows that the sludge has
undergone the proper volatile solids reduction is likely to be a better choice
than trying to demonstrate 38 percent volatile solids reduction. An aerobic
sludge has received treatment equivalent to a 38 percent volatile solids
reduction if specific oxygen uptake rate is below a specified maximum.
B-11
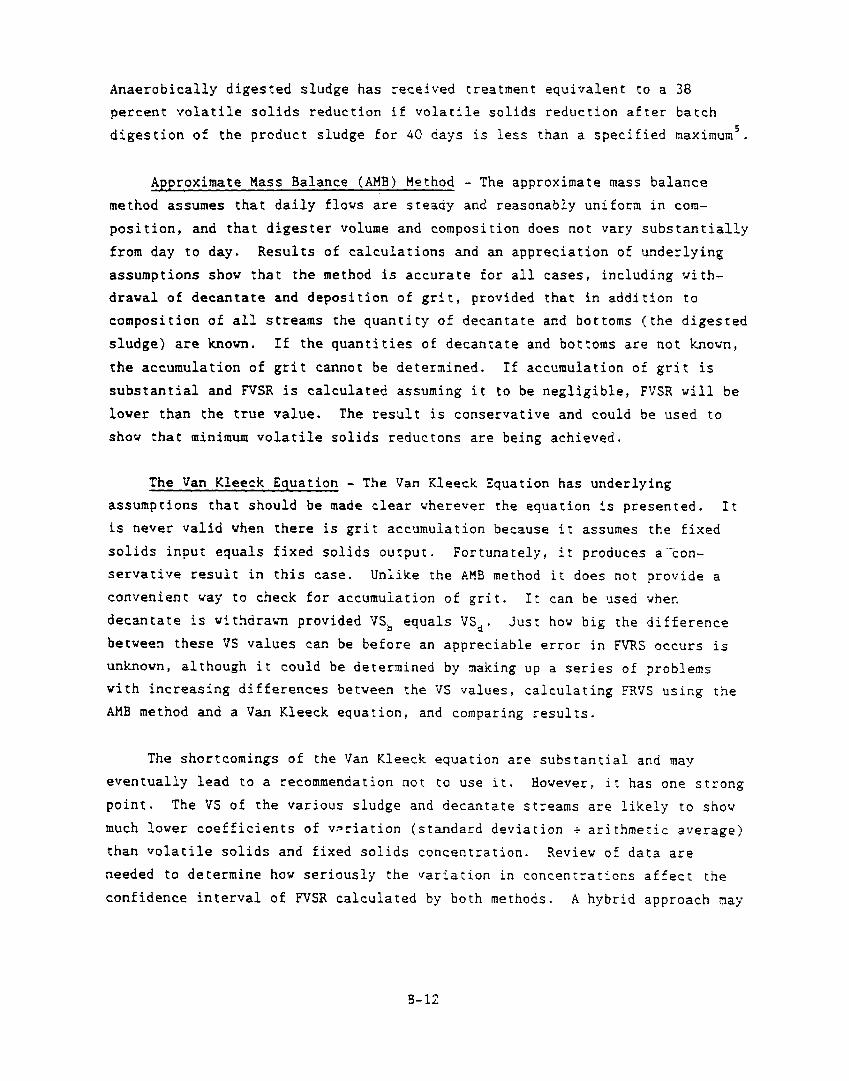
Anaerobically digested sludge has received treatment equivalent to a 38
percent volatile solids reduction if volatile solids reduction after batch
digestion of the product sludge for 40 days is less than a specified maximum5.
Approximate Mass Balance (AMB) Method - The approximate mass balance
method assumes that daily flows are steady and reasonably uniform in com-
position, and that digester volume and composition does not vary substantially
from day to day. Results of calculations and an appreciation of underlying
assumptions show that the method is accurate for all cases, including vith-
drawal of decantate and deposition of grit, provided that in addition to
composition of all streams the quantity of decantate and bottoms (the digested
sludge) are known. If the quantities of decantate and bottoms are not known,
the accumulation of grit cannot be determined. If accumulation of grit is
substantial and FVSR is calculated assuming it to be negligible, FVSR will be
lower than the true value. The result is conservative and could be used to
show that minimum volatile solids reductons are being achieved.
The Van Kleeck Equation - The Van Kleeck Equation has underlying
assumptions that should be made clear wherever the equation is presented. It
is never valid when there is grit accumulation because it assumes the fixed
solids input equals fixed solids output. Fortunately, it produces a-con-
servative result in this case. Unlike the AHB method it does not provide a
convenient way to check for accumulation of grit. It can be used vhen
decantate is withdrawn provided VS, equals VS,. Just how big the difference
between these VS values can be before an appreciable error in FVRS occurs is
unknown, although it could be determined by making up a series of problems
with increasing differences between the VS values, calculating FRVS using the
AMB method and a Van Kleeck equation, and comparing results.
The shortcomings of the Van Kleeck equation are substantial and may
eventually lead to a recommendation not to use it. However, it has one strong
point. The VS of the various sludge and decantate streams are likely to show
much lower coefficients of v.*riation (standard deviation + arithmetic average)
than volatile solids and fixed solids concentration. Review of data are
needed to determine how seriously the variation in concentrations affect the
confidence interval of FVSR calculated by both methods. A hybrid approach may
B-12

turn out to be advantageous. The AMB method could be used first to determine
if grit accumulation is occurring. If grit is not accumulating, the Van
Kleeck equation could be used. If decantate is withdrawn, the Van Kleeck
equation still cannot be used unless VS, is nearly equal to VS,.
Average Values - The concentrations and VS values used in the equations
will all be averages. For the material balance methods, the averages should
be weighted averages according to the mass of solids in the stream in
question. The example below shows how to average the volatile solids con-
centration for four consecutive sludge additions.
Volatile Solids Addition Volume Concentration
1 10 m3 50 kg/m3
2 7 m3 45 kg/m3
3 15 m3 40 kg/m3
4 12 m3 52 kg/m3
Y av = 10 X 50 + 7 X 45 + 15 X 40 + 12 X 52 = 46.3 kg/m3 :3cJ 10 + 7 + 15 + 12
For the Van Kleeck equation, :he averages of VS are required. PrOperl!i
:hey should be weighted averages based on the weight of the foiids in each
component of the average although an averag e veighted by the volume of tihe
component or an arithmetic average may be sufficfently accurate if variation
in VS is small. The following example demonstrates the calculation of ail
three averages,
Addition
1
2
3
4
Volume
12 m’
8 m3
13 m3
10 m3
Total Solids Concentration
72 kg/m’
50 kg/m’
60 kg/m!
55 kg/m3
vs -
0.75
0.82
0.80
0.77
B-13
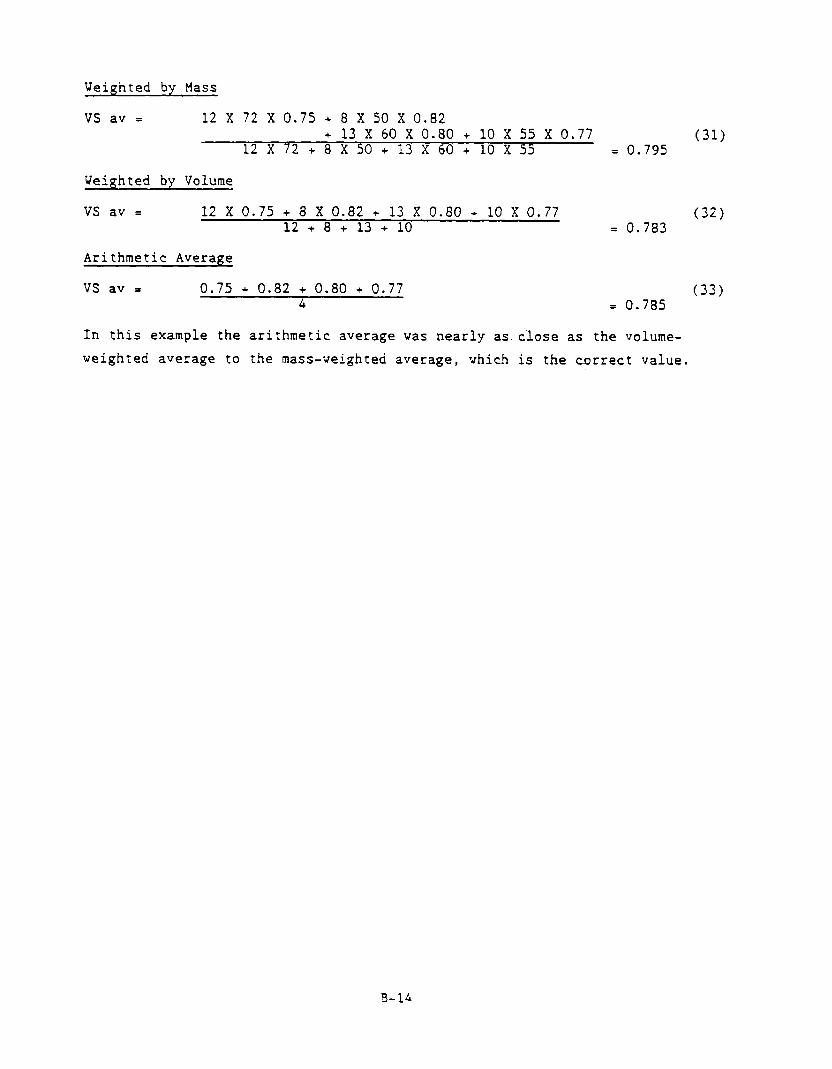
Weighted by Mass
VS av = 12 X 72 X 0.75 + 8 X SO X 0.82 + 13 X 60 X 0.80 + 10 X 55 X 0.77
12 X 72 + 8 X 50 + 13 X 60 + 10 X 5~ = 0.795
Veighted by Volume
VS av = 12 X 0.75 + 8 X 0.82 + 13 X 0.80 + 10 X 0.77 12 + 8 + 13 + 10 = 0.783
Arithmetic Average
VS av = 0.75 + 0.82 + 0.80 + 0.77 4 = 0.785
In this example the arithmetic average vas nearly as close as the volume-
weighted average to the mass-weighted average, vhich is the correct value.
(311
(32)
(33)
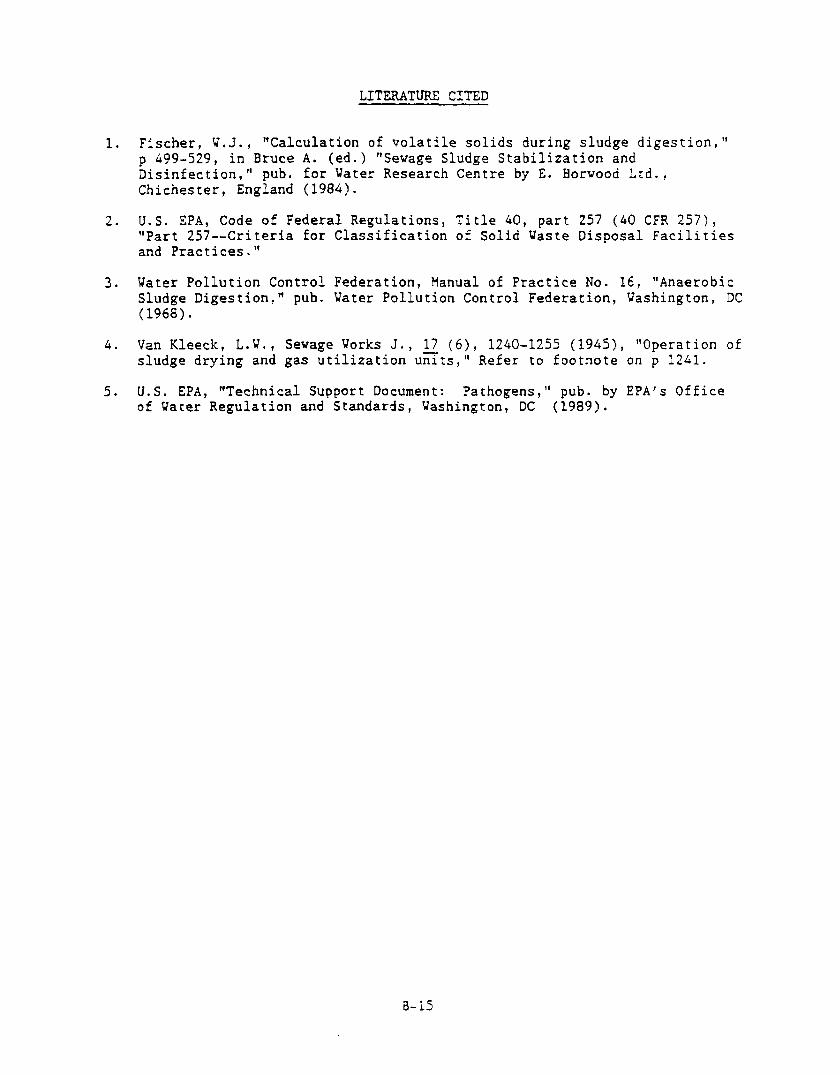
LITERATURE CITED
1. Fischer, W.J., “Calculation of volatile solids during sludge digestion,” p 499-529, in Bruce A. (ed.) “Sewage Sludge Stabilization and Disinfection,” pub. for Water Research Centre by E. Borwood Ltd., Chichester, England (1984).
2. U.S. EPA, Code of Federal Regulations, Title 40, part 257 (40 CFR 2571, “Part 257--Criteria for Classification of Solid Uaste Disposal Facilities and Practices. ”
3. Water Pollution Control Federation, Manual of Practice No. 16, “Anaerobic Sludge Digestion,” pub. Vater Pollution Control Federation, Uashington, DC (1968).
4. Van Kleeck, L.W., Sewage Uorks J., 17 (6), 1240-1255 (1945), “Operation of sludge drying and gas utilization units,” Refer to footnote on p 1241.
5. U.S. EPA, “Technical Support Document: Pathogens,” pub. by EPA’s Office of Water Regulation and Standards, Washington, DC (1989).
a- 15
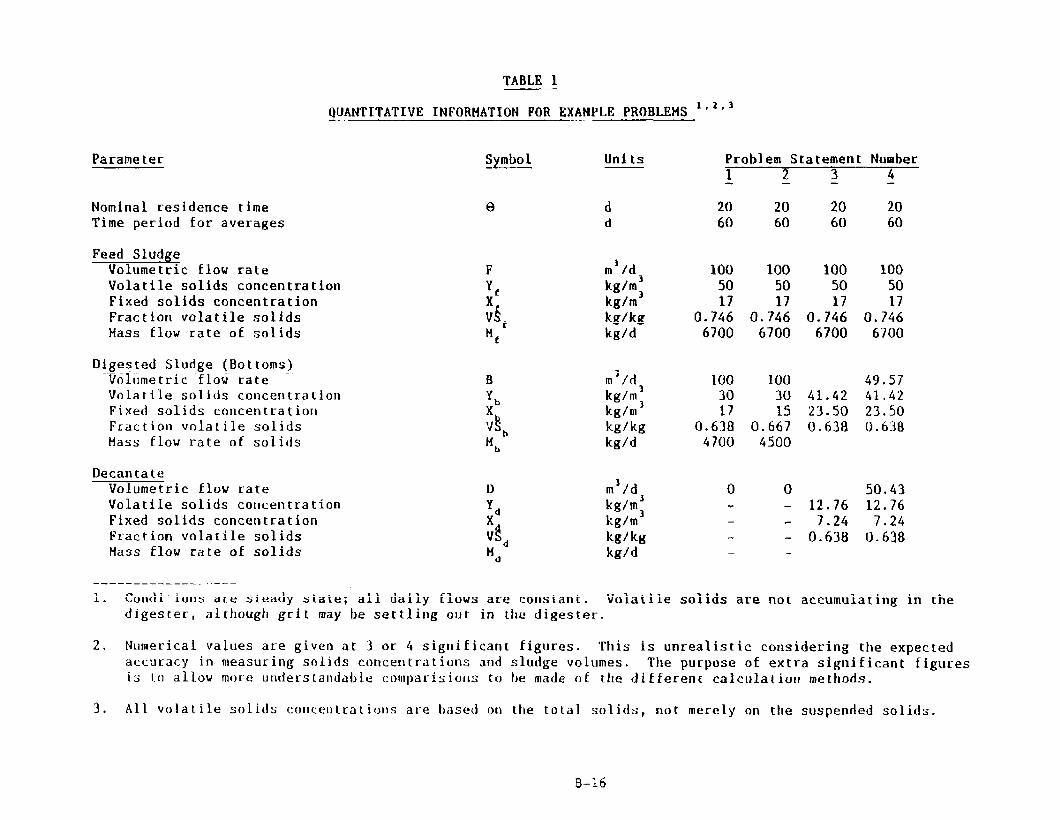
TABLE 1
QUANTITATIVE INFORHATXON FOR EXAHPLE PROBLEM ““’ --. r
Parameter Symbol -- Units Problem Statement Number 1 2 3 4
Nominal residence time 9 d 20 20 20 20 Time period for averages d 60 60 60 60
Feed Sludge Volumetric Elow rate Volatile solids concentration Fixed solids concentration Fraction volatile solids Hass flow rate of solids
Digested Sludge (Bottoms) Volumetric flow rate Vnlatile solids concentration Fixed solids concentration Fraction volatile solids Hass flow rate of solids
ml/d 100 100 100 100 kg/m’ 50 so 50 50 kg/m’ 17 17 17 17 kg/kg 0.746 0.746 0.746 0.746 kg/d 6700 6700 6700 6700
m’/d 100 100 kg/m’
43.57 30 30 41.42 41.42
kg/m’ 17 15 23.50 23.50 kg/kg 0.638 0.667 0.638 0.638 kg/d 4700 4500
Decan tate Volumetric flow rate D m’/d 0 0 50.43 Volatile solids concentration Fixed solids concentration Fraction volatile solids Hass flow rate of solids
kg/m’ kg/m’
- 12.76 12.76 - 7.24 7.24
kg/kg - 0.638 0.638 kg/d -
-------------_ .---- 1. Co&i’ ions are steady state; all daily Elows arc constant. Volatile solids are not accumulating in the
digester, altllougtl grit may be settling out in tflc digester.
2. Numerical values are given at 3 or 4 significant figures. This is unrealistic considering the expected accuracy in measuring solids concentrations and sludge volumes. The purpose of extra significant figures is !.(I allou more ullrlersrantfable cnmparisiorr:; to he made OE ttle different calculation methods.
3. All volatile solids concentrat ions are t)ascd on the total solids, not merely on the suspended solid;-.
B-16