potentially polluting shipwrecks · the schooner exchange v. mcfaddon, 1812). since 1812, sovereign...
TRANSCRIPT

Barrett 1
Masters project submitted in partial fulfillment of the Master of Environmental Management degree Nicholas School of the Environment, Duke University 2011 [email protected] / [email protected]
Potentially Polluting Shipwrecks
Spatial tools and analysis of WWII shipwrecks
Michael J. Barrett
Dr. Patrick N. Halpin, Advisor

Barrett 2
Abstract The sinking of thousands of ships during the Pacific Theater of World War II has blanketed the South
Pacific region. These potentially polluting wrecks present a major environmental danger to the region in
the form of oil spills and unexploded ordnance. As a major center of biological diversity, including World
Heritage sites, the continued deterioration of these wrecks could destroy the rich marine life in these
areas.
This study provides geospatial analysis of these wrecks, based on data from the United States and
Imperial Japanese Navy. Wrecks have been mapped within ESRI GIS software and a variety of spatial and
data analyses have been performed to address questions of environmental and geopolitical concern. A
risk index has been developed to prioritize the most dangerous vessels. This index accounts for both
characteristics of the ship, as well as the surrounding environment. Further, spatial tools have been
designed to offer resource managers a basic method to predict sensitive ecosystems at risk from a
wreck-based oil spill. For the first time, wreck data will be available for conservation groups and
researchers to conduct their own risk planning.

Barrett 3
Faculty Dr. Patrick N. Halpin, Gabel Associate Professor of the Practice of Marine Geospatial Ecology and
Director of the Geospatial Analysis Program at the Nicholas School of the Environment.
Dr. Christopher M. Reddy, Senior Scientist, Marine Chemistry and Geochemistry and Director of the
Coastal Ocean Institute at Woods Hole Oceanographic Institution.
Appreciation Special thanks and appreciation go to those who have significantly helped this project.
Dr. Pat Halpin and the Marine Geospatial Ecology Lab at Duke University
Dr. Chris Reddy and the Marine Geochemistry Lab at Woods Hole Oceanographic Institution
Dr. Ian MacLeod of the Western Australian Museum
Mr. Ole Varmer, Attorney-Advisor, Office of General Counsel for International Law, NOAA
Jaime Budzynkiewicz and Heather Heenehan for Woods Hole brainstorming sessions
The staff of the National Geographic Society
And of course, to my wife Sarah and our dog Alice, for their limitless patience.
Barrett 4
Introduction Right now, nearly 4,000 WWII shipwrecks are threatening the center of marine biodiversity with oil
spills. The lasting legacy of WWII in the Pacific is found in millions of gallons of oil and unexploded
ordnance onboard these vessels. While many ships lost their fuel reserves during battle, a considerable
(but ultimately unknown) number still contain fuel on-board.
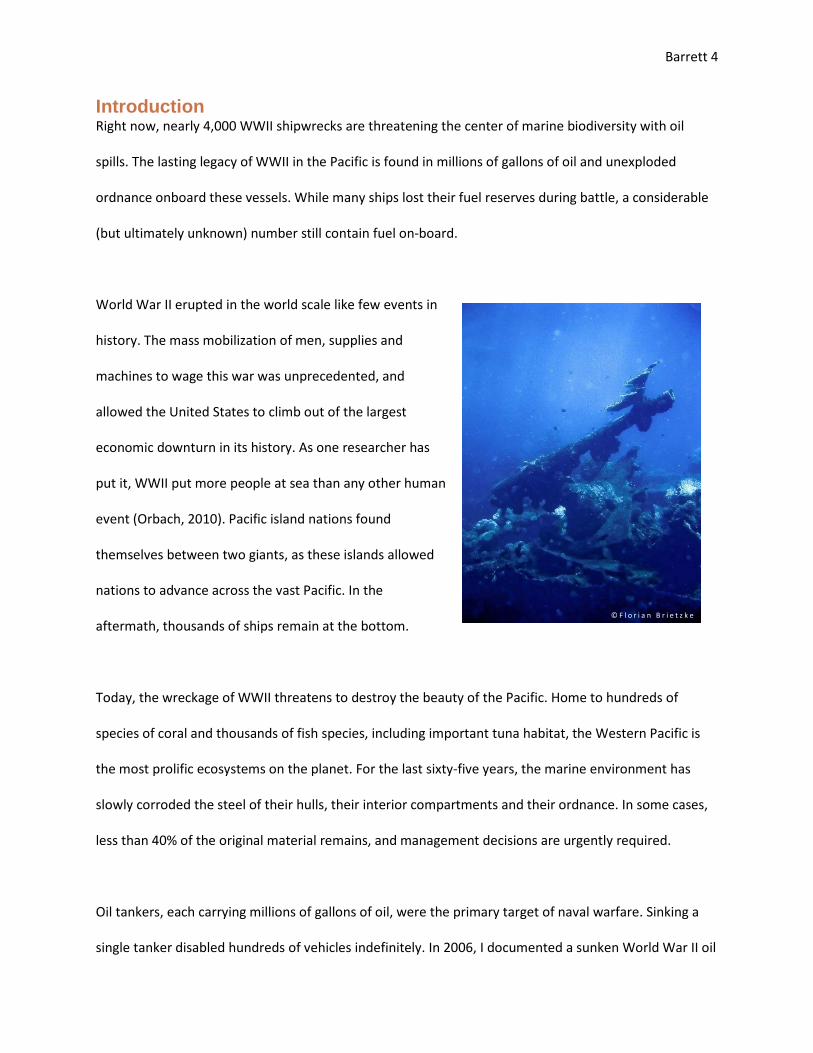
World War II erupted in the world scale like few events in
history. The mass mobilization of men, supplies and
machines to wage this war was unprecedented, and
allowed the United States to climb out of the largest
economic downturn in its history. As one researcher has
put it, WWII put more people at sea than any other human
event (Orbach, 2010). Pacific island nations found
themselves between two giants, as these islands allowed
nations to advance across the vast Pacific. In the
aftermath, thousands of ships remain at the bottom.
Today, the wreckage of WWII threatens to destroy the beauty of the Pacific. Home to hundreds of
species of coral and thousands of fish species, including important tuna habitat, the Western Pacific is
the most prolific ecosystems on the planet. For the last sixty-five years, the marine environment has
slowly corroded the steel of their hulls, their interior compartments and their ordnance. In some cases,
less than 40% of the original material remains, and management decisions are urgently required.
Oil tankers, each carrying millions of gallons of oil, were the primary target of naval warfare. Sinking a
single tanker disabled hundreds of vehicles indefinitely. In 2006, I documented a sunken World War II oil
© F l o r i a n B r i e t z k e

Barrett 5
tanker leaking fuel into a coral rich lagoon. The damage from this spill—and many more like it—is
unknown. The implications of this single ship’s leaking are dramatic, but to scale, this is only one of 250
tankers lost in the region. The wrecks of WWII are already releasing fuel into the environment, with no
research teams studying the impact. The goal of this project is to provide relevant and objective data to
address this problem. By mapping and prioritizing thousands of potentially polluting wrecks in the
region, governments may use their resources most effectively and may avert an environmental disaster.
Shipwreck Data In order to understand this threat to the environment, wreck locations were needed. For this study, the
Joint Army-Navy Assessment Committee report, “Japanese Naval and Merchant Shipping Losses
During World War II by All Causes” from 1947 was used as a primary source. This report, compiled from
13 other sources from both the United States and Japan, provides loss locations to the minute scale for
ships of the Imperial Japanese Navy, as well as conscripted ships in the service of Japan during the war.
Dr. Robert Neyland of the Naval Historical Center agreed that this would be the finest scale data
available, as locations were taken during the actual battles (2010).This report provides the locations for
the majority of the wreck dataset.
Lost ships of the United States Navy were found in “The Official Chronology of the U.S. Navy in World
War II” by Robert S. Cressman, also of the U.S. Navy Historical Research Center, released in 1999. During
WWII, a number of ships shared the same names. To determine the correct vessel, further data was
gathered from the “Dictionary of American Fighting Ships” an online resource, and the “United States
Naval Chronology, World War II”, released in 1955 by the Naval History Division of the U.S. Navy
Department. A number of other sources were consulted for individual ships. All ships in the dataset list
their primary information source.

Barrett 6
Wreck locations are quite varied. Some
ships grounded ashore, while others
sank in remote parts of the Pacific. The
wrecks’ condition is based on the
amount of damage it received during
battle and accumulated environmental
exposure. While decades of corrosion
threaten a ship’s structural integrity,
disturbance events; tsunamis,
earthquakes and volcanoes, all common
in the “Ring of Fire”; each hasten collapse.
3,100 wreck locations were identified across the Pacific region. Wrecks comprised dozens of different
classes of vessel, and ranged from 24-ton patrol vessels to the immense Yamato and Musashi
battleships, which displaced more than 60,000 tons. The majority of wrecks were conscripted merchant
ships from Japan serving as cargo vessels. Approximately ten percent of all lost wrecks were oil tankers.
Environment Known for its pristine environment, the Western Pacific is home to the greatest diversity of any marine
ecosystem (Roberts et al 2002). A World Wildlife Fund report cites the importance of the Pacific region
as “the world’s richest fishing ground, the most extensive and diverse coral reefs, the world’s third
largest area of tropical rain forest, many species not found anywhere else on earth and strong cultural
and economic links between people and the environment” (WWF, 2010).

Barrett 7
An area roughly the size of the United States
known as the Coral Triangle contains ten
times the coral diversity of the Caribbean
(WWF, 2010).The Coral Triangle is also the
center of global mangrove diversity (Burke,
2001). Mangroves are essential to coral reef
survival by stabilizing shorelines to prevent
sedimentation of shallow reefs, harboring
endemic species and filtering terrestrial
pollution (National Ocean Service, 2010).
These two ecosystems join, creating a “grown” environment where mangrove trees and corals create
structure, physically building the ecosystem. While these two ecosystems work to produce globally high
biodiversity, they are also among the most threatened (Roberts et al, 2002). Coastal mangrove forests
are particularly susceptible to marine oil spills, and ranked as the most sensitive tropical habitat in global
oil spill response (NOAA, 2002). Loss of mangrove habitat creates a cascading decline in broader marine
systems. An oil spill could threaten the backbone of this ecosystem with both acute and decades-long
chronic effects. While not discussed in this paper, the explosives used in “dynamite fishing” throughout
the region often comes from these sunken vessels.
Barrett 8
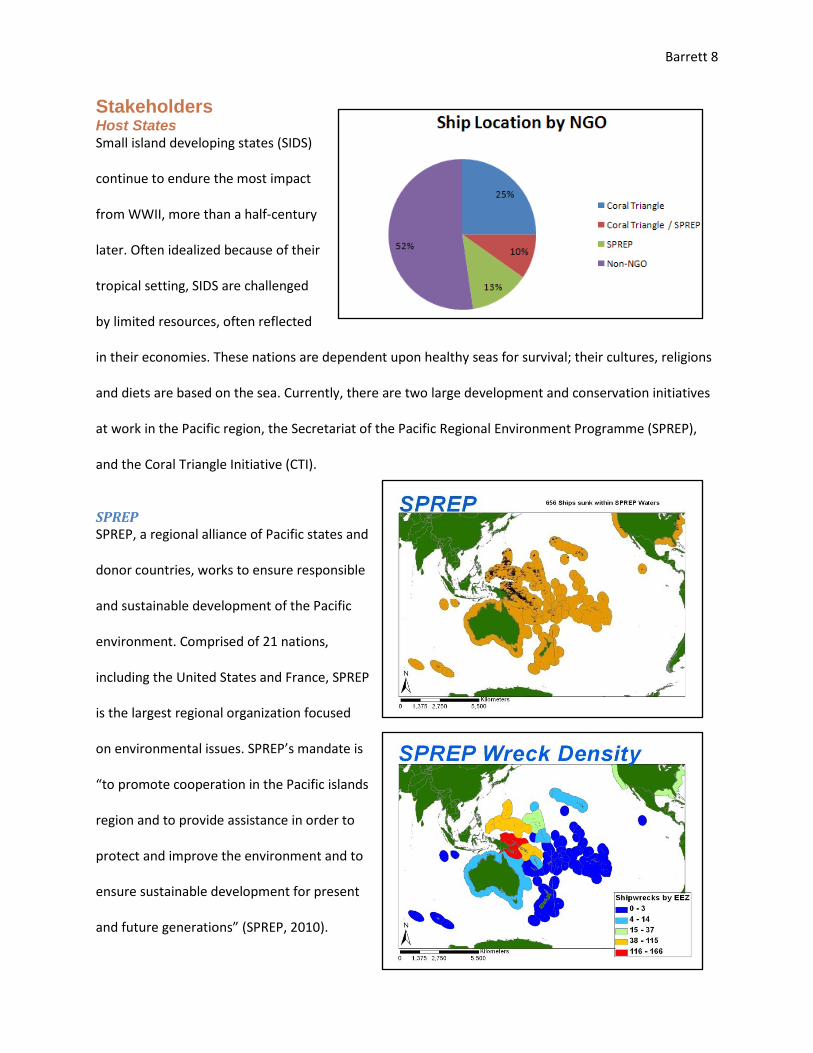
Stakeholders Host States Small island developing states (SIDS)
continue to endure the most impact
from WWII, more than a half-century
later. Often idealized because of their
tropical setting, SIDS are challenged
by limited resources, often reflected
in their economies. These nations are dependent upon healthy seas for survival; their cultures, religions
and diets are based on the sea. Currently, there are two large development and conservation initiatives
at work in the Pacific region, the Secretariat of the Pacific Regional Environment Programme (SPREP),
and the Coral Triangle Initiative (CTI).
SPREP SPREP, a regional alliance of Pacific states and
donor countries, works to ensure responsible
and sustainable development of the Pacific
environment. Comprised of 21 nations,
including the United States and France, SPREP
is the largest regional organization focused
on environmental issues. SPREP’s mandate is
“to promote cooperation in the Pacific islands
region and to provide assistance in order to
protect and improve the environment and to
ensure sustainable development for present
and future generations” (SPREP, 2010).

Barrett 9
Through the office of Marine Pollution, SPREP has created several work plans to address the threat of
potentially polluting wrecks after the USS Mississinewa, an war-era oil tanker, began leaking. The most
significant plan came in 2002, when a regional strategy was proposed at the SPREP Annual Meeting to
assess these threats on a regional scale and determine responsibility and remediation potential (SPREP,
2002). SPREP was told not to pursue a regional strategy during this meeting. Currently, according to
protocol, SPREP may only respond to specific calls for assistance from member states. SPREP is currently
following this mandate with focus on the leaking tanker, Hoyo Maru, in Truk Lagoon in the Federated
States of Micronesia (SPREP, 2010).
Coral Triangle To sustain the biodiversity of the Coral
Triangle, President Susilo Bambang
Yudhoyono of Indonesia invited neighboring
countries to join in protecting the vast
resources of the region through sustainable
development practices (CTI, 2007). The other
five nations, the Philippines, Malaysia, Timor-
Leste, Papua-New Guinea and the Solomon
Islands consented and signed an international
agreement with Indonesia in September
2007. The Coral Triangle Initiative, backed by
international conservation groups such as the
World Wildlife Fund and Conservation
International, also receives funding and support from the United States, Australia, the Asian
Development Bank and the Global Environment Facility (CTI, 2010).

Barrett 10
The goal of the Coral Triangle Initiative is to preserve the natural environment and collectively address
threats to both the resources and people of the region (CTI, 2010). While the CTI has resulted in positive
changes for the management of marine resources, they have yet to address the significant danger posed
by sunken wrecks, nor have these nations requested assistance from flag states. More than 800 vessels
are found within the Exclusive Economic Zones of CTI member countries.
Legal Considerations In considering these ships, one must distinguish them from sunken commercial or personal vessels.
Unlike commercially owned wrecks, which frequently change ownership, nations have retained
sovereignty of their state craft. Vessels on military service receive particular protection and treatment
within the international community. The U.S. Supreme Court ruling on the schooner Exchange in 1812
found that ships operating on behalf of a nation are considered sovereign property and must not be
disturbed in any manner. (The Schooner Exchange v. McFaddon, 1812).
Since 1812, sovereign immunity has been upheld throughout the international community and is listed
explicitly in Article 95 of the Law of the Sea (UNCLOS, 1982). It is customary under maritime law that all
state craft, sunken or not, retain their immunity (Roach, 2001) Unless a nation expressly abandons these
vessels, they remain under the veil of immunity in perpetuity, and no passage of time, act of neglect or
inaction may serve as an act of abandonment (Neyland, 2001). As war graves, ships are further
considered under the protection of the flag state (Roach, 2001).
To reiterate the U.S. position on sunken state craft, President Clinton issued a Statement on United
States Policy for the Protection of Sunken Warships in 2001:
Pursuant to the property clause of Article IV of the Constitution, the United States retains title indefinitely to its sunken State craft unless title has been abandoned or transferred in the manner Congress authorized or directed. The United States recognizes the rule of international law that title to foreign sunken State craft may

Barrett 11
be transferred or abandoned only in accordance with the law of the foreign flag State. Further, the United States recognizes that title to a United States or foreign sunken State craft, wherever located, is not extinguished by passage of time, regardless of when such sunken State craft was lost at sea.
The Statement continues, prohibiting any unauthorized disturbance of state craft (Office of Ocean
Affairs, 2004). Several nations with significant naval histories were consulted in drafting this Statement,
and France, Germany, Japan, the Russian Federation, Spain and the United Kingdom submitted
consenting positions.
Flag States While flag states of sovereign wrecks continue to
assert ownership, no country has begun a proactive
method to assess or monitor potentially polluting
vessels outside their own waters. Where remediation
has occurred, the “host” state of the vessel identified
the problem after the spill began and requested
assistance from the flag state through diplomatic
channels (Woodward, 2008).
United States In 2001, the USS Mississinewa, an oil tanker in Western Micronesia began leaking fuel after a cyclone
moved through the area (U.S. Navy, 2004). Shortly after the spill was reported, the Navy responded by
investigating on site, and patching areas with escaping oil. When the seeps continued, the Navy
conducted a lengthy environmental assessment, and recommended for the complete removal of
onboard oils, completed in 2003 (U.S. Navy, 2004).

Barrett 12
While the United States Navy has successfully offloaded oil from ships in a few cases, it has explicitly
stated that these cases do not set precedence for responsibility of leaking wartime wrecks (UNESCO,
2010). The Navy has also declared that it will handle requests for assistance on a “case-by-case” basis,
and will not pursue a proactive approach (Woodward, 2008). Admiralty Counsel to the Supervisor of
Salvage for the U.S. Navy, Richard Buckingham, reiterated this sentiment at the First International
Corrosion Workshop in 2010. Buckingham described the Navy’s approach as conservative, and felt it was
both environmentally and fiscally responsible to proceed this way.
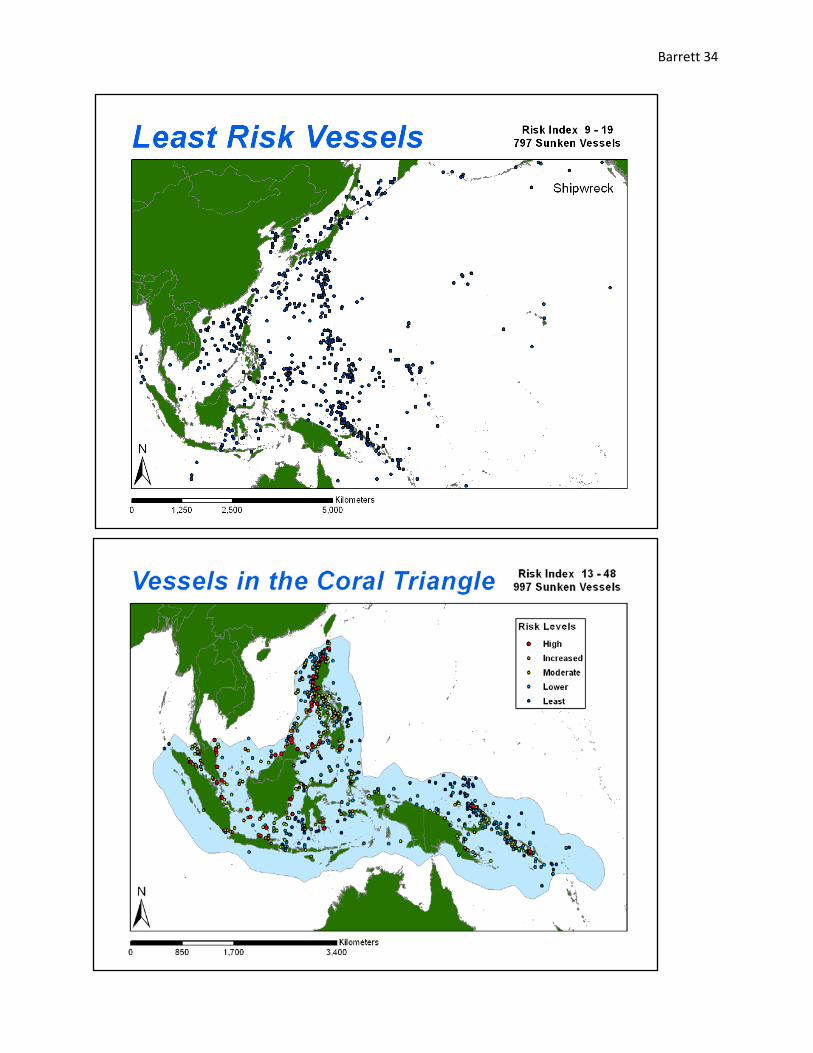
Japan There are approximately 2,500 sunken Japanese wartime vessels in the Pacific representing more than
two-thirds of sunken vessels in this survey. Since the war, Japan has consistently claimed sovereignty
over these wrecks, preventing private firms from salvage activities (McCarthy, 1998). Japan has also
defended sovereign immunity for wrecks within the international community by contributing to the
2001 U.S. Policy on Sunken State Craft. Japan’s statement reads:
According to international law, sunken State vessels, such as warships and vessels on government service, regardless of location or of the time elapsed remain the property of the State owning them at the time of their sinking unless it explicitly and formally relinquishes its ownership. Such sunken vessels should be respected as maritime graves. They should not be salvaged without the express consent of the Japanese Government.
Japan, like the U.S., has maintained sovereignty over their wrecks, but now appears willing to offer more
assistance than it has in the past. When told about the leaking vessel Hoyo Maru in Truk Lagoon,
Micronesia, the Japanese Minister of Foreign Affairs said that Japan recognized the issue and are
“always ready to listen to our friends in the Pacific” (Johnson, 2008).

Barrett 13
Japanese Tanker Hoyo Maru leaking fuel, Micronesia 2006.
Remediation Options As both host states and flag states come to terms with how best to manage and mitigate these
potentially polluting wrecks, there is a range of response options. These choices follow a continuum
from allowing the vessels to rupture and release the fuel, to a complete—or near complete—cleanup of
the polluting wreck.
“The Do Nothing Approach” With no international agreement to direct
remediation efforts, allowing these vessels to
corrode and release their fuel reserves into the
environment is the current approach.
Governments may not be aware of the oil
onboard or its potential impact, environmental
protection may not be a priority, or simply, they
are not aware of wrecks in their waters.
Only recently have nations begun investigating the potential of pollution from wrecks within their own
waters. The United States was unable to trace the source of a series of oil spills in San Francisco Bay for
years. At the time, these mystery oil spills were the “largest killer of sea birds in North America” (Basta,
2010). Only after several years of collecting oil samples and ruling out modern vessels did government
researchers identify the culprit as the wreck of the S.S. Jacob Luckenbach. In 1952, the freighter
Luckenbach struck another ship and sank 17 miles southwest of San Francisco, near the future Gulf of
the Farallones National Marine Sanctuary (Monterrey Bay National Marine Sanctuary).
Upon discovering this wreck as the source of multiple oiling events in the Bay, and as a wreck capable of
significant environmental damage (the ship sank with 457,000 gallons of bunker fuel), the Office of
© M i c h a e l J . B a r r e t t

Barrett 14
National Marine Sanctuaries began the Resource and Under Sea Threats (RUST) database “to find the
next Luckenbach” (Basta, 2010). This database now comprises thousands of wrecks, and aims to
catalogue data on the more than 150,000 sunken vessels in U.S. waters (Zelo et al, n.d.). Japan, the UK
and France have also begun cataloguing their wrecks.
Offloading Technology offers solutions to prevent these ships from releasing
their oil. Once the integrity of the hull has been established, a
process called “hot tapping” is used to drill into sunken vessels and
remove the oil. Hot tapping is usually used to access pipes and
plumbing that cannot be taken out of service but require repair.
Used on the USS Mississinewa, this process allowed the U.S. Navy’s
Supervisor of Salvage teams (SUPSALV) and contracted salvage
teams to drill through the hull and install valves for a controlled
removal.
A number of taps were drilled to speed offloading of the Mississinewa, with each tap taking 15 minutes
to install (U.S. Navy, 2004). Once a valve is in place, a hose is attached and the oil is vacuumed to
containment barges at the surface (SPREP, 2002). Oil collection booms are placed at the surface in the
event of an accidental release. Once the oil is removed, seawater and other impurities are filtered out
and the oil may be reused. In the case of the Mississinewa, the Navy sold the oil in Singapore (U.S. Navy,
2004). More than 2 million gallons of oil was removed from the Mississinewa, with only 5 gallons
accidentally released into the environment (U.S. Navy presentation, n.d.), proving that removal can be
an effective and environmentally safe option.
© U . S . N a v y

Barrett 15
According to Devon Grennan, President of Global Diving and Salvage, Inc., while these salvage
operations have already proven successful in defusing potential disasters, the U.S. Navy and the private
salvage community continues to improve techniques and equipment with each deployment, reducing
costs and minimizing risk to both ecological resources and the dive crew. After the successful unloading
of the sunken tanker, Prestige, at a depth of 3,500 meters, Remotely Operated Vehicles have also
proven capable of this work (Michel, 2005).
This process takes significant planning and operational management. The Navy conducted an
environmental assessment in conjunction with NOAA, performed a full year in advance (U.S. Navy,
2004). For the Mississinewa, five ships and a crew of more than 150 people was required, with
equipment coming from as far as Williamsburg, VA. While similar operations in more coastal waters
tend to be far simpler in size and scope, due to the number of ships in the Western Pacific, the
Mississinewa is a realistic case study for other remote vessels.
Costs In the case of the Mississinewa, despite the large amount of equipment and personnel mobilized, the
operation had a total cost of $4.5M, or $2.25 a gallon (U.S. Navy, 2004). The Luckenbach, on the other
hand, cost $20M to offload approximately 100,000 gallons at a cost of $200/gallon (Marine Law
Association of the United States, 2009). According to Devon Grennan, the wreck of the SS Catala, a
grounded wreck in Washington State, cost approximately $225/gallon, while the Princess Kathleen, a
passenger vessel that sank in Alaska in the 1950’s cost approximately $100/gallon (Grennan, 2010). The
cost of removing oil varies greatly depending upon the amount of oil, the depth of the sunken ship, and
the availability of equipment.

Barrett 16
Example of pitting corrosion
Entombing A third option exists, but has yet to be used. Entombing entails covering the wrecks in sand and concrete
in order to contain dangerous or toxic pollutants. Entombing potentially polluting wrecks has been
discussed as an option for cases that require extensive clean up operations or where remediation could
pose significant hazards. As with all war wrecks, unexploded ordnance is a serious consideration that
could justify entombing. Entombing has been suggested for the USS Montebello in Monterrey Bay(Basta,
2010) and the wreck of a German U-boat, U-864. This submarine has released several kilograms of
mercury a year into important Norwegian fishing grounds (Mammoet, 2008). This appears to be the
least likely action plan, as the public is demanding complete removal (Cowell and Gibbs, 2007).
Wreck Corrosion The approximate rate of corrosion in seawater is 0.1 mm/year. However, this
rate can more than double due to wave energy at the surface (MacLeod, 2011).
Hull plates were approximately 25mm thick on ships from this era (Moore,
2011), yet internal holding tanks and plumbing, ducts and vents are substantially
thinner and are often the first areas to collapse (MacLeod, 2010). Leaking pipes
and valves on the Mississinewa were as small as four inches in diameter, but
actual thicknesses for these components were not available.
Corrosion rates for individual ships, while an ideal figure is not likely, as precise
pH, dissolved oxygen and temperature would be required for each wreck site
(MacLeod, 2010). Further, baseline corrosion rates do not account for natural events, such as tectonic
activity or cyclones, which ultimately caused the leaks in the Mississinewa (U.S. Navy, 2004). Localized
corrosion, from pitting or microbes occurs much faster and is more likely to cause structural failure, yet
cannot be predicted (MacLeod, 2011).
© C u r t i n U n i v e r s i t y
Barrett 17
Oil Behavior Marine oil spills can have a devastating effect on the environment, particularly to productive coastal
areas. Species that live at the surface, such as seabirds and sea turtles are at particular risk from oil
pollution. While millions of gallons of oil are released into the oceans each year, the majority of spills
occur offshore and do not approach coastal waters (ITOPF, 1987). While many oil spills cannot be
predicted, these wrecks, predominantly found in near-shore waters, offer a rare opportunity to prevent
a disaster.
The majority of WWII ships carried heavier oils, such as “bunker C”, while smaller vessels and
submarines carried diesel fuel (U.S. Navy, 1946—Technical Mission X38-N6). Bunker C, or Fuel Oil #6, is a
residual fuel, left once lighter compounds have been distilled. In order to use this fuel, it must be re-
blended with one of these lighter compounds. Japan’s oil came from California crude, stockpiled before
the war, eventually transitioning to oils from Borneo and Sumatra (U.S. Navy, 1946—Technical Mission
X38-N1).
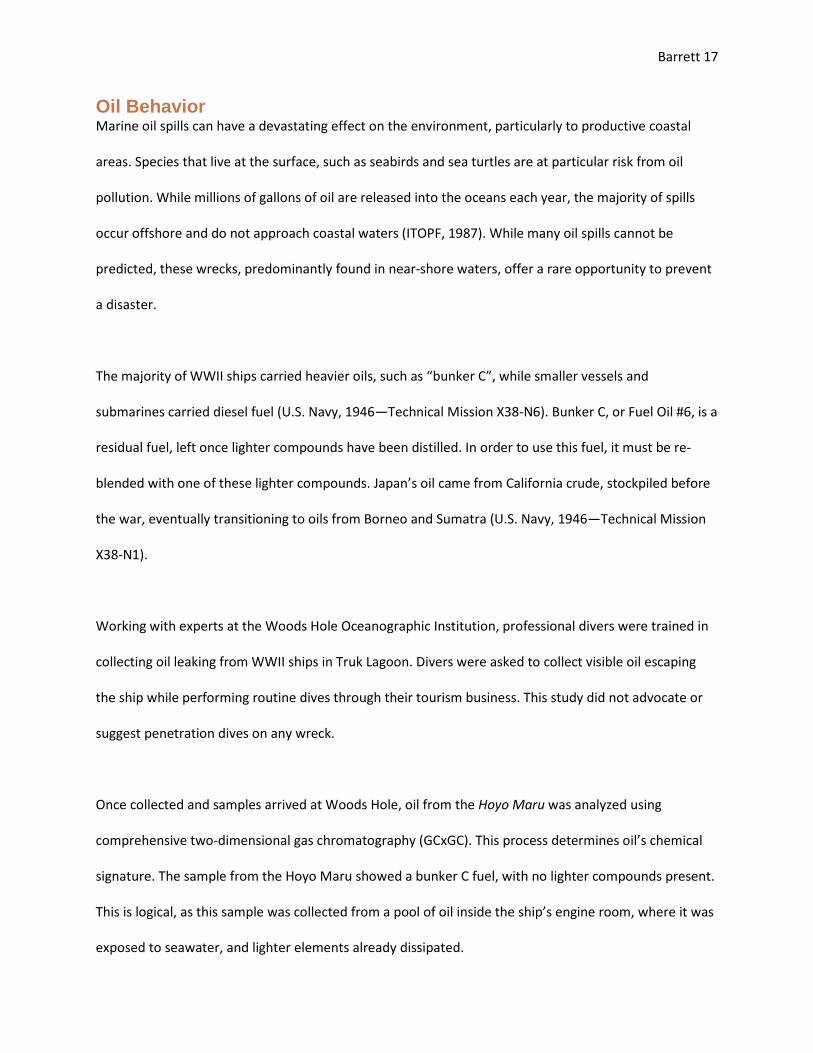
Working with experts at the Woods Hole Oceanographic Institution, professional divers were trained in
collecting oil leaking from WWII ships in Truk Lagoon. Divers were asked to collect visible oil escaping
the ship while performing routine dives through their tourism business. This study did not advocate or
suggest penetration dives on any wreck.
Once collected and samples arrived at Woods Hole, oil from the Hoyo Maru was analyzed using
comprehensive two-dimensional gas chromatography (GCxGC). This process determines oil’s chemical
signature. The sample from the Hoyo Maru showed a bunker C fuel, with no lighter compounds present.
This is logical, as this sample was collected from a pool of oil inside the ship’s engine room, where it was
exposed to seawater, and lighter elements already dissipated.

Barrett 18
Oil from the Hoyo Maru coming ashore in mangrove swamp, Micronesia.
Once released into the marine environment, oil undergoes several physical and chemical processes.
Each site’s oceanic and coastal conditions will
determine the weathering of petroleum products,
as well as the oil that is biologically available to
organisms (NRC, 2003). Oil’s viscosity, density and
solubility are the three key factors in marine spills
(Fingas, 2001). Ambient temperature of water and
air plays a major role in oil’s behavior. In the South
Western Pacific, mean air and water temperatures are between 25° and 32°C, likely resulting in faster
evaporation of lighter compounds (SPREP, 2002).Heavier oils, like bunker C, are likely to lose their lighter
compounds quickly in such a warm environment, while heavier residuals will travel with ocean currents
and wave energy until making landfall (Reddy, 2011).
Oils like bunker C are known to coat mangroves, blocking highly specialized photosynthesis and gas
exchange (MMS, 1997 and NOAA, 2002). Heavier oils such as bunker C restrict gas exchange more than
lighter oils (MMS, 1997). When exposed to bunker C fuels, one study cited by the Minerals Management
Service found “severe, long-term effects” on intertidal mangroves (1997). In the case of the Bahia las
Minas spill in Panama, 82% of mangroves were impacted within two weeks and significant effects were
still visible more than five years after the spill (NOAA 2002).
Mangrove ecosystems also undergo “re-oiling” after spills. During the spill, oil is absorbed into the
sponge-like sediment of the mangrove swamp. As the mangroves are poisoned through the soil, their
roots and trees die and uproot, overturning the soil, releasing the oil again. Oil is also re-released after
heavy rains and high tides. High tides also carry the oil further inland to previously unaffected areas
© M i c h a e l J . B a r r e t t
Barrett 19
(Keller and Jackson, 1993). After the Bahia las Minas spill, mangrove mortality was found to be above
50% for oiled areas (National Ocean Service, 2010). This re-oiling cycle may also lead to the remaining oil
becoming more toxic over time (MMS, 1997). The Bahia las Minas spill in particular offers an
appropriate case study of oil spilled within a sheltered marine habitat, similar to many Pacific
ecosystems.
Spatial analysts and oils experts have developed programs and models that identify likely areas for spills,
as well as trajectory models for how oil may travel within an environment, and how different oils will
react in an environment. Future studies and funding provide an excellent opportunity to model specific
plume trajectories. However, many examples have shown that due to the delicate nature of mangroves,
field remediation creates more environmental damage than taking no action (NOAA 2002), lending
further credence to ship remediation before their fuel reserves are released into the environment.
Risk Index NOAA’s Resources and Under Sea Threats database (RUST), established after the Luckenbach leaks, was
designed to prioritize potentially dangerous wrecks in U.S. waters, based on the following criteria
(Symons, 2010):
Ships built after 1910, Steel hulled, Greater than 200 feet or 1,000 gross tons. This algorithm allows the RUST dataset to narrow down the most dangerous shipwrecks with the
capacity to inflict serious environmental damage within US coastal waters from more than 100,000
known wrecks.
A major flaw appears in NOAA’s criteria; failure to account for the surrounding environment. Within
RUST, a vessel found in a less productive environment receives equal priority as an oil tanker found
Barrett 20
within a reef, fishery or marine protected area. As most WWII wrecks meet the RUST criteria, a more
robust prioritization is required, accounting for ship size, type and surroundings.
A risk index for American and Japanese WWII shipwrecks was created. Prioritizing sunken vessels could
help resource managers and governments use financial resources effectively and assure stakeholders
that the problem has been carefully assessed. All analyses were performed using the World Geodetic
System of 1984 and the World Winkel Tripel Projection, with a Central Meridian of 160W.
Five factors were chosen to build a matrix of wreck threats, a vessel’s tonnage, type, depth, distance
from shore and surrounding marine diversity. These components provide a measure of impact that a
leaking ship will have on the environment. Each factor is classed between 1 (least dangerous) and 10
(most dangerous), with each of the 3,100 ships scored accordingly. Risk factors were then summed to
produce the final risk rating for a maximum score of 50. Large oil tankers found in shallow, near shore
waters in areas of high marine biological diversity are ranked highest, while smaller ships in less
productive and deeper, oceanic waters are of lowest priority.
Like the RUST criteria, this index accounts for the tonnage of ships, whereas larger vessels may carry
larger fuel reserves and ordnance. Tonnage values in the dataset range from 24 to 63,000 tons. Further,
oil tankers receive more points within the scoring due to their significant oil capacity. Ships were
assigned values for depth according to the ETOPO 1km bathymetric map. Depth classes were
determined through discussion with marine salvage professionals in accordance with the industry’s best
practices and equipment (Grennon, 2011). It should be noted that while shallow wrecks are more likely
to corrode faster due to wave action and storm impact, they might also be easier remediation targets. A
Barrett 21
ship’s distance from shore was measured in accordance with traditional maritime boundaries, as some
vessels fall within a state’s coastal waters, while others sank on the High Seas in international waters.
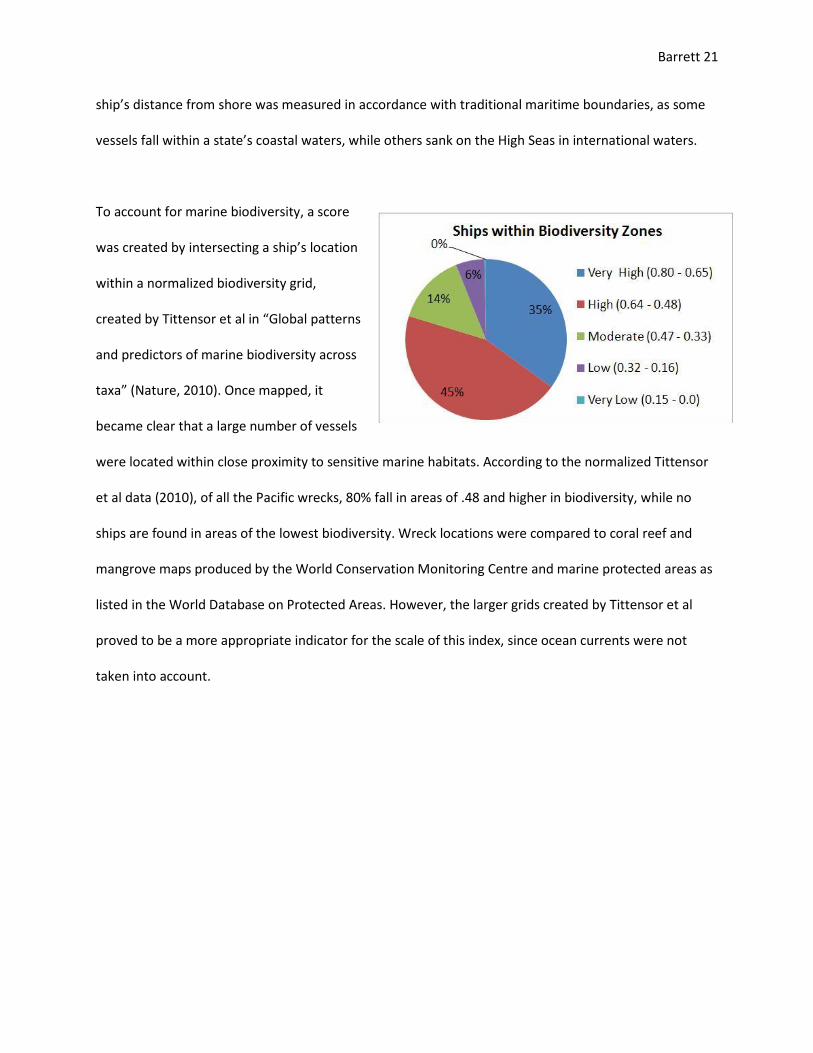
To account for marine biodiversity, a score
was created by intersecting a ship’s location
within a normalized biodiversity grid,
created by Tittensor et al in “Global patterns
and predictors of marine biodiversity across
taxa” (Nature, 2010). Once mapped, it
became clear that a large number of vessels
were located within close proximity to sensitive marine habitats. According to the normalized Tittensor
et al data (2010), of all the Pacific wrecks, 80% fall in areas of .48 and higher in biodiversity, while no
ships are found in areas of the lowest biodiversity. Wreck locations were compared to coral reef and
mangrove maps produced by the World Conservation Monitoring Centre and marine protected areas as
listed in the World Database on Protected Areas. However, the larger grids created by Tittensor et al
proved to be a more appropriate indicator for the scale of this index, since ocean currents were not
taken into account.

Barrett 22
Risk factors and weight classes Tonnage
10. 65,000 – 25,000 tons 8. 25,000 – 10,000 tons 6. 10,000 – 5,000 tons 4. 5,000 – 1,000 tons 2. 1,000 – 24 tons
Depth
10. 0 – 200 ft Standard Diving Equipment 5. 200 – 1000 ft Saturation Diving Required 1. 1000 – Plus ft Remotely Operated Vehicles Required
Tankers
5 points added to all Tanker Vessels.
Distance from Shore Five Zones representing standard international maritime boundaries 10. 0 – 3 Nautical Miles (Coastal Waters) 8. 3 – 12 Nautical Miles (Territorial Sea) 6. 12 – 24 Nautical Miles (Contiguous Zone) 4. 24 – 200 Nautical Miles (Exclusive Economic Zone) 2. 200 – Plus Nautical Miles (High Seas)
Biodiversity
Five classes based on Tittensor et al’s Normalized Marine Biodiversity Index, 0 to 1 scale. 10. 0.80 - 0.65 8. 0.64 - 0.48 6. 0.48 - 0.33 4. 0.32 - 0.16 2. 0.15 - 0.00
Barrett 23
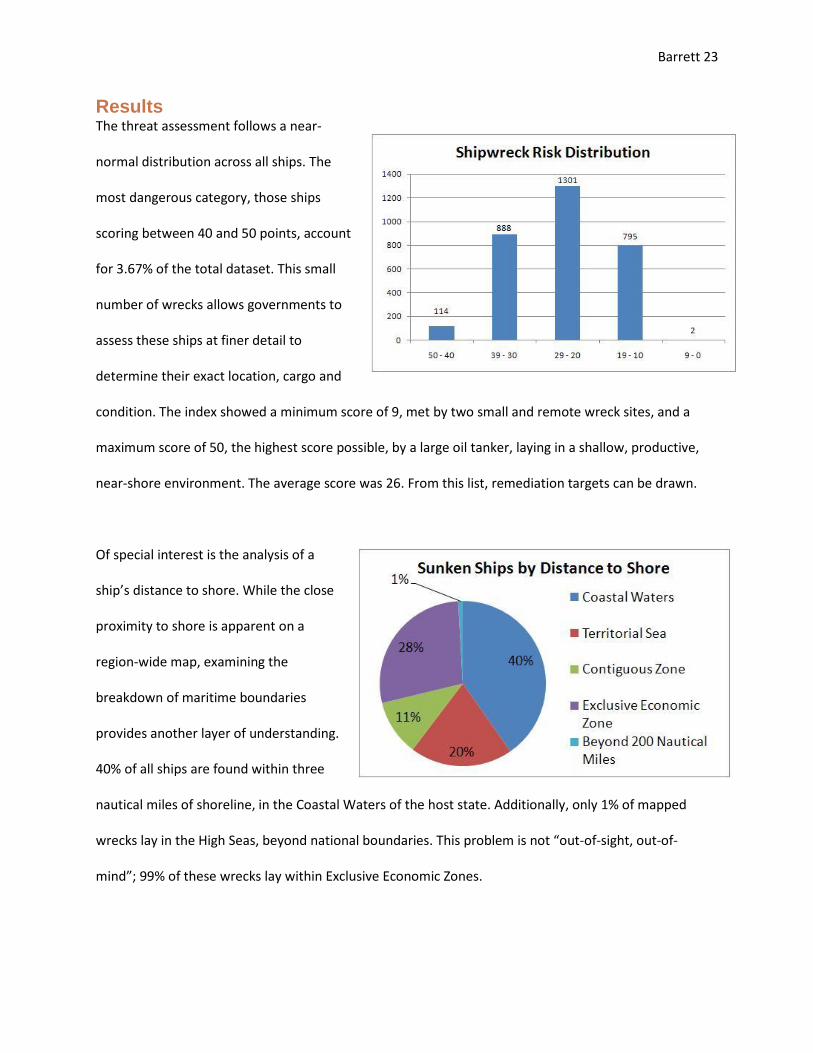
Results The threat assessment follows a near-
normal distribution across all ships. The
most dangerous category, those ships
scoring between 40 and 50 points, account
for 3.67% of the total dataset. This small
number of wrecks allows governments to
assess these ships at finer detail to
determine their exact location, cargo and
condition. The index showed a minimum score of 9, met by two small and remote wreck sites, and a
maximum score of 50, the highest score possible, by a large oil tanker, laying in a shallow, productive,
near-shore environment. The average score was 26. From this list, remediation targets can be drawn.
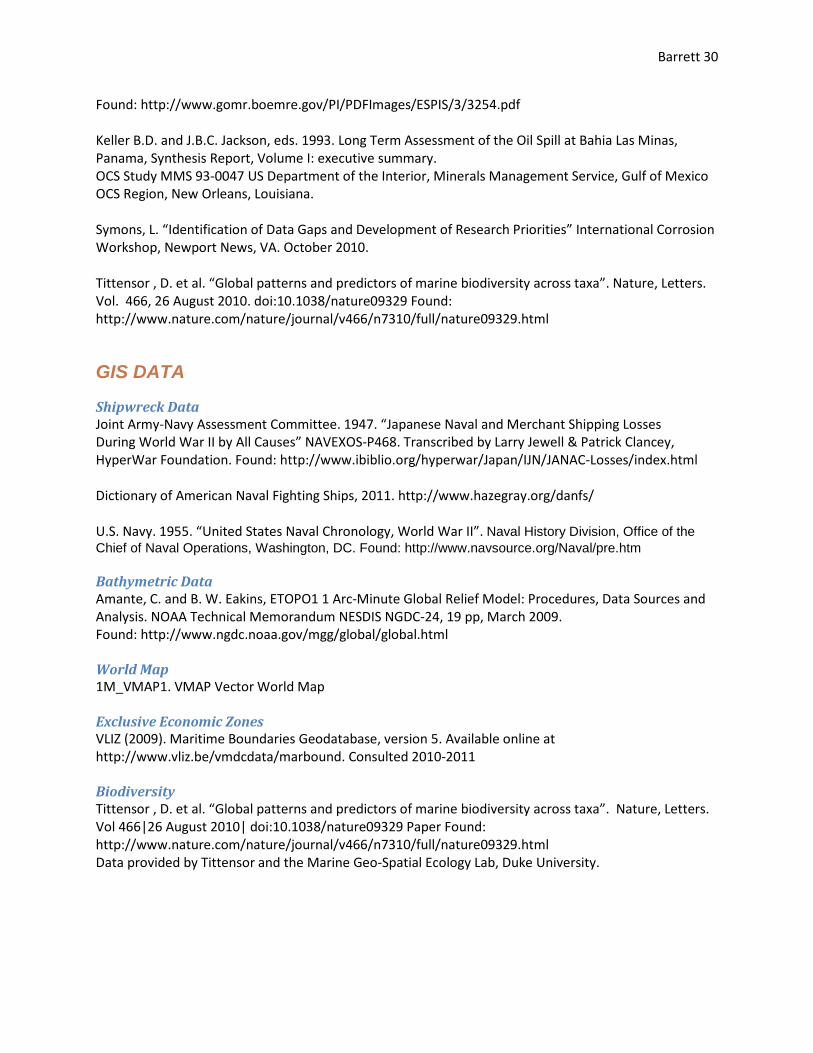
Of special interest is the analysis of a
ship’s distance to shore. While the close
proximity to shore is apparent on a
region-wide map, examining the
breakdown of maritime boundaries
provides another layer of understanding.
40% of all ships are found within three
nautical miles of shoreline, in the Coastal Waters of the host state. Additionally, only 1% of mapped
wrecks lay in the High Seas, beyond national boundaries. This problem is not “out-of-sight, out-of-
mind”; 99% of these wrecks lay within Exclusive Economic Zones.

Barrett 24
Resources In order to begin the dialogue between host and flag states, resource managers in the Pacific must have
appropriate knowledge of potentially polluting wrecks within their Exclusive Economic Zones and
protected areas. Unfortunately, this data is not easily accessible. Several firms hold proprietary datasets,
but many environmental managers in the Pacific do not have the necessary funds to hire these services.
In response, I have released my own dataset, including locations, details and risk scores for 3,100 WWII
vessels. Resource managers and non-profit organizations will be able to access the data for non-
commercial use. The data will be available through the UNEP World Conservation Monitoring Centre,
and through a website based on this project, www.potentiallypollutingwrecks.com. This site will serve as
a library of information regarding potentially polluting vessels.
Because ArcGIS software requires significant training, I have also developed a spatial tool to help
managers and researchers. This web-based mapping service will be housed on the project website by
the summer of 2011. The tool takes a user-defined search radius and scans the area surrounding sunken
ships for sensitive ecosystems. Once run, the user receives a map of the World Conservation Monitoring
Center’s mangroves and reefs that fall within their search distance. Users can then save screen captures
of the maps for use in reports and management plans.
This tool provides a simple overview of a threatened area. Oceanographic conditions such as currents,
temperature and depth are not accounted for. Once basic risks to an area are understood, managers
may then run or contract for more detailed spill trajectory analyses as necessary using either NOAA’s
GNOME trajectory model in the United States or several available commercial products, as SPREP has
done with the Hoyo Maru (2009).

Barrett 25
Recommendations Due to international law regarding sovereign immunity, flag states are not likely to abandon these
wrecks or consent to mandated remediation. However, this does not mean the world will watch
thousands of vessels collapse and release their oil. Less formal compacts could be created wherein flag
and host states cooperate on systematic remediation. Flag states could, and do, clean up polluting
vessels while still asserting their sovereign claims. I believe flag and host states should work together to
prioritize and neutralize the most dangerous wrecks within hosting waters.
Once managers have identified wrecks within proximity of important resources, they would be able to
approach the United States and Japan for assistance in cleaning out the most dangerous vessels.
Economic analysis of remediation is also possible, using a wreck’s depth, distance from shore and
required equipment, as well as volume and value of onboard oils to create an economic index.
For more in depth understanding of the vessel at
hand, new technology, such as high-resolution,
multi-beam sonar can provide stunning visuals
that allow analysts to see the damage corrosion
has done to sunken wrecks. This technology,
developed by Dr. Martin Dean of the University
of St. Andrews and his team at Adus Ltd, can scan
an entire vessel in less than 30 minutes. Once
scanned, Adus Ltd provides clients with software
where the ship can be visualized in 3D at fine
enough resolution to identify corroded areas (Dean, 2010).
© A d u s , L t d
© A d u s , L t d

Barrett 26
The risk index created through this project offers a crude estimate of a sunken ship’s potential impact on
the environment. Currently, this index does not provide a likelihood of a spill, or a predicted time of
structural failure. As these ships become better studied and exact locations determined, the index may
be updated and improved. Spill trajectory models will also aid in determining oil plume flow and specific
threatened areas.
Ultimately, I believe it will become necessary to perform clean up operations on a number of sunken
vessels in the Pacific to protect marine and cultural resources. While the United States and several other
states have taken a proactive approach to identifying undersea threats within their own waters, the
challenge lay in taking this approach to all state craft, regardless of location. I hope that by providing this
data to relevant parties will promote this discussion.
As more ships are cleaned, the remediation technology and planning improves. However, today, ship
remediation is a rare event. I hope that the United States and Japan see the need and benefit to
mitigate potential disasters before they come to fruition, both at home and abroad.

Barrett 27
Citations Orbach, Michael. 2010. Lecture Comments; Duke University, NSOE Environ 276: Marine Policy Joint Army-Navy Assessment Committee. 1947. “Japanese Naval and Merchant Shipping Losses During World War II by All Causes” NAVEXOS-P468. Transcribed by Larry Jewell & Patrick Clancey, HyperWar Foundation. Found: http://www.ibiblio.org/hyperwar/Japan/IJN/JANAC-Losses/index.html Neyland, Robert. 2010. Personal Communication. Underwater Archaeology Branch Head, U.S. Naval History and Heritage Command. Cressman, R.J. 1999. The Official Chronology of WWII. Washington, DC: Contemporary History Branch Naval Historical Center. Dictionary of American Naval Fighting Ships, 2011. http://www.hazegray.org/danfs/ U.S. Navy. 1955. “United States Naval Chronology, World War II”. Naval History Division, Office of the Chief of Naval Operations, Washington, DC. Found: http://www.navsource.org/Naval/pre.htm Roberts, C. et al. 2002. “Marine Biodiversity Hotspots and Conservation Priorities for Tropical Reefs”. Science, New Series, Vol. 295, No. 5558 (Feb. 15, 2002), pp. 1280-1284. Found: http://www.jstor.org/stable/3075918 World Wildlife Fund, 2010. The Coral Triangle. Retrieved from http://www.worldwildlife.org/what/wherewework/coraltriangle/index.html Burke, L. et al. 2001. “Pilot Analysis of Global Ecosystems: Coastal Ecosystems”. World Resources Institute, Washington, DC. Found: http://www.wri.org/wr2000 National Ocean Service, 2010. Oil Spills in Mangrove: Planning and Response Considerations. NOAA, Office of Response and Restoration, Silver Spring, MD. SPREP, 2010. “SPREP’s Structure” Retrieved from http://www.sprep.org/sprep/about.htm SPREP, 2002. “A Regional Strategy to Address Pollution from World War II Wrecks” Presented 13th SPREP Meeting, Majuro, Marshall Islands. Retrieved from http://www.sprep.org/legal/documents/Marinewrecks.pdf SPREP, 2009. “STRATEGIC ENVIRONMENTAL ASSESSMENT AND POTENTIAL FUTURE SHORELINE IMPACTS OF THE OIL SPILL FROM WWII SHIPWRECK HOYO MARU CHUUK LAGOON- FEDERATED STATES OF MICRONESIA”. Found: http://www.sprep.org/publication/pub_detail.asp?id=851 CTI, 2007. “Coral Triangle Initiative on Coral Reefs, Fisheries, and Food Security”. Government of Indonesia. Retrieved http://www.worldwildlife.org/what/wherewework/coraltriangle/WWFBinaryitem5831.pdf CTI, 2010. “Coral Triangle Initiative on Coral Reefs, Fisheries, and Food Security”. Coral Triangle Initiative Webpage. Retrieved http://www.cti-secretariat.net/about-cti/about-cti
Barrett 28
U.S. Supreme Court, 1812. The Schooner Exchange v. McFaddon, 11 U.S. 116. Retrieved from http://supreme.justia.com/us/11/116/case.html UNCLOS, 1982. United Nations Convention on the Law of the Sea of 10 December 1982. Article 95. Retrieved from http://www.un.org/Depts/los/convention_agreements/texts/unclos/part7.htm Neyland, R.S. 2001. “Sovereign Immunity and the Management of United States Naval Shipwrecks”. U.S. Naval Historical Center, Washington, DC. Retrieved from http://www.history.navy.mil/branches/org12-7h.htm Roach, J. 2001. “Sunken Warships and Military Aircraft”. ”. U.S. Naval Historical Center, Washington, DC. Retrieved from http://www.history.navy.mil/branches/org12-7j.htm Office of Ocean Affairs; Protection of Sunken Warships, Military Aircraft and Other Sunken Government Property, 69 FR 5647 et seq. Retrieved from http://www.federalregister.gov/articles/2004/02/05/04-2488/office-of-ocean-affairs-protection-of-sunken-warships-military-aircraft-and-other-sunken-government Woodward, T. (2008, December 10). Pacific World War II wrecks pose risk of toxic leaks. National Geographic Magazine, Retrieved from http://news.nationalgeographic.com/news/2008/12/081210-pacific-shipwrecks-missions.html U.S. Navy. 2004. “U.S. NAVY SALVAGE REPORT USS MISSISSINEWA OIL REMOVAL OPERATIONS” NAVAL SEA SYSTEMS COMMAND. UNESCO, 2010. Underwater Cultural Heritage in Oceania. Document Code: CLT/CIH/MCO/2010/150REV. Paris, France. Retrieved from http://unesdoc.unesco.org/images/0018/001887/188770e.pdf Buckingham, Richard. “Setting the Legal Context Panel”. International Corrosion Workshop, Newport News, VA. October 2010. McCarthy, M. 1998. “The Submarine as a Class of Archaeological Site”. Originally published AIMA Bulletin Vol 22 1998. Reprinted and Accessed at http://www.abc.se/~pa/publ/submarin.htm Johnson, E. 2008. “Japan Asked to Avert Disaster From Pacific World War II Wrecks” Retrieved from http://www.bloomberg.com/apps/news?pid=newsarchive&sid=alAAhz0pYCrI Basta, D. “Opening Remarks” International Corrosion Workshop, Newport News, VA. October 2010. Monterey Bay National Marine Sanctuary, n.d. “THE LUCKENBACH OIL SPILL” Monterey Bay Marine Sanctuary Website; Sanctuary Integrated Monitoring Network. Retrieved http://www.sanctuarysimon.org/monterey/sections/other/sporadic_luckenbach.php Zelo et al. n.d. “NOAA’s Abandoned Vessel Program and Resources and Under Sea Threats project - Partnerships and Progress for Abandoned Vessel Management”. NOAA, Office of Response and Restoration, Silver Spring, MD Retrieved http://response.restoration.noaa.gov/book_shelf/1056_05-A-324-IOSC%20-%20AVP_RUST%20Zelo2.pdf

Barrett 29
U.S. Navy Presentation, n.d. “USS MISSISSINEWA (AO 59): Oil Offloading Operations” Powerpoint. Retrieved from http://www.supsalv.org/essm/ppt/MISS_Web_Summary.ppt Michel et al, 2005. “Potentially Polluting Wrecks in Marine Waters”. Proceedings of the 2005 International Oil Spill Conference. Retrieved from http://www.iosc.org/docs/IOSC_Issue_2005.pdf Marine Law Association of the United States, 2009. “Wreck Oil Removal Program”. Retrieved http://www.mlaus.org/content/ItemContent/10431Events.pdf Grennan, D. “What is the current state of the art for assessment, salvage and response technologies?” International Corrosion Workshop, Newport News, VA. October 2010. Mammoet, 2008 Press Release, “Norwegian government recommends salvage of the U-864” Retrieved from http://www.mammoet.com/Portals/1/Mammoet%20Press%20Release%20Submarine%2030%201.pdf Cowell, A. and Gibbs, W. 2007. “Nazi U-Boat Imperils Norwegians Decades After the War”. The New York Times. Retrieved from http://www.nytimes.com/2007/01/11/world/europe/11norway.html?_r=1 MacLeod, Ian. 2011. Personal Communication. Executive Director, Collections Management and Conservation at Western Australian Museum MacLeod, Ian. 2010. “Modeling Corrosion, Assessment of Complicating Factors Panel” International Corrosion Workshop, Newport News, VA. October 2010. Moore, James. 2011. Personal Communication. Oceanographer, University of Rhode Island. ITOPF (International Tanker Owners Pollution Federation Ltd.) 1987. Response to Marine Oil Spills. Videotel Marine International Ltd, London. U.S. Navy, “Reports of the U.S. Naval Technical Mission to Japan: 1945-1946”. Operational Archives, U.S. Naval History Division, Washington, D. C. Released December 1974.
“Japanese Fuels and Lubricants- Article 6 Research on Diesel and Boiler Fuel at the First Naval Fuel Depot, Ofuna”. Serial: X-38(N)-1 “Japanese Fuels and Lubricants-Article 1, Fuel and Lubricant Technology” Serial: X-38(N)-1
Found: http://www.fischer-tropsch.org/primary_documents/gvt_reports/USNAVY/USNTMJ%20Reports/USNTMJ_toc.htm NRC (National Research Council). 2002. Oil in the Sea III: Inputs, Fates, and Effects. Washington, DC. Fingas, M., & Charles, J. (2001). The Basics of Oil Spill Cleanup. CRC. Reddy, Christopher. 2011. Personal Communication. Senior Scientist, Marine Chemistry & Geochemistry, WHOI. Minerals Management Service. 1997. “Oil Spills and Mangroves: An Overview” by Snedaker, S.C., Patrick D. Biber and Rafael J. Aravjo. Published in “Managing Oil Spills in Mangrove Ecosystems: Effects, Remediation, Restoration, and Modeling” OCS Study MMS 97-0003.
Barrett 30
Found: http://www.gomr.boemre.gov/PI/PDFImages/ESPIS/3/3254.pdf Keller B.D. and J.B.C. Jackson, eds. 1993. Long Term Assessment of the Oil Spill at Bahia Las Minas, Panama, Synthesis Report, Volume I: executive summary. OCS Study MMS 93-0047 US Department of the Interior, Minerals Management Service, Gulf of Mexico OCS Region, New Orleans, Louisiana. Symons, L. “Identification of Data Gaps and Development of Research Priorities” International Corrosion Workshop, Newport News, VA. October 2010. Tittensor , D. et al. “Global patterns and predictors of marine biodiversity across taxa”. Nature, Letters. Vol. 466, 26 August 2010. doi:10.1038/nature09329 Found: http://www.nature.com/nature/journal/v466/n7310/full/nature09329.html
GIS DATA
Shipwreck Data Joint Army-Navy Assessment Committee. 1947. “Japanese Naval and Merchant Shipping Losses During World War II by All Causes” NAVEXOS-P468. Transcribed by Larry Jewell & Patrick Clancey, HyperWar Foundation. Found: http://www.ibiblio.org/hyperwar/Japan/IJN/JANAC-Losses/index.html Dictionary of American Naval Fighting Ships, 2011. http://www.hazegray.org/danfs/ U.S. Navy. 1955. “United States Naval Chronology, World War II”. Naval History Division, Office of the Chief of Naval Operations, Washington, DC. Found: http://www.navsource.org/Naval/pre.htm Bathymetric Data Amante, C. and B. W. Eakins, ETOPO1 1 Arc-Minute Global Relief Model: Procedures, Data Sources and Analysis. NOAA Technical Memorandum NESDIS NGDC-24, 19 pp, March 2009. Found: http://www.ngdc.noaa.gov/mgg/global/global.html World Map 1M_VMAP1. VMAP Vector World Map Exclusive Economic Zones VLIZ (2009). Maritime Boundaries Geodatabase, version 5. Available online at http://www.vliz.be/vmdcdata/marbound. Consulted 2010-2011 Biodiversity Tittensor , D. et al. “Global patterns and predictors of marine biodiversity across taxa”. Nature, Letters. Vol 466|26 August 2010| doi:10.1038/nature09329 Paper Found: http://www.nature.com/nature/journal/v466/n7310/full/nature09329.html Data provided by Tittensor and the Marine Geo-Spatial Ecology Lab, Duke University.

Barrett 31
IMAGE CITATIONS
All Wreck Maps: Created by Michael Barrett, 2011. Wreck data from Barrett dataset. Photo: Hino Maru Bow Gun, © Florian Brietzke, 2006. Global Coral, Mangrove and Seagrass Diversity Map: UNEP-WCMC (World Conservation Monitoring Centre) 2001. Created by Philippe Rekacewicz, UNEP/GRID-Arendal http://maps.grida.no/go/graphic/distribution-of-coral-mangrove-and-seagrass-diversity Photo: Hoyo Maru leaking. © Michael Barrett, 2006. Photo: U.S. Navy divers tapping into USS Mississinewa, 2004. © U.S. Navy, photo from “U.S. NAVY SALVAGE REPORT USS MISSISSINEWA OIL REMOVAL OPERATIONS” Photo: Pitting Corrosion from Curtin University, Corrosion Centre for Education, Research & Technology, 2010. http://corrosion.curtin.edu.au/research/mining.cfm High Resolution Multibeam Sonar, from Adus, Ltd. http://www.adus-uk.com/WreckImages.html

Barrett 32
Appendix: Risk Index Maps

Barrett 33
Barrett 34
Barrett 35