potential sources of faecal contaminants in four coromandel …€¦ · · 2018-01-03appendix 1...
TRANSCRIPT

Waikato Regional Council Technical Report 2017/25
Potential sources of faecal contaminants in four Coromandel catchments www.waikatoregion.govt.nz ISSN 2230-4355 (Print) ISSN 2230-4363 (Online)

Prepared by: Marguerite Nakielski (4Sight Consulting), Pete Wilson, Eloise Ryan (Waikato Regional Council) For: Waikato Regional Council Private Bag 3038 Waikato Mail Centre HAMILTON 3240 December 2017 Document #: 10722859

Doc # 10722859
Peer reviewed by: Date 9 August 2017 Hannah Jones
Approved for release by: Dominique Noiton
Date 13 December 2017
Disclaimer This technical report has been prepared for the use of Waikato Regional Council as a reference document and as such does not constitute Council’s policy. Council requests that if excerpts or inferences are drawn from this document for further use by individuals or organisations, due care should be taken to ensure that the appropriate context has been preserved, and is accurately reflected and referenced in any subsequent spoken or written communication. While Waikato Regional Council has exercised all reasonable skill and care in controlling the contents of this report, Council accepts no liability in contract, tort or otherwise, for any loss, damage, injury or expense (whether direct, indirect or consequential) arising out of the provision of this information or its use by you or any other party.

Doc # 10722859
Doc # 10722859 Page i
Table of Contents
Executive summary iii
1 Introduction 1
2 Methods 2 2.1 Catchment selection 2 2.2 Stream velocity 3 2.3 Rainfall 4 2.4 Weather and tide events 4 2.5 Discrete water sampling 4 2.5.1 Water quality measurements 4 2.6 Faecal source tracking 5 2.6.1 Interpreting FST results 5 2.7 Guideline values 5
3 Results and Discussion 6 3.1 Trends observed across all catchments 6 3.1.1 E. coli concentrations were highest after rainfall 6 3.1.2 E. coli concentrations were influenced by land use 7 3.1.3 E. coli concentrations were often elevated during a spring tide at the stream mouth 8 3.1.4 Elevated E. coli concentrations were often accompanied by elevated nutrient
concentrations 9 3.2 Catchment summaries 11 3.2.1 Pepe Stream, Tairua 11 3.2.2 Taputapuatea Stream, Whitianga 16 3.2.3 Kuaotunu Stream, Kuaotunu 21 3.2.4 Stewart Stream, Opito Bay 26
4 Conclusions 31
5 Recommendations 32
References 33
Appendix 1 – Detailed observations in each catchment 34 Pepe Stream (Tairua) 34 Site 10 (Mouth) 34 Site 11 (Mid) 34 Site 12 (Bush) 35 Taputapuatea Stream (Whitianga) 35 Site 7 (Mouth) 35 Site 8 (Mid) 36 Site 9 (Bush) 36 Kuaotunu River (Kuaotunu) 36 Site 4 (Mouth) 36 Site 5 (Mid) 37 Site 6 (Bush) 38 Stewart Stream (Opito Bay) 38 Site 1 (Mouth) 38 Site 2 (Mid) 39 Site 3 (Bush) 39
Appendix 2 – Laboratory analysis methods 41
Appendix 3 – Summary data tables 42
Appendix 4 – Site location maps and current resource consent maps 48
Page ii Doc # 10722859
Pepe Stream, Tairua 48 Taputaputea Stream, Whitianga 49 Kuaototunu Stream, Kuaotunu 50 Stewart Stream, Opito Bay 51
Appendix 5 – Statistical analyses 54
Appendix 6 – Stream gauging and contaminant load calculations 55
Appendix 7 – FST laboratory reports 56

Doc # 10722859 Page iii
Executive summary In 2015, Waikato Regional Council (WRC) carried out a water quality snapshot survey in 18 coastal stream mouths in Coromandel, New Zealand (WRC, 2016). Based on the results of the 2015 survey, four catchments were selected for further investigation between January and March 2017: Stewart Stream, Opito Bay; Kuaotunu Stream, Kuaotunu; Taputapuatea Stream, Whitianga; and Pepe Stream, Tairua. The aim of this further investigation was to gain a more comprehensive understanding of 1) where contaminants were derived within the catchment, 2) whether the source of contamination is animal or human-derived, and 3) how these levels of contaminants are affected by different weather and tide events, with the aim of informing future targeted management intervention. We identified the source of faecal contamination (E. coli) down to a sub-catchment level or by land use by sampling downstream of confluences or by sampling downstream of a specific land use type. Each of the catchments had similar land use composition; typically, native bush or pine forests in the upper catchment, agriculture in the mid-catchment, and small urban development nearest the coast. We carried out event-based sampling to investigate faecal contamination levels during dry and wet weather and during spring and neap tides at the stream mouths. The results indicate that in general:
1. E. coli concentrations were highest after heavy rainfall. 2. E. coli concentrations were highest at the pastoral and stream mouth sites and lowest
at the native/exotic bush sites. 3. At the stream mouth, E. coli concentrations were more likely to be elevated during a
spring tide than during a neap tide. Faecal source tracking analysis identified a variety of faecal contaminant sources. Possum and avian sources were present in dry and wet weather conditions and ruminant sources dominated in wet weather conditions. There was a strong agreement between the land use type and the source of faecal contamination detected. Possum and avian sources were commonly detected at the bush sites and ruminant sources dominated downstream from pastoral sites. Typically, we detected a mixture of all three main contaminant sources, possum, avian, and ruminant, at the stream mouth. The combined approach of sampling downstream of confluences and land use types, event-based sampling, and faecal source tracking has proven to be a useful tool for identifying the source of faecal contaminants that are detected at times in estuaries, including coastal stream mouths. The findings from this approach can assist in determining whether catchment-based management actions would be beneficial for improving water quality, and if so, where efforts are best spent.

Page iv Doc # 10722859

Doc # 10722859 Page 1
1 Introduction The Coromandel Peninsula has many beaches that are popular amongst locals and the many tourists that visit each year. Most beaches have small streams flowing into them with water that is typically warm and slow flowing. At times, storms and coastal processes can result in stream mouths becoming partially or completely blocked off from the open coast forming small lagoons which are often used as popular swimming and wading locations for younger swimmers and families. In 2015, Waikato Regional Council (WRC) carried out a snapshot of water quality in 18 coastal stream mouths in the Coromandel to investigate two aspects regarding water quality: 1) the ecological health of the system, and 2) the concentration of faecal bacteria that, at high levels, can indicate a potential human health risk. This snapshot showed that the water quality in these stream mouths was highly variable and particularly susceptible to contamination from excess sediment, nutrients, and faecal bacteria during and following rainfall and during spring tides (Wilson 2016). The purpose of the 2015 snapshot was to identify the state of the water quality at stream mouths over the summer months. In particular, the snapshot focussed on faecal contaminants, how frequently the concentration of contaminants exceeded recommended guideline values, and identifying potential sources of the contaminants (e.g., humans, ruminant animals, gulls, possums, and pigs). This study further builds on the 2015 snapshot by carrying out more comprehensive catchment assessments to determine: 1) where contaminants were derived within the catchment, 2) whether the source of contamination was animal or human, and 3) how these levels of contaminants were affected by different weather and tide events. Results from this type of approach will assist in determining whether catchment-based management actions would be beneficial for improving water quality, and if so, where efforts are best spent. We selected four catchments of interest based on the number of exceedances of the recreational water quality guidelines at each site in the previous 2015 snapshot survey and the general swimming popularity of the (Figure 1):
1. Stewart Stream, Opito Bay; 2. Kuaotunu Stream, Kuaotunu; 3. Taputapuatea Stream, Whitianga; and 4. Pepe Stream, Tairua.
In each catchment, we selected sampling sites downstream of confluences and land use types in order to isolate the source of faecal contamination to sub-catchments and land use. Each of the catchments had similar land use composition; typically, native bush or pine forests in the upper catchment, agriculture in the mid-catchment, and small urban development nearest the coast. In this report, we refer to these three land use types as bush, pastoral, and stream mouth sites. We analysed water samples for a range of physical parameters, nutrients, and faecal contaminants. Where appropriate, we also carried out faecal source tracking (FST) to identify the specific source of faecal contamination; in this study, human, ruminant (more specifically cow or sheep where possible), bird, and possum.

Page 2 Doc # 10722859
Figure 1: Locations of the Pepe Stream, Taputapuatea Stream, Kuaotunu Stream, and Stewart
Stream catchments investigated in this report. We carried out event-based sampling to investigate various weather and tide events:
1. wet weather; 2. dry weather; 3. spring tides; and 4. neap tides.
In addition to furthering Council’s understanding of water quality in the sampling locations, this investigation provides a showcase of how the latest scientific techniques and tools can be used to identify the location and cause of degraded water quality in Waikato’s coastal environment. These types of investigations help to build a better understanding of catchment-specific sources of estuarine contamination which can ultimately inform robust, science-driven management responses.
2 Methods 2.1 Catchment selection
We selected catchments of interest based on the number of exceedances of the recreational water quality guideline at each site in the previous 2015 snapshot survey and the general swimming popularity of the location. In each of the catchments, we sampled at three separate locations to gain an understanding of contaminant sources throughout the catchment specific to the various land use types. We placed a sampling location downstream of a confluence to isolate sub-catchments or downstream from specific land uses to isolate a land use. Generally, we placed one sampling

Doc # 10722859 Page 3
site in the upper catchment downstream from the native/exotic forest, another site downstream from pastoral land use in the middle of the catchment, and one site at the stream mouth to capture the urban land use in each catchment (Figure 2; more details in Appendix 4).
Figure 2: Sampling locations within each catchment.
2.2 Stream velocity We measured stream velocity to get a better understanding of the total loading of contaminants that are washed down the stream into the coastal marine area. To calculate this, we timed how long it took an object to float 5 m downstream. We used the average time of the three replicates to account for variations in velocity; for example, stream banks are associated with greater friction, and hence slower moving water. In order to calculate the discharge rate from the stream velocity, we also measured the stream’s cross-section at each sampling site. We measured the depth of the stream at approximately 0.5 m intervals along a transect that was perpendicular to the stream flow direction. We calculated the stream discharge rate, or the volume of water flowing in a stream over a set interval of time, using the following equation:
Q = AV Where Q is discharge (m3/second, also called cumecs), A is the cross-sectional area of the stream (m2), and V is the average velocity (m/s).

Page 4 Doc # 10722859
By calculating the area of each subsection (width of sub-section x depth of subsection) and multiplying it by the stream velocity, we could calculate individual discharge rates for each sub-section of the stream. We then calculated the sum of the individual spot discharge rates to approximate the total stream discharge rate.
2.3 Rainfall Rainfall is a key climatic factor that influences the concentration of faecal bacteria in waterways. Rainfall flushes contaminants off the land and into surrounding waterways. Heavy rainfall can also lead to stormwater inflow and infiltration of reticulated or on-site wastewater systems that can result in overloading, poor treatment and in some cases overflows. In this investigation, we used daily rainfall values taken from the Waikato Regional Council rain gauge at Castle Rock in the Matawai Catchment recorded from 21 December 2016 through to 1 April 2017 to provide extra information about potential causes of contamination in the waterways.
2.4 Weather and tide events We scheduled our sampling based on weather and tide events. More specifically, we carried out two rounds of sampling for each of dry weather, wet weather, spring tide, and neap tide events, with 64 samples being collected in total (48 samples collected for two rounds of dry sampling and wet sampling and 16 samples for two rounds of spring tide sampling and neap tide sampling). One team collected samples over two days for every round of sampling for the ‘dry period sampling’, ‘spring tide sampling’ and ‘neap tide sampling’. Two separate teams sampled all four catchments in a single day for each round of ‘wet weather event sampling’. This allowed us to collect all samples within a specific time window to enable a greater level of comparability between sites. We defined the trigger for a ‘wet weather event’ category, for the purpose of this investigation, as a minimum of 10 mL of rainfall during a one hour period. We carried out sampling within 10 hours of this trigger being reached.
2.5 Discrete water sampling We collected discrete water samples following the 4Sight Water Quality Sampling Guidelines for Incident Management (4Sight 2017). We collected samples from the upper catchment site first followed by the mid-catchment site and lastly at the stream mouth. For spring and neap tide events, we collected samples approximately one hour after high tide when sampling at each stream mouth. We used sterile 400 mL bottles to collect water samples for microbiological analyses (E. coli, enterococci, and faecal source tracking) and a 1 L plastic bottle to collect water for all other parameters. We placed water samples on ice immediately after collection and delivered them to Hill Laboratories in Hamilton within 24 hours of collection. We measured water salinity onsite using a handheld instrument (YSI ProDSS) at the stream mouth sampling locations to direct the laboratory to the appropriate water analyses (methods differ for fresh and marine samples).
2.5.1 Water quality measurements Field staff used hand-held instruments (YSI ProDSS) to measure water temperature, dissolved oxygen, pH and conductivity/salinity at all sites. Salinity readings provide information about the

Doc # 10722859 Page 5
proportion of freshwater and oceanic water at the stream mouth sites and, at times, mid-catchment sites that are tidally influenced. The laboratory analysed each water sample for a range of parameters, including suspended sediment, nutrients, and faecal bacteria. Method details and detection limits are available in Appendix 2.
2.6 Faecal source tracking The high cost of faecal source tracking restricted us from analysing all samples collected in this investigation. Instead, the laboratory filtered all water samples (0.54 μm), added a buffering agent to preserve the integrity of the sample, and froze them. This allowed us to carry out faecal source tracking at the end of the sampling period and only on samples that exceeded the recreational water quality guidelines (>550 E. coli per 100 mL or >280 enterococci per 100 mL). Selected samples were analysed for the following DNA markers to identify the source of faecal contamination:
• human; • avian (ducks, swans, seagulls, geese, and chickens); • ruminant (cows, sheep, goats, and deer); and • possum.
The laboratory also tested more specifically for cow and sheep markers in samples with high ruminant marker concentrations.
2.6.1 Interpreting FST results In some situations, the markers used for faecal source tracking cross-react with other contaminant sources causing a false-positive result. This is the case for the primary human marker which can cross-react with faecal material primarily from possums but also some other animals. To mitigate this, the laboratory analysed two separate human markers and would only confirm the presence of human sources if both markers were detected. This is particularly an issue in catchments with large areas of native bush, such as the catchments monitored in this investigation. Results, therefore, need to be interpreted with caution so as not to assume a human source of contamination when the source could potentially be of possum origin. This is further discussed in the Results and Discussion section of this report.
2.7 Guideline values We use a variety of water quality parameters as indicators of ‘ecological health’ or suitability for contact recreation (Table 1). The 2003 Ministry of Health and Ministry for the Environment recreational water quality guidelines1 recommend measuring faecal bacteria to indicate the suitability of the water for human contact recreation (e.g., swimming, surfing, or wading; Table 2). In freshwater, we measure the levels of E. coli and in marine waters we measure enterococci. Measuring different indicator bacteria in fresh and marine waters makes it difficult to fairly compare results between upper catchment sites (fresh) and stream mouth sites (marine). The recreational water quality guidelines recommend against measuring enterococci in freshwater as these bacteria are more likely to originate from natural sources such as decaying leaf matter than E. coli. For this reason, and to enable a fair comparison between all sites along the stream, we used E. coli concentrations to indicate the suitability for contact recreation at all sites, including the stream mouth. We checked for any discrepancies using this approach by looking
1 http://www.mfe.govt.nz/fresh-water/tools-and-guidelines/microbiological-guidelines-recreational-water

Page 6 Doc # 10722859
at whether marine samples that exceeded the recreational water quality guideline for E. coli similarly exceeded the recreational water quality guideline for enterococci. Table 1: Water quality parameters, their relevance, and the guideline value used to assess the
current environmental state for freshwater. Where applicable, guideline values for ecological health and contact recreation parameters were obtained from WRC guidelines2. Where WRC had no guideline, ANZECC guidelines3 were used for ecological health parameters and the recreational water quality guidelines4 for contract recreation parameters.
Water quality variable Relevance Guideline value Unit
Ecological health
Dissolved oxygen saturation Oxygen for aquatic animals to breathe
Upper limit: 110 Lower limit: 80
%
Turbidity Can restrict plant growth 10 NTU
Total nitrogen Can cause nuisance plant growth 0.5 g/m3
Nitrate-N + nitrite-N Can cause nuisance plant growth 0.04 g/m3
Total ammoniacal-N Can be toxic to fish 0.88 g/m3
Total phosphorous Can cause nuisance plant growth 0.04 g/m3
Dissolved reactive phosphorus (DRP)
Can cause nuisance plant growth 0.02 g/m3
Contact recreation
E. coli Human health 550 cfu/100 mL
Table 2: Trigger levels for E. coli in freshwater from the recreational water quality guidelines3.
Highly likely to be uncontaminated (green) (<260 E. coli/100 mL)
Potentially contaminated (amber) (260–550 E. coli/100 mL)
Highly likely to be contaminated (red) (>550 E. coli/100 mL)
3 Results and Discussion 3.1 Trends observed across all catchments
In this section, we present the key findings from this investigation. More detailed descriptions of the results are presented in Appendix 1 and analytical results in Appendix 3.
3.1.1 E. coli concentrations were highest after rainfall The main observation from this investigation was that E. coli concentrations were highest during rainfall events (Figure 3). It’s common to see elevated levels of faecal contaminants during and after rainfall in all types of water as contaminants are flushed off the land and into nearby waterways. We can, therefore, conclude that the highest risk to recreational water users would be after heavy rain at all sites.
2 https://www.waikatoregion.govt.nz/environment/natural-resources/water/rivers/healthyrivers/how-we-measure-quality/ 3 http://www.mfe.govt.nz/publications/fresh-water/anzecc-2000-guidelines 4 http://www.mfe.govt.nz/fresh-water/tools-and-guidelines/microbiological-guidelines-recreational-water

Doc # 10722859 Page 7
Figure 3: Average catchment E. coli concentrations during dry and wet weather conditions. Of the two wet weather events we sampled, E. coli concentrations were highest at most sites on the second wet weather event at all sites and catchments. The likely cause of this was the greater amount of rainfall in the preceding 24 hours before sampling on the second occasion than on the first (27 mm of rain in 24 hours preceding to sampling event one cf. 61 mm of rain in 24 hours preceding sampling event two). A second contributing factor may have been the large amounts of rainfall that were received in the Coromandel throughout the month of March between the two sampling events (10 February – 25 March). High rainfall during this time may have saturated soils throughout the Coromandel, reducing the ability of the soil to absorb further rainfall. This, in turn, may have increased the amount of runoff from the land and ultimately increased the amount of faecal contaminants washed into the waterways.
3.1.2 E. coli concentrations were influenced by land use Each of the catchments had similar land use in that the upper catchment was in native bush or forest, the mid catchment was pastoral land and nearest the coast was small urban development. Each of these land uses has typical sources of faecal contamination. For example, the most likely sources of faecal contamination in native or exotic bush are possums and birds; for pastoral land, the most likely sources of faecal contaminants are ruminant animals. Sources of faecal contamination near urban areas are most likely to be from birds that inhabit reserves, coastal vegetation and intertidal areas, and potentially human sources from faulty wastewater systems and infrastructure. Point source discharges relating to individual consents for discharges of contaminants can also be potential contamination sources. Maps identifying current consents in each catchment are presented in Appendix 4. When considering concentrations of E. coli in each catchment in relation to the surrounding land uses, results indicated that E. coli levels were highest in the pastoral land areas, particularly during dry weather events (see Figure 4). This indicates that pastoral land use is potentially contributing the largest portion of E. coli to the streams. This is reflected in the contaminant loads (presented in Appendix 6) calculated for all sites, which were generally larger in the pastoral sites than at the bush and urban sites. Statistical analyses showed that E. coli concentrations were statistically significantly higher at pastoral sites than at bush and urban sites during dry weather. There was no statistical difference between E. coli concentrations at any land use during wet weather, however, the mean E. coli concentration at pastoral and
Page 8 Doc # 10722859
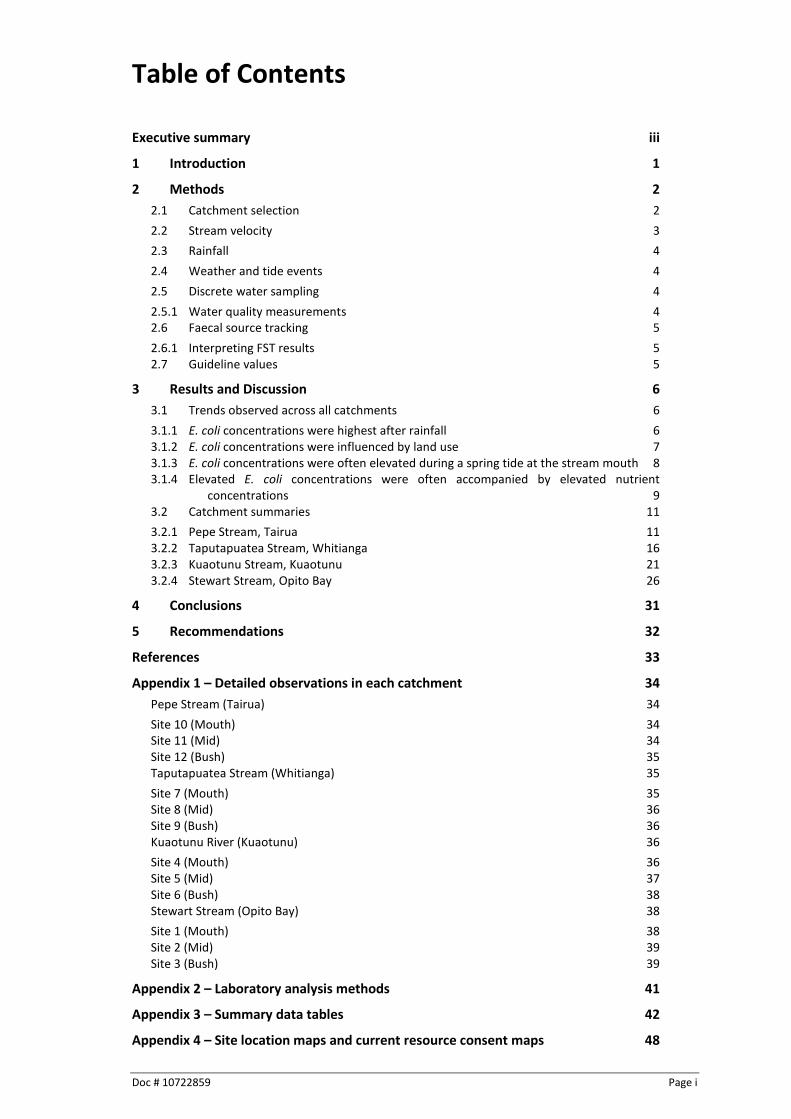
stream mouth sites was substantially greater (~8000 cfu/100 mL) than at bush sites (~5000 cfu/100 mL).
Figure 4: Average E. coli concentrations for all catchments at bush, pastoral, and stream mouth
sites during wet and dry weather events. E. coli levels at the bush sites were always lower than at the other sites. We also found E. coli levels to be elevated at the stream mouth (urban) locations above those found in the bush sites. This indicates that contamination accumulation is taking place down the length of the stream, followed by tidal flushing and dilution of contaminants at the stream mouth sites. However, despite the potential for the dilution of contaminants at the stream mouth sites, these sites can still pose the highest risk to human health overall. This is because the overall risk of a site is a combination of the concentration of a contaminant in the water, combined with the likelihood of human exposure to that water. Since the stream mouth sites are most used by people for recreational activities, they tend to present the highest human health risk overall, even if the concentrations of contaminants are higher in the mid or upper catchment. These sources of contaminants are based on the location within the catchment and are dependent on our pre-selected sampling locations. To better understand the potential human or animal sources of these contaminants, we also used FST, which is discussed in Section 3.2.
3.1.3 E. coli concentrations were often elevated during a spring tide at the stream mouth On most sampling occasions at the stream mouth, E. coli concentrations were higher during a spring tide than they were during a neap tide (Figure 5). The greatest difference between the water levels at high and low tide is during a spring tide. It’s during this time that low-lying land surrounding the waterway is most likely to be flooded, washing contaminants into the water. Two potential sources of faecal contamination in these low-lying areas are 1) grass-covered reserves and 2) septic tanks and irrigation fields.

Doc # 10722859 Page 9
Figure 5: E. coli concentrations at stream mouth sampling locations during spring and neap tides
for each catchment. In each of the four catchments, there is a grass-covered reserve area near the stream mouth that is often populated by birds and is also a popular location for visitors and locals to walk their dogs. The contaminants from these animals may accumulate on the land during dry periods and then be washed into the nearby waterway after rainfall or flooding, temporarily increasing the levels of faecal contaminants. FST identified avian faecal markers at times, but they were not substantially higher during spring tides than they were on other occasions. In the previous 2015 snapshot, dog markers weren’t identified by FST so were not run on this occasion. Human markers were only identified on one occasion at each of Taputapuatea and Kuaotunu Streams and at levels that were below the FST limit of quantification; that is, FST identified the presence of both human markers but was not able to assign it a value because of its low concentration. This indicates that it is unlikely that septic tanks and irrigation fields were a major source of faecal contamination on these sampling occasions. Such low levels of faecal contaminants from dogs (previously), birds, and humans indicates that, in this situation, the effect from these sources is lower than the FST approach was able to detect. This also implies that the primary source of faecal contamination at the stream mouth is from upstream.
3.1.4 Elevated E. coli concentrations were often accompanied by elevated nutrient concentrations During wet weather sampling, when E. coli concentrations were elevated, nutrient concentrations were also elevated (Figure 6). The most likely reason for this is that the main source of faecal contamination is from runoff, which typically has elevated nutrient concentrations. Rainfall and flooding of low-lying land wash accumulated contaminants (e.g., faecal bacteria and nutrients) into the surrounding waterways. Common sources of these contaminants include the excess application of fertilizers or effluent to land.

Page 10 Doc # 10722859
Figure 6: Total nitrogen concentration vs E. coli concentration during wet and dry weather events.
The line of best fit through the data is shown for wet weather sampling (R2 = 0.4).

Doc # 10722859 Page 11
3.2 Catchment summaries 3.2.1 Pepe Stream, Tairua 3.2.1.1 Bush site observations
Figure 7: Pepe Stream – Bush site (Site 12). The bush site of Pepe Stream was fenced off and was well shaded by the bush canopy cover. The water at this site was visually significantly clearer than the other sites in the catchment with minimal suspended sediment observed on each monitoring occasion. This site also had the highest flow rate of all the sites in all four catchments that we monitored in this investigation. E. coli concentrations were within the recreational water quality guidelines during dry weather sampling. We did, however, see elevated levels of E. coli after rainfall that exceeded the recreational water quality guidelines. Faecal source tracking showed that possums were one of the likely sources of E. coli.

Page 12 Doc # 10722859
3.2.1.2 Pastoral site observations
Figure 8: Pepe Stream – Pastoral site (Site 11). The pastoral site in Pepe Stream was fenced off and had some riparian planting along the stream bank. This site was located in the middle of a dairy farm with cows always being nearby. This site was tidally influenced and slow flowing, sometimes with water flowing back upstream on an incoming tide. The water at this site was generally murky with visible suspended sediment and lower clarity than the other two sites in the catchment on all sampling occasions. The concentrations of E. coli were higher at this location than they were at the upstream bush site as contaminant sources are introduced by the surrounding pastoral land. Faecal source tracking showed birds and possums to be the main contaminant source during dry weather and ruminant animals, specifically cows, to be the main contaminant during wet weather. This is not surprising given the surrounding dairy farm, despite the area being planted and fenced off, and the current resource consent to discharge farm animal effluent to land associated with the property (see Appendix 4).

Doc # 10722859 Page 13
3.2.1.3 Urban (stream mouth) site observations
Figure 9: Pepe Stream – Urban (stream mouth) site (Site 10). At the stream mouth sampling site of Pepe Stream (urban site), we saw that the stream itself and the surrounding reserve area were always popular recreation areas. We saw children swimming in the stream in both dry and wet weather conditions, with families picnicking on the stream banks or using the adjacent playground. The site was also popular with dog walkers and inhabited by many birds (seagulls and ducks) on each visit. This site differs to the other stream mouth sites in that there is a small tidal inlet between the pastoral site and the stream mouth site. This will influence the results as there is greater potential for dilution by the incoming and outgoing tide. E. coli concentrations decreased at the stream mouth from the pastoral site, likely due to the increased dilution and tidal flushing taking place at this site (Figure 10). E. coli levels were relatively low during dry weather, however, they increased to exceed the recreational water quality guidelines after rainfall on both sampling occasions (Figure 11). FST identified a mixture of sources of contaminants after rainfall including ruminant animals, birds and possums (Table 3). The ruminant sources were the most dominant source of contamination as a result of the upstream dairy farming activities. E. coli concentrations were higher during spring tides than they were during neap tides. This is likely due to the increased inundation of the surrounding reserve areas that can happen during these larger tides. Any addition of faecal bacteria from birds was not substantial enough to be detected by FST (Table 3). A second potential source could be from dogs, however, given that no canine markers were tested for in this investigation, we can only speculate. The previous survey in 2015 found no identifiable canine markers so it’s unlikely that faecal contamination from dogs at this location is a significant issue. Another contributing factor could be the formation of a salt plug at the stream mouth, where the larger volume of seawater moving into the stream mouth that occurs during a spring tide can trap or limit freshwater outputs causing contaminants to accumulate in the estuary (Shaha et al. 2016; Walanski 1986).

Page 14 Doc # 10722859
3.2.1.4 Summary Overall water quality in the Pepe Stream catchment was highest in the upper catchment (bush) and lowest in the mid catchment, pastoral site. Water quality in this catchment was heavily affected by rainfall, with all sites exceeding the recreational water quality guidelines on all wet weather sampling occasions. Table 3: Frequency of exceedances of the recreational water quality guidelines in the Pepe Stream
Catchment, Tairua.
Figure 10: Concentrations of E. coli in all sample locations in the Pepe Stream catchment for two wet
weather events and two dry wet weather events.

Doc # 10722859 Page 15
* Results were too low to be visualized on the graph (mean value = 2 cfu/100 mL) Figure 11: Average concentrations of E. coli across the Pepe Stream catchment for all sample event
types.

Page 16 Doc # 10722859
3.2.2 Taputapuatea Stream, Whitianga 3.2.2.1 Bush site observations
Figure 12: Taputapuatea Stream – Bush site (Site 9). The bush site of Taputapuatea Stream is located down a steep bank covered with mostly rank grass5. The stream is located next to a farm where several cows were observed on most sampling occasions. The stream at this site was soft-bottomed and sediment stirred up easily, however, when undisturbed, the water clarity was high. The site was clear of debris and had some undercut banks supported by tree roots. The water at this site was relatively slow flowing and of overall high quality. E. coli concentrations were within the recreational water quality guidelines during dry weather sampling, however, exceeded the recreational water quality guidelines on both wet weather sampling occasions. FST showed the likely sources of E. coli to be dominated by ruminant animals (cows), with some possum and avian sources as well in all samples tested.
5 A collective term for grasses that have been left to grow out of control without cutting or weed management
Doc # 10722859 Page 17
3.2.2.2 Pastoral site observations
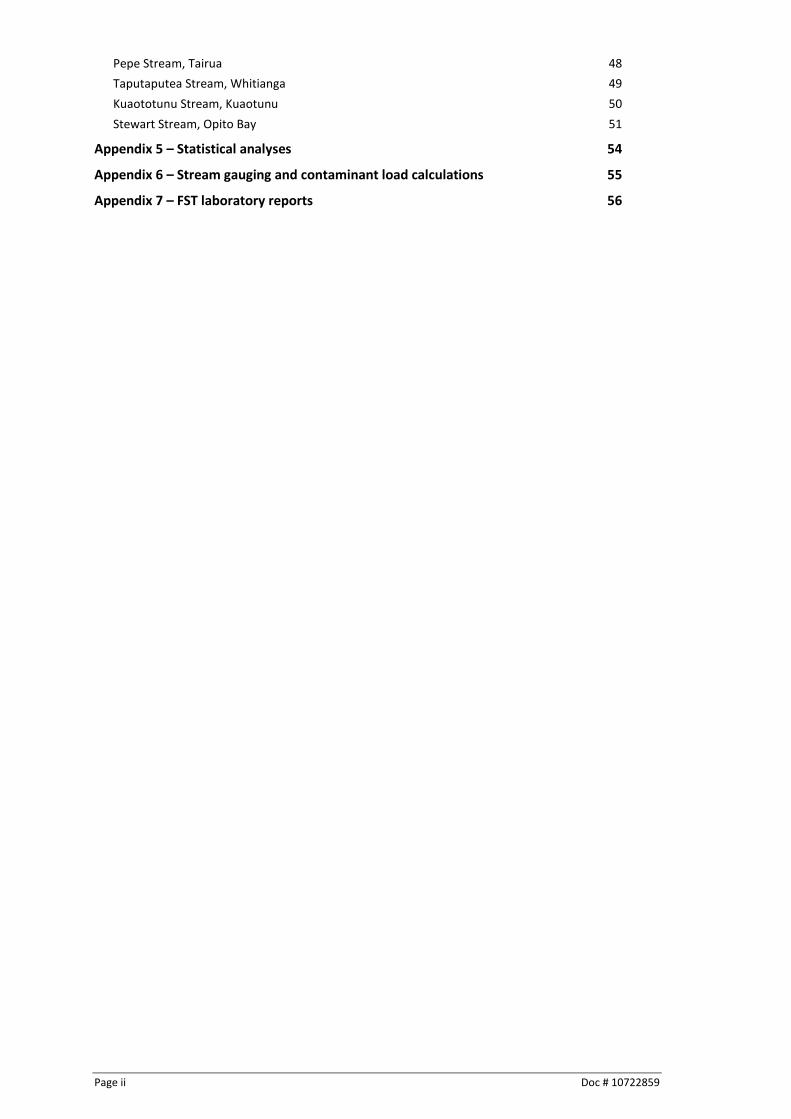
Figure 13: Taputapuatea Stream – Pastoral site (Site 8). The mid-catchment site (pastoral site) of Taputapuatea Stream is located along a public walkway between the edge of the bush and the residential properties on the edge of the Whitianga Township. A margin of riparian planting with a width of at least 5 m borders the stream bank, which was waterlogged on the majority of sampling occasions. The site is tidally influenced and had poor clarity with visible suspended sediment on all occasions. We saw ducks in the stream on multiple sampling occasions. The concentrations of E. coli were higher at this location than they were at the bush site as contaminant sources were introduced by the surrounding pastoral land. However, like the bush site, E. coli concentrations did not exceed the recreational water quality guidelines during dry weather. Exceedances occurred after rainfall with ruminant animals being identified as the main source of faecal contamination. One wet weather sample also identified possible avian and possum sources as well.

Page 18 Doc # 10722859
3.2.2.3 Urban (stream mouth) site observations
Figure 14: Taputapuatea Stream – Urban (stream mouth) site (Site 7). The stream mouth sampling site of Taputapuatea Stream (urban site) is a popular recreation area and is adjacent to a large reserve area with a boardwalk. The stream mouth itself was popular with children swimming and wading, kayakers, and stand-up paddle boarders. We also saw people walking their dogs along the path in both dry and wet weather conditions and there were many seagulls (30+) sitting on the banks of the stream or in the water on each site visit. There was a slight exceedance of the recreational water quality guidelines on the first wet weather sampling occasion and a substantial exceedance on the second wet weather sampling occasion (Figure 15). FST indicated ruminant sources, with possible possum and avian sources as well (Table 4). We also saw a small increase in E. coli concentrations (but no exceedance of the recreational water quality guidelines) during the second spring tide sampling event that took place after heavy rainfall (Figure 16). FST indicated very weak potential human sources. Given the extensive amount of rain that occurred prior to this spring tide sampling occasion and the saturation of local soils that occurred, there is a possibility that the increased volumes of stormwater could have resulted in overflows from wastewater networks into the stormwater system, potentially contributing human sources of bacteria. E. coli concentrations were, on average, higher during a spring tide than during a neap tide. This is likely due to the tidal inundation of the surrounding reserve areas washing the contaminants into the waterway.
3.2.2.4 Summary Overall, water quality in the Taputapuatea Stream catchment was highest in the upper bush catchment and lowest in the mid catchment, pastoral site. Water quality in this catchment was heavily affected by rainfall, with all sites exceeding the recreational water quality guidelines on all wet weather sampling occasions.

Doc # 10722859 Page 19
Table 4: Frequency of exceedances of the recreational water quality guidelines in the Taputapuatea Stream Catchment, Whitianga.
Figure 15: Concentrations of E. coli in all sample locations in the Taputapuatea Stream catchment
for two wet weather events and two dry wet weather events.

Page 20 Doc # 10722859
Figure 16: Average concentrations of E. coli across the Taputapuatea Stream catchment for all
sample event types.

Doc # 10722859 Page 21
3.2.3 Kuaotunu Stream, Kuaotunu 3.2.3.1 Bush site observations
Figure 17: Kuaotunu Stream – Bush site (Site 6). The upper catchment (bush site) of Kuaotunu Stream is next to the main road down a steep bank. Large trees line the stream bank providing a good amount of shade. The stream has a stony bottom with slightly faster flow rates than the other sites. The water at this site was of high clarity. We also saw riffles at this site, which likely contributed to the high levels of dissolved oxygen in the water on all sampling occasions. E. coli concentrations exceeded the recreational water quality guidelines once on a dry sampling occasion and after both rainfall events. FST showed ruminant animals to be the dominant source with a small contribution from avian sources in the dry sample. Additionally, FST identified possum sources in the wet samples.

Page 22 Doc # 10722859
3.2.3.2 Pastoral site observations
Figure 18: Kuaotunu Stream – Pastoral site (Site 5). The mid-catchment site (pastoral site) was on the Waitaia Stream, a tributary of the Kuaotunu Stream. On two occasions, we observed small amounts of food waste (mostly oranges and fish carcases) in the stream. Regenerating bush lined the stream banks providing good shade. The water was very shallow at this site and the stream was slow flowing. Water clarity was significantly better at this site than at pastoral sites in other catchments. Unlike the other pastoral sites monitored, this site was not tidally influenced. In the other catchments, the pastoral site was located on the main stream just before the town, however, in this catchment, the site was located on a tributary of the main stream and was surrounded by residential properties E. coli concentrations exceeded the recreational water quality guidelines on one dry occasion and on both wet weather occasions. Possum was the main source identified with possible avian sources in dry weather. Ruminant animals were identified during wet weather. This catchment has the largest percentage of land use occupied by bush, it is therefore not surprising that we would see possum as a dominant source of contamination in this catchment (see Appendix 4).
Doc # 10722859 Page 23
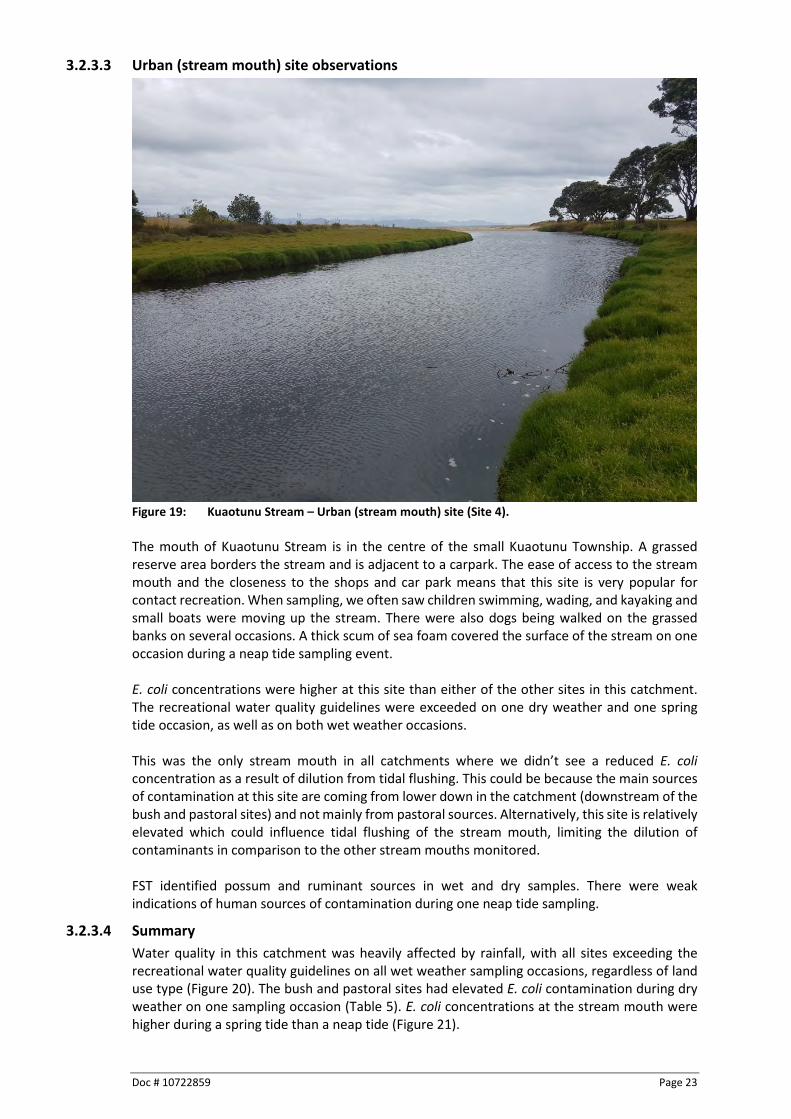
3.2.3.3 Urban (stream mouth) site observations
Figure 19: Kuaotunu Stream – Urban (stream mouth) site (Site 4). The mouth of Kuaotunu Stream is in the centre of the small Kuaotunu Township. A grassed reserve area borders the stream and is adjacent to a carpark. The ease of access to the stream mouth and the closeness to the shops and car park means that this site is very popular for contact recreation. When sampling, we often saw children swimming, wading, and kayaking and small boats were moving up the stream. There were also dogs being walked on the grassed banks on several occasions. A thick scum of sea foam covered the surface of the stream on one occasion during a neap tide sampling event. E. coli concentrations were higher at this site than either of the other sites in this catchment. The recreational water quality guidelines were exceeded on one dry weather and one spring tide occasion, as well as on both wet weather occasions. This was the only stream mouth in all catchments where we didn’t see a reduced E. coli concentration as a result of dilution from tidal flushing. This could be because the main sources of contamination at this site are coming from lower down in the catchment (downstream of the bush and pastoral sites) and not mainly from pastoral sources. Alternatively, this site is relatively elevated which could influence tidal flushing of the stream mouth, limiting the dilution of contaminants in comparison to the other stream mouths monitored. FST identified possum and ruminant sources in wet and dry samples. There were weak indications of human sources of contamination during one neap tide sampling.
3.2.3.4 Summary Water quality in this catchment was heavily affected by rainfall, with all sites exceeding the recreational water quality guidelines on all wet weather sampling occasions, regardless of land use type (Figure 20). The bush and pastoral sites had elevated E. coli contamination during dry weather on one sampling occasion (Table 5). E. coli concentrations at the stream mouth were higher during a spring tide than a neap tide (Figure 21).

Page 24 Doc # 10722859
There were large pH fluctuations throughout the Kuaotunu Stream catchment. The saturation of dissolved oxygen in the water was significantly lower at Kuaotunu’s pastoral site than in the other two sites in this catchment, most likely due to the shallowness of the water and the slow flow of the water at this site in comparison to the other pastoral sites. Table 5: Frequency of exceedances of the recreational water quality guidelines in the Kuaotunu
Stream Catchment, Kuaotunu.
Figure 20: E. coli concentrations at all sample locations in the Kuaotunu Stream catchment for two
wet weather events and two dry wet weather events.

Doc # 10722859 Page 25
Figure 21: Average concentrations of E. coli across the Kuaotunu Stream catchment for all sample
event types.

Page 26 Doc # 10722859
3.2.4 Stewart Stream, Opito Bay 3.2.4.1 Bush site observations
Figure 22: Stewart Stream – Bush site (Site 3). The upper catchment (bush site) of Stewart Stream was fenced off and well shaded by bush canopy cover. The stream was shallow and relatively slow flowing, well oxygenated, and temperatures were always within acceptable ranges. Water clarity was also higher than the other sites in the catchment. The site was down a steep bank and had a riparian margin of approximately 2 m on the fenced side and the other stream bank was bordered by native bush. E. coli concentrations exceeded the recreational water quality guidelines only after rainfall. FST was carried out on one wet and dry sample, however, no sources faecal were detected. This indicates that the contamination was not likely to be from a fresh faecal source.

Doc # 10722859 Page 27
3.2.4.2 Pastoral site observations
Figure 23: Stewart Stream – Pastoral site (Site 2). The mid-catchment site (pastoral site) of Stewart Stream is in the middle of a sheep and beef farm, with cows being observed close by on all site visits. The majority of the stream is well fenced off which inhibited stock access to the stream. The water at this site was noticeably coloured with dissolved organic matter and had poor clarity on each sampling occasion. This site has no riparian margin or shading. This lack of shading combined with the slow flow meant that the water temperature was always very high, especially during the dry weather sampling occasions. The site had the lowest measured dissolved oxygen saturation of all sites in this investigation. The low flow and high water temperatures are likely key factors influencing the amount of oxygen dissolved in the water. E. coli concentrations increased from the bush site upstream as new contaminant sources are introduced by the surrounding pastoral land. E. coli concentrations exceeded the recreational water quality guidelines on one dry sampling day as well as on both rainfall occasions. FST showed ruminant sources to be dominant with small inputs from birds during dry weather.

Page 28 Doc # 10722859
3.2.4.3 Urban (stream mouth) site observations
Figure 24: Stewart Stream – Urban (stream mouth) site (Site 1). At the stream mouth sampling site of Stewart Stream (urban site), the stream itself and the surrounding reserve area were popular with campers and kayakers. There were no dogs present on any site visits, but there were ducks on occasion and large groups of seagulls sitting on the sandbar at the far end of the stream mouth on most sampling occasions. We also saw dotterels on several occasions on the sand bar. A riparian margin of flaxes provided a small buffer zone and also limited access to the stream banks on one side. E. coli concentrations were lower at the stream mouth than they were at the pastoral site. This is likely a result of the tidal flushing at this site. E. coli concentrations exceeded the recreational water quality guidelines on one dry sampling occasion, both wet weather occasions, and during both spring tides. FST identified ruminant sources in the wet weather samples but at levels inconsistent with fresh inputs, that is, E. coli concentrations were relatively high, but FST results were low.
3.2.4.4 Summary Overall, water quality in the Stewart Stream catchment was highest in the upper catchment (bush) and lowest in the mid catchment, pastoral site (Figure 25). The stream mouth site was also more highly oxygenated than the other stream mouth sites. As with the other catchments, all sites were highly influenced by rainfall, with concentrations of E. coli exceeding the recreational water quality guidelines on both wet weather sampling occasions (Table 6, Figure 26).

Doc # 10722859 Page 29
Table 6: Frequency of exceedances of the recreational water quality guidelines in the Stewart Stream Catchment, Opito Bay.
Figure 25: E. coli concentrations in all sample locations in the Stewart Stream catchment for two wet
weather events and two dry wet weather events.

Page 30 Doc # 10722859
Figure 26: Average E. coli concentrations across the Stewart Stream catchment for all sample event
types.

Doc # 10722859 Page 31
4 Conclusions The more we investigate the state of water quality in our coasts and estuaries, the more opportunities there are to identify water quality issues, particularly excess nutrients, sediment, and bacteria. The sources of these contaminants are rarely derived within the estuaries themselves; in most cases, we need to identify diffuse sources in the catchment that are flushed into estuaries via streams and rivers following rainfall or during the flooding of low-lying land caused by spring tides, using approaches and techniques such as those used in this investigation. Overall, the findings from this report provide clear evidence that reinforces our understanding of faecal contamination in waterways — faecal bacteria are highest following rainfall and, to a lesser extent at stream mouths, during spring tides. The levels of faecal bacteria are also influenced by the surrounding land use. The uniqueness of this investigation in the Waikato region is in its approach: combining event-based sampling along a stream to isolate sub-catchments and land use, water quality measurements, and faecal source tracking. This approach provides results that point clearly towards how the levels of faecal bacteria are influenced by rainfall, tides, and the surrounding land use. This can guide catchment management actions towards the most efficient use of resources to address the issues around diffuse contaminant sources entering waterways. In this study, water quality was typically best in the upper bush catchment sites. Following heavy rainfall, however, these bush sites typically had faecal bacteria concentrations that exceeded the recreational water quality guidelines, which means they were unsuitable for swimming during these times. This was somewhat surprising considering the absence of human activities upstream. During wet weather, we typically measured the greatest increase in faecal bacteria between the upper-catchment bush site and the mid-catchment pastoral site. The levels of faecal bacteria were often lower at the stream mouth sites than at the pastoral sites. This indicates that the greatest source of faecal contamination in these catchments during rainfall was the pastoral land. This is despite the majority of stream banks being fenced off from stock and well planted, as is best farming management practice. All contaminants introduced into the waterway, regardless of their source within the catchment, will eventually make their way via the stream mouth and out to the ocean. This makes the stream mouth particularly susceptible to elevated contaminant levels. It’s important for Council to remain aware of the water quality at these stream mouth locations because are they are popular swimming locations, particularly with young children and families. Furthermore, it may be necessary to have a greater public awareness of the risks of swimming in our coastal waters following heavy rainfall.

Page 32 Doc # 10722859
5 Recommendations The approach of combining event-based sampling at multiple locations along the stream and conducting water quality analyses and faecal source tracking has provided results that are suitable for informing potential catchment management actions if deemed necessary. This is an improvement on the findings presented in the 2015 snapshot report, which identified water quality issues in the stream mouths, at times, but was not able to narrow down the many potential sources of contaminants within the catchment. There are, however, a few limitations with this approach that could be improved with the further development of faecal source tracking methods. At this stage, it’s not possible to compare faecal source markers with each other; that is, it’s not possible to determine the proportion of faecal contamination that was contributed by different animals or whether one animal has contributed more than another. This makes it difficult to address the question of which animals are responsible for the greatest amount of faecal contamination in our waterways using the FST approach on its own. This reinforces the need to implement a strategic sampling design and use multiple approaches to build a picture of what is happening. There have been recent developments with the ruminant marker such that results can be placed into one of three categories to describe the percentage contribution of ruminant faecal bacteria relative to the total amount. Where possible, the laboratory reported the numerical value of the ruminant marker and then categorised the result as <1%, 1–50%, or 50–100% of the total faecal bacteria. Reporting results in this way makes it very simple to communicate. Extending this type of reporting to other markers would be highly valuable, especially the human marker(s). A limitation of the FST approach that still exists since the 2015 investigation is that brushtail possums and, to a lesser extent, a few other animals, cause false-positives for the primary human marker. This is particularly an issue in catchments with large proportions of native bush such as those found throughout the Coromandel. In this study, the laboratory tested for two human markers and only confirmed a potential human source if both markers were detected. This can make communicating results more complex as the more sensitive human marker is consistently detected, likely because of the number of possums (and other animals that can trigger this marker) in the catchments of interest. Furthermore, this also reduces the sensitivity for detecting human sources as the second human marker is less sensitive than the first. The risk to human health from faecal contamination in the water is dependent on the source of the contamination. For example, the risk to human health is greater from ruminant animal or human faecal sources than it is from bird or pig faecal sources (Soller et al. 2010). This could mean that even though faecal bacteria levels exceeded the recreational guideline values at the bush sites after rainfall, there is a possibility that the risk to human health was less than the guidelines suggest. If the levels of faecal contamination coming out of native/exotic bush become problematic or of concern to the community, further investigation should be carried out to determine whether the recreational water quality guideline values for E. coli are representative of actual risk to human health. The approach used in this study is suitable for targeted investigations to provide clear information about where contamination is coming from within a catchment and what the contaminant sources are likely to be. The high cost of this approach, however, will limit the frequency that it can be applied. Continued development of the faecal source tracking capabilities will further increase the specificity of the results. This will enable clearer guidance to catchment managers to assess the source and extent of contaminants that are detected in our coastal stream mouths at times.

Doc # 10722859 Page 33
References 4Sight 2017. Water sampling guidelines for incident management: A guide for incident
responders in the field. Auckland, 4Sight Consulting Ltd. ANZECC 2000. Australian and New Zealand guidelines for fresh and marine water quality,
volume 1: The guidelines. Australian and New Zealand Environment and Conservation Council. Agriculture and Resource Management Councils of Australia and New Zealand, Canberra, Australia.
Ministry for the Environment; Ministry of Health 2002. Microbiological water quality guidelines
for marine and freshwater recreational areas. Wellington, Ministry for the Environment and Ministry of Health.
Ministry for the Environment 2014. National policy statement for freshwater management.
Wellington, Ministry for the Environment. Shaha D, Cho, Y 2016. Salt plug formation caused by decreased river Discharge in a multi-channel
estuary. Nature Scientific Reports 6: Article number: 27176. Soller JA, Schoen ME, Bartrand T, Ravenscroft JE, Ashbolt NJ 2010. Estimated human health risks
from exposure to recreational waters impacted by human and non-human sources of faecal contamination. Water Research 44: 4674–4691.
Wilson P 2016. Snapshot of coastal stream mouth water quality in the Coromandel area
(January/February 2015). Waikato Regional Council Technical Report 2016/07. Hamilton, Waikato Regional Council.
Wolanski E 1986. An evaporation-driven salinity maximum zone in Australian tropical estuaries.
Estuarine, Coastal and Shelf Science 22: 415–424.
Page 34 Doc # 10722859
Appendix 1 – Detailed observations in each catchment Pepe Stream (Tairua) Site 10 (Mouth) Overall, the water was one of the best oxygenated out of all the sites monitored. Nutrient concentrations in the water were within ANZECC guidelines but the site was susceptible to E. coli concentrations that exceeded the recreational water quality guidelines after rainfall and during spring tides weather. Two main reasons for increases in faecal bacteria have been identified. The first being contributions from the bush with possum and avian sources, and a second more dominant source being ruminant sources from the pastoral land use in the mid catchment.
Physical parameters The temperature at this site was generally warm (19–26°C) and strongly influenced by the nearby ocean (high salinity). The water was well oxygenated on all sampling occasions. pH levels were below the ANZECC guideline levels on one wet weather monitoring occasion.
Microbiological parameters E. coli levels were very low during times of dry weather but increased to exceed the recreational water quality guidelines after rainfall, where concentrations of E. coli were up to 18 times greater than the recreational water quality guideline value. MST analysis found a mixture of sources of contaminants after rainfall including birds and possums, but ruminant sources were the most dominant source of contamination at 50–100% contribution. The influence of neap and spring tides on concentrations of E. coli at the stream mouth was also apparent, with E. coli levels more likely to be higher during a spring tide than a neap tide. This could be due to the increased tidal inundation of the surrounding reserve areas that can happen during these larger tides
Nutrients All nutrient concentrations were within the ANZECC guidelines during wet weather sampling. Some minor exceedances of ammoniacal-N and TSS occurred during dry weather conditions but concentrations were within ranges that are unlikely to cause any adverse effects (e.g., nuisance algae growth).
Site 11 (Mid) Overall the water quality at this site was moderate during dry weather and poor during wet weather. There were particularly large increases in faecal bacteria during rainfall, mostly attributed to ruminant sources.
Physical parameters The water temperature at this site was fairly consistent, ranging from 18–22°C. Salinity was generally high at this site as well due to the tidal influence. The dissolved oxygen saturation fell just below 80% on one wet weather occasion but otherwise, oxygenation was well above 80% on all other occasions. pH also exceeded the ANZECC guidelines after one rainfall event.
Microbiological parameters The measured E. coli concentration exceeded the recreational water quality guidelines on three out of four sampling occasions. The two greatest exceedances (up to~40 times greater than the guideline value) were following rainfall. Faecal source tracking showed birds and possums (10–50%) to be the main contaminant source during dry weather and ruminant animals (50–100%) during wet weather.

Doc # 10722859 Page 35
Nutrients Minor exceedances of nitrate-N + nitrite-N, Dissolved reactive phosphorus and ammoniacal-N were noted during dry weather sampling. Nitrate-N + nitrite-N concentrations were also elevated during wet weather sampling.
Site 12 (Bush) Overall, the water quality at this site was high. Elevated levels of E. coli were only seen during heavy rainfall, which is to be expected in these water types.
Physical parameters The water at this site was always well oxygenated (>80 %) and the water temperature was always within acceptable ranges. On one occasion after heavy rainfall, the pH exceeded the ANZECC guideline value.
Microbiological parameters E. coli concentrations were within the recreational water quality guidelines during dry weather sampling. E. coli concentrations only exceeded the recreational water quality guidelines following rainfall (up to ~10 times greater than the guideline value). Faecal source tracking showed the likely source of the increased E. coli to be from possums
Nutrients Nutrient levels were all within ANZECC guidelines on all sampling occasions.
Taputapuatea Stream (Whitianga) Site 7 (Mouth) Overall, the water was well oxygenated at this site. Nutrient levels tended to be elevated at this site especially after rainfall and the site was susceptible to E. coli concentrations that exceeded the recreational water quality guidelines in dry and wet weather conditions.
Physical parameters Dissolved oxygen at this site was generally good and exceed 80% on all occasions except one dry weather sampling event where DO was only 28%. The temperature at this site was generally warm and always exceeded 20°C and was strongly influenced by the nearby ocean (high salinity). On one occasion after heavy rainfall, the pH exceeded the guideline value.
Microbiological parameters E. coli concentration exceeded the recreational water quality guidelines at this location on at least one occasion for each sampling event (dry and wet weather, spring and neap tides). The greatest E. coli concentrations were measured during wet weather sampling and were approximately 4-5 times greater than the recreational water quality guideline value. During wet weather, there were moderate to high contributions of faecal bacteria from ruminant animals (10–50% and 50–100%) with potential canine, possum and avian sources at lower levels. E. coli concentrations were slightly increased during spring tides compared to neap tides, however, the recreational water quality guidelines were not exceeded on any tide sampling occasions.
Nutrients Nutrient levels tended to be elevated at this site especially after rainfall, with a minor exceedance of the ANZECC guidelines measured for nitrogen. The concentrations seen however were within ranges that are unlikely to cause any adverse effects (e.g., nuisance algae growth).
Page 36 Doc # 10722859
Site 8 (Mid) Overall, the water quality at this site was moderate. Nutrient levels tended to be relatively high after rainfall and levels of dissolved oxygen low, which, at times, may act as a stressor to animals living there or passing through. E. coli concentrations were typically within the recreational water quality guidelines during dry weather.
Physical parameters The dissolved oxygen saturation in the water was particularly low on most sampling occasions — being less than 80% on three out of four monitoring occasions. The water temperature at this site was also highly variable, ranging from 18–28°C. On one occasion after heavy rainfall, the pH exceeded the ANZECC guideline value.
Microbiological parameters The concentrations of E. coli were higher at this location than they were at the bush site as new contaminant sources were introduced by the surrounding pastoral land. However, like the bush site, no E. coli exceedances were observed during dry weather. Exceedances occurred after rainfall, with the highest exceedance being >20 times the guideline value. Ruminant bacteria had a moderate contribution (10–50%) during one of the both wet weather periods, with a smaller contribution (1–10%) during the dry weather results. One wet weather sample and one dry weather sample also identified possible avian and possum sources as well.
Nutrients All nutrient concentrations were within the ANZECC guidelines during dry weather samples and one wet weather sampling event. Nitrogen and phosphorous levels exceeded guidelines during the second wet weather event, with phosphorous levels being approximately three times greater than the guideline.
Site 9 (Bush) Overall the water quality at this site was well oxygenated and had a temperature within the range suitable for aquatic life. Elevated levels of E. coli were only seen during heavy rainfall.
Physical parameters The water at this site was always well oxygenated (>80 %) and the water temperature was always within ANZECC guideline ranges. As with the other sites monitored in the catchment, pH levels exceeded the ANZECC guidelines following rainfall on one occasion.
Microbiological parameters E. coli concentrations only exceeded the recreational water quality guidelines following rainfall. One exceedance was significant with concentrations being 40 times greater than the guideline value. Microbial source tracking showed that ruminant sources of contamination dominated (10–50%), with both samples tested also showing avian and possum sources.
Nutrients One minor exceedance of total nitrogen was recorded (0.59 g/m3) on one of the dry weather monitoring occasions. All other nutrients were within the ANZECC guidelines on all other sampling occasions.
Kuaotunu River (Kuaotunu) Site 4 (Mouth) Overall, the water quality at this site was moderate. The elevated temperatures and low dissolved oxygen at times may act as a stressor to animals living there or passing through. This is one of the main swimming locations along the Kuaotunu River and E. coli concentrations were

Doc # 10722859 Page 37
typically within the recreational water quality guidelines making this site usually suitable for swimming, excluding during and following rainfall.
Physical parameters The water temperature at this site was often greater than 20°C and was usually dominated by oceanic water. Dissolved oxygen dropped as low as ~30% on occasion, which is far below the guideline value of 80%. This could be a result of many factors, including the biological breakdown of sediments, low water movement, and high temperatures.
Microbiological parameters E. coli concentrations exceeded the recreational water quality guideline on both wet weather sampling occasions (~18 times higher than the guideline value). Microbial source tracking showed a moderate (10–50%) contribution from ruminant bacteria on the first sampling occasion and a high (50–100%) contribution of ruminant bacteria on the second sampling occasion. Avian contributions were only detected on one occasion and an unquantifiable contribution from possums was detected on both occasions. E. coli concentrations also exceeded the guideline on one of two dry weather sampling occasions (~2 times higher than the guideline value), and on one of two spring tide sampling occasions (~2 times higher than the guideline value). The dry weather samples had contributions from birds and a low contribution (1–10%) from ruminant animals. During spring tides, there was a moderate (10–50%) contribution from ruminant animals, a small contribution from birds and an unquantifiable contribution from possums.
Nutrients Nutrient concentrations were typically within the ANZECC guideline values. Most exceedances were measured during wet weather sampling and were within ranges that are unlikely to cause any adverse effects (e.g., nuisance algae growth).
Site 5 (Mid) Overall, the water quality at this site was moderate. In addition to faecal bacteria exceeded the recreational water quality guidelines during rainfall, as is expected, faecal bacteria was also high on one dry sampling occasion. From the range of sources tested, birds were the most likely source of this additional contamination on this sampling occasion.
Physical parameters The water at this site was always well oxygenated (>80 %) and the water temperature was always within acceptable ranges. On one occasion, the pH exceeded the ANZECC guideline value by about 0.3 units (~pH 9.3).
Microbiological parameters E. coli concentrations exceeded the recreational water quality guideline on three out of four sampling occasions. This included one exceedance during dry weather sampling that was higher (~6 times higher than the guideline value) than during wet weather sampling (~4 times higher than the guideline value). In the dry weather sample that exceeded the guideline value, microbial source tracking identified elevated faecal sources from birds (avian GFD marker) and an unquantifiable contribution from possums. There was no detected contribution from ruminant animals or humans. Microbial source tracking results were markedly different for the two wet weather events. In the first wet weather sample, microbial source tracking identified a contribution from birds and an unquantifiable contribution from possums. In the second wet weather sample, microbial source tracking identified a moderate (10–50%) contribution from ruminant animals and an

Page 38 Doc # 10722859
unquantifiable contribution from possums but no contribution from birds. No human sources were detected in any samples.
Nutrients Nutrient concentrations were always within the ANZECC guideline values.
Site 6 (Bush) Overall, the water quality at this site was high. Exceedances of faecal bacteria and nutrients were typically only seen during rainfall events, which is to be expected in these water types.
Physical parameters The water at this site was always well oxygenated (>80 %) and the pH and temperature were always within ANZECC guideline ranges.
Microbiological parameters E. coli concentrations were within the recreational water quality guidelines during dry weather sampling. During wet weather sampling, however, E. coli concentrations exceeded the guideline value by about 2–4 times. Microbial source tracking showed lower concentrations of faecal bacteria than E. coli and enterococci indicators, which suggests it may not be a typical fresh faecal source. In the wet weather samples, tracking identified a moderate contribution (10–50%) from ruminant animals, a very small contribution from birds, and an unquantifiable contribution from possums. No human sources were detected in any samples.
Nutrients Most of the time, nutrient concentrations were within ANZECC guideline values. On separate wet weather sampling occasions, total phosphorus and dissolved reactive phosphorus exceeded their guideline values. These exceedances were relatively minor and unlikely to have any adverse effects (e.g., nuisance/excessive algal growth).
Stewart Stream (Opito Bay) Site 1 (Mouth) Overall, the water was well oxygenated and the nutrient concentrations in the water were within ANZECC guideline ranges. This site was susceptible to E. coli concentrations that exceeded the recreational water quality guidelines on at least one of each sampling event (wet and dry weather, spring and neap tides); the reason for the increase in faecal bacteria is not clear. There was a small contribution from ruminant animals and birds, but in general, the microbial source tracking results indicated a lower level of faecal contamination the E. coli. This likely indicates that much of the faecal bacteria was not from a fresh source. Effluent seepage from septic tank disposal fields could possibly be a source.
Physical parameters The temperature at this site was generally warm (20–26 °C) and strongly influenced by the nearby ocean (high salinity). The water was well oxygenated on all but one occasion, which was during wet weather.
Microbiological parameters E. coli concentration exceeded the recreational water quality guidelines at this location on at least one occasion for each sampling event (dry and wet weather, spring and neap tides). The greatest E. coli concentrations were measured during wet weather sampling and were about 10 times greater than the recreational water quality guideline value. There was a moderate contribution of faecal bacteria from ruminant animals (10–50%) but the remainder is unknown. Microbial source tracking indicated lower levels of faecal bacteria than the E. coli measurements, which indicates that it was likely not a typical fresh source of bacteria.

Doc # 10722859 Page 39
E. coli concentrations were slightly above the guideline value during spring tides (1.1–1.6 times greater than the guideline value) but the source of the contamination is unknown. On one occasion, there was a very weak signal that human contamination may have been present. On one dry sampling occasion, the E. coli concentration was twice the guideline value. There was a low contribution from ruminant animals (10–50%) and from birds. Similar to other samples within this catchment, microbial source tracking indicated lower levels of contamination than E. coli, indicating that this was likely not a fresh source of faecal bacteria.
Nutrients All nutrient concentrations were within ANEZECC guidelines during dry weather sampling. During wet weather sampling, some minor exceedances were measured for nitrogen but their concentrations were within ranges that are unlikely to cause any adverse effects (e.g., nuisance algae growth).
Site 2 (Mid) Overall the water quality at this site was moderate-high during dry weather. There were particularly large increases in faecal bacteria during rainfall, however, these were likely not typical fresh sources.
Physical parameters The water temperature at this site was highly variable, ranging from 18–28°C. The dissolved oxygen saturation in the water was particularly low on each sampling occasion — less than 80% and as low as 53%. This could be a result of many factors, including the biological breakdown of sediments, low water movement, and high temperatures.
Microbiological parameters The measured E. coli concentration exceeded the recreational water quality guidelines on three out of four sampling occasions. The two greatest exceedances (~12 times greater than the guideline value) were following rainfall. Ruminant bacteria had a moderate contribution (10–50%) during one of the wet periods, but not in the other. Microbial source tracking results were much lower than E. coli, which indicates that this was likely not a fresh source of faecal contamination. The other exceedance was during dry weather when the E. coli concentration was 1.5 times greater than the guideline value. There was a moderate contribution (10–50%) from ruminant animals and a small contribution from birds.
Nutrients All nutrient concentrations were within ANZECC guidelines during dry weather samples. During wet weather sampling, some minor exceedances were measured for nitrogen and phosphorus. The nutrient concentrations were within ranges that are unlikely to cause any adverse effects (e.g., nuisance algae growth).
Site 3 (Bush) Overall, the water quality at this site was high. The water was suitable for swimming during dry weather. Elevated levels of E. coli were only seen during heavy rainfall.
Physical parameters The water at this site was always well oxygenated (>80 %) and the water temperature was always within acceptable ranges. On one occasion, the pH exceeded the ANZECC guideline value by about 0.2 units (~pH 6.3).

Page 40 Doc # 10722859
Microbiological parameters E. coli concentrations only exceeded the recreational water quality guidelines following rainfall (~3–6 times greater than the guideline value). Microbial source tracking results were much lower, which indicates that this was likely not a fresh source of faecal contamination.
Nutrients Nutrient concentrations were typically within ANZECC guideline values. The only exceedances, total phosphorus, were measured during wet weather sampling and were within ranges that are unlikely to cause any adverse effects (e.g., nuisance algae growth).

Doc # 10722859 Page 41
Appendix 2 – Laboratory analysis methods The following analyses were carried out on each water sample by Hill Laboratories, Hamilton.
Parameter
Freshwater Marine
Method Detection limit Method
Detection limit
Total suspended solids
APHA 2540 D 3 g/m3 APHA 2540 D – saline 3 g/m3
Total nitrogen Calculation: TKN + Nitrate-N + Nitrite-N
0.05 g/m3 Calculation: TKN + Nitrate-N + Nitrite-N
0.05 g/m3
Total ammoniacal-N APHA 4500-NH3 F 0.010 g/m3 APHA 4500-NH3 F – saline
0.010 g/m3
Nitrate-N + Nitrite-N
APHA 4500-NO3- I 0.002 g/m3 APHA 4500-NO3- I - saline
0.002 g/m3
Total Kjeldahl Nitrogen (TKN)
APHA 4500-Norg D 0.10 g m3 APHA 4500-Norg D 0.10 g/m3
Dissolved reactive phosphorus
APHA 4500-P E 0.004 g/m3 APHA 4500-P E 0.004 g/m3
Total phosphorus APHA 4500-P B & E 0.004 g/m3 APHA 4500-P B & E 0.004 g/m3
Faecal coliforms APHA 9222 D 1 cfu/100 mL
APHA 9222 D 1 cfu/100 mL
Eschericia coli APHA 9222 G 1 cfu/100 mL
APHA 9222 G 1 cfu/100 mL
Enterococci APHA 9230 C 1 cfu/100 mL
APHA 9230 C 1 cfu/100 mL

Page 42 Doc # 10722859
Appendix 3 – Summary data tables Wet weather results
Stewart Stream, Opito Bay Kuaotunu Stream, Kuaotunu Taputapuatea Stream, Whitianga Pepe Stream, Tairua
Round 1 Stream mouth Pastoral Bush
Stream mouth Pastoral Bush
Stream mouth Pastoral Bush
Stream mouth Pastoral Bush
Site 1 Site 2 Site 3 Site 4 Site 5 Site 6 Site 7 Site 8 Site 9 Site 10 Site 11 Site 12
pH 6.26 6.2 6.31 6.66 8.12 7.87 8.01 7.62 8.4 8.13 7.68 7.82
DO (%) 62.6 68.1 90.4 31.6 90.4 94.4 86.2 66.2 88.6 79.3 75 93
Temperature (°C) 20 18 16.6 18.7 16.7 16.9 22.6 19.3 17.3 18 17.5 16.2
Salinity (psu) 4.06 1.34 0.13 24.72 0.1 0.08 27.31 0.57 0.06 19.7 4.37 0.03
E.coli (cfu/100mL) 5600 6300 1500 9800 2400 2400 580 4800 1300 1400 8000 2000
Enterococci (cfu/100mL) 10000 9800 5500 10000 5000 5000 600 8100 3100 2400 9800 2200
Total faecal coliforms (cfu/100mL) 6400 6300 1500 10000 2400 2400 580 5900 1300 1400 8600 2300
TSS (g/m3) 25 26 5 6 < 3 3 6 4 < 3 8 3 < 3 Dissolved Reactive Phosphorous (g/m3) 0.006 0.006 0.02 0.014 0.012 0.024 < 0.004 < 0.004 < 0.004 < 0.004 < 0.004 < 0.004
Total P (g/m3) 0.028 0.028 0.04 0.043 0.026 0.032 0.014 0.019 0.007 0.011 0.014 0.012
Total N (g/m3) 0.56 0.53 0.29 0.3 0.18 0.27 < 0.3 0.3 0.19 < 0.3 0.21 0.12
Total Kjeldahl N (g/m3) 0.51 0.48 0.29 0.3 0.18 0.27 < 0.2 0.26 0.19 < 0.2 0.21 0.12
Total Ammoniacal - N (g/m3) 0.018 < 0.010 < 0.010 < 0.010 < 0.010 < 0.010 < 0.010 < 0.010 < 0.010 < 0.010 0.011 < 0.010
Nitrate-N + Nitrite-N (g/m3) 0.045 0.046 < 0.002 < 0.002 < 0.002 < 0.002 < 0.002 0.035 < 0.002 0.004 0.008 < 0.002
Date 9/02/2017 9/02/2017 9/02/2017 9/02/2017 9/02/2017 9/02/2017 9/02/2017 9/02/2017 9/02/2017 9/02/2017 9/02/2017 9/02/2017
Time 10:36am 10:08am 9:41am 11:08am 11:22am 11:35am 12:15pm 11:40am 11:15am 10:15am 9:50am 9:20am

Doc # 10722859 Page 43
Round 2
Site 1 Site 2 Site 3 Site 4 Site 5 Site 6 Site 7 Site 8 Site 9 Site 10 Site 11 Site 12
pH 8.38 7.89 8.98 8.26 9.27 8 5.71 5.9 5.43 5.67 5.04 5.73
DO (%) 85.2 77.1 88.9 58 90.9 95 83.2 71.8 96.2 90.4 93 99.9
Temperature (°C) 21.2 19.1 18.1 19.6 18.2 15.2 20.3 18.6 17.9 19.6 17.6 17
Salinity (psu) 31.72 0.16 0.1 18.97 0.07 0.09 1.52 0.08 0.04 10.7 0.06 0.02
E.coli (cfu/100mL) 5500 6300 3300 10000 2300 2000 21000 13000 22000 10000 22000 5600
Enterococci (cfu/100mL) 6000 59000 5900 23000 5700 24000 29000 23000 5500 600 5500 1000
Total faecal coliforms (cfu/100mL) 5600 6300 3700 11000 2400 4000 22000 14000 23000 11000 23000 5700
TSS (g/m3) 27 105 76 18 8 12 26 35 28 11 9 5 Dissolved Reactive Phosphorous (g/m3) < 0.004 < 0.004 0.008 0.012 0.006 0.01 0.022 0.013 < 0.004 0.004 0.004 < 0.004
Total P (g/m3) 0.029 0.059 0.054 0.066 0.034 0.05 0.091 0.116 0.03 0.014 0.02 0.007
Total N (g/m3) 0.3 0.5 0.37 0.6 0.26 0.31 0.78 0.84 0.26 <0.3 0.2 0.16
Total Kjeldahl N (g/m3) 0.3 0.45 0.35 0.5 0.22 0.28 0.5 0.59 0.25 <0.2 0.17 0.15
Total Ammoniacal - N (g/m3) < 0.010 0.033 < 0.010 0.016 < 0.010 < 0.010 0.086 0.155 <0.01 <0.010 < 0.010 < 0.010
Nitrate-N + Nitrite-N (g/m3) 0.041 0.052 0.02 0.112 0.035 0.029 0.28 0.26 0.011 0.013 0.026 0.007
Date 27/03/2017 27/03/2017 27/03/2017 27/03/2017 27/03/2017 27/03/2017 27/03/2017 27/03/2017 27/03/2017 27/03/2017 27/03/2017 27/03/2017
Time 10:45AM 10:20AM 10:00AM 11:20AM 11:40AM 12:00PM 11:50AM 11:20AM 10:45AM 9:35AM 9:10AM 8:30AM
Dry weather results
Opito Bay – Stewart Stream Kuaotunu - Kuaotunu Stream Whitianga - Taputaputea Stream Tairua - Pepe Stream
Round 1 Stream mouth Pastoral Bush
Stream mouth Pastoral Bush
Stream mouth Pastoral Bush
Stream mouth Pastoral Bush
Site 1 Site 2 Site 3 Site 4 Site 5 Site 6 Site 7 Site 8 Site 9 Site 10 Site 11 Site 12
pH 7.26 6.6 7.96 7.11 7.84 8.15 7.42 7.12 8.77 6.93 6.54 5.98
DO (%) 89 53.2 92.4 69.4 93.7 94.4 104.4 68.8 99.1 103.1 82.2 101.6

Page 44 Doc # 10722859
Temperature (°C) 25.8 28.2 17.4 19.8 17 17.2 23.9 26.5 18.4 31.8 20.2 16.1
Salinity (psu) 21.74 27.11 0.12 20.61 0.11 0.09 19.55 24.72 0.09 0.05 23.14 0.03
E.coli (cfu/100mL) 100 440 55 1000 300 110 38 300 57 26 400 330
Enterococci (cfu/100mL) 200 530 220 2200 2200 600 2 320 220 14 140 130
Total faecal coliforms (cfu/100mL) 110 440 55 1300 360 120 38 390 57 26 400 330
TSS (g/m3) 11.48 1.56 0.18 14.29 0.21 0.29 13.87 4.63 0.11 18.30 5.03 0.58 Dissolved Reactive Phosphorous (g/m3) 0.004 0.004 0.014 0.008 0.005 0.013 0.004 0.004 0.004 0.004 0.004 0.005
Total P (g/m3) 0.01 0.006 0.02 0.024 0.01 0.019 0.012 0.015 0.005 0.007 0.018 0.006
Total N (g/m3) 0.3 0.3 0.1 0.3 0.11 0.11 0.3 0.3 0.3 0.3 0.2 0.11
Total Kjeldahl N (g/m3) < 0.2 < 0.2 < 0.10 < 0.2 < 0.10 < 0.10 < 0.2 < 0.2 < 0.2 < 0.2 < 0.2 < 0.10
Total Ammoniacal - N (g/m3) 0.01 0.01 0.01 0.024 0.01 0.01 0.012 0.022 0.01 0.018 0.026 0.01
Nitrate-N + Nitrite-N (g/m3) 0.004 0.005 0.004 0.008 0.002 0.002 0.005 0.022 0.002 0.002 0.006 0.002
Date 11.48 1.562 0.176 14.293 0.21155 0.2891 13.87 4.627 0.1096 18.2965 5.031 0.576
Time 12:35pm 12:00pm 11:15am 10am 9:20am 8:30am 2:40pm 3:00pm 3:30pm 1:45pm 12:45pm 12:00pm
Round 2
Site 1 Site 2 Site 3 Site 4 Site 5 Site 6 Site 7 Site 8 Site 9 Site 10 Site 11 Site 12
pH 6.98 6.37 7.77 7.46 8.47 8.1 7.56 6.77 8.61 7.81 7.32 7.27
DO (%) 93.6 34.9 87.9 42.6 90.2 95.5 28.4 113.1 94.5 101.1 79.8 99.5
Temperature (°C) 25.4 22.2 18 22.1 18.2 18.8 24.1 27.9 19.4 19.1 22.1 17.3
Salinity (psu) 16.34 3.37 0.12 32.4 0.12 0.09 10.38 17.16 0.08 33.9 27.29 0.03
E.coli (cfu/100mL) 1100 800 140 130 3500 120 190 530 110 25 2100 370
Enterococci (cfu/100mL) 2400 230 540 240 1600 140 29 230 120 8 680 150
Total faecal coliforms (cfu/100mL) 1100 800 140 190 3500 150 360 930 130 26 2100 370
TSS (g/m3) 13 11 < 3 22 < 3 < 3 7 3 < 3 42 17 < 3

Doc # 10722859 Page 45
Dissolved Reactive Phosphorous (g/m3) 0.009 < 0.004 0.017 0.014 0.006 0.015 < 0.004 0.006 < 0.004 0.008 < 0.004 0.005
Total P (g/m3) 0.032 0.024 0.022 0.05 0.006 0.022 0.006 0.016 0.005 0.013 0.007 0.007
Total N (g/m3) 0.3 0.28 < 0.11 0.5 0.13 < 0.11 0.3 0.2 0.59 < 0.3 0.2 < 0.11
Total Kjeldahl N (g/m3) 0.3 0.28 < 0.10 0.5 0.13 < 0.10 0.3 0.2 0.58 < 0.2 < 0.2 < 0.10
Total Ammoniacal - N (g/m3) 0.023 0.063 < 0.010 0.12 < 0.010 < 0.010 < 0.010 0.031 < 0.010 0.021 < 0.010 < 0.010
Nitrate-N + Nitrite-N (g/m3) 0.002 < 0.002 < 0.010 0.014 < 0.002 0.003 0.007 0.024 0.002 < 0.002 0.016 < 0.002
Date 42769 42769 42769 42769 42769 42769 42768 42768 42768 42768 42768 42768
Time 8:40am 8:20am 7:50am 9:15am 10:05am 10:25am 12:50pm 12:15pm 11:45am 10:10am 9:40am 9:20am

Page 46 Doc # 10722859
Neap tide results
Opito Bay Kuaotunu Whitianga Tairua
Round 1 Stream mouth Stream mouth Stream mouth Stream mouth
Site 1 Site 4 Site 7 Site 10
pH 6.86 7.5 7.67 7.37
DO (%) 95 94.5 99.7 106.2
Temperature (°C) 21.9 21.3 19.6 19.6
Salinity (psu) 23.88 14.78 26.49 33.95
E.coli (cfu/100mL) 32 500 80 1
Enterococci (cfu/100mL) 22 440 90 7
Total faecal coliforms (cfu/100mL) 41 600 80 28
TSS (g/m3) 6 9 7 8
Dissolved Reactive Phosphorous (g/m3) 0.004 0.004 0.008 0.006
Total P (g/m3) 0.007 0.014 0.016 0.01
Total N (g/m3) 0.3 0.3 0.2 0.3
Total Kjeldahl N (g/m3) 0.2 0.3 0.2 0.2
Total Ammoniacal - N (g/m3) 0.01 0.01 0.01 0.01
Nitrate-N + Nitrite-N (g/m3) 0.002 0.002 0.042 0.002
Date 20/01/2017 20/01/2017 19/01/2017 19/01/2017
Time 1:45pm 2:15pm 2:30pm 1:30pm
Round 2
Site 1 Site 4 Site 7 Site 10
pH 8.04 7.93 7.89 7.75
DO (%) 102 104.1 109.4 127.5
Temperature (°C) 23.3 21.6 23.9 23.3
Salinity (psu) 31.87 32.12 33.8 33.84
E.coli (cfu/100mL) 120 60 3 3
Enterococci (cfu/100mL) 62 60 2 5
Total faecal coliforms (cfu/100mL) 150 90 3 3
TSS (g/m3) 5 6 50 41
Dissolved Reactive Phosphorous (g/m3) < 0.004 0.013 0.01 0.007
Total P (g/m3) 0.008 0.019 0.028 0.011
Total N (g/m3) < 0.3 0.2 < 0.3 < 0.3
Total Kjeldahl N (g/m3) < 0.2 < 0.2 < 0.2 < 0.2
Total Ammoniacal - N (g/m3) < 0.010 0.031 < 0.010 0.013
Nitrate-N + Nitrite-N (g/m3) 0.005 0.008 0.007 0.003
Date 7/03/2017 7/03/2017 6/03/2017 6/03/2017
Time 2:15pm 2:40pm 2:50pm 2:20pm

Doc # 10722859 Page 47
Spring tide results
Opito Bay Kuaotunu Whitianga Tairua
Round 1 Stream mouth
Stream mouth
Stream mouth
Stream mouth
Site 1 Site 4 Site 7 Site 10
pH 6.94 7.61 7.49 7.84
DO (%) 114.1 99.2 101 95.9
Temperature (°C) 26.1 26.2 21.9 21.1
Salinity (psu) 24.69 30.62 30.08 32.65
E.coli (cfu/100mL) 620 250 520 6
Enterococci (cfu/100mL) 590 440 400 5
Total faecal coliforms (cfu/100mL) 680 290 640 6
TSS (g/m3) 13 23 37 30
Dissolved Reactive Phosphorous (g/m3) < 0.004 < 0.004 0.011 0.005
Total P (g/m3) 0.018 0.022 0.024 0.009
Total N (g/m3) 0.3 < 0.3 < 0.3 0.2
Total Kjeldahl N (g/m3) 0.3 < 0.2 < 0.2 0.2
Total Ammoniacal - N (g/m3) < 0.010 0.031 0.026 0.017
Nitrate-N + Nitrite-N (g/m3) 0.017 0.018 0.016 0.017
Date 27/02/2017 27/07/2017 28/02/2017 28/02/2017
Time 8:55pm 9:20pm 9:20am 10:10am
Round 2
Site 1 Site 4 Site 7 Site 10
pH 7.87 7.85 7.29 7.6
DO (%) 98.8 93.6 68.2 91.7
Temperature (°C) 19.8 20.1 19.7 19.3
Salinity (psu) 31.59 31.56 10.24 21.17
E.coli (cfu/100mL) 1000 1200 420 1600
Enterococci (cfu/100mL) 900 1200 390 130
Total faecal coliforms (cfu/100mL) 900 1400 70 900
TSS (g/m3) 8 6 14 9
Dissolved Reactive Phosphorous (g/m3) 0.004 0.025 0.004 0.016
Total P (g/m3) 0.01 < 0.004 0.013 0.042
Total N (g/m3) 0.4 0.3 < 0.3 < 0.3
Total Kjeldahl N (g/m3) 0.4 < 0.2 < 0.2 < 0.2
Total Ammoniacal - N (g/m3) 0.011 0.014 0.012 0.062
Nitrate-N + Nitrite-N (g/m3) 0.02 0.09 0.025 0.101
Date 31/03/2017 31/03/2017 30/03/2017 30/03/2017
Time 10:45AM 11:20AM 10:10AM 11:20AM
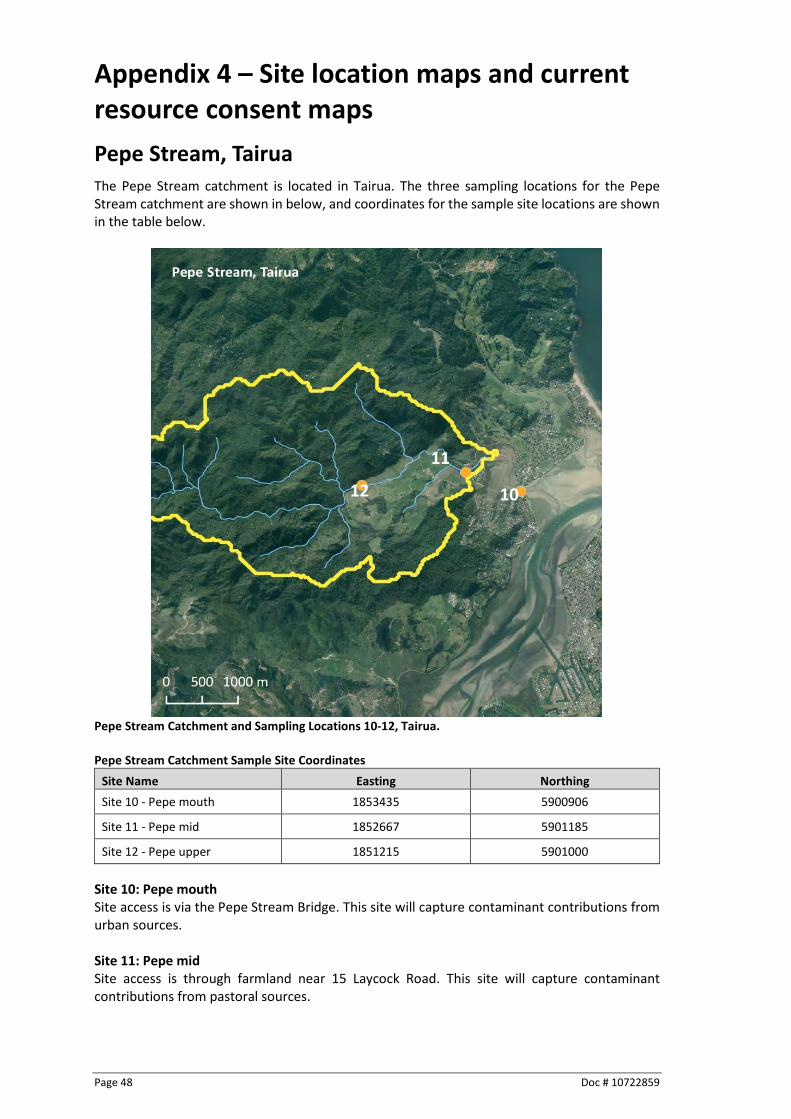
Page 48 Doc # 10722859
Appendix 4 – Site location maps and current resource consent maps Pepe Stream, Tairua The Pepe Stream catchment is located in Tairua. The three sampling locations for the Pepe Stream catchment are shown in below, and coordinates for the sample site locations are shown in the table below.
Pepe Stream Catchment and Sampling Locations 10-12, Tairua. Pepe Stream Catchment Sample Site Coordinates
Site Name Easting Northing Site 10 - Pepe mouth 1853435 5900906
Site 11 - Pepe mid 1852667 5901185
Site 12 - Pepe upper 1851215 5901000
Site 10: Pepe mouth Site access is via the Pepe Stream Bridge. This site will capture contaminant contributions from urban sources. Site 11: Pepe mid Site access is through farmland near 15 Laycock Road. This site will capture contaminant contributions from pastoral sources.
11
10 12

Doc # 10722859 Page 49
Site 12: Pepe upper Site access is through farmland near 55 Laycock Road Buffalo Beach Road. This site will capture contaminant contributions from the native/exotic forest land cover.
Taputaputea Stream, Whitianga The Taputaputea catchment is located in Whitianga. The three sampling locations for the Taputaputea catchment are shown below, and coordinates for the sample site locations are shown in the table below.
Taputaputea Stream Catchment and Sampling Locations 7-9, Whitianga Taputaputea Stream Catchment Sample Site Coordinates
Site Name Easting Northing Site 7- Taputapuatea mouth 1840776 5922054
Site 8 - Taputapuatea mid 1840523 5922597
Site 9 - Taputapuatea upper 1838591 5922263
Site 7: Taputaputea mouth Site access is via Buffalo Beach Road. This site will capture contaminant contributions from urban sources.
Site 8: Taputaputea mid Site access is via a public walkway off River Crescent. This site will capture contaminant contributions from pastoral sources.
7
8 9

Page 50 Doc # 10722859
Site 9: Taputaputea upper Site access is via a public gravel road near 152 Moewai Road. This site will capture contaminant contributions from the native/exotic forest land cover.
Kuaototunu Stream, Kuaotunu The Kuaotunu Stream catchment is located in Kuaotunu. The three sampling locations for the Kuaotunu Stream catchment are shown below, and coordinates for the sample site locations are shown in the table below.
Kuaotunu Stream Catchment and Sampling Locations 4-6, Kuaotunu
Kuaotunu Stream Catchment Sample Site Coordinates Site Name Easting Northing Site 4 - Kuaotunu mouth 1843786 5932500
Site 5 - Kuaotunu mid 1843697 5931371
Site 6 - Kuaotunu upper 1843388 5930599
Site 4: Kuaotunu mouth Site access is via a walk bridge opposite Luke’s Kitchen. This site will capture contaminant contributions from urban sources.
Site 5: Kuaotunu mid Site access is via Kuaotunu Wharekaho Rd or Waitaia Rd. This site will capture contaminant contributions from pastoral sources.
Site 6: Kuaotunu upper Site access is via Kuaotunu Wharekaho Rd. This site will capture contaminant contributions from the native/exotic forest land cover.
6
5
4

Doc # 10722859 Page 51
Stewart Stream, Opito Bay The Stewart Stream catchment is located in Opito Bay. The three sampling locations for the Stewart Stream catchment are shown below, and coordinates for the sample site locations are shown in the table below.
Stewart Stream Catchment Map and Sampling Locations 1-3, Opito Bay
Stewart Stream Catchment Sample Site Coordinates Site Name Easting Northing Site 1 - Stewart mouth 1850183 5932481
Site 2 - Stewart mid 1850063 5932026
Site 3 - Stewart upper 1849753 5931461
Site 1: Stewart mouth Site access is via a platform by Stewart Stream Bridge. This site will capture contaminant contributions from urban sources.
Site 2: Stewart mid Site access is across farmland located at 958 Black Jack Rd. This site will capture contaminant contributions from pastoral sources.
Site 3: Stewart upper Site access is via Matapaua Bay Rd or through farmland at 958 Black Jack Road. This site will capture contaminant contributions from the native/exotic forest land cover.
3
2
1

Page 52 Doc # 10722859
Pepe Stream catchment including locations of current resource consents
Taputapuatea Stream catchment including locations of current resource consents

Doc # 10722859 Page 53
Kuaotunu Stream catchment including locations of current resource consents
Stewart Stream catchment including locations of current resource consent

Page 54 Doc # 10722859
Appendix 5 – Statistical analyses A5.1: Results from two-tailed t-tests comparing mean E. coli levels in each stream during wet
weather and dry weather sampling events. Data from all sampling locations has been combined for each stream.
Stream t df p
Kuaotunu -3.617 10 0.005
Stewart -5.323 10 <0.001
Tuputapuatea -4.888 10 <0.001
Pepe -4.006 10 0.002
A5.2: Results from One-way ANOVA tests comparing mean E. coli levels between each
sampled stream during dry weather and wet weather sampling events. Data from all sampling locations has been combined for each stream.
Sampling event SS MS df F p
Dry weather 2.736 0.912 3, 20 0.488 0.694
Wet weather 0.617 0.206 3, 20 0.192 0.901
A5.3: Results from two-tailed t-tests comparing mean E. coli levels at each sampling location
during wet weather and dry weather sampling events. Data from all four streams has been combined for each sampling location.
Sample location t df p
Bush -7.732 14 <0.001
Pasture -5.231 14 <0.001
Stream Mouth -5.496 14 <0.001
A5.4: Results from One-way ANOVA and Holm-Sidak post-hoc tests comparing mean E. coli
levels between each sampling location during dry weather and wet weather sampling events. Data from all four streams has been combined for each sampling location.
Analysis SS MS df F p Streams 7.112 2.371 3, 63 0.445 0.722
A5.5: Results from One-way ANOVA test comparing mean E. coli levels between each stream.
Data all sampling events and locations has been combined for each stream. Sampling event SS MS df F p
Dry weather 15.042 7.521 2, 23 6.304 0.007
Wet weather 2.22 1.11 2, 23 1.175 0.328
Post-hoc comparisons t p
Bush vs Pasture 3.058 0.012
Pasture vs Stream mouth 3.092 0.016
Bush vs Stream mouth 0.0339 0.973

Doc # 10722859 Page 55
Appendix 6 – Stream gauging and contaminant load calculations Wet weather contaminant loads
E.coli loads
Site 1 Site 2 Site 3 Site 4 Site 5 Site 6 Site 7 Site 8 Site 9 Site 10 Site 11 Site 12 Average Concentration (cfu/100mL) 5,550 6,300 2,400 9,900 2,350 2,200 10,790 8,900 11,650 5,700 15,000 3,800 Average Flow (m3/s) No flow 0.17 0.13 1.29 0.59 1.01 0.08 0.17 0.09 No flow 0.78 0.48 Contaminant Load (cfu/m3/s) NA 10,563,380 3,059,929 127,769,989 13,820,027 22,244,560 8,429,688 14,979,905 10,558,989 NA 117,595,522 18,181,536
Dry weather contaminant loads
E.coli loads
Site 1 Site 2 Site 3 Site 4 Site 5 Site 6 Site 7 Site 8 Site 9 Site 10 Site 11 Site 12 Average Concentration (cfu/100mL) 600 620 97.5 565 1900 115 114 415 83.5 25.5 1250 350 Average Flow (m3/s) 0.68 0.13 0.03 No flow 0.02 0.04 1.08 0.57 0.02 2.99 0.89 0.09 Contaminant Load (cfu/m3/s) 4,099,558 805,647 33,993 NA 438,051 45,249 1,230,912 2,380,880 16,449 763,399 11,116,793 317,167

Page 56 Doc # 10722859
Appendix 7 – FST laboratory reports

Doc # 10722859 Page 57
Ruminant PCR marker reports

Page 58 Doc # 10722859

Doc # 10722859 Page 59

Page 60 Doc # 10722859
Human, possum, ruminant, and avian PCR marker reports

Doc # 10722859 Page 61

Page 62 Doc # 10722859

Doc # 10722859 Page 63