potential of life cycle thinking tools for sustainability
TRANSCRIPT

Potential of life cycle thinking tools for sustainability evaluation of the
circular economy
Wouter Achten

Starting pointRenewability
Reuse, Repair, Recycle
Functional EconomyDepollution
IndustialEcology/Symbiosis
Eco Design
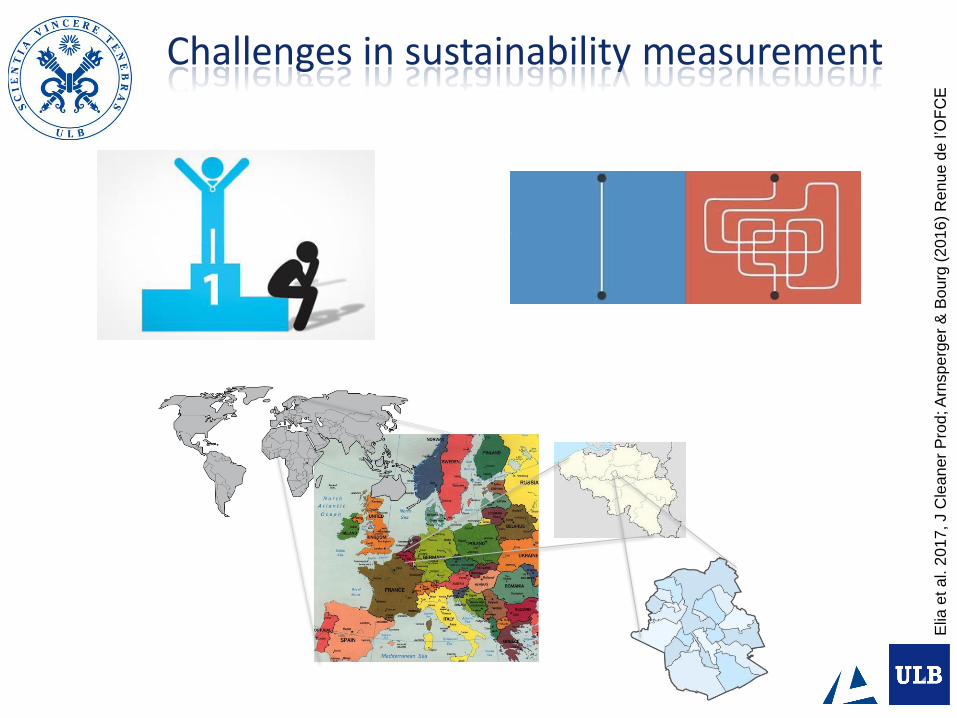
Challenges in sustainability measurement
Elia
et a
l. 2
01
7, J C
lea
ner
Pro
d; A
rnsp
erg
er
& B
ou
rg(2
01
6)
Ren
ue
de
l’O
FC
E

Need for measurement?
Circularity
performance(resource use, resource
loss, renewability)
Sustainability
performance(econ, envi, soc)
Trade-offs
Impact
displacement
Decision support
Management
Differentiation
Improvement
Optimisation
Materials Produits Organisations System
Micro Meso Macro
Direct and
Indirect impacts
Elia
et a
l. 2
01
7, J C
lea
ner
Pro
d; A
rnsp
erg
er
& B
ou
rg(2
01
6)
Ren
ue
de
l’O
FC
E

Circularity indicator initiatives(non exhaustive)
MACRO
• National circular economy indicator system in China (by Geng et al. 2012, J Cleaner Prod)
• Zero Waste index (by Zaman & Lehmann 2013 J Cleaner Prod)
MESO
• LCA-based Eco-costs Value Ratio (by Scheepens et al. 2016 J Cleaner Prod)
• Resource Productivity indicator (M/SFA based) (by Wen & Meng 2015, J Cleaner Prod.)
MICRO
• Material Ciruclarity Indicator (MCI) (by Ellen MacArthur Foundation & Granata 2015)
• Circular Economy Indicator Prototype (CEIP) (by Cayzer et al. 2017)
• Circular Economy Toolkit (CET) (by Evans & Bocken 2017)
• Circular Economy Index (by Di Maio & Rem 2015, J Env Protection)
• Circularity assessment (by Circle Economy & PGGM 2014)
…
Elia et al. 2017, J Cleaner Prod; Saidani et al. 2017, Recycling

General observation• Interesting initiatives
• Often focused on material and energy flows
• Environmental and economic impacts are not sufficiently integrated
• Social dimension deserves more attention
• Indirect and displacement effects?
• Systemic approach seems not to be sufficiently integrated
Circularity indicator initiatives
(CIR
AG
20
15
; A
rnsp
erg
er
& B
ou
rg(2
01
6)
Re
nu
ed
e l’O
FC
E)
?
~
?
SLCA eLCA
LCC

Perspectives
• Systemic approach seems not to be sufficiently integrated
• IO-LCA (MR EE IOA – Hybrid LCA) (Genovese et al. 2017)
• Consequential LCA
• Territorial LCA
Hellweg and Milà i Canals 2014

Input – Output LCA
Source: Miller & Blair 2009 – Input-Output analysis – Foundations and Extensions, Cambridge
Distribution of the production of one sector throughout the economy
Composition of inputs required by a
sector to produce its products
Final demand

Input – Output LCA
mat
eria
lw
aste
ener
gyw
ater
emis
sio
ns
regi
on
sector 1sector 2sector 3sector …sector n
imp
ort
sector 1sector 2sector 3sector …sector n
sect
or
1se
cto
r 2
sect
or
3se
cto
r …
sect
or
n
Delivers to(monetary)
ho
use
ho
ld
s
gove
rnm
ent
Co
mp
ani
es
exp
ort
mat
eria
lw
aste
ener
gyw
ater
emis
sio
ns
materialwasteenergywater
emissions
Slide borrowed from Karel Vanacker. Thanks!

Input-output analyses
• Potential for CE assessment? Most advanced models can trace..
Final demand
Productive sectors
Waste treatment sectors
Waste Waste treatment sectorsSecondary
products
Final demand
Productive sectors
Waste treatment sectors
Waste Waste treatment sectors
Final demand
Productive sectors
Waste treatment sectors
Waste Waste treatment sectors
Final demand
Productive sectors
Waste treatment sectors
Waste Waste treatment sectors
A - Waste extended input-output model
B - Waste input-output model
C - Physical input-output model
D- Hybrid input-output model
Monetary units
Physical units
Hybrid units
Legend:
Waste generation (supply of waste)
Waste treatment (use of waste)
Production of secondary raw materials / recovered energy
Inputs of secondary products in productive sectors
Secondary
products
Secondary
products
Secondary
products
Text and arrows marked in gray mean “not considered”
At subnational, national or global level
Manuscript: Edgar Towa, Vanessa Zeller, Wouter M.J. Achten. 2019: Input-output models and waste management analysis: a critical review

Input-output analyses
• Potential for CE assessment? Indicators from models and analyses..
Indicators from HIOT:
• Waste intensity per sector (wastein/ productionout, in ton or €)
• Waste treatment rates per waste material (e.g. Recy. rates for metals, paper)
• Use rate of sec. products in economic sectors
• Emission intensity of waste treatment (and other) sectors
Indicators from input-output analysis:
• Waste footprint: Direct and indirectwaste generation linked to household consumption
• Direct and indirect environmental ‘impacts’ from the consumption of products (secondary and primary)
→ State of circularity in a region & direct
impacts (EXAMPLE)
→Effect of production and consumption mode
(CE model) on other sectors and regions

Input-output analyses
→ State of circularity in Brussels
< 1% of the collected waste is used in a way that closes material cycles within city limits
EXAMPLE 1: regional state of circularity
V. Zeller, E. Towa, M. Degrez, and W. M. J. Achten, “Urban waste flows and their potential for a circular economy model at city-region level,” Waste Manag., vol. 83, pp. 83–94, Jan. 2019.

Input-output analyses
Limits for CE evaluation
• Economy as it was… at least 5 years ago: new CE business models not included
• Economy model of (max.) 200 sectors: detailed sectoral analysis (waste treatment or service sectors)
• Many flows that are relevant for CE are not included/ not distinguishable• Non-commercial activities (Home composting , repair cafés, food banks)
• Reuse of products
• Second hand markets
• Environmental assessment: carbon, material, water footprint, not a complete impact assessment

Consequential LCA
• Substitution effects in multi-output processes
• Substitution effects in open loop recycling
• Alternative use of limited production factors
• General Market effects
• Identification of competing/avoided products
• Identification of marginal technology
Weidema 2014 (Ekvall & Weidema 2004)

Consequential LCA
1) Selection of options that are supposed to change in the total biowaste system
2) Replacement options 3) Substitution effects
2)
1)
3)
EXAMPLE: Environmental consequences of diverting 50kt of Brussels’ biowaste from current treatment to more circular management options?
Slide by Vanessa Zeller

Consequential LCA EXAMPLE: RESULTS
Food waste incineration Impacts on human health Impacts on ecosystems Impacts on resources
Green waste composting
Impacts on human health Impacts on ecosystems Impacts on resources
Co-composting
Impacts on human health Impacts on ecosystems Impacts on resources
Anaerobic digestion with post composting
Impacts on human health Impacts on ecosystems Impacts on resources
Imp
acts
fro
mre
pla
ced
pro
cess
esIm
pac
ts f
rom
CE
op
tio
ns
-100
-80
-60
-40
-20
0Human health Ecosystems Resources
Com
para
tive r
esults (
%)
S1 S2
Net results
-6 -4 -2 0 2 4
Final balance
Biogas
Biowaste composting
Total avoided
Avoided green waste composting
Avoided incineration
DALY
Balance for human health impacts
Manuscript (Heraklion conference) Zeller et al. 2019: Assessing the environmental performance of circular economy options for biowaste flows at city-region levelSlide by Vanessa Zeller

Territorial LCA
Limited land
Multiple functions
Think wisely
Where
Which
How much
Slide by Tianran Ding
Territorial LCA
(TLCA) environmental
(Loiseau et al. 2013)

In short
Circular Economy
Aim for economy wide effects
Aim for sustainable Development
Need to develop evaluation approaches which incorporate systemic effects
LCT tools as IO-LCA, cLCA and TLCA show potential to contribute to that.