potential of co-benefit mercury control for coal-fired ... · protection initiated the pilot...
TRANSCRIPT

Potential of Co-benefit Mercury Control for
Coal-Fired Power Plants and Industrial Boilers
in China
Prepared for:
Natural Resources Defense Council
Prepared by:
Lei Zhang, Shuxiao Wang, Mulin Hui, Bin Zhao, Siyi Cai
School of Environment, Tsinghua University
February 2016

1
CONTENTS
EXECUTIVE SUMMARY ................................................................................................................................... 3
1. INTRODUCTION ........................................................................................................................................ 5
2. METHODS FOR THE DEVELOPMENT OF MERCURY EMISSION INVENTORIES .................... 6
2.1. MODEL DESCRIPTION ............................................................................................................................ 6
2.2. KEY PARAMETERS FOR INVENTORY DEVELOPMENT ............................................................................ 8
2.2.1. Mercury content of coal ................................................................................................................. 8
2.2.2. Mercury removal efficiency by APCDs ........................................................................................ 13
2.2.3. Activity levels and APCD installation rates for the baseline year (2010) .................................... 15
2.3. METHOD FOR UNCERTAINTY ANALYSIS ............................................................................................... 16
3. PROJECTION OF MERCURY EMISSION CONTROL SCENARIOS .............................................. 17
3.1. IDENTIFICATION OF AIR POLLUTION CONTROL REQUIREMENTS FOR COAL COMBUSTION ............... 17
3.1.1. Action Plan for Prevention and Control of Air Pollution (“Ten Measures”) ............................... 17
3.1.2. Emission Standard of Air Pollutants for Thermal Power Plants (GB 13223-2011) ..................... 18
3.1.3. Emission Standard of Air Pollutants for Boilers (GB 13271-2014) ............................................. 18
3.2. PROJECTION OF THE 2017 SCENARIOS ................................................................................................ 20
3.3. PROJECTION OF 2020 AND 2030 SCENARIOS ....................................................................................... 23
3.3.1. Energy scenarios .......................................................................................................................... 24
3.3.2. Control scenarios ......................................................................................................................... 24
4. POTENTIAL OF CO-BENEFIT MERCURY CONTROL FOR CFPPS IN CHINA .......................... 28
4.1. INVENTORY OF MERCURY EMISSIONS FROM CFPPS IN 2010 ............................................................. 28
4.2. EFFECTIVENESS OF MEASURES ON MERCURY REMOVAL FROM CFPPS DURING 2012–2017............. 29
4.3. POTENTIAL OF CO-BENEFIT MERCURY CONTROL FOR CFPPS BY 2020 AND 2030 ............................. 31
5. POTENTIAL OF CO-BENEFIT MERCURY CONTROL FOR CFIBS IN CHINA ........................... 32
5.1. INVENTORY OF MERCURY EMISSIONS FROM CFIBS IN 2010 .............................................................. 33
5.2. EFFECTIVENESS OF MEASURES ON MERCURY REMOVAL FOR CFIBS DURING 2012–2017 ................ 33

2
5.3. POTENTIAL OF CO-BENEFIT MERCURY CONTROL FOR CFIBS BY 2020 AND 2030 ............................. 36
6. IMPLICATIONS AND POLICY RECOMMENDATIONS ................................................................... 37
6.1. UNCERTAINTIES AND IMPLICATIONS ................................................................................................... 37
6.1.1. Uncertainty of mercury content of coal ........................................................................................ 37
6.1.2. Uncertainty of mercury removal efficiency of APCDs ................................................................. 41
6.1.3. Uncertainty of energy scenarios................................................................................................... 41
6.1.4. Uncertainty of control scenarios .................................................................................................. 42
6.2. RECOMMENDATIONS ON CONTROL POLICIES AND EMISSION STANDARDS ......................................... 42
6.2.1. Best available technique (BAT) adoption ..................................................................................... 42
6.2.2. National mercury emission reduction target ................................................................................ 43
6.2.3. Combination of concentration- and efficiency-oriented emission standards ............................... 45
6.2.4. Reinforcement of mercury emission monitoring standard system ................................................ 46
6.2.5. Development of environmental registration system ..................................................................... 47
6.2.6. Improvement of the management system for industrial boilers .................................................... 47
REFERENCES .................................................................................................................................................... 48
3
Executive Summary
Using a new technology-based probabilistic emission factor model, to reduce the range of
uncertainties versus previous efforts, we estimated mercury emissions from coal-fired power plants
(CFPPs) and coal-fired industrial boilers (CFIBs). For the year 2010, the median estimate for
mercury emissions from CFPPs is 100 t, and from CFIBs is 72.5 t.
We then evaluated the mercury emission reduction co-benefit associated with actions already required
to comply with the Action Plan for Prevention and Control of Air Pollution (“Ten Measures”), the
existing emission standards for CFPPs and CFIBs, and various coal consumption scenarios developed
by experts in this area. Compared to the projected emissions that would be expected if none of these
actions occurred, by 2017 mercury emissions will be reduced by 46.3 t for CFPPs and 45.7 t for CFIBs.
These reductions are higher than “actual” reductions due to the growth of coal consumption and
possible non-compliance with the control measures over this period of time.
We project actual mercury emissions reductions for CFPPs by 2020 of about 25% on average (over the
various control and energy consumption scenarios evaluated), versus 2010 emissions. By 2030,
higher reductions are anticipated, ranging from 35–77%, largely depending upon the energy
consumption scenario. For CFIBs, we project actual emissions reductions for CFIBs by 2020 of
about 44% on average versus 2010. By 2030, reductions will range between 29–79%, again largely
depending upon the energy scenario. Together, under an aggressive but feasible control strategy, up
to 133 t of mercury emission reductions can be achieved from these two source categories.
The overall uncertainty levels for mercury emissions from CFPPs and CFIBs in 2010 were evaluated
to be (−35%, +45%) and (−45%, +47%), respectively. The uncertainties of mercury concentration in
coals from major coal producing provinces, such as Shanxi and Inner Mongolia, and the uncertainties
of mercury removal efficiencies major air pollution control devices contributed most to the overall
uncertainties. The future projections by 2020 and 2030 have even larger uncertainties due to the extra
uncertainties from energy and control scenarios.
4
However, on the basis of these estimates, China can establish a national mercury reduction target for
CFPPs of 25% by 2020, and 50–70% by 2030, versus 2010 emissions. For CFIBs, China can
establish a 30–50% reduction target by 2020, and a 50–70% reduction target by 2030, compared to
2010 emissions.
In addition, we evaluated the emission levels achievable at the source level, based upon our estimation
of mercury concentrations in exhausted flue gases from CFPPs and CFIBs in China, after considering
the mercury content in Chinese coals and the removal efficiency of typical APCD combinations, and
the variation of mercury removal efficiency. We find most CFPPs can currently meet an emission
standard of 15 μg/m3, as compared to the existing standard of 30 μg/m
3, and most CFIBs can meet 20
μg/m3 as opposed to the current standard of 50 μg/m
3. A possible exception may be some
southwestern regions in China consuming coals with high mercury content.
To allow for the consumption of high mercury coal in some instances, we propose China consider
adopting a combination of an emission limit and a mercury removal efficiency when revising the
mercury emission standards for these sources, so that the regulatory agency/source could choose
between which component of the standard it chooses to apply due to its site-specific circumstances.
The combinative standard for CFPPs by 2020 could be an alternative between a concentration
emission limit of 8 μg/m3 or a mercury removal efficiency of 75%, and the combinative standard for
CFIBs by 2020 could be an alternative between an emission limit of 10 μg/m3 or a removal efficiency
of 70%. The concentration limits for 2020 are about half of the limits determined achievable by most
plants for 2010 in this study.
Based on the same methodology, the combinative standard for CFPPs by 2030 could be an alternative
between a concentration limit of 5 μg/m3 or a mercury removal efficiency of 85%, and the
combinative standard for CFIBs by 2030 could be an alternative between an emission limit of 7 μg/m3
or a removal efficiency of 75%.
5
1. Introduction
Mercury (Hg) is a trace heavy metal, attracting global attention due to its toxicity, persistence, long
range transport and bioaccumulation in the environment. Because of the regional and global
atmospheric circulation, mercury can travel for a long distance and deposit far away from emission
sources, causing the elevation of mercury or methyl-mercury level in organisms and subsequent losses
of human and ecological health and properties. The burden of disease of mercury, and the global
threats it poses to human health and the environment are well-recognized by governments and efforts
to confront the threat posed by mercury to human health and the environment have grown over the last
decades. In 2013, a legally binding international treaty, the Minamata Convention on Mercury, was
agreed. The Convention aims to protect human health and the environment from anthropogenic
mercury emissions and releases. China signed the Convention on October 10, 2013. As of February
2016, 128 countries have signed the Convention and 23 countries have ratified it.
The most significant releases of mercury emission are to the air. The total anthropogenic emissions
of mercury to the atmosphere in 2010 are estimated at 1,960 tonnes (UNEP, 2013). Mercury in the
atmosphere mainly exists in the gaseous form (Sprovieri et al., 2010). Atmospheric mercury can be
divided into total gaseous mercury (TGM) and particle-bound mercury (PBM) in physical forms.
TGM is further divided into gaseous elemental mercury (GEM) and reactive gaseous mercury (RGM)
in chemical forms (Ci et al., 2012). The three mercury species exhibit very different atmospheric
behaviors. RGM and to some extent PBM have a high surface reactivity and water solubility and are
readily scavenged from atmosphere through wet and dry deposition. However, GEM, the predominant
form of atmospheric Hg (>90% of the total mercury in the atmosphere), is fairly stable in the lower
atmosphere with a residence time of several months to over one year (Fu et al., 2012). Under normal
atmospheric condition, it disperses globally before it is oxidized by atmospheric oxidants (such as Br,
OH, O3, BrO, etc.) to RGM. Large amounts of mainly inorganic mercury have accumulated in the
environment, in particular in surface soils and in the oceans.
China is the largest contributor of anthropogenic mercury to the atmosphere. China's National
Implementation Plan (NIP) for implementation of the Minamata Convention is under preparation in
order to fulfill its commitment to mercury control and reduction. The predominant mercury emission
sources in China are coal combustion, non-ferrous metal smelting and cement production, contributing
47%, 22% and 18% to the total mercury emissions in China in 2010 based on the most recent

6
estimation (Zhang et al., 2015). These sources were listed as the top priorities of mercury emission
control in the Convention. Coal-fired power plants (CFPPs) and coal-fired industrial boilers (CFIBs)
are the largest contributors in the coal combustion sector. CFPPs are often the first sector for pilot
activities because they are better supervised for early actions. In 2011, the Ministry of Environmental
Protection initiated the pilot project on mercury monitoring and control for 16 coal-fired power plants
in China. CFIBs, on the other hand, are more widely spread and difficult to supervise and manage.
Since most of the CFIBs have small scale and low-efficiency air pollution control devices (APCDs),
the total amount of mercury emission from CFIBs may be equivalent to the amounts of emissions from
large point sources.
The Minamata Convention requires fundamental information on both the inventory of atmospheric
mercury emissions from CFPPs and CFIBs in China, and also the effectiveness of existing air
pollution control measures on mercury emission control. Among all the existing air pollution control
measures implemented in China for both conventional pollutants (PM, SO2, NOx) and mercury, the
Action Plan for Prevention and Control of Air Pollution (“Ten Measures”) has the most relevant and
important potential co-benefit impacts on the mercury emission control for CFPPs and CFIBs in China.
Therefore, the purpose of this study is to develop the mercury emission inventories for CFPPs and
CFIBs in China and to evaluate the potential of co-benefit mercury control for these two sectors during
2012–2017, based on existing or project domestic Chinese air pollution control programs. Future
scenarios for 2020 and 2030 are also developed to consider the possible additional requirements of the
Minamata Convention for BAT/BEP adoption for CFPPs and CFIBs. The outcome of this study will to
a certain extent fulfill the information gap of the coal combustion sector in China, relevant to the
Minamata Convention.
2. Methods for the development of mercury emission inventories
2.1. Model description
Most of the existing mercury emission inventories for China (Streets et al., 2005; UNEP, 2013) were
based on a deterministic emission factor approach, which can be described by Equation 1. Mean
values were used for all the parameters.

7
(1 ) 1i ij j ijk jk
i j k
E M A Q w R P
(E1)
where E is the mercury emission from coal-fired power plants, t/yr; M is the mercury content of coal
as burned, mg/kg; A is the amount of coal consumption, Mt/yr; Q is the percentage of washed coal in
the power plants; w is the mercury removal efficiency of coal washing; R is the release factor of
mercury from boiler; P is the application rate of a certain combination of APCDs; η is the mercury
removal efficiency of one combination of APCDs; i is the province; j is the combustor type; and k is
the type of APCD combinations.
This study adopted a technology-based probabilistic emission factor model to assess the mercury
emissions from coal-fired power plants and industrial boilers in China by province. Based on the
detailed data collected or investigated in this study, statistical distribution functions are built into the
model to address the uncertainties of key parameters (e.g., mercury content of coal, mercury removal
efficiency of APCDs, etc.). This model can be described by Equation 2:
( , ) ( ) (1 ) 1 ( )i jk i i ij j ijk jk jk
i j k
E x y M x A Q w R P y
(E2)
where E(x,y) is the probability distribution of the mercury emission from coal-fired power plants;
M(x) is the probability distribution of the mercury content of coal as burned; η(y) is the probability
distribution of the mercury removal efficiency of APCD combinations.
The model incorporates Monte Carlo simulations to take into account the probability distributions
of key input parameters and produce the mercury emission results in the form of a statistical
distribution. All the results are presented as distribution curves or confidence intervals instead of
single points. The mercury content of coal and the mercury removal efficiency of APCDs are the two
most variable parameters in the equation. Therefore, they were chosen to be considered as probability
distribution functions. Crystal Ball TM
was employed to accomplish the calculation. To get reliable
output, the sampling number for the Monte Carlo simulation was set to 10,000.
Core input parameters such as mercury concentration in coal and mercury removal efficiency by
APCDs fit the skewed distribution (e.g. lognormal distribution and Weibull distribution). Therefore,
the arithmetic mean values used in deterministic models were not able to reflect the best guesses of
these key parameters, which could probably result in overestimation or in rare cases underestimation
of the mercury emissions from given sectors. The calculations in this model for the coal combustion
sector were all technology-based and the APCD categorization was more detailed and updated. With

8
the adoption of the novel methodology and the consideration of uncertainty levels of key parameters
for the estimation of the coal combustion sector, the depiction of mercury emission inventories for
China was significantly improved in this study. More detailed information on the methodology can be
found in our recent papers (Zhang et al., 2012; Zhang et al., 2015).
Coal quality has significant influence on the mercury removal efficiency of APCDs. Considerable
amount of on-site measurements in CFPPs have been conducted in previous studies, based on which
we developed a sub-model for power plants in the inventory model. This sub-model mainly describes
the effect of coal quality, primarily chlorine content, on the mercury speciation, transformation and
removal in flue gas across APCDs in power plants. In general, high halogen content will yield greater
mercury removal, but there is lack of data to quantify the influence bromine content in coal. With the
sub-model integrated, Equation 2 can be modified as:
( , ) ( ) (1 ) 1 ( , )i i i i ij j ijk jk i i
i j k
E x z M x A Q w R P x z
(E3)
( , ) ( ), ( ),jkjk i i i i i i ix z f M x C z H (E4)
where E(x,z) is the probability distribution of the mercury emission from coal-fired power plants;
M(x) is the probability distribution of the mercury content of coal as burned; C(z) is the probability
distribution of the chlorine content of coal as burned; H is the ash content of coal as burned; η(x,z) is a
function of M(x), C(z) and H.
The sub-model is an empirical model based on the results from on-site measurements, linking coal
quality to the mercury behavior in the flue gas across each APCD in power plants. It starts from the
mercury speciation out of the boiler considering the mercury content, the chlorine content and the ash
content of coal, followed by evaluating the removal efficiencies of different mercury species according
to the proportions of the three species before each APCD. Details of the sub-model can be found in our
previous paper (Zhang et al., 2012).
2.2. Key parameters for inventory development
2.2.1. Mercury content of coal
The database of mercury coal content used in this study was based on Zhang et al. (2012) and
USGS (2004), covering almost all the large coal basins in China (Table 1). Shanxi and Inner Mongolia,
the largest two coal producers in China, have 88 and 46 samples respectively. For other large coal
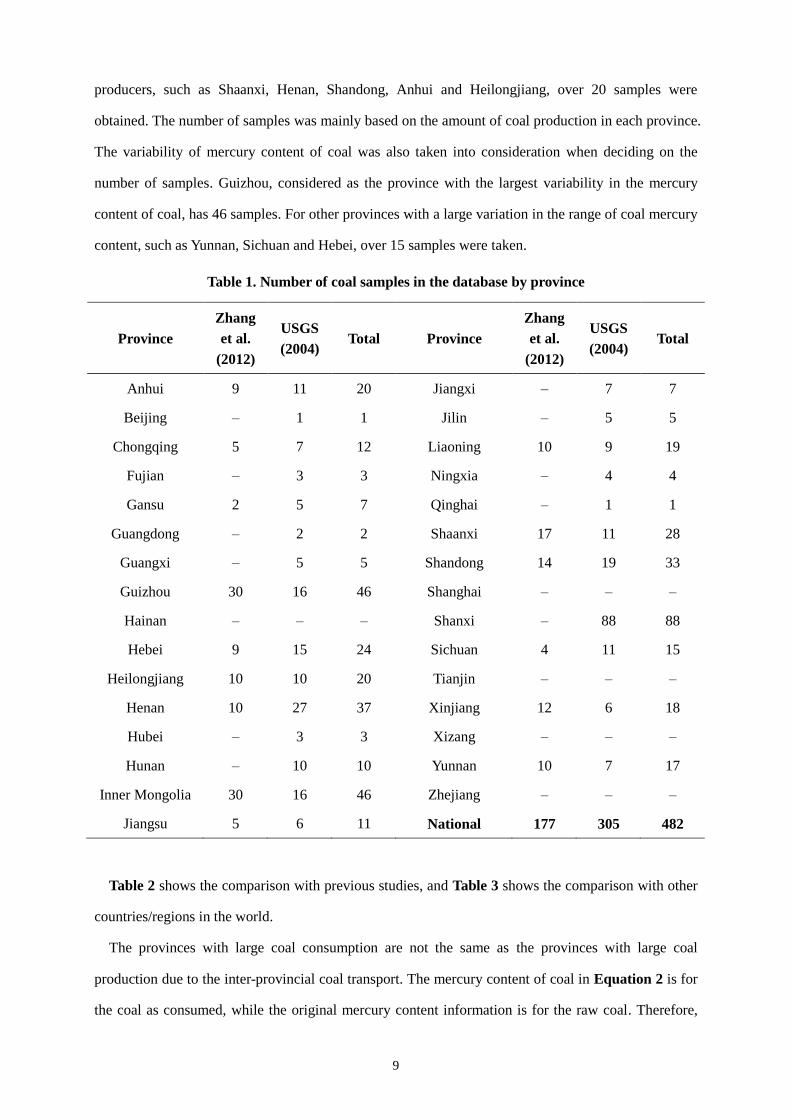
9
producers, such as Shaanxi, Henan, Shandong, Anhui and Heilongjiang, over 20 samples were
obtained. The number of samples was mainly based on the amount of coal production in each province.
The variability of mercury content of coal was also taken into consideration when deciding on the
number of samples. Guizhou, considered as the province with the largest variability in the mercury
content of coal, has 46 samples. For other provinces with a large variation in the range of coal mercury
content, such as Yunnan, Sichuan and Hebei, over 15 samples were taken.
Table 1. Number of coal samples in the database by province
Province
Zhang
et al.
(2012)
USGS
(2004) Total Province
Zhang
et al.
(2012)
USGS
(2004) Total
Anhui 9 11 20 Jiangxi – 7 7
Beijing – 1 1 Jilin – 5 5
Chongqing 5 7 12 Liaoning 10 9 19
Fujian – 3 3 Ningxia – 4 4
Gansu 2 5 7 Qinghai – 1 1
Guangdong – 2 2 Shaanxi 17 11 28
Guangxi – 5 5 Shandong 14 19 33
Guizhou 30 16 46 Shanghai – – –
Hainan – – – Shanxi – 88 88
Hebei 9 15 24 Sichuan 4 11 15
Heilongjiang 10 10 20 Tianjin – – –
Henan 10 27 37 Xinjiang 12 6 18
Hubei – 3 3 Xizang – – –
Hunan – 10 10 Yunnan 10 7 17
Inner Mongolia 30 16 46 Zhejiang – – –
Jiangsu 5 6 11 National 177 305 482
Table 2 shows the comparison with previous studies, and Table 3 shows the comparison with other
countries/regions in the world.
The provinces with large coal consumption are not the same as the provinces with large coal
production due to the inter-provincial coal transport. The mercury content of coal in Equation 2 is for
the coal as consumed, while the original mercury content information is for the raw coal. Therefore,

10
the mercury content of coal as consumed by province is a linear combination of the mercury content of
raw coal by province. A coal transport matrix was developed in this study to link the two datasets. The
coal transport matrix can be described as follows:
c pm Am (E5)
T
1 2
T
1 2
[ , , , ]
{ }
[ , , , ]
c c c cn
ij n n
p p p pn
m m m
a
m m m
m
A
m
where vector mc is the mercury content of coal as consumed in all the provinces; mp is the mercury
content of coal as produced in all the provinces; A is the coal transport matrix, and aij is the percentage
of the amount of coal transported from province j to province i; n is the number of provinces.

11
Table 2. Mercury content of raw coals by province in different studies (mg/kg)
Province Zheng et al.
(2007)
Ren et al.
(2006)
Streets et al.
(2005)
USGS
(2004)
Huang et al.
(2002)
Wang et al.
(2000)
Anhui 0.21 0.46(50) 0.26 0.19(11) 0.26 0.22
Beijing 0.34 0.10(1) 0.44 0.55(1) – 0.34
Chongqing – 0.64(12) – 0.15(7) – –
Fujian – – 0.08 0.07(3) – –
Gansu – 1.35(1) 0.05 0.05(5) – –
Guangdong – 0.10(1) 0.15 0.06(2) – –
Guangxi – – 0.30 0.35(5) – –
Guizhou 1.14 0.70(133) 0.52 0.20(16) 0.52 –
Hainan – – 0.15 – – –
Hebei 0.46 0.16(33) 0.14 0.14(15) 0.80 0.13
Heilongjiang 0.13 0.12(14) 0.09 0.06(10) 0.14 0.12
Henan 0.17 0.14(115) 0.25 0.21(27) 0.17 0.30
Hubei – 0.23(1) 0.16 0.16(3) – –
Hunan 0.07 0.08(14) 0.10 0.14(10) 0.07 –
Inner Mongolia 0.16 0.17(14) 0.22 0.16(16) 0.02 0.28
Jiangsu 0.09 0.18(10) 0.16 0.35(6) 0.09 –
Jiangxi 0.16 0.13(4) 0.22 0.27(7) – 0.16
Jilin 0.34 0.34(2) 0.20 0.07(5) – 0.33
Liaoning 0.17 0.14(16) 0.17 0.19(9) 0.13 0.20
Ningxia – 0.28(19) 0.20 0.21(4) – –
Qinghai – 0.31(4) 0.04 0.04(1) – –
Shaanxi 0.64 0.30(3) 0.11 0.14(11) 0.08 0.16
Shandong 0.28 0.18(11) 0.18 0.13(19) 0.21 0.17
Shanghai – – – – – –
Shanxi 0.08 0.17(79) 0.16 0.15(88) 0.20 0.22
Sichuan 0.18 0.35(14) 0.14 0.09(11) – –
Tianjin – – – – – 0.18
Xinjiang 0.03 0.09(6) 0.02 0.03(6) – 0.03
Xizang – – – – – –
Yunnan 0.30 0.32(56) 0.29 0.14(7) 0.34 –
Zhejiang – 0.75(2) 0.35 – – –
National 0.19 0.33(619) 0.19 0.16(305) 0.15 0.22

12
Table 3. Mercury content of raw coals from different countries/regions (mg/kg)
Country/region Coal rank Average Range Reference
Australia Bituminous – 0.03–0.4 Pirrone et al. (2001)
Argentina Bituminous 0.10(2) 0.03–0.18 Finkelman (2004)
Botswana Bituminous 0.09(11) 0.04–0.15 Finkelman (2004)
Brazil Bituminous 0.19(4) 0.04–0.67 Finkelman (2004)
Columbia Subbituminous 0.04(16) 0.02–0.17 Finkelman (2004)
Czech Bituminous 0.25(24) 0.02–0.73 Finkelman (2003)
Egypt Bituminous 0.12(14) 0.04–0.36 Finkelman (2003)
Germany Bituminous – 0.7–1.4 Pirrone et al. (2001)
Indonesia Lignite 0.11(8) 0.02–0.19 Finkelman (2003)
Indonesia Subbituminous 0.03(78) 0.01–0.05 US EPA (2002)
Japan Bituminous – 0.03–0.1 Pirrone et al. (2001)
New Zealand Bituminous – 0.02–0.6 Pirrone et al. (2001)
Peru Anthracite/Bituminous 0.27(15) 0.04–0.63 Finkelman (2004)
Philippines Subbituminous 0.04 0.04–0.1 Finkelman (2004)
Poland Bituminous – 0.01–1.0 Pirrone et al. (2001)
Romania Lignite/Subbituminous 0.21(11) 0.07–0.46 Finkelman (2004)
Russia Bituminous 0.11(23) 0.02–0.84 Finkelman (2003)
Slovakia Bituminous 0.08(7) 0.03–0.13 Finkelman (2004)
South Africa Bituminous – 0.01–1.0 Pirrone et al. (2001)
South America Bituminous 0.08(269) 0.01–0.95 US EPA (2002)
South Korea Anthracite 0.30(11) 0.02–0.88 Finkelman (2003)
Tanzania Bituminous 0.12(15) 0.04–0.22 Finkelman (2004)
Thailand Lignite 0.12(11) 0.02–0.57 Finkelman (2003)
Turkey Lignite 0.11(143) 0.03–0.66 Finkelman (2004)
Ukraine Bituminous 0.07(12) 0.02–0.19 Finkelman (2003)
UK Bituminous – 0.2–0.7 Pirrone et al. (2001)
USA Subbituminous 0.10(640) 0.01–8.0 US EPA (1997)
USA Lignite 0.15(183) 0.03–1.0 US EPA (1997)
USA Bituminous 0.21(3527) 0.01–3.3 US EPA (1997)
USA Anthracite 0.23(52) 0.16–0.30 US EPA (1997)
Vietnam Anthracite 0.28(3) 0.02–0.74 Finkelman (2004)
Yugoslavia Lignite 0.11(3) 0.07–0.14 Finkelman (2004)
Zambia Bituminous 0.60(12) 0.03–3.6 Finkelman (2004)
Zimbabwe Bituminous 0.08(3) 0.03–0.5 Finkelman (2004)

13
2.2.2. Mercury removal efficiency by APCDs
Besides the mercury content of coal, the mercury removal efficiency of air pollution control devices
(APCDs) is another key parameter in the model. Results of the 118 on-site measurements from
existing studies were summarized and analyzed to achieve a comprehensive understanding of mercury
removal across APCDs. Most of these test results were from China and the United States, and some
also came from Canada, Japan, South Korea, the Netherlands and Australia. Table 4 shows the
average mercury removal efficiencies of 18 different APCD combinations (including boiler type) for
both CFPPs and CFIBs. Cyclones (CYC) barely have any mercury removal efficiency (Streets et al.,
2005) and are thus not included in Table 4.
The combination of pulverized coal boiler (PC boiler), electrostatic precipitator (ESP) and wet flue
gas desulfurization (WFGD) is the most commonly used APCD combination for CFPPs in China in
2010 with an average mercury removal efficiency of 62%. With the increase of the application of
selective catalytic reduction system (SCR), PC+SCR+ESP+WFGD will be the most widely used
combination in the near future for CFPPs, the mercury removal efficiency of which averages 69%.
There are 63 observations for PC+ESP and 19 for PC+ESP+WFGD, and we developed a sub-model
for these two combinations based on the sufficient database (as described in Section 2.1). Data for the
combination of PC boiler and fabric filter (FF) are not enough for the sub-model, so we use the batch
fit function in Crystal Ball TM
to perform a probabilistic distribution fitting. As a result, the mercury
removal efficiency of PC+FF fits the Weibull distribution and corresponding parameters are acquired
based on field measurement data. The probabilistic distribution of the mercury removal efficiency of
PC+FF was directly used in the inventory model as described in Equation 2.
The combination of stoker fired boiler (SF boiler) and wet scrubber (WS) is widespread for CFIBs
in China in 2010 with an average mercury removal efficiency of 23%. Similar to the combination of
PC+FF for CFPPs, the mercury removal efficiency of the combination of SF+WS for CFIBs also fits
the Weibull distribution, and corresponding parameters are acquired based on field measurement data.
The probabilistic distribution of the mercury removal efficiency of SF+WS was directly used in the
inventory model as described in Equation 2. Integrated marble scrubber (IMS) is a special type of WS
for concurrent PM and SO2 removal, which is more and more widely adopted by CFIBs in China due
to its technological economy. The average mercury removal efficiency is 38%, higher than that of WS.
IMS uses Ca(OH)2 or NaOH as the sorbent to capture SO2, which has co-benefit on enhancing
mercury removal. However, different alkali addition rate will result in different mercury removal

14
efficiencies. Some CFIBs, especially large-scale boilers, have the same APCD configurations as
CFPPs, such as FF+WFGD. Although the scale of these devices for CFIBs are usually smaller than
those for CFPPs, no significant discrepancy is found for the mercury removal efficiency and the mean
value (86%) is used for FF+WFGD with either PC boiler or SF boiler.
The mercury removal efficiencies of APCD combinations other than PC+ESP, PC+ESP+WFGD,
PC+FF and SF+WS do not have enough data to perform a probabilistic distribution fitting. Therefore,
mean values are used in the calculation of mercury emission inventories.
Table 4. Average mercury removal efficiencies of air pollution control devices (%)
Overall Bituminous Anthracite Lignite Sub-bit
PC+ESP 29 (63) 29 (42) 22 (4) 38 (6) 27 (11)
PC+ESP+WFGD 62 (19) 63 (14) 81 (1) 65 (1) 50 (3)
PC+FF 67 (10) 66 (8) –
– 73 (2)
PC+SCR+ESP+WFGD 69 (4) 69 (4) –
– –
PC+FF+WFGD 86 (3) 90 (2) 79 (1) – –
PC+SCR+FF+WFGD 93 (2) 93 (2) – – –
PC+SDA+FF 59 (3) 99 (1) –
66 (1) 13 (1)
PC+SDA+ESP 70 (1) –
–
– 70 (1)
PC+ESP+CFB–FGD+FF 68 (1) 68 (1) –
– –
PC+SCR+SDA+FF 98 (2) 98 (2) –
– –
PC+NID+ESP 90 (1) –
90 (1) – –
PC+SNCR+ESP 83 (1) 83 (1) –
– –
SF+WS 23 (8) 23 (8) – – –
SF+IMS 38 (2) 17 (1) 59 (1) – –
SF+FF+WFGD 86 (3) 90 (2) 79 (1) – –
CFB+ESP 74 (3) 99 (1) –
66 (2) –
CFB+FF 86 (3) 100 (2) –
59 (1) –
CFB+SNCR+FF 84 (2) 89 (1) –
– 79 (1)
Note: the numbers in brackets are number of onsite measurements. PC – pulverized coal boiler; SF – stoker
fired boiler; CFB – circulating fluidized bed boiler; ESP – electrostatic precipitator; FF – fabric filter; WS –
wet scrubber; IMS – integrated marble scrubber; WFGD – wet flue gas desulfurization; CFB-FGD –
circulating fluidized bed flue gas desulfurization; NID – novel integrated desulfurization; SDA – spray
dryer absorber; SCR – selective catalytic reduction; SNCR – selective non-catalytic reduction.

15
2.2.3. Activity levels and APCD installation rates for the baseline year (2010)
(1) Coal-fired power plants (CFPPs)
In 2010, the total capacity of thermal power plants in China is 710 GW, 92% of which is CFPPs.
The total amount of electricity production from thermal power plants is 3417 TWh in 2010, and the
standard coal consumption is 333 gce/kWh averagely. According to China Energy Statistical Yearbook,
the total coal consumption in the power sector is 1545 million tonnes in 2010. Inner Mongolia,
Shandong and Jiangsu are the three provinces with the biggest coal consumption for power generation,
all exceeding 100 million tonnes in 2010. Pulverized coal (PC) boiler is the most widely used type of
boiler in the power sector, accounting for 88% of the total capacity. The rest of the power plants use
circulating fluidized bed (CFB) boiler. Only 2.1% of the coal for power use is washed in 2010.
For particulate matter (PM) control, electrostatic precipitators (ESP) are installed in 93% of all the
CFPPs, and the remaining plants use fabric filter (FF) or the combination of ESP and FF. In 2010, the
total PM emission from CFPPs is about 3 million tonnes with an intensity of less than 1.0 g/kWh. A
capacity of 560 GW installs SO2 control devices, accounting for 86% of the total capacity. Wet flue
gas desulfurization (WFGD) using limestone is the most popular technology (92%), and the rest are
WFGD using seawater or ammonia or CFB-FGD. In 2010, the total SO2 emission from CFPPs is 9.26
million tonnes with an intensity of 2.7 g/kWh, even lower than that of the USA in 2009 (3.4 g/kWh).
Only 14% of the total capacity installs NOx control devices in 2010. Over 95% uses selective catalytic
reduction system (SCR), and the rest uses selective non-catalytic reduction system (SNCR).
(2) Coal-fired industrial boilers (CFIBs)
Industrial boilers are those boilers which provide manufacturing and mining industries (e.g.
chemical industry, heating supply, iron and steel production, coal mining, etc.) with steam or hot water
to satisfy the needs of production, power, heating and so on. There are over 600,000 industrial boilers
in service in China with a capacity of 2.3 million tonnes of steam per hour (t/h). Over 80% of the
industrial boilers use coal as fuel, while others use natural gas, oil, biofuel or waste heat. In 2010,
approximately 730 million tonnes of coal was burned in CFIBs in China. Given that the average
mercury content of coal in China is 0.17 mg/kg, over 124 tonnes of mercury was released from CFIBs
to flue gases, a large percentage of which was emitted to the atmosphere eventually due to outdated
APCDs for CFIBs in China. Based on the National Investigation of Pollution Sources in China, most
of the industrial boilers in China (70% by unit) are in small scale with a capacity of less than 10 t/h.
Large-scale boilers (>35 t/h) only accounted 7% of the total by unit but contribute to 52% by capacity.

16
According to combustion mode, industrial boilers can be divided into stoker fired (SF) boiler,
chamber combustion (CC) boiler, and circulating fluidized bed (CFB) boiler. SF boiler is the most
widely used boiler type, accounting for over 90% of the capacity of small- and medium-scale boilers,
and 70% of large-scale boilers. As discussed below, most CFIBs in China only have low-efficiency
PM control devices including cyclone (CYC) and wet scrubber (WS), whose co-benefit mercury
removal efficiency is also low. WS has an average mercury removal rate of 23%, while CYC has
almost no co-benefit on mercury capture. High-efficiency PM control devices, including electrostatic
precipitator (ESP) and fabric filter (FF), have not yet been widely adopted for CFIBs in China.
Most of the small- and medium-scale CFIBs (95% of the total capacity) are equipped with wet
scrubbers (WS) to reduce PM emissions. Large-scale CFIBs also have a WS installation rate of over
80%. A small proportion (<20%) of large-scale CFIBs are equipped with FF and WFGD, the
combination of which have a high mercury removal efficiency of 86%. NOx control devices have not
yet been applied to CFIBs. No dedicated mercury control devices are used in this sector either.
2.3. Method for uncertainty analysis
Streets et al. (2005) analyzed the uncertainties of Hg emission inventory of anthropogenic sources
in China with a semi-quantitative approach by grading all the parameters in Hg emission factors. It
was only applicable to the deterministic emission factor model and had relatively lower reliability than
the quantitative method. Wu et al. (2010) used the P10–P90 confidence interval of the statistical
distribution of Hg emission as the uncertainty range, where P10/P90 value represents a probability of
10%/90% that the actual result would be equal to or below the P10/P90 value. However, this
uncertainty range was even larger than the result from the study of Streets et al., because these two
methods were not comparable. Therefore, a new approach was developed in our recent study to
determine the uncertainty range of a general skewed distribution for the model. The calculating
method is shown as Equation 6:
Mo1
P50
s ku
(E6)
where u is the uncertainty; Mo is the mode; P50 is the value at which there is a probability of 50%
the actual result would be equal to or below; σs− and σs
+ are the distances between Mo and the values
where the probability equal to f(Mo)/2; σk− and σk
+ are the distances between Mo and P20 or P80.
17
The uncertainty range of a normal distribution is described by the relative standard deviation (RSD).
The approach for uncertainty analysis in this study extended the use of the RSD in a normal
distribution case to a general skewed distribution case. The uncertainty range yielded from this
quantitative approach reflects both the span and the kurtosis of the skewed distribution, which is more
reasonable and distinguished from a confidence interval. This approach is better to compare with
previous studies, e.g. Streets et al. (2005). P10/P90 ranges from the study of Wu et al. (2010) can be
better referred as the confidence interval with a confidence degree of 80%. More details can be found
in our recent study (Zhang et al., 2015).
3. Projection of mercury emission control scenarios
3.1. Identification of air pollution control requirements for coal combustion
3.1.1. Action Plan for Prevention and Control of Air Pollution (“Ten Measures”)
The Action Plan for Prevention and Control of Air Pollution (“Ten Measures”) was released by the
State Council of China in June 2013. The goal of “Ten Measures” is to improve the nation air quality
and significantly reduce the heavy pollution episodes, especially for the Beijing-Tianjin-Hebei (BTH)
region, the Yangtze River Delta (YRD) region and the Pearl River Delta (PRD) region. The specific
objective of “Ten Measures” is to achieve a 10% reduction of PM10 concentration in all cities in China
from 2012 to 2017, and 25%, 20% and 15% reduction of PM2.5 concentrations respectively in the BTH,
YRD and PRD regions during this period, with a PM2.5 concentration threshold of 60 μg/m3 for
Beijing in 2017. These air pollution control measures will have co-benefits on atmospheric mercury
abatement. There are four major actions in “Ten Measures” for the coal combustion sector:
(1) Shutting down small-scale boilers and promoting centralized heat supply
Coal-fired industrial boilers with a capacity of less than 10 t/h in urban area need to be
eliminated;
New constructions of coal-fired industrial boilers with a capacity of less than 20 t/h in urban area
are strictly forbidden;
New constructions of coal-fired industrial boilers with a capacity of less than 10 t/h in other area
are strictly forbidden.
(2) Accelerating the construction of high-efficiency PM, SO2 and NOx control devices

18
All the coal-fired power plants are required to install SO2 control devices before 2017;
All the coal-fired power plants are required to install NOx control devices except for those with
circulating fluidized bed (CFB) boilers before 2017;
All the coal-fired industrial boilers with a capacity of over 20 t/h are required to install SO2
control devices before 2017.
(3) Controlling the total amount of coal consumption
The proportion of coal consumption in the total energy consumption is reduced to less than 65%;
The total amounts of coal consumption in the BTH, YRD and PRD regions decrease from 2012 to
2017.
(4) Promoting coal washing
Newly built coal mines are required to equip with coal washing devices;
The proportion of coal washing needs to be higher than 70% by 2017.
3.1.2. Emission Standard of Air Pollutants for Thermal Power Plants (GB 13223-2011)
Emission Standard of Air Pollutants for Thermal Power Plants (GB 13223-2011) was released in
July 2011 in replacement of GB 13223-2003. The emission thresholds for PM, SO2 and NOx
concentrations in the new standard were implemented on January 1, 2012 for newly built coal-fired
power plants and on July 1, 2014 for existing CFPPs. The tightening of the standards for conventional
air pollutants will accelerate the construction of high-efficiency PM, SO2 and NOx control devices,
which will have co-benefit on mercury emission control. The emission threshold for Hg concentration
in the exhausted flue gas from CFPPs in China was, for the first time, put forward and was
implemented on January 1, 2015. All the emission thresholds for PM, SO2, NOx and Hg concentrations
are listed in Table 5. The emission threshold for atmospheric mercury emission from thermal power
plants was for the first time adopted (0.03 mg/m3).
3.1.3. Emission Standard of Air Pollutants for Boilers (GB 13271-2014)
Emission Standard of Air Pollutants for Boilers (GB 13271-2014) was released in May 2014 to
replace GB 13271-2001. The tightening of the standards for conventional air pollutants will also
accelerate the construction of high-efficiency PM, SO2 and NOx control devices, which will have
co-benefit on mercury emission control. All the emission thresholds for PM, SO2, NOx and Hg

19
concentrations are listed in Table 6. The emission thresholds for PM, SO2, NOx and Hg concentrations
in the new standard became effective on July 1, 2014 for newly built coal-fired industrial boilers,
became effective on October 1, 2015 for existing coal-fired industrial boilers with a capacity of over
10 t/h or 7 MW, and on July 1, 2016 will be effective for existing coal-fired industrial boilers with a
capacity of less than 10 t/h or 7 MW. The emission threshold for Hg concentration in the exhausted
flue gas from coal-fired industrial boilers in China was for the first time adopted (0.05 mg/m3).
Table 5. New emission thresholds for coal-fired power plants in China (mg/m3)
Threshold for newly built
power plants
Threshold for existing
power plants
Special threshold for key
regions
PM 30 30 20
SO2 100
200 a)
200
400 a)
50
NOx 100
200 b)
100
200 b)
100
Hg 0.03 0.03 0.03
Notes: a) for coal-fired power plants in Guangxi, Chongqing, Sichuan and Guizhou; b) for coal-fired power
plants with W-shape flame boilers and CFB boilers or built before December 31, 2003.
Table 6. New emission thresholds for coal-fired industrial boilers in China (mg/m3)
Threshold for newly built
industrial boilers
Threshold for existing
industrial boilers
Special threshold for key
regions
PM 50 80 30
SO2 300 400
550 a)
200
NOx 300 400 200
Hg 0.05 0.05 0.05
Notes: a) for coal-fired power plants in Guangxi, Chongqing, Sichuan and Guizhou.

20
3.2. Projection of the 2017 scenarios
The “Ten Measures” is the most stringent emission control strategy among the three initiatives in
Section 3.1, although it is not mercury-specific. However, the requirement of the “Ten Measures” is in
the form of air quality (PM2.5 concentration threshold) instead of emission concentration threshold or
emission quantity cap. Chemical transport models (CTMs) are the only viable tools for evaluating the
response of air pollutant concentrations to certain control measures. One of the most widely used
CTMs is the Community Multi-scale Air Quality (CMAQ) model, developed by the US EPA (Byun
and Schere, 2006). The overall modeling domain covers almost all of China with a 36 km × 36 km
horizontal grid resolution, and three sub-domains with a 12 km × 12 km grid resolution cover the three
heavily polluted regions as specifically required in the “Ten Measures”, the BTH, YRD and PRD
regions. The CMAQ model links the emissions of different air pollutants to the air quality. This model
is especially necessary for PM2.5 because it has not only primary emissions from anthropogenic and
natural sources but also secondary formation from precursors such as SO2, NOx and VOCs. However,
due to the computational costs and the complication of the required emission inputs and processing,
using CMAQ models and still meeting time constraints of policy analysis present a difficult challenge.
A promising tool for addressing this challenge, Response Surface Model (RSM), has been developed
by using advanced statistical techniques to characterize the relationship between input parameters (i.e.,
emission changes) and model outputs (i.e., air quality responses) in a highly efficient and economical
manner (US EPA, 2006). RSM is a meta-model of air quality modeling, in other words, a reduced
form of the prediction model using statistical correlation structures to approximate model functions
through the design of complex multi-dimension experiments.
Based on the CMAQ/RSM model, the 2017 scenario was established in this study to meet with the
PM2.5 concentration requirement of the “Ten Measures”. The 2017 scenario is divided into two parts:
Energy Scenario and Control Scenario. Energy Scenario refers to the coal consumption in CFPPs and
CFIBs, and Control Scenario refers to the APCD applications. Table 7 shows the coal consumption in
CFPPs and CFIBs by province in 2012 and 2017. To meet with the requirements of “Ten Measures”,
the coal consumption in CFPPs will decrease from 1860 million tonnes in 2012 to 1747 million tonnes
in 2017, and that in CFIBs will be reduced from 787 million tonnes in 2012 to 716 million tonnes in
2017. The coal consumption of key regions will be highly restrained. Just like the “Ten measures”, the
Energy Scenario for 2017 is ambitious. The 2017 scenario is in accordance with the Policy Control
scenario in the China Coal Cap Project.

21
Table 7. Coal consumption in CFPPs and CFIBs by province in 2012 and 2017
Province
CFPPs CFIBs
2012 2017 2012 2017
Benchmark Control Benchmark Control
Anhui 72.97 70.02 20.61 18.74
Beijing 12.38 3.85 7.29 6.63
Chongqing 17.35 16.03 18.70 17.00
Fujian 57.30 59.87 15.98 14.53
Gansu 37.50 37.94 9.11 8.28
Guangdong 132.57 123.58 30.18 27.44
Guangxi 27.12 25.29 16.73 15.21
Guizhou 49.71 45.92 23.23 21.12
Hainan 7.67 7.02 0.42 0.39
Hebei 90.27 81.77 50.19 45.63
Heilongjiang 47.60 42.04 31.17 28.34
Henan 128.46 118.05 41.25 37.50
Hubei 47.60 46.87 52.76 47.97
Hunan 42.43 42.53 34.05 30.96
Inner Mongolia 143.90 140.67 41.51 37.73
Jiangsu 157.66 142.65 43.63 39.66
Jiangxi 32.15 31.87 10.84 9.86
Jilin 34.20 32.48 33.77 30.70
Liaoning 71.13 66.29 37.31 33.92
Ningxia 37.96 39.00 6.84 6.22
Qinghai 4.92 4.21 2.57 2.34
Shaanxi 57.34 59.68 18.88 17.17
Shandong 159.23 146.98 99.96 90.88
Shanghai 46.33 41.92 7.36 6.69
Shanxi 107.96 104.78 29.69 26.99
Sichuan 31.18 28.58 29.91 27.20
Tianjin 28.46 25.75 11.66 10.60
Xinjiang 27.83 24.69 21.24 19.31
Xizang 0.26 0.30 0.00 0.00
Yunnan 28.53 27.80 12.32 11.20
Zhejiang 120.24 108.79 28.02 25.47
National 1860.21 1747.22 787.20 715.63
Notes: the unit is million tonnes.

22
Figure 1 shows the application of different APCD combinations (including PM, SO2 and NOx
control devices) in CFPPs and CFIBs by province in 2012 and 2017.
Figure 1. Application of different APCD combinations in China by province
(a: CFPPs-2012; b: CFPPs-2017; c: CFIBs-2012; d: CFIBs-2017)
0
20
40
60
80
100A
nh
ui
Bei
jin
g
Chongqin
g
Fu
jian
Gan
su
Gu
angd
on
g
Gu
angx
i
Gu
izh
ou
Hai
nan
Heb
ei
Hei
long
jian
g
Hen
an
Hu
bei
Hu
nan
Inn
er M
on
go
lia
Jian
gsu
Jian
gx
i
Jili
n
Lia
on
ing
Nin
gx
ia
Qin
gh
ai
Shaa
nxi
Sh
and
on
g
Sh
ang
hai
Sh
anx
i
Sic
hu
an
Tia
nji
n
Xin
jian
g
Xiz
ang
Yu
nn
an
Zh
ejia
ng
AP
CD
ap
pli
cati
on
rat
e (%
)
WS IMS ESP FF ESP+WFGD FF+WFGD SCR+ESP+WFGD SCR+FF+WFGD
0
20
40
60
80
100
Anhui
Bei
jing
Chongqin
g
Fuji
an
Gan
su
Gu
angd
ong
Guan
gxi
Guiz
hou
Hai
nan
Heb
ei
Hei
longji
ang
Hen
an
Hubei
Hunan
Inner
Mongoli
a
Jian
gsu
Jian
gxi
Jili
n
Lia
onin
g
Nin
gx
ia
Qin
ghai
Shaa
nxi
Shan
dong
Shan
ghai
Shan
xi
Sic
huan
Tia
nji
n
Xin
jian
g
Xiz
ang
Yunnan
Zhej
iang
AP
CD
appli
cati
on r
ate
(%)
WS IMS ESP FF ESP+WFGD FF+WFGD SCR+ESP+WFGD SCR+FF+WFGD
0
20
40
60
80
100
Anhui
Bei
jing
Ch
ongq
ing
Fuji
an
Gan
su
Guan
gdong
Guan
gxi
Guiz
hou
Hai
nan
Heb
ei
Hei
longji
ang
Hen
an
Hubei
Hunan
Inner
Mongoli
a
Jian
gsu
Jian
gxi
Jili
n
Lia
onin
g
Nin
gxia
Qin
ghai
Shaa
nx
i
Shan
dong
Shan
ghai
Shan
xi
Sic
huan
Tia
nji
n
Xin
jian
g
Xiz
ang
Yunnan
Zhej
iang
AP
CD
appli
cati
on r
ate
(%)
WS IMS ESP FF ESP+WFGD FF+WFGD SCR+ESP+WFGD SCR+FF+WFGD
(a)
(b)
(c)
(d)

23
From 2012 to 2017, WFGD will be fully installed in CFPPs in China and the application rate of
SCR will increase from 34% to 82% based on the national total amount control of SO2 and NOx
emissions and the thresholds of SO2 and NOx in the Emission Standard of Air Pollutants for Thermal
Power Plants (GB 13223-2011). The requirement of PM2.5 were more stringent in the “Ten Measures”,
under which the retrofit from ESP to FF would be necessary. The BTH, YRD and PRD regions will be
the priority control regions for PM2.5, and thus the FF adoption rates for Beijing, Tianjin, Hebei,
Shanghai, Jiangsu, Zhejiang and Guangdong will be higher than those for the other provinces.
SCR+ESP+WFGD and SCR+FF+WFGD will be the dominant APCD combinations in CFPPs in 2017.
For CFIBs in China, the rapid increase of FF+WFGD will be a result from the stringent PM2.5 and SO2
control demand for CFIBs under the “Ten Measures”. The application rates for CFIBs of FF+WFGD
in the BTH, YRD and PRD regions are expected to be 50% to 60% by 2017.
Coal washing is another important measure in the “Ten Measures”. The overall coal washing rate
needs to reach 70% by 2017. Currently most washed coal goes to the coking sector. The proportion of
washed coal in the power sector was only 1.5% in 2012, and the proportion for CFIBs was only about
10% (NESA, 2013). To fulfill the requirement of the “Ten Measures”, the proportion of coal washing
will reach about 50% and 60% respectively for CFPPs and CFIBs by 2017, and 100% of the coal use
in the coking sector will be washed coal.
3.3. Projection of 2020 and 2030 scenarios
China is likely to ratify Minamata Convention by 2016 or 2017. Therefore, the period of 2017-2030
will be the time when dedicated mercury control measures are put into practice. Under the requirement
of Minamata Convention, China will need to adopt best available techniques or best environmental
practices (BAT/BEP) in the coal combustion sector. There is much larger uncertainty in the projection
of the 2020 and 2030 scenarios than the 2017 scenario. Therefore, we adopted multi-scenario analysis
to reflect the uncertainty level and evaluate the effectiveness of mercury emission control measures.
Three energy scenarios were developed respectively for CFPPs and CFIBs in 2020 and 2030, referred
to as 0, 1 and 2. Energy Scenarios 0 and 2 were established according to the Benchmark and Coal Cap
Scenarios in NRDC’s China Coal Cap Project, and Energy Scenario 1 was developed in this study by
Tsinghua Team. Energy Scenario 2 was an extension of the 2017 energy scenario based on the “Ten
Measures”.

24
3.3.1. Energy scenarios
Future projection of coal consumption, i.e., the energy scenarios for CFPPs and CFIBs, are shown
in Figure 2. The electricity demand will continue to increase, more aggressively during 2010-2020
than during 2020-2030, while the coal share in the energy structure will gradually decrease. For CFPPs,
a significant increase of coal consumption from 1.52 billion tonnes to 2.03 billion tonnes is expected
during 2010-2020 under ES0, and a decrease by 157 million tonnes will take place from 2020 to 2030;
the power coal consumption will reduce by 196 million tonnes during 2020-2030 under ES1; the peak
value by 2020 will be only 1.87 billion tonnes under ES2 which is the mildest scenario for the growth
of coal consumption, and the total amount will be 1.61 billion tonnes by 2030. The coal consumption
for CFIBs has similar situations to that for CFPPs under different energy scenarios expect for ES2,
under which the total amount will have slight decrease continuously from 2010 to 2030.
Figure 2. Future projections of coal consumption for CFPPs and CFIBs (2010-2030)
3.3.2. Control scenarios
The Minamata Convention will have more influence on the control scenarios, as shown in Figure 3.
Three control scenarios, namely business as usual (BAU) scenario, extended emission control (EEC)
scenario and accelerated control technology (ACT) scenario, were considered in this study. The BAU
scenario assumes that the air pollution control will basically follow policies and regulations by 2010.
0
500
1000
1500
2000
ES0 ES1 ES2 ES0 ES1 ES2
CFPPs CFIBs
Coal
consu
mpti
on (
mil
lion t
onnes
) 2010
2020
2030
25
The EEC scenario assumes more advanced air pollution control technologies will gradually spread out
based on the policies implemented after 2010 and those with the potential to be implemented in future.
The ACT scenario speeds up the implementation of all the air pollution control technologies to comply
with more stringent requirements from the Minamata Convention.
(1) CFPPs
For PM control, only ESP and FF were considered in the three scenarios for 2020 and 2030. Wet
particulate scrubbers are no longer applied in CFPPs in China. In 2010, 93% of the power plants were
equipped with ESP. However, the requirement of PM control is becoming more and more stringent,
which implies that the removal efficiency for finer particulate matter (i.e., PM2.5 or PM1) is likely to be
improved in the near future. The new emission standard of air pollutants for power plants released in
July 2011 set a threshold of 30 mg/m3 for the total suspended particulate (TSP). This threshold can be
attained by combining ESP with FGD for coal with lower ash content. For coal with higher ash
content, FF has to be installed to attain the emission limit. However, FF is more expensive, especially
for the replacement of ESP in existing plants. Considering the implementation limits, the installed
capacity with FF is assumed to take up 10–20% by 2020 and 20–35% by 2030 in various scenarios.
For SO2 control, 81% of the units had been equipped with FGD by the end of 2010. Based on the
new standard for air pollutant emissions from power plants, the FGD installation rate will reach 100%.
Chinese legislation requires power plants operate FGD no less than 95% of the electricity generating
hours. Considering the maintenance of FGD, we assume that 90–100% of the units will use FGD by
2020. In the EEC and ACT scenarios for 2030, the FGD application rate is assumed to reach 100%.
Wet FGD is the most cost-effective SO2 control technology and the only technology that can fit the
new SO2 emission standard. Therefore, all the FGDs applied in CFPPs are assumed to be wet FGDs.
For NOx control, the Chinese government aims to reduce the total anthropogenic NOx emissions by
10% during the 12th five-year period (2011–2015), and power plants are regarded as the key sector for
NOx emission reduction. The BAU scenario is in line with the total NOx emission control in the 12th
Five-Year Plan. As a result, 45% and 60% of the power units will be equipped with SCR by 2020 and
2030, respectively. The new emission standard is even more aggressive than the total NOx emission
control plan, which requires most power plants to be equipped with flue gas denitration technology.
The EEC scenario and the ACT scenario are based on the new emission standard. By 2020, 85% and
95% of the units will install SCR in the two scenarios respectively. By 2030, 95% of the units will be
applied with SCR and the rest 5% with SNCR in both the EEC and ACT scenarios.

26
The ratification of the Minamata Convention might set up a more challenging target for atmospheric
mercury emission reduction. Therefore, specific mercury control (SMC) technologies, such as bromide
injection into the furnace (BIF) or activated carbon injection (ACI), will be used besides the existing
APCDs. It will take several years to demonstrate and evaluate the best available technologies on
mercury, so there will be no SMC applications before 2020. However, SMC will be gradually applied
in CFPPs from 2020 to 2030 with an application rate of 10–50%. United States Environmental
Protection Agency (US EPA) has recently issued a new standard for mercury control in power plants.
Based on this new standard the average mercury removal efficiency in US power plants will be 91%.
Our control scenario projection is based on this new standard. In the ACT scenario by 2030, the
average mercury removal efficiency in Chinese power plants will reach 90%.
Coal washing is an effective way to reduce multi-pollutants. In China, the overall coal washing rate
is 18% in 2010 (NESA, 2011). Over 70% of the washed coal went to the coking sector in 2010. The
application rate of coal washing in the power sector in 2010 was only 2.1% due to high price and
inapplicability to existing boilers. In the ACT scenario, coal washing will follow the assumption of the
2017 scenario. Therefore, the application rates of coal washing for CFPPs are assumed to be 30–50%
by 2020 and 40–70% by 2030 in the three control scenarios.
(2) CFIBs
For PM control, more or less 90% of the CFIBs in China were equipped with WS or IMS in 2010,
and only 10% installed FF. To meet with the requirement of the “Ten Measures” and the new emission
thresholds for CFIBs, more FFs will be applied for fine PM control. Under the BAU scenario in 2020,
one fourth of the CFIBs will have FF installed, while 50% and 65% installation rates are expected
under the EEC and ACT scenarios, respectively. By 2030, the FF installation rates will reach 35%, 60%
and 80% under the BAU, EEC and ACT scenarios, respectively. ESP is not considered for CFIBs since
it is not often used for industrial boilers because the scale of industrial boilers is usually much smaller
than utility boiler used in CFPPs and ESP is not very economical.
For SO2 control, IMS is a type of APCDs that reduces both PM and SO2 emissions. However, the
SO2 removal efficiency of IMS is not enough to meet with the new SO2 emission standard for CFIBs
in China. More and more widespread use of WFGD is required in the near future. In this study, we
assume that all the CFIBs equipped with FF in 2020 or 2030 are also going to have WFGD by then.
Aside from WFGDs with limestone slurry (CaCO3), MgO slurry is also an option for WFGD equipped
for industrial boilers.

27
For NOx control, no SCR or SNCR was installed for industrial boilers in 2010. To fulfill the target
of total NOx emission control in the 12th Five-Year Plan and the requirement of the new NOx emission
standard for CFIBs, NOx control devices will be gradually popularized. SCR is assumed to be applied
to most large-scale boilers. As a result, the overall application rate of SCR will be 5–35% under the
three different scenarios by 2020. By 2030, the SCR application rate will reach 10%, 30% and 60%
under the BAU, EEC and ACT scenarios, respectively.
Figure 3. Application of different APCD combinations for CFPPs and CFIBs from 2010 to 2030
(a: BAU scenario; b: EEC scenario; c: ACT scenario)
0
20
40
60
80
100
2010 2020 2030 2010 2020 2030
CFPPs CFIBs
AP
CD
appli
cati
on r
ate
(%)
SMC+SCR+ESP+WFGD
SNCR+ESP+WFGD
SCR+FF+WFGD
SCR+ESP+WFGD
FF+WFGD
ESP+WFGD
FF
ESP
IMS
WS
0
20
40
60
80
100
2010 2020 2030 2010 2020 2030
CFPPs CFIBs
AP
CD
appli
cati
on r
ate
(%)
SMC+SCR+ESP+WFGD
SNCR+ESP+WFGD
SCR+FF+WFGD
SCR+ESP+WFGD
FF+WFGD
ESP+WFGD
FF
ESP
IMS
WS
0
20
40
60
80
100
2010 2020 2030 2010 2020 2030
CFPPs CFIBs
AP
CD
appli
cati
on r
ate
(%)
SMC+SCR+ESP+WFGD
SNCR+ESP+WFGD
SCR+FF+WFGD
SCR+ESP+WFGD
FF+WFGD
ESP+WFGD
FF
ESP
IMS
WS
(a)
(b)
(c)
28
The application rate of coal washing for CFIBs in 2010 was only about 10% due to high price and
inapplicability to existing boilers. In the ACT scenario, coal washing will follow the assumption of the
2017 scenario. Therefore, the application rates of coal washing for CFIBs are assumed to be 40–60%
by 2020 and 50–80% by 2030 in the three control scenarios.
4. Potential of co-benefit mercury control for CFPPs in China
The inventory of atmospheric mercury emissions from CFPPs in 2010 was first established to set a
baseline. The effectiveness of control measures including the “Ten Measures” and the new emission
standard on co-benefit mercury removal was then evaluated for the period of 2012-2017. Potential of
co-benefit mercury control for CFPPs by 2020 and 2030 was assessed based on scenario projection.
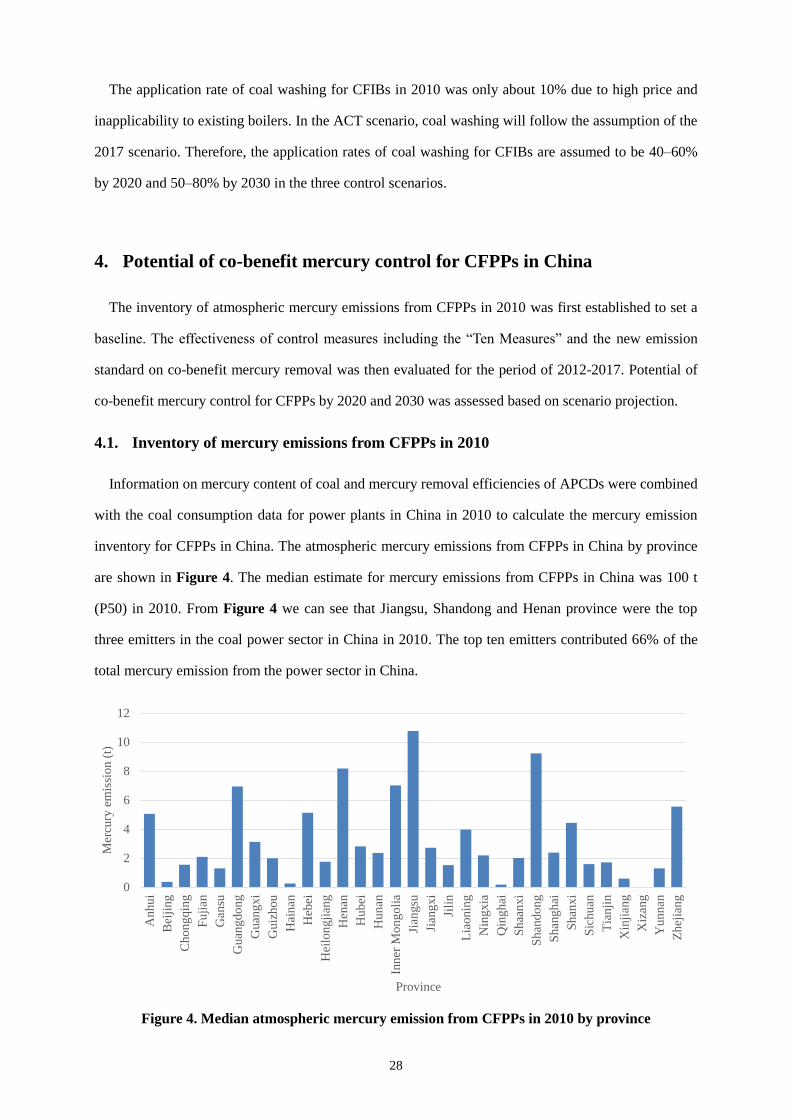
4.1. Inventory of mercury emissions from CFPPs in 2010
Information on mercury content of coal and mercury removal efficiencies of APCDs were combined
with the coal consumption data for power plants in China in 2010 to calculate the mercury emission
inventory for CFPPs in China. The atmospheric mercury emissions from CFPPs in China by province
are shown in Figure 4. The median estimate for mercury emissions from CFPPs in China was 100 t
(P50) in 2010. From Figure 4 we can see that Jiangsu, Shandong and Henan province were the top
three emitters in the coal power sector in China in 2010. The top ten emitters contributed 66% of the
total mercury emission from the power sector in China.
Figure 4. Median atmospheric mercury emission from CFPPs in 2010 by province
0
2
4
6
8
10
12
An
hu
i
Bei
jin
g
Ch
on
gq
ing
Fu
jian
Gan
su
Gu
ang
do
ng
Gu
ang
xi
Gu
izh
ou
Hai
nan
Heb
ei
Hei
lon
gji
ang
Hen
an
Hu
bei
Hu
nan
Inn
er M
on
go
lia
Jian
gsu
Jian
gx
i
Jili
n
Lia
onin
g
Nin
gx
ia
Qin
gh
ai
Sh
aan
xi
Sh
and
on
g
Shan
ghai
Sh
anx
i
Sic
hu
an
Tia
nji
n
Xin
jian
g
Xiz
ang
Yu
nn
an
Zh
ejia
ng
Mer
cury
em
issi
on
(t)
Province

29
4.2. Effectiveness of measures on mercury removal from CFPPs during 2012–2017
Based on the PM10 and PM2.5 concentration thresholds in the “Ten Measures” for both the whole
China and the three key regions, the CMAQ/RSM model yielded fairly ambitious control scenarios for
2017. Not only the advanced APCDs for PM, SO2 and NOx control need a rapid growth, but the coal
consumption also requires aggressive restraint. As a result, the total atmospheric mercury emission
from CFPPs in China will be reduced from 93.8 t in 2012 to 58.1 t in 2017. Figure 5 shows the total
mercury emission from CFPPs by province during 2012–2017. Inner Mongolia, Jiangsu, Shandong,
Henan and Guangdong will remain the top five emitters, but the total emissions of these provinces will
decrease by 36–43% from 2012 to 2017. Due to the most stringent control measures to be conducted
in Beijing, the mercury emission from CFPPs in Beijing will be reduced by 76%.
The extended North China Plain region (including Inner Mongolia, Hebei, Beijing, Tianjin, Henan
and Shandong), the YRD region (Jiangsu, Zhejiang and Shanghai) and the PRD region (mostly
Guangdong) will have significant co-benefits of mercury removal in CFPPs from the “Ten Measures”.
The 2017 scenario for CFPPs is quite ambitious, consistent with the 2020-ACT scenario (the most
stringent one) which will be discussed in Section 4.3. The main purpose of this scenario is to evaluate
the effect of the “Ten Measures” on mercury emission control. The overall proportion of mercury
reduction for CFPPs during 2012–2017 is 38%. The proportions for Shanxi, Shaanxi and Anhui will
be below the national average, which needs extra attention in the future.
Figure 5. Atmospheric mercury emission from CFPPs by province during 2012–2017
0
2
4
6
8
10
12
Anhui
Bei
jing
Ch
on
gqin
g
Fuji
an
Gan
su
Guan
gdong
Guan
gxi
Guiz
hou
Hai
nan
Heb
ei
Hei
longji
ang
Hen
an
Hubei
Hunan
Inner
Mongoli
a
Jian
gsu
Jian
gx
i
Jili
n
Lia
onin
g
Nin
gxia
Qin
ghai
Shaa
nxi
Shan
dong
Shan
ghai
Shan
xi
Sic
huan
Tia
nji
n
Xin
jian
g
Xiz
ang
Yunnan
Zhej
iang
Mer
cury
em
issi
on (
t)
Province
2012 2017
30
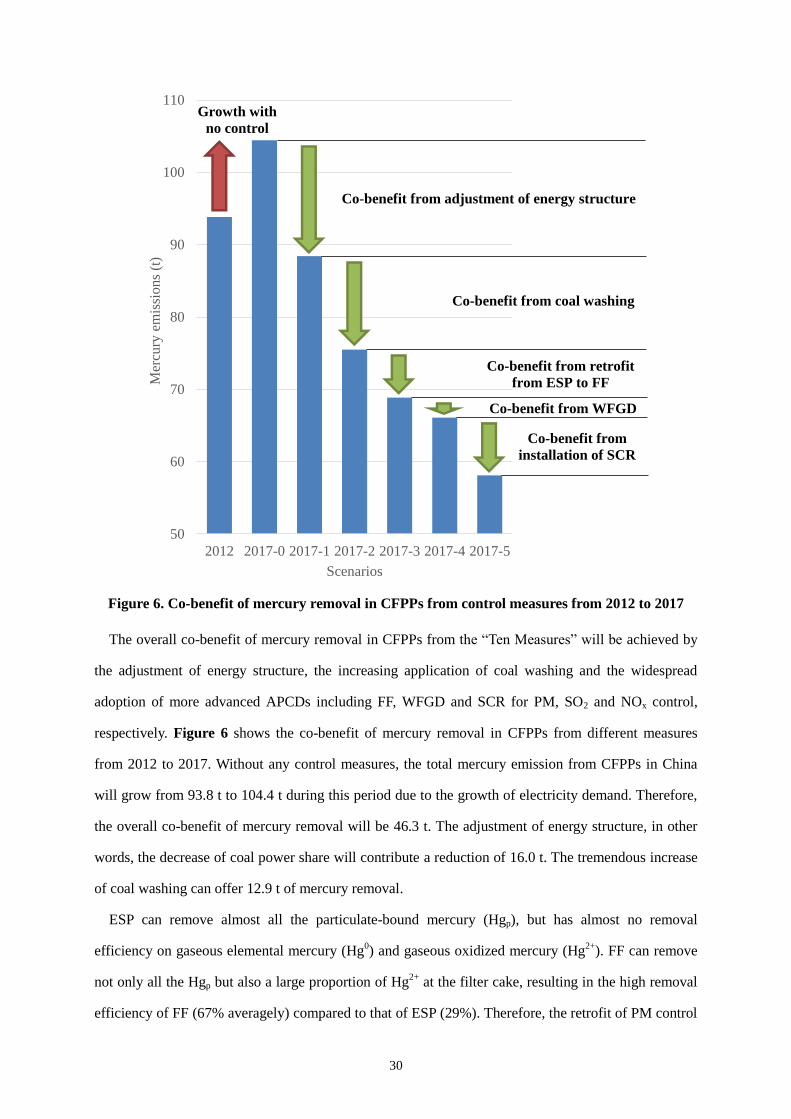
Figure 6. Co-benefit of mercury removal in CFPPs from control measures from 2012 to 2017
The overall co-benefit of mercury removal in CFPPs from the “Ten Measures” will be achieved by
the adjustment of energy structure, the increasing application of coal washing and the widespread
adoption of more advanced APCDs including FF, WFGD and SCR for PM, SO2 and NOx control,
respectively. Figure 6 shows the co-benefit of mercury removal in CFPPs from different measures
from 2012 to 2017. Without any control measures, the total mercury emission from CFPPs in China
will grow from 93.8 t to 104.4 t during this period due to the growth of electricity demand. Therefore,
the overall co-benefit of mercury removal will be 46.3 t. The adjustment of energy structure, in other
words, the decrease of coal power share will contribute a reduction of 16.0 t. The tremendous increase
of coal washing can offer 12.9 t of mercury removal.
ESP can remove almost all the particulate-bound mercury (Hgp), but has almost no removal
efficiency on gaseous elemental mercury (Hg0) and gaseous oxidized mercury (Hg
2+). FF can remove
not only all the Hgp but also a large proportion of Hg2+
at the filter cake, resulting in the high removal
efficiency of FF (67% averagely) compared to that of ESP (29%). Therefore, the retrofit of PM control
50
60
70
80
90
100
110
2012 2017-0 2017-1 2017-2 2017-3 2017-4 2017-5
Mer
cury
em
issi
ons
(t)
Scenarios
Growth with
no control
Co-benefit from adjustment of energy structure
Co-benefit from coal washing
Co-benefit from retrofit
from ESP to FF
Co-benefit from WFGD
Co-benefit from
installation of SCR

31
devices from ESP to FF for fine particle control in CFPPs will lead to 6.6 t of mercury removal. The
application of FGD has been spread out in Chinese CFPPs during the 11th Five-Year Plan period
(2005–2010). The further increase of WFGD installation rate can provide 2.8 t of mercury removal.
NOx control is the focus in the 12th and 13th Five-Year Plan periods. The SCR adoption rate will be
growing rapidly during 2012–2017, contributing to 8.0 t of mercury removal in Chinese coal-fired
power sector. Therefore, in the aggregate, APCD improvements will yield an estimated 17.4 t of
mercury emission reductions.
4.3. Potential of co-benefit mercury control for CFPPs by 2020 and 2030
Base on the projections of both the coal consumption in CFPPs in China and application of the
emission control technologies, the future trends of mercury emissions from CFPPs were calculated
with the probabilistic mercury emission factor model, as shown in Figure 7. All the values are the
median estimates (P50). From 2010 to 2020, the mercury emissions will decrease by 11%, 21% and 30%
respectively under the BAU0, EEC0 and ACT0 scenarios. Under the energy scenario developed in this
study, the mercury emissions under the BAU1, EEC1 and ACT1 scenarios will decrease by 15%, 25%
and 34% respectively in 2020, compared with that in 2010. The high growth rates of the installation of
WFGD and SCR will play an important role during this period. Under the coal control energy scenario
from China Coal Cap Project extending from the 2017 energy scenario based on the “Ten Measures”,
the BAU2, EEC2 and ACT2 scenarios will have 18%, 27% and 36% mercury reduction respectively
during 2010–2020. Averagely the mercury emission from CFPPs in 2020 will be about 25% lower
than that of 2010, due to influence of both the increase of electricity demand and the implementation
of APCDs. It indicates that the co-benefit of mercury removal from the accelerated control measures
for PM and NOx in the period of 2010–2020 will conquer the enhancement of mercury emission
brought by the increase of electricity demand. All the scenarios for 2030 will be much lower than the
corresponding ones for 2020. The decreasing trend in the period of 2020–2030 will be sharper than
that during 2010–2020. Under the BAU0, EEC0 and ACT0 scenarios for 2030, the mercury emission
will decrease by 35%, 60% and 73% compared with that in 2010. The reduction proportion for the
ES1 series (i.e., BAU1, EEC1 and ACT1 scenarios) will be 40%, 63% and 75% respectively during
2010–2030. Under the most stringent scenario (ACT2) in 2030, the total mercury emission will be
only 23.1 t, 77% lower than that of 2010. This shows the significant mitigation potential of mercury

32
emissions from CFPPs in China in the future. The mercury emissions under the ES1 series scenarios
are 5% and 7% lower than those under the ES0 series scenarios in 2020 and 2030 respectively, while
the differences between ES1 series and ES2 series are 3% and 7% for 2020 and 2030 respectively.
This reveals the uncertainty of mercury reduction potential as a result of energy restructuring in the
two decades. The mercury emission under the EEC1 scenario is 11% lower than the BAU1 scenario in
2020, which is mainly contributed by the widespread application of SCR. The difference between
EEC1 and ACT1 scenarios for 2020 is 12%. This is due to the increase of FF applications. Comparing
the EEC1 scenario with the ACT1 scenario for 2030, the mercury emission in the ACT scenario is 33%
lower, which is mainly due to the enhancement of SMC applications.
Figure 7. Scenario projections of total mercury emission from CFPPs during 2010–2030
5. Potential of co-benefit mercury control for CFIBs in China
The inventory of atmospheric mercury emissions from CFIBs in 2010 was first established to set a
baseline. The effectiveness of control measures including the “Ten Measures” and the emission
standard on co-benefit mercury removal was then evaluated for the period of 2012–2017. Potential of
co-benefit mercury control for CFIBs by 2020 and 2030 was assessed based on scenario projection.
0
20
40
60
80
100
120
2010 2020 2030
Atm
osp
her
ic m
ercu
ry e
mis
sion
s(t
)
BAU0 EEC0 ACT0
BAU1 EEC1 ACT1
BAU2 EEC2 ACT2

33
5.1. Inventory of mercury emissions from CFIBs in 2010
The atmospheric mercury emissions from CFIBs in China by province are shown in Figure 8. The
median estimate for mercury emissions from CFIBs in China was 72.5 t (P50) in 2010. From Figure 8
we can see that Shandong, Henan, Hubei, Jiangsu, Hebei, Inner Mongolia, Liaoning, Guangdong,
Anhui and Zhejiang were the top ten emitters in the CFIB sector in China in 2010, accounting for 62%
of the total mercury emission from CFIBs in China.
Figure 8. Atmospheric mercury emission from CFIBs in 2010 by province
5.2. Effectiveness of measures on mercury removal for CFIBs during 2012–2017
Based on the PM10 and PM2.5 concentration thresholds in the “Ten Measures” for both the whole
China and the three key regions, the CMAQ/RSM model yielded fairly ambitious control scenarios for
2017. Not only the advanced APCDs for PM, SO2 and NOx control need a rapid growth, but the coal
consumption also requires aggressive restraint. As a result, the total atmospheric mercury emission
from CFIBs in China will be reduced from 75.7 t in 2012 to 40.5 t in 2017. Figure 9 shows the total
mercury emission from CFIBs by province during 2012–2017. Shandong, Hubei and Inner Mongolia
will remain the top three emitters, but the total emissions of these provinces will decrease by over 40%
from 2012 to 2017. Due to the stringent control measures to be conducted in key regions, the mercury
emission from CFIBs in Beijing, Tianjin, Hebei, Jiangsu, Zhejiang, Shanghai and Guangdong will be
reduced by 64–73%.
The extended North China Plain region (including Shandong, Inner Mongolia, Hebei, Beijing,
0
2
4
6
8
10
An
hu
i
Bei
jin
g
Ch
on
gq
ing
Fu
jian
Gan
su
Gu
ang
do
ng
Gu
ang
xi
Gu
izh
ou
Hai
nan
Heb
ei
Hei
lon
gji
ang
Hen
an
Hu
bei
Hu
nan
Inn
er M
on
go
lia
Jian
gsu
Jian
gx
i
Jili
n
Lia
on
ing
Nin
gx
ia
Qin
gh
ai
Sh
aan
xi
Sh
and
on
g
Sh
ang
hai
Sh
anx
i
Sic
hu
an
Tia
nji
n
Xin
jian
g
Xiz
ang
Yu
nn
an
Zh
ejia
ng
Mer
cury
em
issi
on
(t)
Province

34
Tianjin and Henan), the YRD region (including Shanghai, Jiangsu and Zhejiang) and the PRD region
(mostly Guangdong) will have significant co-benefits of mercury removal in CFIBs from the “Ten
Measures”. The 2017 scenario for CFIBs is quite ambitious, consistent with the 2020-ACT scenario
(the most stringent one) which will be discussed in Section 5.3. The main purpose of this scenario is to
evaluate the effect of the “Ten Measures” on mercury emission control.
Figure 9. Atmospheric mercury emission from CFIBs by province during 2012–2017
The overall co-benefit of mercury removal in CFIBs from the “Ten Measures” will be contributed
by the adjustment of energy structure, the increasing application of coal washing and the widespread
adoption of more advanced APCDs including FF, WFGD and SCR for PM, SO2 and NOx control,
respectively. Figure 10 shows the co-benefit of mercury removal in CFIBs from different measures
from 2012 to 2017. Without any control measures, the total mercury emission from CFIBs in China
will grow from 75.7 t to 86.1 t during this period due to the growth of electricity demand. Therefore,
the overall co-benefit of mercury removal will be 45.7 t, almost the same as the co-benefit from the
coal-fired power sector. The adjustment of energy structure, in other words, the decrease of coal use in
industrial boilers will contribute to the most co-benefit of mercury removal (17.3 t). The tremendous
increase of coal washing can offer 10.8 t of mercury removal.
WS and IMS can only capture most of the particulate-bound mercury (Hgp) and a small part of
gaseous oxidized mercury (Hg2+
), but they have almost no removal efficiency on gaseous elemental
mercury (Hg0). Moreover, the SO3
2- in the slurry can even reduce Hg
2+ to Hg
0, resulting in Hg
0
re-volatilization. FF can removal not only all the Hgp but also a large proportion of Hg2+
at the filter
cake, resulting in the high removal efficiency of FF (67% averagely) compared to that of WS (23%)
0
2
4
6
8
10
Anhui
Bei
jing
Ch
on
gqin
g
Fuji
an
Gan
su
Guan
gdong
Guan
gxi
Guiz
hou
Hai
nan
Heb
ei
Hei
longji
ang
Hen
an
Hubei
Hunan
Inner
Mongoli
a
Jian
gsu
Jian
gx
i
Jili
n
Lia
onin
g
Nin
gxia
Qin
ghai
Shaa
nxi
Shan
dong
Shan
ghai
Shan
xi
Sic
huan
Tia
nji
n
Xin
jian
g
Xiz
ang
Yunnan
Zhej
iang
Mer
cury
em
issi
on (
t)
Province
2012 2017

35
and that of IMS (38%). Therefore, the retrofit of PM control devices from WS or IMS to FF for fine
PM control in CFIBs will lead to 12.0 t of mercury removal. The growth of WFGD installation rate
can provide 5.2 t of mercury removal. The application of SCR can only contribute another 0.3 t of
mercury removal due to the already high mercury removal efficiency of FF+WFGD. In the aggregate,
APCD improvements yield 17.5 t of mercury emission reductions.
The control measure of shutting down small-scale boilers (with capacity less than 10 t/h) contributes
to both the adjustment of energy structure and the retrofit from outdated APCDs to high-efficiency
ones. Small boilers are not as energy-efficient as large ones and consume more coal producing the
same amount of steam. Replacing them with large ones will reduce the coal consumption. Moreover,
high-efficiency APCDs such as FF and WFGD are more economical for large boilers, which will thus
accelerate the retrofit. Therefore, although the effectiveness of shutting down small-scale boilers was
not evaluated directly in this study, it is a cost-effective measure.
Figure 10. Co-benefit of mercury removal in CFIBs from control measures from 2012 to 2017
30
40
50
60
70
80
90
2012 2017-0 2017-1 2017-2 2017-3 2017-4 2017-5
Mer
cury
em
issi
ons
(t)
Scenarios
Growth with no control
Co-benefit from adjustment of energy structure
Co-benefit from coal washing
Co-benefit from retrofit
from WS/IMS to FF
Co-benefit from
installation of WFGD
Co-benefit from
installation of SCR

36
5.3. Potential of co-benefit mercury control for CFIBs by 2020 and 2030
Based on the projections of both the coal consumption in CFIBs in China and application of the
emission control technologies, the future trends of mercury emissions from CFIBs were calculated
with the probabilistic mercury emission factor model, as shown in Figure 11. All the values are the
median estimates (P50). From 2010 to 2020, the mercury emissions will decrease by 15%, 41% and 57%
respectively under the BAU0, EEC0 and ACT0 scenarios. Under the energy scenario developed in this
study, the mercury emissions under the BAU1, EEC1 and ACT1 scenarios will decrease by 24%, 48%
and 61% respectively in 2020, compared with that in 2010. The high growth rates of the installation of
FF and WFGD will play an important role during this period. Under the coal control energy scenario
from China Coal Cap Project extending from the 2017 energy scenario based on the “Ten Measures”,
the BAU2, EEC2 and ACT2 scenarios will have 33%, 54% and 66% mercury reduction respectively
during 2010–2020. Averagely the mercury emission from CFIBs in 2020 will be 44% lower than that
of 2010.The retrofit from WS/IMS to FF and the adoption of WFGD have a significant mercury
control co-benefit. All the scenarios for 2030 will be much lower than the corresponding ones for 2020.
The decreasing trend in the period of 2020–2030 will be milder than that during 2010–2020. This
indicates the co-benefit of mercury control measures for CFIBs in the first decade. Under the BAU0,
EEC0 and ACT0 scenarios for 2030, the mercury emission will decrease by 29%, 56% and 74%
compared with that in 2010. The reduction proportion for the BAU1, EEC1 and ACT1 scenarios will
be 36%, 60% and 76% respectively during 2010–2030. Under the ACT2 scenario for 2030, the
mercury emission can be reduced by 79% from that of 2010.
The mercury emissions under the ES1 series scenarios are 11% and 10% lower than those under the
ES0 series scenarios in 2020 and 2030 respectively, while the differences between ES1 series and ES2
series are 12% and 13% for 2020 and 2030 respectively. This reveals the uncertainty of mercury
reduction potential as a result of energy restructuring in the two decades. As the share of coal use for
CFIBs decreases, the mercury emission will be significantly reduced. The mercury emission under the
EEC1 scenario is 31% lower than the BAU1 scenario in 2020, which is mainly contributed by more
and more widespread application of FF, WFGD and SCR. The difference between EEC1 and ACT1
scenarios for 2020 is 26%. This is mainly due to the further increase of advanced APCD applications.
Comparing the EEC1 scenario with the ACT1 scenario for 2030, the mercury emission in the ACT1
scenario is 41% lower, which is mainly due to the aggressive enhancement of SCR applications. The
ACT2 scenario represents the maximum potential of mercury emission control for the coal combustion

37
sector in China. The mercury control measures for CFPPs and CFIBs together can achieve totally 133 t
of mercury reduction from 2010 to 2030.
Figure 11. Scenario projections of total mercury emission from CFIBs during 2010–2030
6. Implications and policy recommendations
6.1. Uncertainties and implications
Based on the uncertainty analysis method for probabilistic mercury emission factor model described
in Section 2.3, the overall ranges of uncertainties of mercury emissions from CFPPs and CFIBs in
2010 were evaluated to be (−35%, +45%) and (−45%, +47%), respectively. The overall uncertainties
originate from model parameters (e.g., mercury content of coal, mercury removal efficiency of APCDs,
etc.) and model inputs (e.g., coal consumption, application rates of APCDs, etc.). The uncertainties of
model parameters are usually related to data availability and model structure, while the uncertainties
of model inputs are linked to the statistical errors. The uncertainties for future years are also reflected
by the differences between different scenarios. Detailed uncertainty analysis is described as follows.
6.1.1. Uncertainty of mercury content of coal
0
20
40
60
80
2010 2020 2030
Atm
osp
her
ic m
ercu
ry e
mis
sion
s(t
)
BAU0 EEC0 ACT0
BAU1 EEC1 ACT1
BAU2 EEC2 ACT2

38
The stochastic simulation method adopted in the probabilistic model can provide sensitivity analysis
for each parameter and quantify the influence of each parameter on the overall uncertainty. Figure 12
shows the contribution of model parameters to the overall uncertainties for mercury emissions from
CFPPs and CFIBs in 2010. Mercury content of coal from major coal producing provinces, such as
Shanxi and Inner Mongolia, has the most significant influence on the mercury emission inventories.
Some provinces in Southwest China, such as Guizhou and Chongqing, have high coal mercury values
due to the geological conditions during the coal formation periods, resulting in the high uncertainty of
mercury in coal. However, the information on mercury contents of Chinese coal is still very limited
compared to the huge amount of coal mines in China. On the other hand, the inventory model is at the
provincial level, which is an interior restriction to further reduce the uncertainties from the mercury
content of coals from different provinces.
Figure 12. Contribution of model parameters to overall uncertainties for 2010 inventories
The newer coal mining is towards the deep layer and the western parts of China. Both these changes
will certainly affect the mercury content of coal. However, the influence of coal seam depth and coal
mine layout on the mercury content of coal are still controversial, which adds more uncertainties to the
forecast of mercury emission from the coal combustion sector. Aside from the uncertainty of mercury
0 10 20 30 40 50
Hg in coal from Shanxi
Hg in coal from Inner Mongolia
Hg in coal from Guizhou
Hg in coal from Henan
Hg in coal from Anhui
Hg in coal from Shaanxi
Hg in coal from Ningxia
Hg in coal from Chongqing
Contribution to uncertainty (%)
CFPPs
0 10 20 30 40 50
Hg in coal from Shanxi
Hg removal efficiency of WS
Hg in coal from Inner Mongolia
Hg in coal from Henan
Hg in coal from Guizhou
Hg in coal from Shaanxi
Hg in coal from Shandong
Hg in coal from Anhui
Contribution to uncertainty (%)
CFIBs

39
content in raw coal, the uncertainty of mercury content in coal as burned is related to inter-provincial
coal transport as well. The import and transportation of coal among province directly influence the
mercury contents of coal as burned in each province.
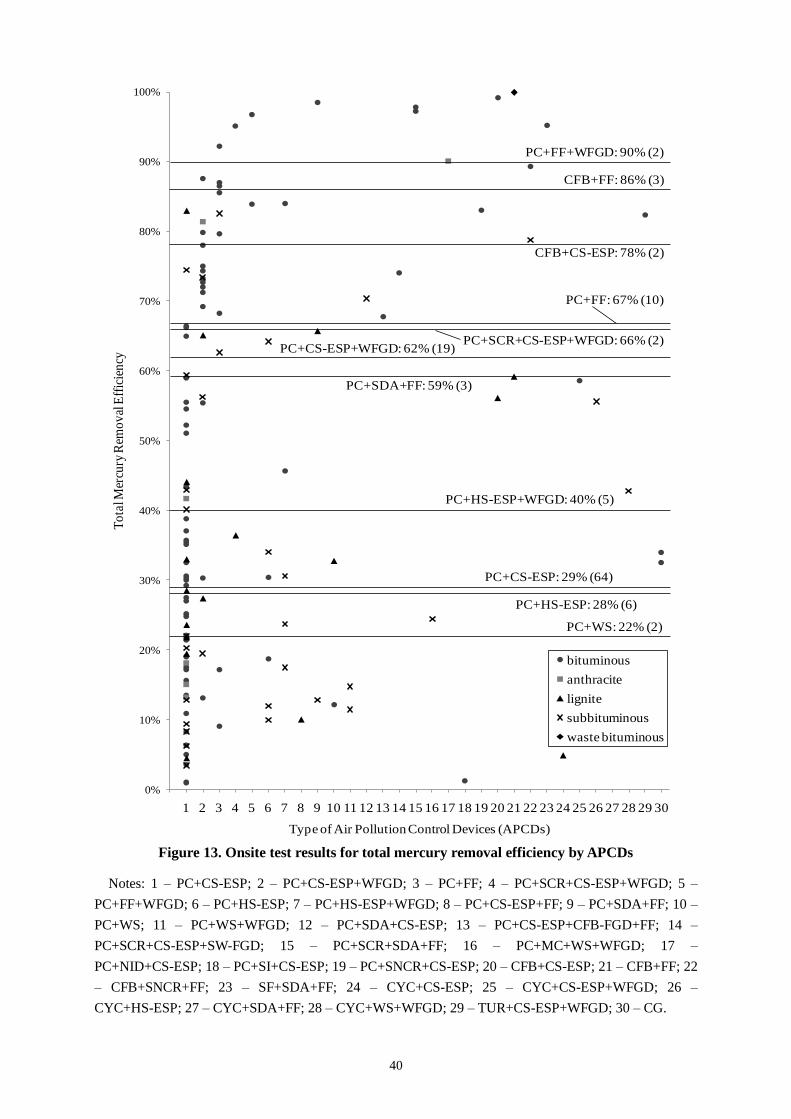
40
Figure 13. Onsite test results for total mercury removal efficiency by APCDs
Notes: 1 – PC+CS-ESP; 2 – PC+CS-ESP+WFGD; 3 – PC+FF; 4 – PC+SCR+CS-ESP+WFGD; 5 –
PC+FF+WFGD; 6 – PC+HS-ESP; 7 – PC+HS-ESP+WFGD; 8 – PC+CS-ESP+FF; 9 – PC+SDA+FF; 10 –
PC+WS; 11 – PC+WS+WFGD; 12 – PC+SDA+CS-ESP; 13 – PC+CS-ESP+CFB-FGD+FF; 14 –
PC+SCR+CS-ESP+SW-FGD; 15 – PC+SCR+SDA+FF; 16 – PC+MC+WS+WFGD; 17 –
PC+NID+CS-ESP; 18 – PC+SI+CS-ESP; 19 – PC+SNCR+CS-ESP; 20 – CFB+CS-ESP; 21 – CFB+FF; 22
– CFB+SNCR+FF; 23 – SF+SDA+FF; 24 – CYC+CS-ESP; 25 – CYC+CS-ESP+WFGD; 26 –
CYC+HS-ESP; 27 – CYC+SDA+FF; 28 – CYC+WS+WFGD; 29 – TUR+CS-ESP+WFGD; 30 – CG.
0%
10%
20%
30%
40%
50%
60%
70%
80%
90%
100%
0 1 2 3 4 5 6 7 8 9 10 11 12 13 14 15 16 17 18 19 20 21 22 23 24 25 26 27 28 29 30
To
tal M
ercu
ry R
emo
val
Eff
icie
ncy
Type of Air Pollution Control Devices (APCDs)
bituminous
anthracite
lignite
subbituminous
waste bituminous
PC+CS-ESP: 29% (64)
PC+CS-ESP+WFGD: 62% (19)
PC+FF: 67% (10)
PC+SCR+CS-ESP+WFGD: 66% (2)
PC+SDA+FF: 59% (3)
PC+WS: 22% (2)
PC+FF+WFGD: 90% (2)
CFB+CS-ESP: 78% (2)
PC+HS-ESP: 28% (6)
PC+HS-ESP+WFGD: 40% (5)
CFB+FF: 86% (3)

41
6.1.2. Uncertainty of mercury removal efficiency of APCDs
As shown in Figure 12, mercury removal efficiency of WS is also a significant parameter for the
uncertainty of mercury emissions from CFIBs in China. The mercury removal efficiencies of APCDs
used in CFPPs are not reflected in the results of uncertainty analysis, because they are linked to coal
quality with the sub-model described in Section 2.1. Data of mercury removal efficiencies from on-site
measurements for different APCD combinations are summarized as Figure 13. Significant variation is
shown for combinations like PC+ESP and PC+ESP+WFGD under the influence of different coal
qualities and operational conditions. Although they are not directly used in the model, the uncertainty
level can be revealed here. The mercury removal efficiencies for other combinations not only show
significant variation but also lack sufficient data, which makes the uncertainty ever larger. The
uncertainty of mercury removal rate of coal washing did not contribute much to the uncertainty of the
2010 inventory because the application rate of coal washing is very low in 2010. However, based on
the “Ten Measures”, coal washing will be more and more widely adopted, which will cause larger
uncertainty in this aspect.
6.1.3. Uncertainty of energy scenarios
If the proportion of coal power and the standard coal consumption rate remain constant, the total
electricity demand has a positive relationship with the coal consumption in CFPPs. Similar case also
applies to CFIBs. The total coal consumption has the direct influence on the mercury emissions. The
forecast of the future energy consumption is based on the development of national economy and the
energy consumption per capita. As a fast growing economy and also an economy in transition, there
are significant uncertainties to forecast the future economy of China. This can be reflected in different
energy scenarios. In this study, taking the EEC scenario for example, the mercury emission estimate
for CFPPs and CFIBs together under the EEC0 scenario by 2030 is 71.6 t, while the emission under
the EEC2 scenario by 2030 is 59.3 t, 17% lower than the EEC0 case. The uncertainty of the energy
demand will significantly affect the trend of mercury emissions in the future. The energy structure is
under adjustment in China. The development of renewable energy will be emphasized in the next two
decades. In the same period, the dependence of electricity on coal power will decrease gradually. With
the decrease of coal power proportion, coal consumption and mercury emissions from power plants
will also change. However, the development plan on renewable energy is still ongoing. Therefore, the
extent of coal power dependence is very uncertain.

42
6.1.4. Uncertainty of control scenarios
Control scenarios are based both on the current and the future potential control policies, regulations
and standards. For the current measures, there is large uncertainty in the implementation. For example,
at the early stage of the widespread WFGD application for SO2 control, the in-service rate of WFGD is
low, not to mention the limestone slurry spraying rate. With the enforcement of monitoring and
supervision, including the real-time monitoring of SO2 concentration at the provincial environmental
protection bureau (EPB) level for key sources, the operation-in-optimal-condition rate has been greatly
improved. The targets of some control measures will also bring uncertainties. The PM concentration
thresholds in the “Ten Measures” are typical examples. We can only use some comprehensive model
such as the CMAQ/RSM model to simulate the circumstances, but these models often have very high
uncertainties, which will contribute to the uncertainty of control scenarios.
6.2. Recommendations on control policies and emission standards
Based on the analysis of current control policies, regulation and standards and the mercury emission
inventories for CFPPs and CFIBs from this study, we propose the following recommendations to meet
the requirements from the Minamata Convention.
6.2.1. Best available technique (BAT) adoption
Best available techniques (BATs) and best environmental practices (BEPs) are anticipated control
options for key sources identified by Minamata Convention, although other mechanisms are
theoretically available for existing facilities. BAT adoption is much easier for supervision than
emission thresholds and total emission cap, especially under the current situation that CFPPs and
CFIBs in China have not equipped with continuous emission monitoring systems (CEMS) for mercury
yet. In our recent study (Ancora et al., 2015), based on mercury removal efficiencies and costs of
different APCD combinations we ranked the most popular co-benefit APCDs installed in CFPPs in
China and identified the most promising dedicated mercury APCDs and practices. Six primary
decision factors that influence the BAT adoption paths were identified: 1) occurrence form of mercury
in coal; 2) existing PM control device; 3) existing SO2 control device; 4) existing NOx control device;
5) coal rank; and 6) mercury removal rate requirement. A decision tree based (see Figure 14) on this

43
BAT adoption model was provided to offer guidance for the BAT options to reduce mercury emissions
and comply with potential mercury emission targets necessary to meet China’s obligations under the
Minamata Convention (Ancora et al., 2016).
Occurrence form of mercury in coal determines the mercury removal efficiency of coal washing.
Pyrite-bond mercury is more easily removed during the coal washing process than organic mercury.
Once established the options for pre-combustion mitigation efforts to control mercury emissions, the
decision analysis continues looking at the APCDs installed to reduce conventional air pollutants (i.e.,
PM, SO2 and NOx). The retrofit from ESPs to FFs for the control of fine particulates is the most
cost-effective for co-benefit mercury removal. Coal rank is the key factor influencing the enhancement
measures of co-benefit mercury control technologies. Coal blending/switching is a direct embodiment
of the impact of coal rank. Switching from lignite or sub-bituminous coal to bituminous coal results in
a 5% increase of mercury removal on average. Halogen injection (HI) has better performance in
enhancing mercury removal for bituminous coal. The ultimate decision of using dedicated mercury
control technologies (i.e., ACI) depends on the requirements of mercury removal efficiencies.
6.2.2. National mercury emission reduction target
According to the experience on SO2 and NOx control in the 11th and 12th Five-Year Plan periods, to
set a national mercury emission reduction target for CFPPs and CFIBs in China could be useful to
fulfill the requirement of the Minamata Convention. Above all, accurate mercury emission inventories
are necessary for this “National Cap” policy.
Based on the scenario projections in this study, the national mercury emission reduction target for
CFPPs in China by 2020 could be 25% compared to 2010, and the reduction target for CFPPs by 2030
could be 50–70% compared to 2010. The 25% target by 2020 can be achieved without any dedicated
mercury control technologies (e.g., ACI). However, to achieve the 2030 target, over 30% installation
rate of dedicated mercury control technologies is necessary.
For CFIBs, the target by 2020 could be 30–50%, more room for reduction than CFPPs due to the
current outdated APCD installation for CFIBs. The reduction target for CFIBs by 2030 could be even
more aggressive, 50–70% compared to 2010. Both the 2020 and 2030 reduction targets could be
achieved without any dedicated mercury control technologies. The retrofit from WS/IMS to FF and the
wide application of WFGD will be quite effective, not to mention the contribution of coal washing.

44
Figure 14. Best available technique (BAT) adoption paths for mercury control technologies

45
6.2.3. Combination of concentration and efficiency-oriented emission standards
China usually uses concentration-oriented emission standards (e.g., the 30 μg/m3 mercury emission
threshold for CFPPs and the 50 μg/m3 one for CFIBs in the new standards). However, the
concentration-oriented standard has its limitation, especially for mercury emission control in China.
The threshold value is key to this type of emission standards. Figure 15 shows the results of mercury
concentrations in the flue gases before and after APCDs during our previous on-site measurements in
China (Zhang, 2012). Although the number of tested CFPPs and CFIBs is quite limited compared to
the huge number of CFPPs and CFIBs in China, the selection of installed capacity, located province,
APCD combination and coal type is relatively representative for the current situation in China. The
average mercury concentrations before APCDs at tested emission sources were all below 30 μg/m3.
The mercury concentrations in exhausted flue gases from tested CFPPs were all below 10 μg/m3 and
those for CFIBs were all below 15 μg/m3. According to our estimation of mercury concentrations in
exhausted flue gases from CFPPs and CFIBs in China based on the mercury content in Chinese coals
and the removal efficiency of typical APCD combinations, also considering the variation of mercury
removal efficiency, a threshold of 15 μg/m3 and a threshold of 20 μg/m
3 are more reasonable for most
CFPPs and CFIBs in China respectively under current situation with exception of some southwestern
regions in China consuming coals with high mercury content.
Figure 15. Mercury concentrations in flue gases from on-site measurements in China
0 10 20 30
CFPP1
CFPP2
CFPP3
CFPP4
CFPP5
CFPP6
CFPP7
CFPP8
CFIB1
CFIB2
CFIB3
CFIB4
CFIB5
CFIB6
CFIB7
Mercury concentration in flue gas (μg/m3)
Before APCDs
After APCDs

46
Efficiency-oriented standards are more and more widely adopted by many developed countries and
regions. The Mercury and Air Toxics Standards (MATS) rule in the US requires approximately 90%
mercury removal efficiency for coal-fired power plants beginning in 2015. The Canada-Wide Standard
(CWS) for Mercury Emissions from Coal-Fired Electric Power Generation Plants requires the annual
overall mercury control efficiency to be 60% in 2010 and 80% in 2018. The overall mercury removal
efficiencies for CFPPs and CFIBs in China were 63% and 43% respectively in 2010. Based on our
projections under the EEC scenario, the overall mercury removal efficiencies for CFPPs could reach
74% and 85% respectively by 2020 and 2030, and the efficiencies for CFIBs could reach 68% and 75%
respectively by 2020 and 2030.
Concentration-oriented standards are easier for real-time monitoring and encourage the use of coals
with low mercury content (usually also low sulfur content), while efficiency-oriented standards offer
flexibility to plants consuming coals with high mercury content. Therefore, we propose a combination
of these two types of standards, where the regulatory agency/source could choose between which
component of the standard it chooses to apply on its site-specific circumstances. Considering 0.2
mg/kg as a critical value for mercury content in coal and assuming approximately 10000 Nm3 flue gas
generation from combustion of one tonne coal, the overall critical mercury concentrations in flue gas
at the 2020 efficiency level for CFPPs and CFIBs will be about 5.2 and 6.4 μg/m3, respectively.
Considering the variation of mercury content in coal and mercury removal efficiency, a coefficient of
1.5 is adopted.
As a result, the combinative standard for CFPPs by 2020 could be an alternative between a
concentration emission limit of 8 μg/m3 or a mercury removal efficiency of 75%, and the combinative
standard for CFIBs by 2020 could be an alternative between an emission limit of 10 μg/m3 or a
removal efficiency of 70%. The concentration limits for 2020 are about half of the limits determined
achievable by most plants for 2010 in this study.
Based on the same methodology, the combinative standard for CFPPs by 2030 could be an
alternative between a concentration limit of 5 μg/m3 or a mercury removal efficiency of 85%, and the
combinative standard for CFIBs by 2030 could be an alternative between an emission limit of 7 μg/m3
or a removal efficiency of 75%.
6.2.4. Reinforcement of mercury emission monitoring standard system
The mercury emission monitoring standard system for CFPPs and CFIBs in China is in need of

47
urgent improvement, including on-line and off-line monitoring methods. Consequently the supervision
system is still basically blank. The Ministry of Environment Protection (MEP) of China has piloted
mercury emission monitoring and control projects at 16 power plants since 2010, fifteen of which are
from the five major power groups in China and one from Shenhua Group. Both on-line and off-line
mercury monitoring methods are adopted for comparison. However, due to the high costs of imported
mercury CEMS and its high maintenance requirements, the continuous on-line method is not widely
applied in China so far. In the meanwhile, the standard method (HJ 543-2009) is immature and still
under revision.
6.2.5. Development of environmental registration system
The environmental registration system is still under construction in China. The system can not only
contribute to the monitoring and supervision for mercury control but also benefit the development of
mercury emission inventories which are crucial to China’s commitment to the Minamata Convention.
This is especially true for CFIBs. There are over half a million CFIBs in China, most of which are only
registered to Special Equipment Safety Supervision Bureau of China. Detailed information on the
coals burned in boilers and the equipped APCDs is not included in the statistical system in China. To
improve the mercury emission control framework in China and keep mercury emission inventories
updated, the development of an environmental registration system in China needs to be accelerated.
6.2.6. Improvement of the management system for industrial boilers
The gaps of the CFIB sector in both the information of emission inventory and the implementation
of control measures are much more significant than those of the CFPP sector in China. This is largely
related to the existing management system for industrial boilers. There are hundreds of thousands of
CFIBs in China, affiliated to different types of plants as auxiliary facilities. Due to the huge quantity
and the affiliation to different industries, the supervision and management system for industrial boilers
is inefficient. Large-scale boilers for centralized heating supply have been widely adopted in China,
which can significantly reduce residential coal combustion. This can be as well applied to the whole
CFIB sector. Large-scale boilers can be individual companies for centralized steam or hot water supply
in industrial parks or certain industrial zones in replacement of small-scale boilers, which will result in
a more efficient management system.
48
References
Ancora M P, Zhang L, Wang S X, et al. 2016. Meeting Minamata: cost-effective compliance options
for atmospheric mercury control in Chinese coal-fired power plants. Energy Policy, 88: 485–494.
Arctic Monitoring and Assessment Programme (AMAP) and United Nations Environment Programme
(UNEP). 2013. Technical Background Report for the Global Mercury Assessment 2013 [R]. Geneva,
Switzerland: UNEP Chemicals Branch.
Chen J, Yuan D, Li Q, et al. 2008. Effect of flue-gas cleaning devices on mercury emission from
coal-fired boiler [J]. Proceedings of the CSEE, 28(2): 72–76.
Chen L, Duan Y, Zhuo Y, et al. 2007. Mercury transformation across particulate control devices in six
power plants of China: The co-effect of chlorine and ash composition [J]. Fuel, 86(4): 603–610.
Chen Y, Chai F, Xue Z, et al. 2006. Study on mercury emission factors for coal-fired power plants [J].
Research of Environmental Sciences, 19(2): 49–52.
Cheng C M, Hack P, Chu P, et al. 2009. Partitioning of mercury, arsenic, selenium, boron, and chloride
in a full-scale coal combustion process equipped with selective catalytic reduction, electrostatic
precipitation, and flue gas desulfurization systems [J]. Energy and Fuels, 23: 4805–4816.
Duan Y, Cao Y, Kellie S, et al. 2005. In-situ measurement and distribution of flue gas mercury for a
utility PC boiler system [J]. Journal of Southeast University, 21(1): 53–57.
Finkelman B. 2003. Personal communication [R].
Finkelman B. 2004. Personal communication [R].
Goodarzi F. 2004. Speciation and mass-balance of mercury from pulverized coal fired power plants
burning western Canadian subbituminous coals [J]. Journal of Environmental Monitoring, 6(10):
792–798.
Guo X, Zheng C, Jia X, et al. 2004. Study on mercury speciation in pulverized coal-fired flue gas [J].
Proceedings of the CSEE, 24(6): 185–188.
He B, Cao Y, Romero C E, et al. 2007. Comparison and validation of OHM and SCEM measurements
for a full-scale coal-fired power plant [J]. Chemical Engineering Communications, 194(10–12):
1596–1607.
Huang W, Yang Y. 2002. Mercury in coal in China [J]. Coal Geology of China, 14(5): 37–40.
Information Collection Request (ICR). 2010. Results from onsite measurements in USA [R].
Washington, DC.

49
Ito S, Yokoyama T, Asakura K. 2006. Emissions of mercury and other trace elements from coal-fired
power plants in Japan [J]. Science of the Total Environment, 368(1): 397–402.
Kellie S, Duan Y, Cao Y, et al. 2004. Mercury emissions from a 100-MW wall-fired boiler as measured
by semicontinuous mercury monitor and Ontario Hydro Method [J]. Fuel Processing Technology,
85(6–7): 487–499.
Kim J H, Pudasainee D, Yoon Y S, et al. 2010. Studies on speciation changes and mass distribution of
mercury in a bituminous coal-fired power plant by combining field data and chemical equilibrium
calculation [J]. Industrial and Engineering Chemistry Research, 49: 5197–5203.
Laumb J D, Benson S A, Olson E A. 2004. X-ray photoelectron spectroscopy analysis of mercury
sorbent surface chemistry [J]. Fuel Processing Technology, 85(6-7): 577-585.
Lee S J, Seo Y C, Jang H N, et al. 2006. Speciation and mass distribution of mercury in a bituminous
coal-fired power plant [J]. Atmospheric Environment, 40(12): 2215–2224.
Lee S J, Seo Y C, Jurng J, et al. 2004. Mercury emissions from selected stationary combustion sources
in Korea [J]. Science of the Total Environment, 325(1–3): 155–161.
Meij R, Winkel H t. 2006. Mercury emissions from coal-fired power stations: The current state of the
art in the Netherlands [J]. Science of the Total Environment, 368(1): 393–396.
Ministry of Environmental Protection of China (MEP). 2011. Emission standard of air pollutants for
thermal power plants (GB 13223-2011) [S]. Beijing: MEP.
National Energy Statistical Agency of China (NESA). 2011. China Energy Statistical Yearbook 2011
[R]. Beijing, China: NESA.
National Energy Statistical Agency of China (NESA). 2013. China Energy Statistical Yearbook 2013
[R]. Beijing, China: NESA.
Otero-Rey J, Lopez-Vilarino J, Moreda-Pineiro J, et al. 2003. As, Hg, and Se flue gas sampling in a
coal-fired power plant and their fate during coal combustion [J]. Environmental Science and
Technology, 37(22): 5262–5267.
Pirrone N, Munthe J, Barregård L, et al. 2001. EU ambient air pollution by mercury (Hg) - position
paper [R]. Italy: Office for Official Publications of the European Communities.
Ren D, Zhao F, Dai S, et al. 2006. Geochemistry of Trace Elements in Coal [M]. Beijing: Science
Press.
Shah P, Strezov V, Nelson P. 2010. Speciation of mercury in coal-fired power station flue gas [J].
Energy and Fuels, 24: 205–212.

50
Shah P, Strezov V, Prince K, et al. 2008. Speciation of As, Cr, Se and Hg under coal fired power
station conditions [J]. Fuel, 87(10–11): 1859–1869.
Streets D G, Hao J M, Wu Y, et al. 2005. Anthropogenic mercury emissions in China [J]. Atmospheric
Environment, 39(40): 7789–7806.
Tang S. 2004. The mercury species and emissions from coal combustion flue gas and landfill gas in
Guiyang: Ph.D. thesis [D]. Guiyang: Institute of Geochemistry, Chinese Academy of Sciences.
Tang S L, Feng X B, Qiu J R, et al. 2007. Mercury speciation and emissions from coal combustion in
Guiyang, southwest China [J]. Environmental Research, 105(2): 175–182.
United Nations Environment Programme (UNEP). 2013. Global Mercury Assessment 2013: Sources,
Emissions, Releases and Environmental Transport [R]. Geneva, Switzerland: UNEP Chemicals
Branch.
United States Environmental Protection Agency (US EPA). 1997. Mercury Study Report to Congress
[R]. Research Triangle Park, NC: US EPA.
United States Environmental Protection Agency (US EPA). 2011. Mercury and Air Toxics Standards
(MATS) for Power Plants [R]. Washington, DC, USA: US EPA.
United States Geological Survey (USGS). 2004. Mercury Content in Coal Mines in China [R].
Wang Q, Shen W, Ma Z. 2000. Estimation of mercury emission from coal combustion in China [J].
Environmental Science and Technology, 34: 2711–2713.
Wang Y, Duan Y, Yang L, et al. 2008. An analysis of the factors exercising an influence on the
morphological transformation of mercury in the flue gas of a 600 MW coal-fired power plant [J].
Journal of Engineering for Thermal Energy and Power, 23(4): 399–403.
Wang Y, Duan Y, Yang L, et al. 2009. Experimental study on mercury transformation and removal in
coal-fired boiler flue gases [J]. Fuel Processing Technology, 90(5): 643–651.
Wu C, Duan Y, Wang Y, et al. 2008. Characteristics of mercury emission and demercurization property
of NID system of a 410 t/h pulverized coal fired boiler [J]. Journal of Fuel Chemistry and
Technology, 36(5): 540–544.
Yang X, Duan Y, Jiang Y, et al. 2007. Research on mercury form distribution in flue gas and fly ash of
coal-fired boiler [J]. Coal Science and Technology, 35(12): 55–58.
Yokoyama T, Asakura K, Matsuda H, et al. 2000. Mercury emissions from a coal-fired power plant in
Japan [J]. Science of the Total Environment, 259(1–3): 97–103.
Zhang J, Ren D, Xu D, et al. 1999. Mercury in coal and its effect on environment [J]. Advances in

51
Environmental Science, 7(3): 100–104.
Zhang M Q, Zhu, Y. C., Deng, R. W. 2002. Evaluation of mercury emissions to the atmosphere from
coal combustion, China [J]. Ambio, 31(6): 482–484.
Zheng L, Liu G, Qi C, et al. 2007. Study on environmental geochemistry of mercury in Chinese coals
[J]. Journal of University of Science and Technology of China, 37(8): 953–963.
Zheng L, Liu G, Zhou C. 2007. The distribution, occurrence and environmental effect of mercury in
Chinese coals [J]. Science of the Total Environment, 384: 374–383.
Zhou J. 2005. Emissions and Control of Mercury from Coal-Fired Utility Boilers in China [C]. China
Workshop on Mercury Control from Coal Combustion. Beijing, China.
Zhou J, Wang G, Luo Z, et al. 2006. An experimental study of mercury emissions from a 600 MW
pulverized coal-fired boiler [J]. Journal of Engineering for Thermal Energy and Power, 21(6): 569–
572.
Zhou J, Zhang L, Luo Z, et al. 2008. Study on mercury emission and its control for boiler of 300 MW
unit [J]. Thermal Power Generation, 37(4): 22–27.