potential nonresponse bias in a clinical examination after initial screening using iron phenotyping...
TRANSCRIPT

Potential Nonresponse Bias in a Clinical ExaminationAfter Initial Screening Using Iron Phenotypingand HFE Genotyping in the Hemochromatosis
and Iron Overload Screening Study
Mark Speechley,1 James C. Barton,2 Leah Passmore,3 Helen Harrison,4 David M. Reboussin,3
Emily L. Harris,5 Charles A. Rivers,6 Margaret Fadojutimi-Akinsiku,7 Lari Wenzel,8 and Sharmin Diaz7
Background: Little is known about the factors affecting participation in clinical assessments after HEmoch-romatosis and IRon Overload Screening. Methods: Initial screening of 101,168 primary care patients in theHEmochromatosis and IRon Overload Screening study was performed using serum iron measures and hemo-chromatosis gene (HFE) genotyping. Using iron phenotypes and HFE genotypes, we identified 2256 cases and1232 controls eligible to participate in a clinical examination. To assess the potential for nonresponse bias, wecompared the sociodemographic, health status, and attitudinal characteristics of participants and nonpartici-pants using adjusted odds ratios (ORs) and 95% confidence interval (CI). Results: Overall participation was 74%in cases and 52% in controls; in both groups, participation was highest at a health maintenance organization andlowest among those under 45 years of age (cases: OR¼ 0.68; 95% CI 0.53, 0.87; controls: OR¼ 0.59; 95% CI 0.44,0.78). In controls only, participation was also lower among those over 65 years of age than the reference groupaged 46–64 (OR¼ 0.64; 95% CI 0.47, 0.88). Among cases, participation was higher in HFE C282Y homozygotes(OR¼ 3.98; 95% CI 2.60, 6.09), H63D homozygotes (OR¼ 2.79; 95% CI 1.23, 6.32), and C282Y=H63D compoundheterozygotes (OR¼ 1.82; 95% CI 1.03, 3.22) than in other genotypes, and lower among non-Caucasians andthose who preferred a non-English language than in Caucasians and those who preferred English ( p< 0.0001).Conclusions: Subjects with greatest risk to have iron overload (C282Y homozygotes; cases �45 years; Caucasians)were more likely to participate in a postscreening clinical examination than other subjects. We detected noevidence of strong selection bias.
Introduction
Hemochromatosis in Western European whites is typi-cally associated with homozygosity for C282Y, a mis-
sense mutation in the hemochromatosis gene (HFE) onchromosome 6p21.3 (Feder et al., 1996). Approximately 0.44–0.48% of non-Hispanic whites in North America are C282Yhomozygotes (Beutler et al., 2000; Adams et al., 2005). Somepersons with hemochromatosis absorb excessive quantities ofdietary iron and develop iron overload and consequent he-patic injury, cirrhosis, diabetes mellitus, arthropathy, and
hypogonadotropic hypogonadism that typically becomemanifest in middle age (Witte et al., 1996; Barton et al., 1998).Early detection of hemochromatosis or iron overload couldpermit treatment to prevent injury of target organs by exces-sive iron. Accordingly, two large-scale screening programs inNorth America have used iron phenotyping and HFE geno-typing (Beutler et al., 2000; Adams et al., 2005). Nonetheless,little is known about the willingness of subjects with abnor-malities detected in initial screening to undergo postscreeningassessments of possible hemochromatosis and iron overloadand to receive management recommendations.
1Department of Epidemiology & Biostatistics, University of Western Ontario, London, Canada.2Southern Iron Disorders Center, Birmingham, Alabama.3Department of Public Health Sciences, Wake Forest University School of Medicine, Winston-Salem, North Carolina.4London Health Sciences Centre, London, Canada.5National Human Genome Research Institute, National Institutes of Health, Bethesda, Maryland.6Microbiology=Immunogenetics Program, University of Alabama at Birmingham, Birmingham, Alabama.7Howard University, Washington, District of Columbia.8Department of Medicine, Center for Health Policy Research, University of California, Irvine, California.
GENETIC TESTING AND MOLECULAR BIOMARKERSVolume 13, Number 6, 2009ª Mary Ann Liebert, Inc.Pp. 721–728DOI: 10.1089=gtmb.2009.0003
721
Selection bias is a form of systematic error caused by dif-ferences in characteristics between those who do and thosewho do not participate in a study. Selection bias is importantscientifically because it can invalidate conclusions and gen-eralizations from studies in which it occurs (Last, 2001). Forexample, samples of patients from tertiary care settings maybe biased because the participants have more severe or in-tractable disease than all those affected in the population.Selection bias due to self-selection occurs due to differencesbetween people who choose to participate and those who donot. Self-selection bias can occur in cross-sectional and case–control studies, and at each point in a longitudinal study. Incross-sectional studies and case–control studies, and at thebaseline of longitudinal investigations, it is a component of‘‘nonresponse’’ bias. In longitudinal studies, it is one source ofbiased follow-up (Greenland, 1977).
The HEmochromatosis and IRon Overload Screening(HEIRS) study is a multiracial, multiethnic, primary care–based screening study of hemochromatosis and iron over-load conducted at five field centers in the United States andCanada (McLaren et al., 2003; Adams et al., 2005). Some gen-eral results from the initial screening phase have been re-ported (Adams et al., 2005; Barton et al., 2005, 2006; Acton et al.,2006a, 2006b). The purpose of the present analyses was toaddress the potential for nonresponse bias at the second(clinical examination) phase by comparing characteristics be-tween those who did and did not participate, separately for agroup of cases designated as at higher risk for hemochroma-tosis and iron overload, and a matched control group.
Materials and Methods
Study design and approval
The design and methodology of the HEIRS study has beenreported in detail elsewhere (McLaren et al., 2003). The localInstitutional Review Board of each field center approved thestudy protocol (McLaren et al., 2003; Adams et al., 2005).Briefly, five HEIRS study field centers recruited participants�25 years of age who were able to give informed consent fromprimary care practices and blood-drawing laboratories. Therewere no other inclusion or exclusion criteria. The HEIRS studyhad two principal phases: initial screening and subsequentclinical examination (McLaren et al., 2003). In the presentanalyses, we sought to evaluate the observed differences be-tween participants and nonparticipants at the clinical exami-nation phase.
Selection of study subjects
The HEIRS study screened 101,168 primary care patientsover a 2-year period (February 2001–March 2003). As part ofthe informed consent process, the study provided back-ground information on hemochromatosis and iron overloadto all potential participants. All sites had information avail-able in English; in addition, specific sites had written materialand recruiters fluent in Mandarin, Spanish, and Vietnamese.Some initial screening participants were subsequently desig-nated as cases or controls. Cases (n¼ 2256) were defined as (1)homozygous for the HFE C282Y mutation (n¼ 333), with(n¼ 174) or without (n¼ 159) elevated levels of serum ferritin(SF >300 mg=L for men and >200mg=L for women) or trans-ferrin saturation (TS >50% for men and >45% for women) or
(2) not homozygous for HFE C282Y but with the same ele-vated levels of SF and TS (n¼ 1923). Potential controls wereeligible if they lacked HFE C282Y or H63D, and had non-elevated TS and SF values as defined above. Selected controls(n¼ 1247) were frequency matched to the cases at a 1:1 ratioon field center, age group (25–44, 45–64, and>65), and date ofinitial screening.
Case participants were informed of their TS and SF levelsand HFE genotype by letter and invited by telephone to par-ticipate in a clinical examination. They were able to askquestions about their test results during the telephone call intheir preferred language (English, Mandarin, Spanish, orVietnamese). The content of the letters sent to cases was tai-lored to their specific genotype and phenotype. For example,cases not homozygous for HFE C282Y but with elevated ironvalues were ‘‘recommended’’ to share their results with theirphysician and ‘‘talk to a genetics counselor about risks to yourfamily members’’ (Anderson et al., 2006). Cases also receivedan information pamphlet. Control participants received aletter informing them that no phenotype or genotype abnor-malities were detected, that they were ‘‘welcome’’ to share theinformation with their physician, and were invited by tele-phone to participate in the clinical examination as controlsubjects. Cases and controls were reimbursed for their out-of-pocket expenses such as parking and child care.
Screening laboratory methods
Phenotype measurements. Methodology and qualitycontrol used for measurements of TS and SF are describedelsewhere (Barton et al., 2005). The HEIRS study defined theseinitial screening phenotypes to be elevated: TS >50% for menand TS >45% for women; SF >300mg=L for men and SF>200 mg=L for women (McLaren et al., 2003).
Genotype analyses. HFE C282Y and H63D were de-tected using buffy coat samples from whole-blood ethylene-diaminetetraacetic acid samples and a modification of theInvader assay (Third Wave Technologies, Madison, WI) asdescribed in detail elsewhere (Barton et al., 2005). Participantswithout C282Y or H63D were designated as having HFE wild-type genotype (wt=wt).
Statistical considerations
The primary outcome variable was participation in theclinical examination (yes¼ 1 and no¼ 0). Potential explan-atory factors were drawn from initial screening data andincluded age, sex, race=ethnicity, recruiting field center, self-report of chronic conditions associated with iron overload(arthritis, diabetes, liver disease or liver cancer, heart failure,fertility problems, or impotence) and ‘‘too much iron in yourbody, iron overload, or hemochromatosis,’’ self-rated healthstatus, and attitudes about genetic testing and the perceivedrole of lifestyle in health. For cases only, participation wascompared across six specific HFE genotypes: C282Y homo-zygosity; H63D homozygosity; C282Y=H63D compoundheterozygosity; C282Y heterozygosity; H63D heterozygosity;and HFE wt=wt in participants who had elevated screeningiron measures. By selection, all controls had the genotype HFEwt=wt.
We compared characteristics of participants and nonpartic-ipants and analyzed data from cases and controls separately.
722 SPEECHLEY ET AL.

We used Pearson’s chi-squared statistic to assess independencebetween strata of binary variables and across all strata forvariables with multiple categories. Crude (unadjusted) oddsratios (ORs) and 95% confidence intervals (CIs) were calcu-lated to estimate the strength of association between partici-pation and each variable. For variables with more than twolevels, an OR and 95% CI were calculated for each stratum,compared to a reference category (OR¼ 1.0). These multiple-level variables included several questions about health beliefsand attitudes about genetic testing that were asked usingLikert-type response options. Health beliefs (e.g., ‘‘My health isexcellent’’) ranged from ‘‘Definitely true’’ to ‘‘Definitely false’’;psychological effect (e.g., ‘‘During the past 4 weeks, have youfelt downhearted and blue’’?) ranged from ‘‘All of the time’’ to‘‘None of the time’’; attitudes toward genetic testing (e.g., ‘‘Ingeneral, I think genetic testing to find out about disease is agood idea’’) ranged from ‘‘Strongly Agree’’ to ‘‘Strongly Dis-agree’’; and self-rated health response options were Excellent,Good, Average, Fair, and Poor.
Because these variables were measured on an ordinal scale,the stratum-specific OR permitted examination of lineartrends in the strength of association across levels of the vari-able. Specifically, the hypotheses being tested were that if self-rated health, or the strength of agreement with an attitude,were associated with participation in the clinical examination,then there should a linear trend of increasing (or decreasing)OR across the ordinal response categories for these variables.
Multiple logistic regression was used to identify covariatesthat independently predicted participation, controlling forother factors in the model. Because there were different eli-gibility criteria and potential motivations for participation,logistic modeling was done separately for case and controlstrata. A univariate model for each covariate available in thedataset was fitted, and the p-values were examined. Covari-ates that yielded p-values <0.10 in these univariate modelswere considered further in the model building, and those withp-values �0.10 were not considered further. The models werebuilt sequentially by adding covariates, resulting in finalmodels in which all remaining covariates were deemed sta-tistically significant at p< 0.05. For brevity, only variableswith Pearson’s chi-squared p-values <0.05 were included inthe univariate results.
Results
Univariate results
Table 1 shows the distributions of characteristics betweenparticipants and nonparticipants separately for cases andcontrols for variables associated with participation at p<0.05. Participation was 74% for cases and 52% for controls( p< 0.001).
Table 1 also shows stratum-specific OR and 95% CIs forstrata of the above factors. For genotype variables (casesonly), compared to those with HFE wt=wt, participation wassignificantly greater in C282Y homozygotes (OR¼ 4.17),H63D homozygotes (OR¼ 2.62), and C282Y=H63D com-pound heterozygotes (OR¼ 2.19). With respect to phenotype(elevated iron measures, cases only), participants with ele-vated iron parameters were 2.4 times more likely to partici-pate than those with normal iron values (OR¼ 2.44).
In cases, the relative odds of participation were 27% higherfor women (OR¼ 1.27); in controls, there was no significant
difference in the proportions of men and women who par-ticipated. Age group was associated with participation incases ( p¼ 0.002) and in controls ( p< 0.001). In cases, therewas a linear trend in OR reflecting greater participation inolder age groups than in younger age groups. No linear trendin participation by age group was observed in control sub-jects, but controls <45 years of age were 41% less likely toparticipate than in older participants (OR¼ 0.59).
Non-Caucasian cases were 35–39% less likely than Cauca-sian cases to participate in the clinical examination ( p< 0.001);non-Caucasian controls were 22–43% less likely to participatethan Caucasian controls ( p¼ 0.008). Cases recruited fromthe four field centers that were not based at a health mainte-nance organization (HMO) were 64–73% less likely to par-ticipate than those recruited at the Kaiser Permanente FieldCenter ( p< 0.001); non-HMO controls were 31–60% less likelyto participate ( p< 0.001). Cases with a language preferenceother than English were 36–52% less likely to participate thanthose who preferred English ( p< 0.001). Among controls,language preference overall was associated with participation( p¼ 0.002); controls who preferred Spanish were 56% lesslikely to participate than those who preferred another lan-guage (OR¼ 0.44; 95% CI 0.28, 0.71).
Health conditions associated with participation in caseswere self-report of arthritis ( p¼ 0.045), heart failure ( p¼0.030), and infertility=impotence ( p¼ 0.003). Those who re-ported ‘‘no’’ or ‘‘not sure’’ about infertility=impotence were66% less likely to participate than those who reported theseconditions.
Several psychosocial variables, and attitudes about genetictesting, were significantly associated with participation. Inparticipants who qualified as cases, these included the beliefsthat genetic information should be shared with family mem-bers ( p¼ 0.016); genetic testing is generally a good idea( p¼ 0.029); genetic testing is good because the results allowone to change to a healthier lifestyle ( p< 0.002); genetic test-ing is bad because it may affect one’s insurance ( p< 0.001);lifestyle is an important factor in health ( p¼ 0.047); and re-sponses to the statement ‘‘I am a happy person’’ ( p¼ 0.047).In controls, participation was associated with self-ratedhealth ( p< 0.001); the belief that lifestyle is an importantfactor in health ( p¼ 0.018); and responses to the statements‘‘My health is excellent’’ ( p¼ 0.024) and ‘‘I am a happy per-son’’ ( p¼ 0.015).
When ORs were examined for trends among ordinal Likert-type response options, cases who rated their health as otherthan excellent were consistently less likely to participate,but there was not a linear trend in OR for cases or controls. Alinear trend in OR was seen for only one variable, in casesonly: compared to those who strongly agreed with the viewthat ‘‘genetic testing is a good idea because it enables a changeto a healthier lifestyle,’’ those who agreed were 16% lesslikely to participate. Those who disagreed were 62% lesslikely, and those who strongly disagreed were 85% less likelyto participate. A partial trend in ORs was seen in controls, inwhom the odds of participation increased with the frequencyof being happy. Compared to those who were happy ‘‘none ofthe time,’’ participation increased by 80% in those happy ‘‘alittle of the time,’’ by 126% for ‘‘some of the time,’’ by 147%for ‘‘a good bit of the time,’’ and by over 300% for thosehappy ‘‘most of the time.’’ Variables not associated ( p> 0.05;not shown) with participation in either cases or controls were
PARTICIPATION IN A TWO-STAGE SCREENING STUDY 723

Table 1. Unadjusted Odds Ratios for Characteristics of Cases and Controls
Who Did and Did Not Participate in the Clinical Examination Phase of the Hemochromatosis
and Iron Overload Screening Study, 2001–2003, By Cases and Controls
Casesa Controlsb
Invited to clinical examination
(n¼ 2256) (n¼ 1232)
Attended clinical examination
No Yes No Yes
No. (%) No. (%) No. (%) No. (%)Characteristic 578 (25.6) 1678 (74.4) OR (95% CI) 591 (48.0) 641 (52.0) OR (95% CI)
Sex 0.0148c 0.4379c
Female 224 (23.0) 748 (77.0) 1.27 (1.05, 1.54) 357 (47.1) 401 (52.9) 1.10 (0.87, 1.38)Age group 0.0016c 0.0006c
<45 186 (30.4) 425 (69.6) 0.76 (0.61, 0.94) 195 (56.0) 153 (44.0) 0.59 (0.45, 0.77)46–64 292 (24.9) 879 (75.1) 1.0d 241 (43.0) 320 (57.0) 1.0d
>65 100 (21.1) 374 (78.9) 1.24 (0.96, 1.61) 155 (48.0) 168 (52.0) 0.82 (0.62, 1.07)Race=ethnicity 0.0001c 0.0079c
Caucasian 197 (20.5) 762 (79.5) 1.0d 282 (43.5) 367 (56.5) 1.0d
African-American 122 (29.8) 288 (70.2) 0.61 (0.47, 0.79) 110 (54.5) 92 (45.5) 0.64 (0.47, 0.88)Asian=Pacific Islander 198 (29.8) 466 (70.2) 0.61 (0.48, 0.76) 109 (49.5) 111 (50.5) 0.78 (0.58, 1.06)Hispanic 50 (28.4) 126 (71.6) 0.65 (0.45, 0.94) 76 (57.6) 56 (42.4) 0.57 (0.39, 0.83)Other=unknown 11 (23.4) 36 (76.6) 0.85 (0.42, 1.69) 14 (48.3) 15 (51.7) 0.82 (0.39, 1.73)
Field Center <0.0001c <0.0001c
Kaiser 52 (11.3) 407 (88.7) 1.0d 137 (36.7) 236 (63.3) 1.0d
Howard 102 (30.5) 232 (69.5) 0.29 (0.20, 0.42) 31 (45.6) 37 (54.4) 0.69 (0.41, 1.17)London 157 (27.0) 425 (73.0) 0.35 (0.25, 0.49) 183 (48.7) 193 (51.3) 0.61 (0.46, 0.82)UAB 81 (26.4) 226 (73.6) 0.36 (0.24, 0.52) 121 (56.8) 92 (43.2) 0.44 (0.31, 0.62)UCI 186 (32.4) 388 (67.6) 0.27 (0.19, 0.37) 119 (58.9) 83 (41.1) 0.40 (0.29, 0.57)
Specific genotype <0.0001c
þ=þ 382 (30.0) 892 (70.0) 1.0d
H63D=þ 104 (31.0) 231 (69.0) 0.95 (0.73, 1.23)C282Y=þ 33 (23.1) 110 (76.9) 1.43 (0.95, 2.14)C282Y=H63D 17 (16.3) 87 (83.7) 2.19 (1.29, 3.74)H63D=H63D 9 (14.1) 55 (85.9) 2.62 (1.28, 5.35)C282Y=C282Y 31 (9.3) 302 (90.7) 4.17 (2.83, 6.15)
Zygosity <0.0001c
Heterozygote 163 (25.2) 483 (74.8) 1.27 (1.02, 1.57)Homozygote 31 (9.3) 302 (90.7) 4.17 (2.83, 6.15)
Phenotype 0.0002c
Elevated TS and SF 557 (26.6) 1539 (73.4) 2.40 (1.50, 3.83)Preferred language <0.0001c 0.0024c
English 419 (23.3) 1379 (76.7) 1.0d 495 (46.1) 579 (53.9) 1.0d
Spanish 40 (32.3) 84 (67.7) 0.64 (0.43, 0.94) 54 (65.9) 28 (34.1) 0.44 (0.28, 0.71)Mandarin 14 (38.9) 22 (61.1) 0.48 (0.24, 0.94) 13 (61.9) 8 (38.1) 0.53 (0.22, 1.28)Vietnamese 105 (35.2) 193 (64.8) 0.56 (0.43, 0.73) 29 (53.7) 25 (46.3) 0.74 (0.43, 1.28)
Arthritis 0.0446c 0.1809c
Yes 137 (22.6) 470 (77.4) 1.0d 186 (50.5) 182 (49.5) 1.0d
No 386 (27.2) 1032 (72.8) 0.78 (0.62, 0.97) 352 (45.9) 415 (54.1) 1.20 (0.94, 1.55)Not sure 32 (21.5) 117 (78.5) 1.07 (0.69, 1.65) 37 (54.4) 31 (45.6) 0.86 (0.51, 1.44)
Diabetes 0.8105c 0.0562c
Yes 77 (26.1) 218 (73.9) 1.0d 83 (55.0) 68 (45.0) 1.0d
No 446 (25.2) 1327 (74.8) 1.05 (0.79, 1.39) 468 (46.4) 541 (53.6) 1.41 (1.00, 1.99)Not sure 28 (27.7) 73 (72.3) 0.92 (0.55, 1.53) 25 (58.1) 18 (41.9) 0.88 (0.44, 1.74)
Heart failure 0.0303c 0.7170c
Yes 28 (28.9) 69 (71.1) 1.0d 32 (52.5) 29 (47.5) 1.0d
No 483 (24.7) 1469 (75.3) 1.23 (0.79, 1.94) 513 (47.1) 576 (52.9) 1.24 (0.74, 2.08)Not sure 40 (35.4) 73 (64.6) 0.74 (0.41, 1.33) 21 (47.7) 23 (52.3) 1.21 (0.56, 2.63)
Fertility problems=impotence 0.0027c 0.1090c
Yes 11 (10.8) 91 (89.2) 1.0d 25 (39.7) 38 (60.3) 1.0d
No 509 (26.0) 1452 (74.0) 0.34 (0.18, 0.65) 520 (47.7) 570 (52.3) 0.72 (0.43, 1.21)Not sure 20 (26.0) 57 (74.0) 0.34 (0.15, 0.77) 20 (62.5) 12 (37.5) 0.39 (0.16, 0.95)
(continued)
724 SPEECHLEY ET AL.

Table 1. (Continued)
Casesa Controlsb
Invited to clinical examination
(n¼ 2256) (n¼ 1232)
Attended clinical examination
No Yes No Yes
No. (%) No. (%) No. (%) No. (%)Characteristic 578 (25.6) 1678 (74.4) OR (95% CI) 591 (48.0) 641 (52.0) OR (95% CI)
Health 0.0785c 0.0006c
Poor 30 (28.0) 77 (72.0) 0.62 (0.35, 1.09) 29 (64.4) 16 (35.6) 0.48 (0.24, 0.97)Fair 103 (25.8) 297 (74.3) 0.70 (0.45, 1.08) 107 (59.1) 74 (40.9) 0.61 (0.39, 0.95)Average 178 (28.6) 445 (71.4) 0.60 (0.40, 0.91) 156 (48.0) 169 (52.0) 0.95 (0.64, 1.42)Good 208 (23.7) 670 (76.3) 0.78 (0.52, 1.17) 221 (42.7) 296 (57.3) 1.17 (0.80, 1.71)Excellent 34 (19.4) 141 (80.6) 1.0d 64 (46.7) 73 (53.3) 1.0d
My health is excellent 0.6834c 0.0239c
Definitely true 79 (23.2) 262 (76.8) 1.23 (0.84, 1.78) 106 (48.2) 114 (51.8) 1.66 (1.01, 2.74)Mostly true 239 (24.7) 727 (75.3) 1.12 (0.82, 1.54) 253 (43.9) 323 (56.1) 1.97 (1.25, 3.11)Do not know 85 (27.7) 222 (72.3) 0.97 (0.66, 1.40) 80 (51.0) 77 (49.0) 1.48 (0.88, 2.52)Mostly false 67 (25.4) 197 (74.6) 1.09 (0.73, 1.61) 75 (52.4) 68 (47.6) 1.40 (0.82, 2.39)Definitely false 68 (27.0) 184 (73.0) 1.0d 54 (60.7) 35 (39.3) 1.0d
Been a happy person 0.0474c 0.0155c
All the time 91 (29.1) 222 (70.9) 0.76 (0.42, 1.36) 93 (54.7) 77 (45.3) 1.93 (0.71, 5.26)Most of the time 226 (22.5) 779 (77.5) 1.07 (0.62, 1.85) 277 (43.6) 358 (56.4) 3.01 (1.14, 7.94)Some of the time 66 (23.3) 217 (76.7) 1.02 (0.56, 1.85) 69 (50.7) 67 (49.3) 2.26 (0.82, 6.24)A little of the time 40 (29.9) 94 (70.1) 0.73 (0.38, 1.39) 35 (56.5) 27 (43.5) 1.80 (0.61, 5.30)None of the time 18 (23.7) 58 (76.3) 1.0d 14 (70.0) 6 (30.0) 1.0d
Overall, genetic testingis a good idea
0.0291c 0.1955c
Strongly agree 238 (22.2) 836 (77.8) 1.0d 291 (46.8) 331 (53.2) 1.0d
Agree 267 (27.4) 707 (72.6) 0.75 (0.62, 0.92) 253 (47.5) 280 (52.5) 0.97 (0.77, 1.23)Disagree 12 (33.3) 24 (66.7) 0.57 (0.28, 1.16) 10 (55.6) 8 (44.4) 0.70 (0.27, 1.81)Strongly disagree 2 (22.2) 7 (77.8) 1.00 (0.21, 4.83) 6 (85.7) 1 (14.3) 0.15 (0.02, 1.22)
Genetic testing is goodbecause it allows changeto healthier lifestyle
0.0020c 0.1106c
Strongly agree 228 (22.8) 773 (77.2) 1.0d 258 (44.1) 327 (55.9) 1.0d
Agree 259 (26.1) 735 (73.9) 0.84 (0.68, 1.03) 286 (51.3) 272 (48.7) 0.75 (0.59, 0.95)Disagree 14 (43.8) 18 (56.3) 0.38 (0.19, 0.77) 10 (43.5) 13 (56.5) 1.03 (0.44, 2.38)Strongly disagree 4 (66.7) 2 (33.3) 0.15 (0.03, 0.81) 2 (50.0) 2 (50.0) 0.79 (0.11, 5.64)
Genetic testing is badbecause of trouble getting=keeping insurance
0.0004c 0.7483c
Strongly agree 40 (25.0) 120 (75.0) 1.0d 54 (47.8) 59 (52.2) 1.0d
Agree 97 (19.1) 411 (80.9) 1.41 (0.93, 2.15) 160 (45.1) 195 (54.9) 1.12 (0.73, 1.70)Disagree 272 (28.5) 684 (71.5) 0.84 (0.57, 1.23) 232 (48.8) 243 (51.2) 0.96 (0.64, 1.45)Strongly disagree 63 (20.7) 241 (79.3) 1.28 (0.81, 2.01) 81 (48.2) 87 (51.8) 0.98 (0.61, 1.58)
Lifestyle as a factor in disease 0.0469c 0.0178c
Very important 385 (24.5) 1185 (75.5) 1.0d 415 (45.5) 498 (54.5) 1.0d
Somewhat important 120 (25.2) 356 (74.8) 0.96 (0.76, 1.22) 135 (55.3) 109 (44.7) 0.67 (0.51, 0.89)Not important 21 (42.0) 29 (58.0) 0.45 (0.25, 0.80) 11 (52.4) 10 (47.6) 0.76 (0.32, 1.80)Not sure 14 (26.9) 38 (73.1) 0.88 (0.47, 1.64) 13 (65.0) 7 (35.0) 0.45 (0.18, 1.14)
aCases met either or both genotypic or phenotypic criteria for the clinical examination.bControls met neither genotypic nor phenotypic criteria and were matched to the controls on age group, field center, and date of initial
screening visit.cChi-squared p-value for the 2�n table for that characteristic. Only variables with p-values <0.05 in cases or controls are presented.dReferent group.CI, confidence interval; OR, odds ratio; TS, transferrin saturation; SF, serum ferritin; UAB, University of Alabama at Birmingham; UCI,
University of California, Irvine.
PARTICIPATION IN A TWO-STAGE SCREENING STUDY 725
self-reported diabetes, reporting that blood relatives have ironoverload, the expectation that health will get worse, feelingdownhearted and blue, and agreement with the belief thatheredity is an important reason why people get sick.
Because hypothesized linear trends in OR across ordinalstrata in most of the psychosocial and attitudinal questionswere absent, statistically significant OR in specific stratashould be interpreted with caution, particularly given thenumber of hypotheses tested herein.
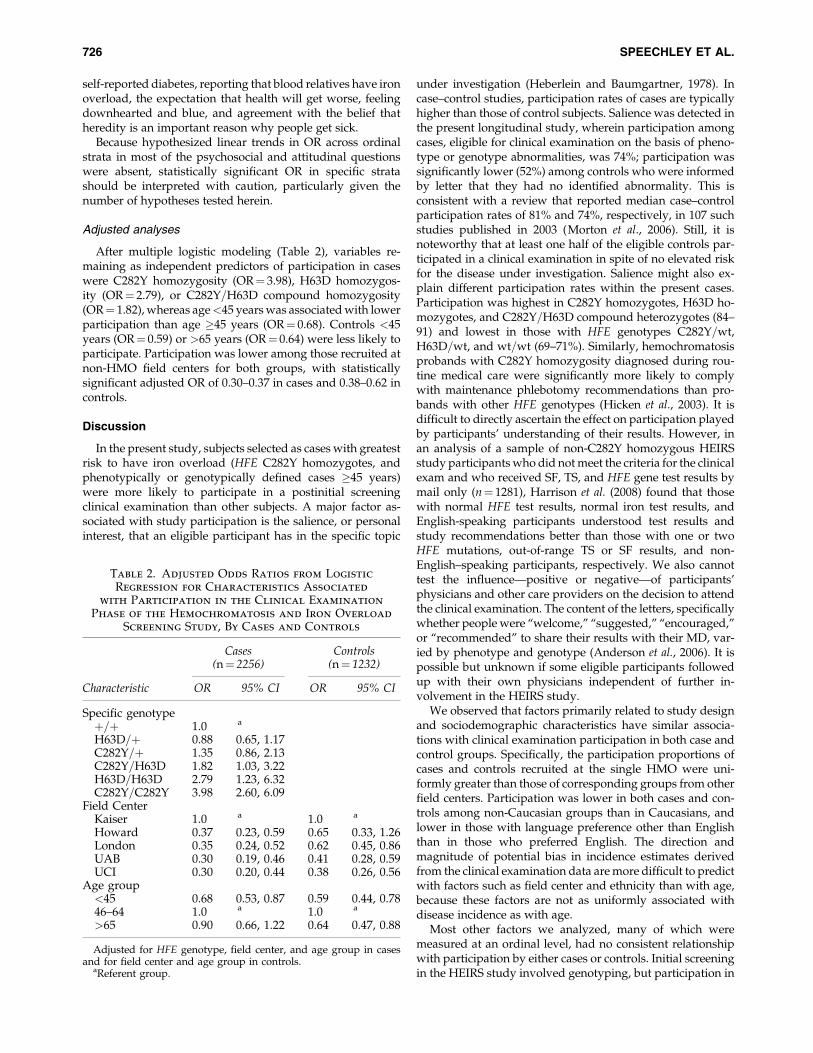
Adjusted analyses
After multiple logistic modeling (Table 2), variables re-maining as independent predictors of participation in caseswere C282Y homozygosity (OR¼ 3.98), H63D homozygos-ity (OR¼ 2.79), or C282Y=H63D compound homozygosity(OR¼ 1.82), whereas age<45 years was associated with lowerparticipation than age �45 years (OR¼ 0.68). Controls <45years (OR¼ 0.59) or >65 years (OR¼ 0.64) were less likely toparticipate. Participation was lower among those recruited atnon-HMO field centers for both groups, with statisticallysignificant adjusted OR of 0.30–0.37 in cases and 0.38–0.62 incontrols.
Discussion
In the present study, subjects selected as cases with greatestrisk to have iron overload (HFE C282Y homozygotes, andphenotypically or genotypically defined cases �45 years)were more likely to participate in a postinitial screeningclinical examination than other subjects. A major factor as-sociated with study participation is the salience, or personalinterest, that an eligible participant has in the specific topic
under investigation (Heberlein and Baumgartner, 1978). Incase–control studies, participation rates of cases are typicallyhigher than those of control subjects. Salience was detected inthe present longitudinal study, wherein participation amongcases, eligible for clinical examination on the basis of pheno-type or genotype abnormalities, was 74%; participation wassignificantly lower (52%) among controls who were informedby letter that they had no identified abnormality. This isconsistent with a review that reported median case–controlparticipation rates of 81% and 74%, respectively, in 107 suchstudies published in 2003 (Morton et al., 2006). Still, it isnoteworthy that at least one half of the eligible controls par-ticipated in a clinical examination in spite of no elevated riskfor the disease under investigation. Salience might also ex-plain different participation rates within the present cases.Participation was highest in C282Y homozygotes, H63D ho-mozygotes, and C282Y=H63D compound heterozygotes (84–91) and lowest in those with HFE genotypes C282Y=wt,H63D=wt, and wt=wt (69–71%). Similarly, hemochromatosisprobands with C282Y homozygosity diagnosed during rou-tine medical care were significantly more likely to complywith maintenance phlebotomy recommendations than pro-bands with other HFE genotypes (Hicken et al., 2003). It isdifficult to directly ascertain the effect on participation playedby participants’ understanding of their results. However, inan analysis of a sample of non-C282Y homozygous HEIRSstudy participants who did not meet the criteria for the clinicalexam and who received SF, TS, and HFE gene test results bymail only (n¼ 1281), Harrison et al. (2008) found that thosewith normal HFE test results, normal iron test results, andEnglish-speaking participants understood test results andstudy recommendations better than those with one or twoHFE mutations, out-of-range TS or SF results, and non-English–speaking participants, respectively. We also cannottest the influence—positive or negative—of participants’physicians and other care providers on the decision to attendthe clinical examination. The content of the letters, specificallywhether people were ‘‘welcome,’’ ‘‘suggested,’’ ‘‘encouraged,’’or ‘‘recommended’’ to share their results with their MD, var-ied by phenotype and genotype (Anderson et al., 2006). It ispossible but unknown if some eligible participants followedup with their own physicians independent of further in-volvement in the HEIRS study.
We observed that factors primarily related to study designand sociodemographic characteristics have similar associa-tions with clinical examination participation in both case andcontrol groups. Specifically, the participation proportions ofcases and controls recruited at the single HMO were uni-formly greater than those of corresponding groups from otherfield centers. Participation was lower in both cases and con-trols among non-Caucasian groups than in Caucasians, andlower in those with language preference other than Englishthan in those who preferred English. The direction andmagnitude of potential bias in incidence estimates derivedfrom the clinical examination data are more difficult to predictwith factors such as field center and ethnicity than with age,because these factors are not as uniformly associated withdisease incidence as with age.
Most other factors we analyzed, many of which weremeasured at an ordinal level, had no consistent relationshipwith participation by either cases or controls. Initial screeningin the HEIRS study involved genotyping, but participation in
Table 2. Adjusted Odds Ratios from Logistic
Regression for Characteristics Associated
with Participation in the Clinical Examination
Phase of the Hemochromatosis and Iron Overload
Screening Study, By Cases and Controls
Cases Controls(n¼ 2256) (n¼ 1232)
Characteristic OR 95% CI OR 95% CI
Specific genotypeþ=þ 1.0 a
H63D=þ 0.88 0.65, 1.17C282Y=þ 1.35 0.86, 2.13C282Y=H63D 1.82 1.03, 3.22H63D=H63D 2.79 1.23, 6.32C282Y=C282Y 3.98 2.60, 6.09
Field CenterKaiser 1.0 a 1.0 a
Howard 0.37 0.23, 0.59 0.65 0.33, 1.26London 0.35 0.24, 0.52 0.62 0.45, 0.86UAB 0.30 0.19, 0.46 0.41 0.28, 0.59UCI 0.30 0.20, 0.44 0.38 0.26, 0.56
Age group<45 0.68 0.53, 0.87 0.59 0.44, 0.7846–64 1.0 a 1.0 a
>65 0.90 0.66, 1.22 0.64 0.47, 0.88
Adjusted for HFE genotype, field center, and age group in casesand for field center and age group in controls.
aReferent group.
726 SPEECHLEY ET AL.

the second, more involved, postscreening phase of the studywas not associated with the strength of stated attitudes to-ward genetic testing. No psychosocial or attitudinal variablesremained in the final logistic models.
Investigations of factors affecting participation in two-stagestudies, the designs of which resemble that of the HEIRS study,have shown greater participation among those with specifichealth concerns (Cobb et al., 1957). For example, those whoparticipated in the examination phase of National Health andNutrition Examination Survey II were more likely than non-participants to have a health problem they wished to discusswith a physician (Forthofer, 1983). In the present study, theORs for controls who reported that it was ‘‘mostly true’’ thattheir health was going to get worse and those who felt this was‘‘definitely true’’ were not statistically significant. Altogether,these observations suggest that health-related motives forparticipation in a phenotype and genotype screening studyinvolving a postscreening clinical examination are complexand may not be predictable. Only knowledge of true exposureand outcome status in both participants and nonparticipantsallows accurate estimate of the magnitude and direction ofselection bias. This knowledge is usually only available incountries that have population-based registries of both riskfactor and health outcome data and that permit investigators tosample from them. This situation does not exist in either theUnited States or Canada, the countries from which HEIRSstudy participants were recruited. Nonetheless, the unpre-dictability of most factors studied suggests that the clinicalexamination participation appears to be random with respectto these factors. The use of the OR as the measure of association,coupled with their cautious interpretation when they are closeto the null, should yield valid inferences from the data collectedduring the clinical examination phase of the HEIRS study orsimilar screening programs.
Acknowledgments
Following are the participating HEIRS study investigatorsand institutions:
Field Centers
Birmingham, AL—University of Alabama at BirminghamDr. Ronald T. Acton (Principal Investigator), Dr. James C.
Barton (Co-Principal Investigator), Ms. Deborah Dixon,Dr. Susan Ferguson, Dr. Richard Jones, Dr. Jerry McKnight,Dr. Charles A. Rivers, Dr. Diane Tucker, and Ms. Janice C. Ware.
Irvine, CA—University of California, IrvineDr. Christine E. McLaren (Principal Investigator), Dr. Gor-
don D. McLaren (Co-Principal Investigator), Dr. Hoda Anton-Culver, Ms. Jo Ann A. Baca, Dr. Thomas C. Bent, Dr. Lance C.Brunner, Dr. Michael M. Dao, Dr. Korey S. Jorgensen, Dr. JulieKuniyoshi, Dr. Huan D. Le, Dr. Miles K. Masatsugu, Dr. FrankL. Meyskens, Dr. David Morohashi, Dr. Huan P. Nguyen, Dr.Sophocles N. Panagon, Dr. Chi Phung, Dr. Virgil Raymundo,Dr. Thomas Ton, Professor Ann P. Walker, Dr. Lari B. Wenzel,and Dr. Argyrios Ziogas.
London, Canada—London Health Sciences CenterDr. Paul C. Adams (Principal Investigator), Ms. Erin Bloch,
Dr. Subrata Chakrabarti, Ms. Arlene Fleischhauer, Ms. HelenHarrison, Ms. Bonnie Hogan, Ms. Kelly Jia, Dr. John Jordan,Ms. Sheila Larson, Dr. Edward Lin, Ms. Melissa Lopez,
MDS Laboratories, Dr. Godfrey Moses, Ms. Lien Nguyen,Ms. Corry Pepper, Dr. Tara Power, Dr. Mark Speechley,Dr. Donald Sun and Ms. Diane Woelfle.
Portland, OR and Honolulu, HI—Kaiser PermanenteCenter for Health Research, Northwest and Hawaii, andOregon Health and Science University
Dr. Emily L. Harris (Principal Investigator), Dr. MikelAickin, Dr. Elaine Baker, Ms. Marjorie Erwin, Ms. Joan Holup,Ms. Carol Lloyd, Dr. Nancy Press, Dr. Richard D. Press,Dr. Jacob Reiss, Dr. Cheryl Ritenbaugh, Ms. Aileen Uchida,Dr. Thomas Vogt, and Dr. Dwight Yim.
Washington, DC—Howard UniversityDr. Victor R. Gordeuk (Principal Investigator), Dr. Fitzroy
W. Dawkins (Co-Principal Investigator), Ms. MargaretFadojutimi-Akinsiku, Dr. Oswaldo Castro, Dr. Debra White-Coleman, Dr. Melvin Gerald, Ms. Barbara W. Harrison,Dr. Ometha Lewis-Jack, Dr. Robert F. Murray, Dr. ShelleyMcDonald-Pinkett, Ms. Angela Rock, Dr. Juan Romagoza,and Dr. Robert Williams.
Central Laboratory
Minneapolis, MN—University of Minnesota and Fairview-University Medical Center
Dr. John H. Eckfeldt (Principal Investigator and SteeringCommittee Chair), Ms. Catherine Leiendecker-Foster, Dr. Ro-nald C. McGlennen, Mr. Greg Rynders, and Dr. Michael Y. Tsai.
Coordinating Center
Winston-Salem, NC—Wake Forest UniversityDr. David M. Reboussin (Principal Investigator), Dr. Beverly
M. Snively (Co-Principal Investigator), Dr. Roger Anderson,Ms. Elease Bostic, Ms. Brenda L. Craven, Ms. Shellie Ellis,Dr. Curt Furberg, Mr. Jason Griffin, Dr. Mark Hall, Mr. DarrinHarris, Ms. Leora Henkin, Dr. Sharon Jackson, Dr. TamisonJewett, Mr. Mark D. King, Mr. Kurt Lohman, Ms. Laura Lovato,Dr. Joe Michaleckyj, Ms. Shana Palla, Ms. Tina Parks, Ms. LeahPassmore, Dr. Pradyumna D. Phatak, Dr. Stephen Rich, Ms.Andrea Ruggiero, Dr. Mara Vitolins, Mr. Gary Wolgast, andMr. Daniel Zaccaro.
NHLBI Project Office
Bethesda, MD—Ms. Phyliss Sholinsky (Project Officer),Dr. Ebony Bookman, Dr. Henry Chang, Dr. Richard Fabsitz,Dr. Cashell Jaquish, Dr. Teri Manolio, and Ms. Lisa O’Neill.
NHGRI Project Office
Bethesda, MD—Ms. Elizabeth Thomson.Dr. Jean MacCluer, Southwest Foundation for Biomedical
Research, also contributed to the design of this study.
Funding Support
HEIRS contract numbersThe HEIRS study was initiated and funded by NHLBI, in
conjunction with NHGRI.N01-HC-05185 (University of Minnesota)N01-HC-05186 (Howard University)N01-HC-05188 (University of Alabama at Birmingham)N01-HC-05189 (Center for Health Research, Kaiser Per-
manente)
PARTICIPATION IN A TWO-STAGE SCREENING STUDY 727

N01-HC-05190 (University of California, Irvine)N01-HC-05191 (London Health Sciences Centre)N01-HC-05192 (Wake Forest University)Additional support was provided by the University of
Alabama at Birmingham General Clinical Research Center(GCRC) grant M01-RR00032, Southern Iron Disorders Center( J.C.B.), Howard University GCRC grant M01-RR10284, Ho-ward University Research Scientist Award UH1-HL03679-05from the National Heart, Lung, and Blood Institute andthe Office of Research on Minority Health (Dr. Victor R.Gordeuk), and grant UC Irvine M01 RR000827 from theGeneral Clinical Research Centers Program of the NationalCenter for Research Resources National Institutes of Health(Dr. Christine E. McLaren).
Disclosure Statement
No competing financial interests exist.
References
Acton RT, Barton JC, Passmore LV, et al. (2006a) Relationships ofserum ferritin, transferrin saturation, and HFE mutations andself-reported diabetes in the Hemochromatosis and Iron Over-load Screening (HEIRS) study. Diabetes Care 29:2084–2089.
Acton RT, Barton JC, Snively BM, et al. (2006b) Geographic andracial=ethnic differences in HFE mutation frequencies in theHemochromatosis and Iron Overload Screening (HEIRS)Study. Ethn Dis 16:815–821.
Adams PC, Reboussin DM, Barton JC, et al. (2005) Hemochro-matosis and iron-overload screening in a racially diversepopulation. N Engl J Med 352:1769–1778.
Anderson RT, Wenzel L, Walker AP, et al. (2006) Impact of he-mochromatosis screening in patients with indeterminate re-sults: the hemochromatosis and iron overload screening study.Genet Med 8:681–687.
Barton JC, Acton RT, Dawkins FW, et al. (2005) Initial screeningtransferrin saturation values, serum ferritin concentrations,and HFE genotypes in whites and blacks in the Hemochroma-tosis and Iron Overload Screening Study. Genet Test 9:231–241.
Barton JC, Acton RT, Lovato L, et al. (2006) Initial screeningtransferrin saturation values, serum ferritin concentrations,and HFE genotypes in Native Americans and whites in theHemochromatosis and Iron Overload Screening Study. ClinGenet 69:48–57.
Barton JC, McDonnell SM, Adams PC, et al. (1998) Managementof hemochromatosis. Hemochromatosis Management Work-ing Group. Ann Intern Med 129:932–939.
Beutler E, Felitti V, Gelbart T, et al. (2000) The effect of HFEgenotypes on measurements of iron overload in patients at-tending a health appraisal clinic. Ann Intern Med 133:329–337.
Cobb SC, King S, Chen E (1957) Differences between respon-dents and nonrespondents in a morbidity survey involvingclinical examination. J Chronic Dis 6:95–108.
Feder JN, Gnirke A, Thomas W, et al. (1996) A novel MHC classI-like gene is mutated in patients with hereditary haemo-chromatosis. Nat Genet 13:399–408.
Forthofer RN (1983) Investigation of nonresponse bias inNHANES II. Am J Epidemiol 117:507–515.
Greenland S (1977) Response and follow-up bias in cohortstudies. Am J Epidemiol 106:184–187.
Harrison HF, Harrison BW, Walker AP, et al. (2008) Screeningfor hemochromatosis and iron overload: satisfaction withresults notification and understanding of mailed results inunaffected participants of the HEIRS study. Genet Test 12:491–500.
Heberlein TA, Baumgartner R (1978) Factors affecting responserates to mailed questionnaires: a quantitative analysis of thepublished literature. Am Sociol Rev 43:447–462.
Hicken BL, Tucker DC, Barton JC (2003) Patient compliance withphlebotomy therapy for iron overload associated with hemo-chromatosis. Am J Gastroenterol 98:2072–2077.
Last J (2001) A Dictionary of Epidemiology, 4th edition. OxfordUniversity Press, New York.
McLaren CE, Barton JC, Adams PC, et al. (2003) Hemochroma-tosis and Iron Overload Screening (HEIRS) study design for anevaluation of 100,000 primary care-based adults. Am J Med Sci325:53–62.
Morton LM, Cahill J, Hartge P (2006) Reporting participation inepidemiologic studies: a survey of practice. Am J Epidemiol163:197–203.
Witte DL, Crosby WH, Edwards CQ, et al. (1996) Practiceguideline development task force of the College of AmericanPathologists. Hereditary hemochromatosis. Clin Chim Acta245:139–200.
Address correspondence to:Mark Speechley, Ph.D.
Department of Epidemiology & BiostatisticsRoom K201, Kresge Building
University of Western OntarioLondon N6A 5C1
OntarioCanada
E-mail: [email protected]
728 SPEECHLEY ET AL.