potential health and environmental impacts associated with the
TRANSCRIPT
Arnold Schwarzenegger Governor
POTENTIAL HEALTH AND ENVIRONMENTAL IMPACTS ASSOCIATED
WITH THE MANUFACTURE AND USE OF PHOTOVOLTAIC CELLS
Prepared For: California Energy Commission Public Interest Energy Research Program Electric Power Research Institute
:
PIER
FIN
AL
PRO
JEC
T R
EPO
RT
August 2004
P500-04-053
Potential Health and EnvironmentalImpacts Associated With the Manufactureand Use of Photovoltaic Cells
Technical Report
EPRI • 3412 Hillview Avenue, Palo Alto, California 94304 • PO Box 10412, Palo Alto, California 94303 • USA 800.313.3774 • 650.855.2121 • [email protected] • www.epri.com
Potential Health and Environmental Impacts Associated with the Manufacture and Use of Photovoltaic Cells
1000095
Final Report, November 2003
Cosponsors Public Interest Energy Research Program (PIER) California Energy Commission 1516 Ninth Street Sacramento, California 95814
PIER Project Manager L. ten Hope
EPRI 3412 Hillview Avenue Palo Alto, California 94304
EPRI Project Manager K. Ladwig
DISCLAIMER OF WARRANTIES AND LIMITATION OF LIABILITIES
THIS DOCUMENT WAS PREPARED BY THE ORGANIZATION(S) NAMED BELOW AS AN ACCOUNT OF WORK SPONSORED OR COSPONSORED BY THE ELECTRIC POWER RESEARCH INSTITUTE, INC. (EPRI). NEITHER EPRI, ANY MEMBER OF EPRI, ANY COSPONSOR, THE ORGANIZATION(S) BELOW, NOR ANY PERSON ACTING ON BEHALF OF ANY OF THEM:
(A) MAKES ANY WARRANTY OR REPRESENTATION WHATSOEVER, EXPRESS OR IMPLIED, (I) WITH RESPECT TO THE USE OF ANY INFORMATION, APPARATUS, METHOD, PROCESS, OR SIMILAR ITEM DISCLOSED IN THIS DOCUMENT, INCLUDING MERCHANTABILITY AND FITNESS FOR A PARTICULAR PURPOSE, OR (II) THAT SUCH USE DOES NOT INFRINGE ON OR INTERFERE WITH PRIVATELY OWNED RIGHTS, INCLUDING ANY PARTY'S INTELLECTUAL PROPERTY, OR (III) THAT THIS DOCUMENT IS SUITABLE TO ANY PARTICULAR USER'S CIRCUMSTANCE; OR
(B) ASSUMES RESPONSIBILITY FOR ANY DAMAGES OR OTHER LIABILITY WHATSOEVER (INCLUDING ANY CONSEQUENTIAL DAMAGES, EVEN IF EPRI OR ANY EPRI REPRESENTATIVE HAS BEEN ADVISED OF THE POSSIBILITY OF SUCH DAMAGES) RESULTING FROM YOUR SELECTION OR USE OF THIS DOCUMENT OR ANY INFORMATION, APPARATUS, METHOD, PROCESS, OR SIMILAR ITEM DISCLOSED IN THIS DOCUMENT.
ORGANIZATION(S) THAT PREPARED THIS DOCUMENT
Tetra Tech, Inc.
CALIFORNIA ENERGY COMMISSION LEGAL NOTICE
THIS REPORT WAS PREPARED AS A RESULT OF WORK SPONSORED BY THE CALIFORNIA ENERGY COMMISSION (COMMISSION). IT DOES NOT NECESSARILY REPRESENT THE VIEWS OF THE COMMISSION, ITS EMPLOYEES, OR THE STATE OF CALIFORNIA. THE COMMISSION, THE STATE OF CALIFORNIA, ITS EMPLOYEES, CONTRACTORS, AND SUBCONTRACTORS MAKE NO WARRANTY, EXPRESS OR IMPLIED, AND ASSUME NO LEGAL LIABILITY FOR THE INFORMATION IN THIS REPORT; NOR DOES ANY PARTY REPRESENT THAT THE USE OF THIS INFORMATION WILL NOT INFRINGE UPON PRIVATELY OWNED RIGHTS. THIS REPORT HAS NOT BEEN APPROVED OR DISAPPROVED BY THE COMMISSION NOR HAS THE COMMISSION PASSED UPON THE ACCURACY OR ADEQUACY OF THIS INFORMATION IN THIS REPORT.
ORDERING INFORMATION
Requests for copies of this report should be directed to the EPRI Orders and Conferences, 1355 Willow Way, Suite 278, Concord, CA 94520, (800) 313-3774, press 2 or internally x5379, (925) 609-9169, (925) 609-1310 (fax). Copies of this report may also be downloaded from the California Energy Commission's website: http://www.energy.ca.gov/research
Electric Power Research Institute and EPRI are registered service marks of the Electric Power Research Institute, Inc. EPRI. ELECTRIFY THE WORLD is a service mark of the Electric Power Research Institute, Inc.
Copyright © 2003 Electric Power Research Institute, Inc. All rights reserved.
CITATIONS
This report was prepared by
Tetra Tech, Inc. 3746 Mount Diablo Blvd. Suite 300 Lafayette, California 94549
Principal Investigators K. Summers J. Radde
This report was prepared for
EPRI 3412 Hillview Avenue Palo Alto, California 94304 and Public Interest Energy Research Program (PIER) California Energy Commission 1516 Ninth Street Sacramento, CA 95814
This report describes research jointly sponsored by EPRI and the California Energy Commission.
The report is a corporate document that should be cited in the literature in the following manner:
Potential Health and Environmental Impacts Associated with the Manufacture and Use of Photovoltaic Cells, EPRI, Palo Alto, CA, and California Energy Commission, Sacramento, CA: 2003. 1000095.
iii

PRODUCT DESCRIPTION
EPRI and the California Energy Commission (CEC), the principle sponsor of this project, have collected information on potential environmental impacts of chemicals used in California’s photovoltaic (PV) industry. This report provides an overview of the photovoltaic industry and includes the types of cells that were manufactured or under development through 2002 and the chemicals used in the manufacturing processes and final modules. The potential for chemicals used in PV cells to be released to air, surface water, and groundwater was considered for the manufacturing facility, the installation site, and the disposal or recycling facility. Information on the relative toxicity to human health and biota was obtained for the various chemicals used in the manufacturing process.
Results & Findings The greatest environmental risk with silicon cells is associated with the use of gases (arsine and phosphine) during the manufacturing process. Thin-film technologies, such as cadmium telluride cells and copper indium diselenide cells, are being developed to increase conversion efficiency and decrease production costs. The most likely routes for environmental release of trace elements are from accidental spills during the manufacturing process. At sites with installed PV modules, release of trace elements from sealed modules is unlikely except due to explosion or fire. Leaching of trace metals from modules is not likely to present a significant risk due to the sealed nature of the installed cells and the plan for recycling of spent modules in the future.
Challenges & Objectives The project’s objectives were threefold: (1) identify chemicals used as components of PV cells or in PV cell manufacturing processes and their potential for release into the environment; (2) determine potential environmental risks, particularly to surface water and groundwater, from the manufacture and disposal of different types of PV cells; and, (3) identify existing and emerging PV cell technologies that have relatively lower environmental risks compared to other cell types.
Applications, Values & Use Information in this report will be used to determine directions for future research activities. In particular, CEC is interested in ascertaining information on the relative risks associated with manufacture and deployment of emerging PV cell technologies. Research results and other information on the environmental benefits of PV cells are readily available. However, research results on potential environmental impacts of materials used to produce and manufacture PV cells are less common. This information is needed to support reliable estimates of potential environmental impacts linked to PV-cell life cycles.
v

EPRI Perspective The development and use of PV cells is advancing rapidly. As their efficiency improves and unit costs decrease, PV cells are expected to play an increasing role in energy production in parts of the United States. This report provides important information for evaluating environmental performance of competing technologies. It is primarily a summary of information available prior to 2001 (some sections have been updated to 2003). Since the PV industry is evolving rapidly, some industry statistics and other information may quickly become outdated. An extensive reference list, including pertinent websites, is provided for readers interested in more recent developments in the industry. EPRI thanks the California Energy Commission for its sponsorship of this effort.
Approach The project team collected and reviewed data on manufacturing production volumes, number of companies producing cells or modules, and their waste quantities. The team analyzed the potential for health and environmental impacts for a variety of settings at manufacturing plants, installation sites, and disposal sites. Information on the manufacturing processes and chemicals used to produce PV cells was provided by experts and obtained from PV journals and trade associations. The team included in their report an estimate of the number of PV cells produced and currently being used along with examples of common applications and their life spans. Information also was obtained on typical industry practices for disposing or recycling of used PV cells.
Keywords Photovoltaic cells Environmental impacts Toxicity Disposal Recycling
vi
ABSTRACT
This report provides an overview of the photovoltaic industry, including the types of cells that were manufactured or under development in 2001- 2002, and the chemicals used in the manufacturing processes and final modules. Data on manufacturing production volumes, number of companies producing cells or modules, and their waste quantities are given for 2001. Potential for health and environmental impacts is discussed for a variety of settings at manufacturing plants, installation sites, and disposal sites. Silicon-based PV cells are by far the most commonly used. The greatest environmental risk with silicon cells is associated with the use of gases (arsine and phosphine) during the manufacturing process. Thin-film technologies, such as cadmium telluride cells and copper indium diselenide cells, are being developed to increase conversion efficiency and decrease production costs. The most likely routes for environmental release of trace elements are from accidental spills during the manufacturing process. At sites with installed PV modules, release of trace elements from the sealed modules is unlikely except due to explosion or fire. Leaching of trace metals from modules is unlikely to present a significant risk due to the sealed nature of the installed cells and the plan for recycling spent modules in the future.
vii
ACKNOWLEDGMENTS
EPRI and Tetra Tech would like to thank Dr. Vasilis Fthenakis, Brookhaven National Laboratory, for his insights in development of this project, information on the manufacturing processes and chemicals used, and review of the final report.
ix

CONTENTS
1 INTRODUCTION ....................................................................................................................1-1
Background ...........................................................................................................................1-1
Objectives .............................................................................................................................1-1
Report Organization ..............................................................................................................1-2
2 OVERVIEW OF THE PHOTOVOLTAIC INDUSTRY..............................................................2-1
Development of Photovoltaic Cells........................................................................................2-1
Design of Photovoltaic Modules ............................................................................................2-9
Growth of the Photovoltaic Industry ....................................................................................2-10
Uses of PV Systems............................................................................................................2-17
3 HANDLING OF CHEMICALS USED IN PHOTOVOLTAIC SYSTEMS .................................3-1
Chemicals Used in the Production of Photovoltaic Cells.......................................................3-1
Chemicals Disposed by Photovoltaic Manufacturing Facilities .............................................3-5
Air Emissions....................................................................................................................3-5
Off-Site Treatment ..........................................................................................................3-12
Off-Site Disposal.............................................................................................................3-12
Recycling of Photovoltaic Modules......................................................................................3-19
Waste Minimization .............................................................................................................3-21
4 POTENTIAL HEALTH AND ENVIRONMENTAL CONCERNS .............................................4-1
Introduction ...........................................................................................................................4-1
Potential for Human Health Effects .......................................................................................4-2
Relative Toxicity and Carcinogenicity of Photovoltaic Chemicals ....................................4-2
Chemicals with Drinking Water Standards .......................................................................4-5
Chemicals with Air-Related Exposure Levels...................................................................4-5
Preliminary Remediation Goals for Chemicals Used in the PV IndustryError! Bookmark not defined.
Potential for Human Health Risks Associated with PV Devices............................................4-9
xi

Potential for Effects at Manufacturing Facilities................................................................4-9
Potential for Hazards at PV Installations ........................................................................4-10
Potential for Hazards at Landfills with PV Modules ........................................................4-12
Relative Toxicity to Biota.....................................................................................................4-12
5 DISCUSSION..........................................................................................................................5-1
Potential for Impacts..............................................................................................................5-1
Data Gaps .............................................................................................................................5-2
6 REFERENCES .......................................................................................................................6-1
A INFORMATION ON COMPANIES LISTED AS PHOTOVOLTAIC MODULE MANUFACTURERS ................................................................................................................. A-1
B PHYSICAL AND CHEMICAL PROPERTIES OF SELECTED CHEMICALS AND COMPOUNDS USED IN PHOTOVOLTAIC CELLS ................................................................ B-1
xii
LIST OF FIGURES
Figure 2-1 General Layout of a Photovoltaic Module and Cell (US DOE, 2003) .......................2-2 Figure 2-2 Diagram Showing Internal Structure of p-n Junction (US DOE, 2003) .....................2-2 Figure 2-3 Cross-Section of Silicon Solar Cell Showing the pn-Junction Where the
Electric Field is Generated (Partain, 1995). .......................................................................2-3 Figure 2-4 Examples of Thin-Film Solar Cells: a) Amorphous Silicon, b) Cadmium
Telluride, and c) Copper Indium Gallium Diselenide (Goetzberger and Hebling, 2000). .................................................................................................................................2-4
Figure 2-5 Comparison of Conversion Efficiency of Solar Cell Materials (Goetzberger and Hebling, 2000 and Haug and Zurich, 2003). ..............................................................2-5
Figure 2-6 Change in Conversion Efficiency of Solar Cells from 1975 – 2000 (Goetzberger and Hebling, 2000).......................................................................................2-7
Figure 2-7 Types of PV Modules Sold Worldwide in 1998 (Goetzberger and Hebling, 2000). .................................................................................................................................2-8
Figure 2-8 PV Technologies in Use in 2001 (EIA,2002) ............................................................2-8 Figure 2-9 Schematic of Concentrator Cells (USDOE, 2003) ....................................................2-9 Figure 2-10 Growth of PV Modules for Power Generation (Goetzberger et al., 2003). ...........2-11 Figure 2-11 Comparison of U.S. Renewable Energy Sources with Fossil Fuel Sources in
1998. ................................................................................................................................2-11 Figure 2-12 Sources of Energy Consumed in the United States in 2001 (EIA, 2002) .............2-12 Figure 2-13 Breakdown of Types of Renewable Energy Sources in 2001 (EIA, 2002) ...........2-12 Figure 2-14 Example of Rooftop Solar Cell Arrays for Home Application with 50 Solarex
MSX-60 Modules to Produce up to 3-kW of Electricity (Mazer, 1997). ............................2-18 Figure 2-15 Example of a Commercial Application as a Power Supply for a Microwave
Repeater at Clay Hills, Utah (Mazer, 1997). ....................................................................2-18 Figure 2-16 Example of an Array for Remote Environmental Data Collection Sites – a
Solarex MSX-10 Panel with Polycrystalline Silicon Cells used to Recharge a Battery for Powering a Continuous Groundwater Level Monitor in the Adirondack Mountains of New York (Newton, 2000). ..........................................................................................2-19
Figure 2-17 Example of Large-Scale Application to Generate 2-MW Power at Rancho Seco Nuclear Plant in California (Mazer, 1997). ..............................................................2-20
Figure 3-1 EPCRA Section 313 Reporting Decision Diagram. ..................................................3-8 Figure 3-2 Release and Other Waste Management Activity Calculation Approach...................3-9
xiii
LIST OF TABLES
Table 2-1 Characteristics of Example Thin-Film Solar Cell Modules.........................................2-6 Table 2-2 Annual Shipments of Photovoltaic Cells and Modules for Terrestrial
Applications, 1987-2001(EIA, 2002) ................................................................................2-13 Table 2-3 Shipments of Photovoltaic Cells and Modules by Market Sector and End Use
in 2000-2001 (Peak Kilowatts) ....................................................................................2-14 Table 2-4 Number of Companies Involved in Photovoltaic-Related Activities, 1997-2001 ......2-15 Table 2-5 Companies Expecting To Introduce New Photovoltaic Products in 2002................2-15 Table 2-6 Status of Manufacturing Facilities for Photovoltaic Cells in 2002 ............................2-16 Table 3-1 Chemicals and Materials Used in the Manufacturing Process of Various
Photovoltaic Cells...............................................................................................................3-2 Table 3-2 Amounts of Metals in Various Types of PV Cells ......................................................3-3 Table 3-3 Hazard Classification of Chemicals Typically Used in PV Module
Manufacturing ....................................................................................................................3-4 Table 3-4 Total Chemical Releases for 1987-1990: California Semiconductor Industry
(after Gilles and Loehr, 1994) ............................................................................................3-6 Table 3-5 PV Companies Listed in the EPA’s TRIS Database ..................................................3-7 Table 3-6 Chemicals Released in Air Stack Emissions by PV Companies Listed in the
TRIS Database.................................................................................................................3-10 Table 3-7 Chemicals Released in Fugitive Air Emissions by PV Companies Listed in the
TRIS Database.................................................................................................................3-13 Table 3-8 Chemicals Released for Off-site Treatment by PV Companies Listed in the
TRIS Database.................................................................................................................3-14 Table 3-9 Chemicals Released for Landfill Disposal by PV Companies Listed in the TRIS
Databases ........................................................................................................................3-19 Table 3-10 Availability of Selected Metals Used in PV Industry ..............................................3-21 Table 4-1 Toxicity Factors for Selected Chemicals Used in Photovoltaic Cells .........................4-3 Table 4-2 Drinking Water Standards for Photovoltaic Chemicals ..............................................4-6 Table 4-3 Summary of Air Exposure Limits for Selected Photovoltaic Chemicals .....................4-7 Table 4-4 PRGs for Selected Chemicals Used in Photovoltaic Cells.........................................4-8 Table 4-5 Summary of Leach Testing Results for Photovoltaic Modules ................................4-11 Table 4-6 National Ambient Water Quality Criteria for Photovoltaic Chemicals -
Freshwater Aquatic Life Protection ..................................................................................4-14 Table 4-7 Systemic and Reproductive Toxicology (ingestion pathway)* .................................4-17 Table 4-8 Acute Pulmonary Toxicology (inhalation pathway)*.................................................4-18
xv

Table 4-9 Summary of Toxicity Tests Conducted on Selected Chemicals Used in the Production of PV Devices ................................................................................................4-19
xvi
1 INTRODUCTION
Background
Approximately 31 percent of the nation’s photovoltaic (PV) solar cells in 2001 were manufactured in California (EIA, 2002). Cells were used for both consumer and commercial applications. Most cells were used for site applications such as the emergency call boxes along state freeways, and in solar-powered electronic devices−about 15% of all the PV cells made in the world go into solar-powered calculators.
EPRI and the California Energy Commission (CEC) agreed to collect information on potential environmental impacts associated with chemicals used in the photovoltaic industry in California. This information will be used to determine directions for future research activities. In particular, the CEC is interested in pursuing PV cell technologies with the least potential for toxic chemical use and associated risks. Research results and other information on the environmental benefits of PV cells are readily available. However, research results on potential environmental impacts associated with materials used in the production and manufacture of PV cells are less common. This information is needed to support reliable estimates of the potential for environmental impacts associated with the life cycle of PV cells.
This report was initially prepared in 2001. Some of the information was updated to 2003, but for the most part this report is a summary of information available prior to 2001. Because the PV industry is evolving rapidly, some of the industry statistics and other information in this report may quickly become outdated. An extensive reference list, including pertinent websites, is provided for readers interested in more recent developments within the industry.
Objectives
The overall objectives of this project were:
• To identify chemicals used as components of PV cells or in PV cell manufacturing processes, and their potential for release to the environment
• To determine the potential for risks to the environment, particularly to surface water and groundwater, from the manufacture and disposal of different types of PV cells
• To identify existing and emerging PV cell technologies that have relatively lower environmental risks, compared to other cell types.
1-1
Introduction
Published and unpublished literature describing potential environmental issues associated with the manufacture and disposal of PV cells was compiled and reviewed. Information on the manufacturing processes and chemicals used in the production of PV cells was provided by Dr. Vasilis Fthenakis of Brookhaven Laboratory and obtained from PV journals and trade associations. An estimate of the number of PV cells produced and currently being used, and examples of common applications and their life spans are included in this report. Information was also obtained on typical industry practices for disposal or recycling of used PV cells. Originally, modeling to predict potential impacts of disposal in landfills was planned as part of the study. However, no information on the disposal of cells to landfills was obtained, since the industry is new and most installations last for 20 to 30 years. Thus, modeling would have been entirely theoretical. The current intent of the industry is to recycle the PV modules to avoid the potential for environmental effects due to leaching of metals such as cadmium. One method for recycling key materials in the photovoltaic industry that shows great potential is ‘cradle to cradle’ recycling. Cradle to cradle recycling involves a product life cycle that encompasses not only the design, manufacture, and useful life of the product, but also the recycling of the product into something new. Often, this type of recycling involves returning the recycled material directly back into the same technology. This approach may help to reduce the amount of hazardous waste generated by the photovoltaic industry.
The potential for chemicals used in PV cells to be released to air, surface water, and groundwater was considered for the manufacturing facility, the installation site, and the disposal or recycling facility. Information on the relative toxicity to human health and biota was obtained for the various chemicals used in the manufacturing process.
Report Organization
An overview of the principles of photovoltaic cells, the types of PV cells, and common PV module applications are provided in Section 2. The chemicals used in the manufacturing processes and the typical PV disposal/recycling practices are described in Section 3. The potential for human health and environmental impacts is discussed in Section 4. References are provided in Section 5.
1-2
2 OVERVIEW OF THE PHOTOVOLTAIC INDUSTRY
Development of Photovoltaic Cells
Photovoltaics involves the conversion of sunlight into direct current (DC) electricity through the use of thin layers of materials known as semiconductors. The physical processes involved in the conversion of sunlight into electricity include light adsorption, electron transport, and recombination mechanisms, which are determined by the electro-optical properties of the material (Moller, 1993).
The first practical photovoltaic cells were developed in 1954 at Bell Laboratories (Chapin et al., 1954). The first solar cells developed were made of silicon, and were used primarily by the space industry for vehicle and satellite power supplies, beginning in 1958. The material properties and abundance of silicon made it a desirable choice for the manufacturing of solar cells. Silicon (Si) is a fairly cheap and plentiful element, found, for example, as quartz in sand. The properties of silicon that make it suitable for solar cells are that it is an excellent electrical and chemical insulator, has high electrical resistivity, has a relatively low saturation current density, and can absorb a large portion of the solar spectrum. In 1997, 98 percent of photovoltaic modules produced were made of silicon (Mazer, 1997). Amorphous silicon was first used for PV cells in 1976. Development of thin film silicon cells began in the late 1970s. Silicon-based concentrator cells were first used in space, but have recently been adapted for terrestrial applications. Thin-film cells, such as the cadmium telluride (CdTe) cell, were commercially produced in 2001, but the PV cell market is still dominated by silicon-based cells.
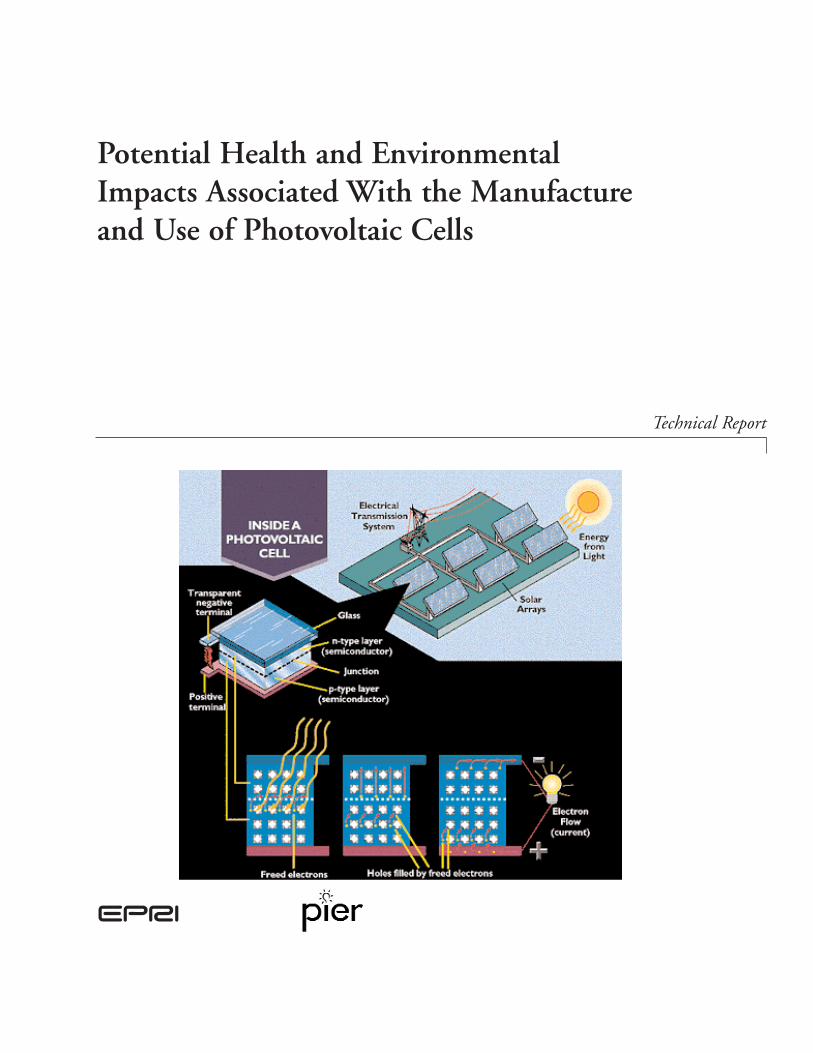
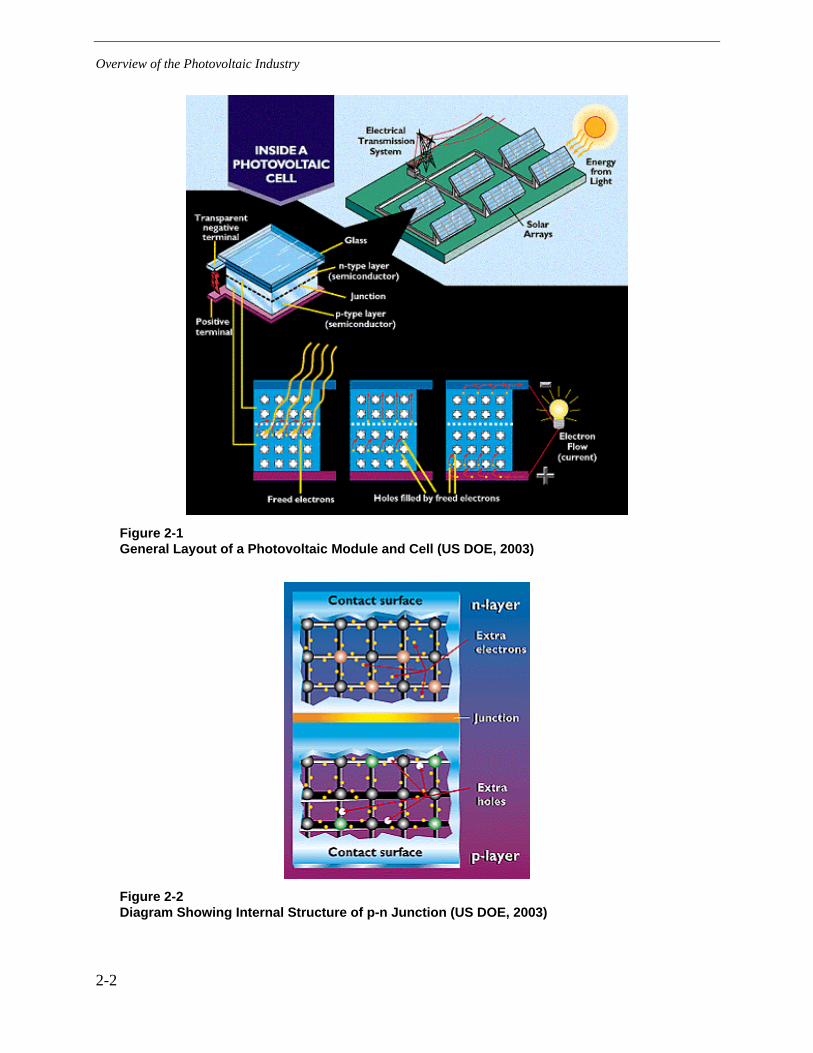
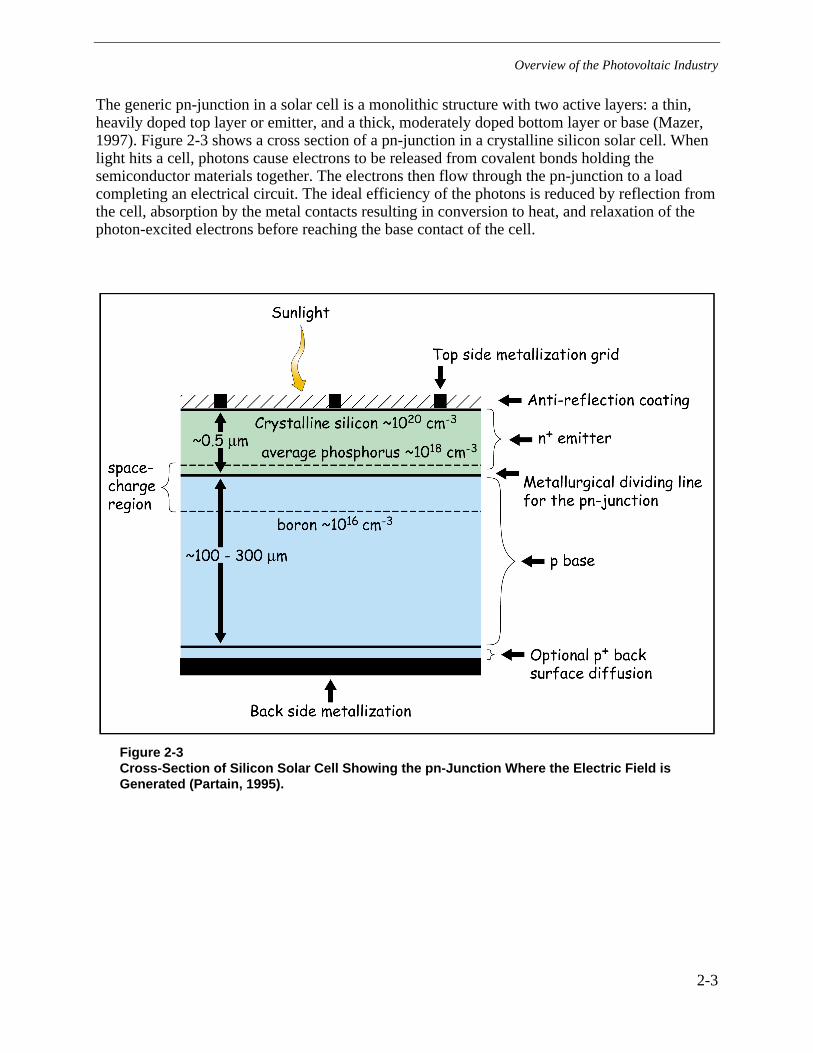
A typical photovoltaic installation consists of several small, individual generating units or cells connected together in a grid. The individual cells are linked to form larger modules (Figure 2-1). These photovoltaic cells are generally composed of a front metal contact, semiconductor material, rear metal contact, and wires to transfer electrical loads. The actual conversion of sunlight into electricity takes place when photons are absorbed by the semiconductor material in the part of a photovoltaic cell called the pn-junction (positive/negative-diode) structure. These regions have either a deficiency of electrons, forming a positive region (p), or a surplus of electrons, forming a negative region (n), as shown in Figure 2-2. The electrons released when the energy of the photon is transferred form an electric current, which can then flow to an external load. Boron is typically added during silica crystal growth to produce the “p” region. Phosphorus is added to the silica wafer by allowing seepage of a phosphorus solution into a heated silicon wafer to form the “n” region (Green, 2000). Metal particles in a paste are then added to form the top and bottom contact layers. A surface, anti-reflection coating is sometimes added to the top contact.
2-1
Overview of the Photovoltaic Industry
Figure 2-1 General Layout of a Photovoltaic Module and Cell (US DOE, 2003)
Figure 2-2 Diagram Showing Internal Structure of p-n Junction (US DOE, 2003)
2-2
Overview of the Photovoltaic Industry
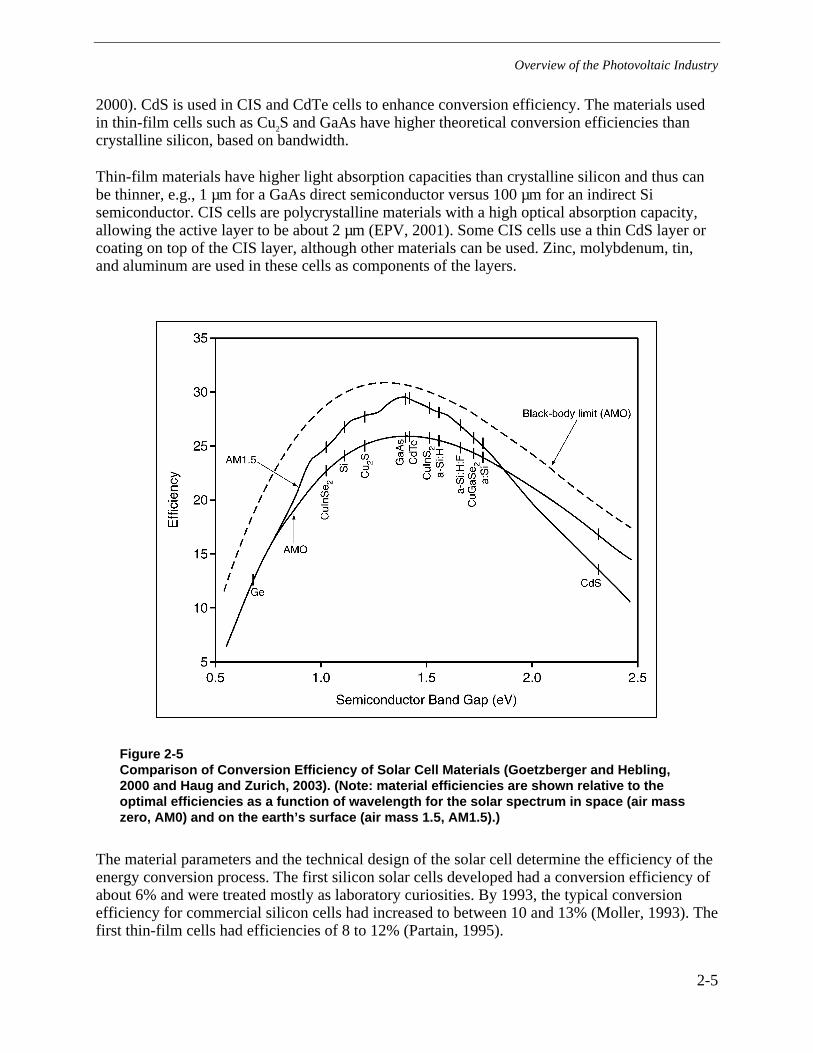
The generic pn-junction in a solar cell is a monolithic structure with two active layers: a thin, heavily doped top layer or emitter, and a thick, moderately doped bottom layer or base (Mazer, 1997). Figure 2-3 shows a cross section of a pn-junction in a crystalline silicon solar cell. When light hits a cell, photons cause electrons to be released from covalent bonds holding the semiconductor materials together. The electrons then flow through the pn-junction to a load completing an electrical circuit. The ideal efficiency of the photons is reduced by reflection from the cell, absorption by the metal contacts resulting in conversion to heat, and relaxation of the photon-excited electrons before reaching the base contact of the cell.
Figure 2-3 Cross-Section of Silicon Solar Cell Showing the pn-Junction Where the Electric Field is Generated (Partain, 1995).
2-3

Overview of the Photovoltaic Industry
Thin-film solar cells are typically made up of thin layers of semiconductor material, zinc or tin oxide, glass, and a contact material. The development of new photovoltaic technologies using thin-film materials as the semiconductor material has been driven by the need for cheaper photovoltaic materials and more efficient semiconductors. The materials used in thin-film solar cells include amorphous silicon, polycrystalline silicon, and compound semiconductors. Compound semiconductors include cadmium telluride (CdTe), cadmium sulfide (CdS), copper sulfide (Cu2S), copper indium diselenide (CIS), copper indium gallium diselenide (CIGS), copper gallium diselenide (CGS), germanium (Ge), and gallium arsenide (GaAs) (Partain, 1995). In these cells, the p material can be made of CuInSe2 or ZnTe, while the n material can be made of CdS. GaAs cells can have indium, phosphorous, or aluminum as p or n-type materials. Figure 2-4 shows cross-sectional views of thin-film amorphous silicon, CdTe, and CIGS solar cells.
Figure 2-4 Examples of Thin-Film Solar Cells: a) Amorphous Silicon, b) Cadmium Telluride, and c) Copper Indium Gallium Diselenide (Goetzberger and Hebling, 2000).
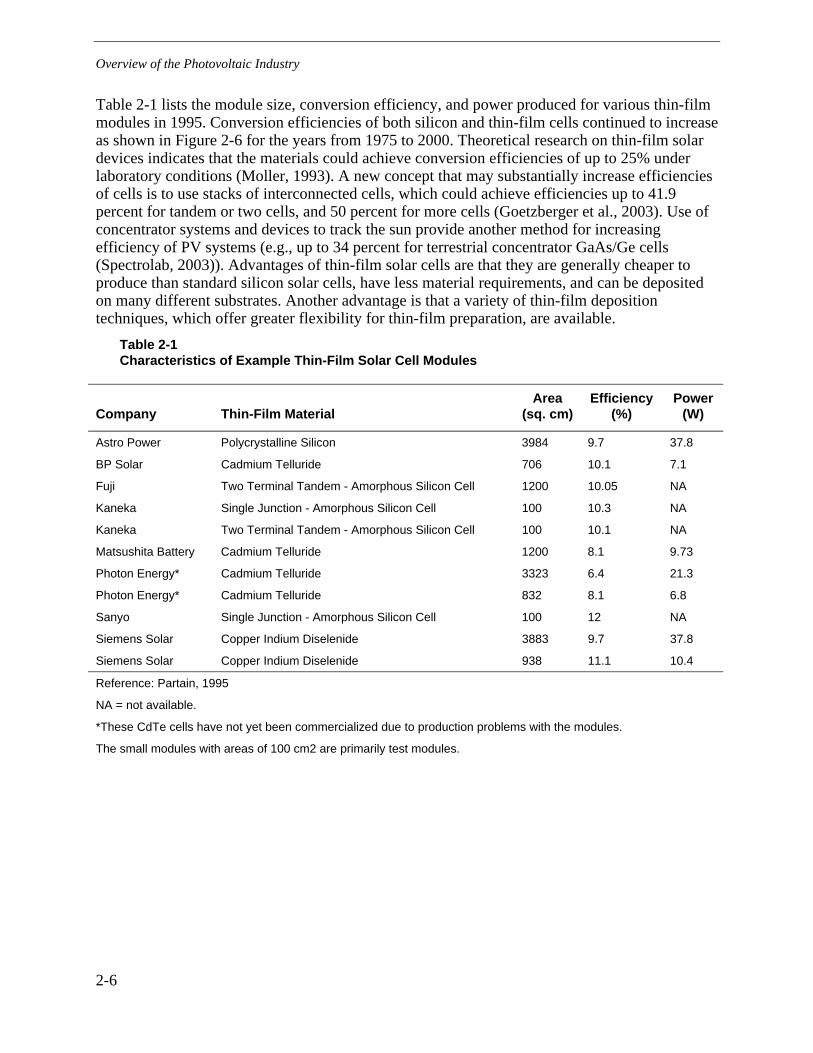
Figure 2-5 shows that the semiconductor materials Cu2S, CuInS2, CuInSe2, CuGaSe2, CdTe, GaAs, and crystalline Si are within the optimum bandwidth range of 1.1 to 1.7 eV (Goetzberger and Hebling, 2000 and Haug, 2003). Amorphous-Si is just outside the optimum band width at 1.8 eV (Haug, 2003). Both Ge and CdS have bandwidths further outside of the optimum range of 1.1 to 1.7eV, which means those materials have reduced conversion efficiency. Ge is used to enhance conversion efficiency of silicon cells, particularly amorphous silicon cells (Andersson,
2-4
Overview of the Photovoltaic Industry
2000). CdS is used in CIS and CdTe cells to enhance conversion efficiency. The materials used in thin-film cells such as Cu2S and GaAs have higher theoretical conversion efficiencies than crystalline silicon, based on bandwidth.
Thin-film materials have higher light absorption capacities than crystalline silicon and thus can be thinner, e.g., 1 µm for a GaAs direct semiconductor versus 100 µm for an indirect Si semiconductor. CIS cells are polycrystalline materials with a high optical absorption capacity, allowing the active layer to be about 2 µm (EPV, 2001). Some CIS cells use a thin CdS layer or coating on top of the CIS layer, although other materials can be used. Zinc, molybdenum, tin, and aluminum are used in these cells as components of the layers.
Figure 2-5 Comparison of Conversion Efficiency of Solar Cell Materials (Goetzberger and Hebling, 2000 and Haug and Zurich, 2003). (Note: material efficiencies are shown relative to the optimal efficiencies as a function of wavelength for the solar spectrum in space (air mass zero, AM0) and on the earth’s surface (air mass 1.5, AM1.5).)
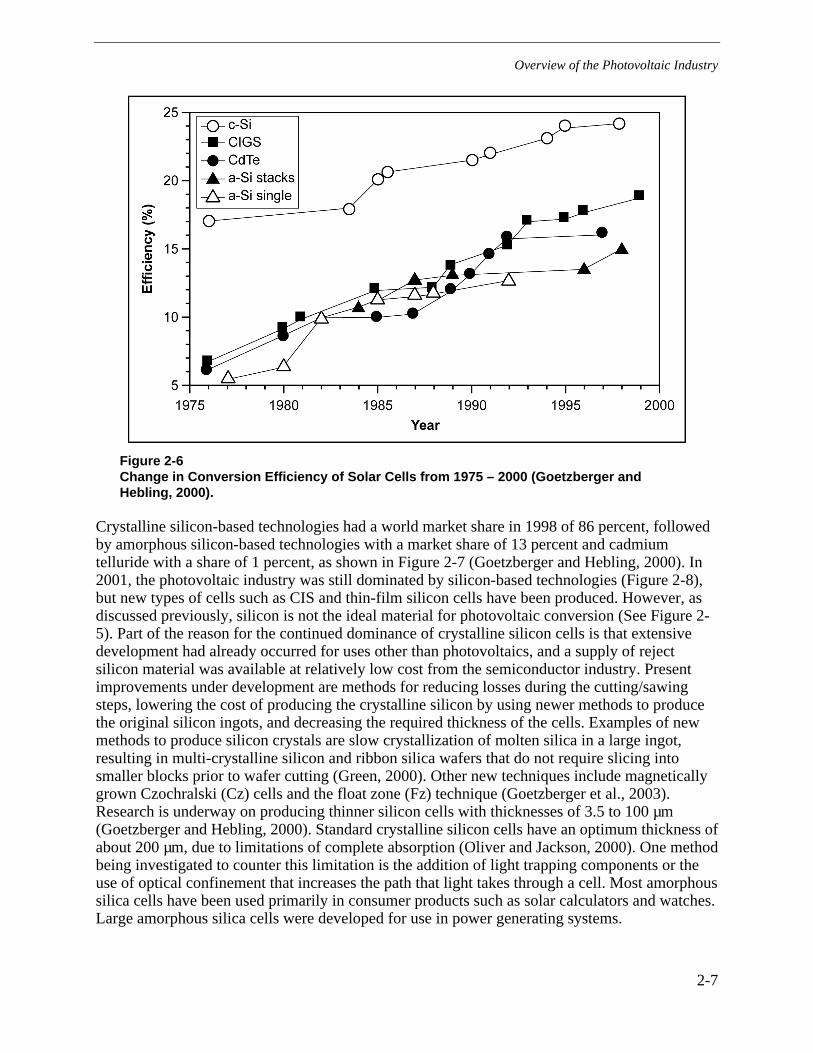
The material parameters and the technical design of the solar cell determine the efficiency of the energy conversion process. The first silicon solar cells developed had a conversion efficiency of about 6% and were treated mostly as laboratory curiosities. By 1993, the typical conversion efficiency for commercial silicon cells had increased to between 10 and 13% (Moller, 1993). The first thin-film cells had efficiencies of 8 to 12% (Partain, 1995).
2-5
Overview of the Photovoltaic Industry
Table 2-1 lists the module size, conversion efficiency, and power produced for various thin-film modules in 1995. Conversion efficiencies of both silicon and thin-film cells continued to increase as shown in Figure 2-6 for the years from 1975 to 2000. Theoretical research on thin-film solar devices indicates that the materials could achieve conversion efficiencies of up to 25% under laboratory conditions (Moller, 1993). A new concept that may substantially increase efficiencies of cells is to use stacks of interconnected cells, which could achieve efficiencies up to 41.9 percent for tandem or two cells, and 50 percent for more cells (Goetzberger et al., 2003). Use of concentrator systems and devices to track the sun provide another method for increasing efficiency of PV systems (e.g., up to 34 percent for terrestrial concentrator GaAs/Ge cells (Spectrolab, 2003)). Advantages of thin-film solar cells are that they are generally cheaper to produce than standard silicon solar cells, have less material requirements, and can be deposited on many different substrates. Another advantage is that a variety of thin-film deposition techniques, which offer greater flexibility for thin-film preparation, are available.
Table 2-1 Characteristics of Example Thin-Film Solar Cell Modules
Company Thin-Film Material Area
(sq. cm) Efficiency
(%) Power
(W)
Astro Power Polycrystalline Silicon 3984 9.7 37.8
BP Solar Cadmium Telluride 706 10.1 7.1
Fuji Two Terminal Tandem - Amorphous Silicon Cell 1200 10.05 NA
Kaneka Single Junction - Amorphous Silicon Cell 100 10.3 NA
Kaneka Two Terminal Tandem - Amorphous Silicon Cell 100 10.1 NA
Matsushita Battery Cadmium Telluride 1200 8.1 9.73
Photon Energy* Cadmium Telluride 3323 6.4 21.3
Photon Energy* Cadmium Telluride 832 8.1 6.8
Sanyo Single Junction - Amorphous Silicon Cell 100 12 NA
Siemens Solar Copper Indium Diselenide 3883 9.7 37.8
Siemens Solar Copper Indium Diselenide 938 11.1 10.4
Reference: Partain, 1995
NA = not available.
*These CdTe cells have not yet been commercialized due to production problems with the modules.
The small modules with areas of 100 cm2 are primarily test modules.
2-6
Overview of the Photovoltaic Industry
Figure 2-6 Change in Conversion Efficiency of Solar Cells from 1975 – 2000 (Goetzberger and Hebling, 2000).
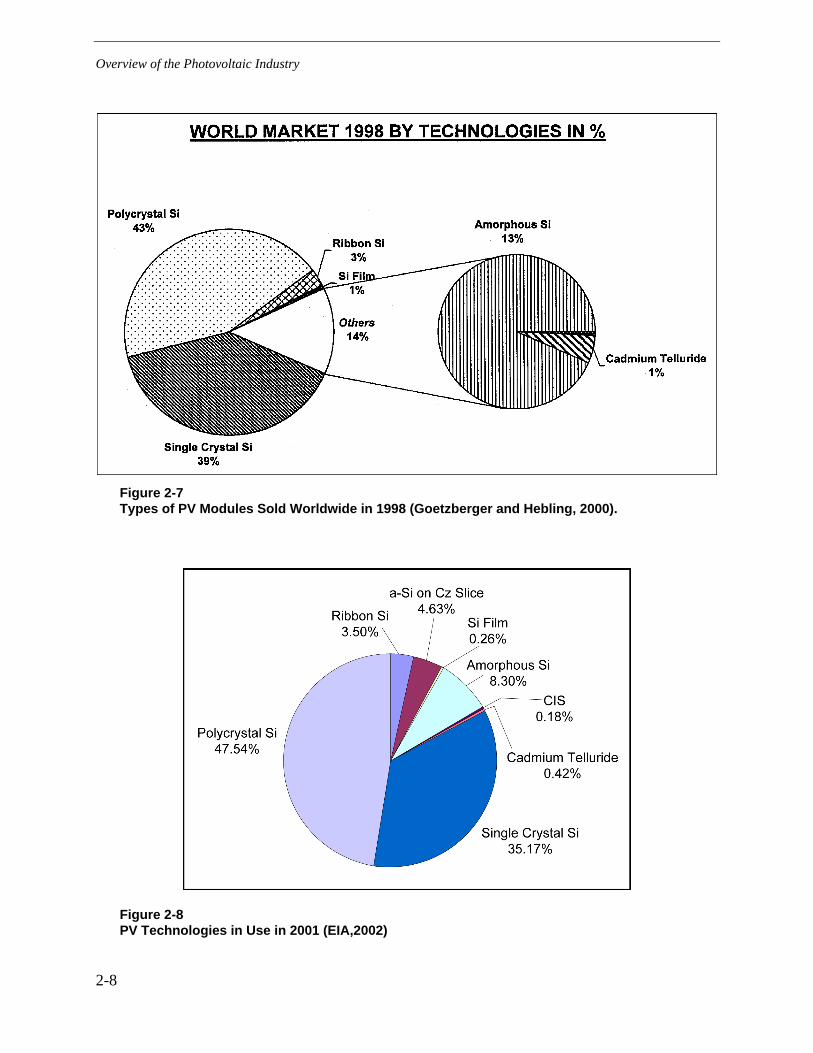
Crystalline silicon-based technologies had a world market share in 1998 of 86 percent, followed by amorphous silicon-based technologies with a market share of 13 percent and cadmium telluride with a share of 1 percent, as shown in Figure 2-7 (Goetzberger and Hebling, 2000). In 2001, the photovoltaic industry was still dominated by silicon-based technologies (Figure 2-8), but new types of cells such as CIS and thin-film silicon cells have been produced. However, as discussed previously, silicon is not the ideal material for photovoltaic conversion (See Figure 2-5). Part of the reason for the continued dominance of crystalline silicon cells is that extensive development had already occurred for uses other than photovoltaics, and a supply of reject silicon material was available at relatively low cost from the semiconductor industry. Present improvements under development are methods for reducing losses during the cutting/sawing steps, lowering the cost of producing the crystalline silicon by using newer methods to produce the original silicon ingots, and decreasing the required thickness of the cells. Examples of new methods to produce silicon crystals are slow crystallization of molten silica in a large ingot, resulting in multi-crystalline silicon and ribbon silica wafers that do not require slicing into smaller blocks prior to wafer cutting (Green, 2000). Other new techniques include magnetically grown Czochralski (Cz) cells and the float zone (Fz) technique (Goetzberger et al., 2003). Research is underway on producing thinner silicon cells with thicknesses of 3.5 to 100 µm (Goetzberger and Hebling, 2000). Standard crystalline silicon cells have an optimum thickness of about 200 µm, due to limitations of complete absorption (Oliver and Jackson, 2000). One method being investigated to counter this limitation is the addition of light trapping components or the use of optical confinement that increases the path that light takes through a cell. Most amorphous silica cells have been used primarily in consumer products such as solar calculators and watches. Large amorphous silica cells were developed for use in power generating systems.
2-7
Overview of the Photovoltaic Industry
Figure 2-7 Types of PV Modules Sold Worldwide in 1998 (Goetzberger and Hebling, 2000).
Figure 2-8 PV Technologies in Use in 2001 (EIA,2002)
2-8
Overview of the Photovoltaic Industry
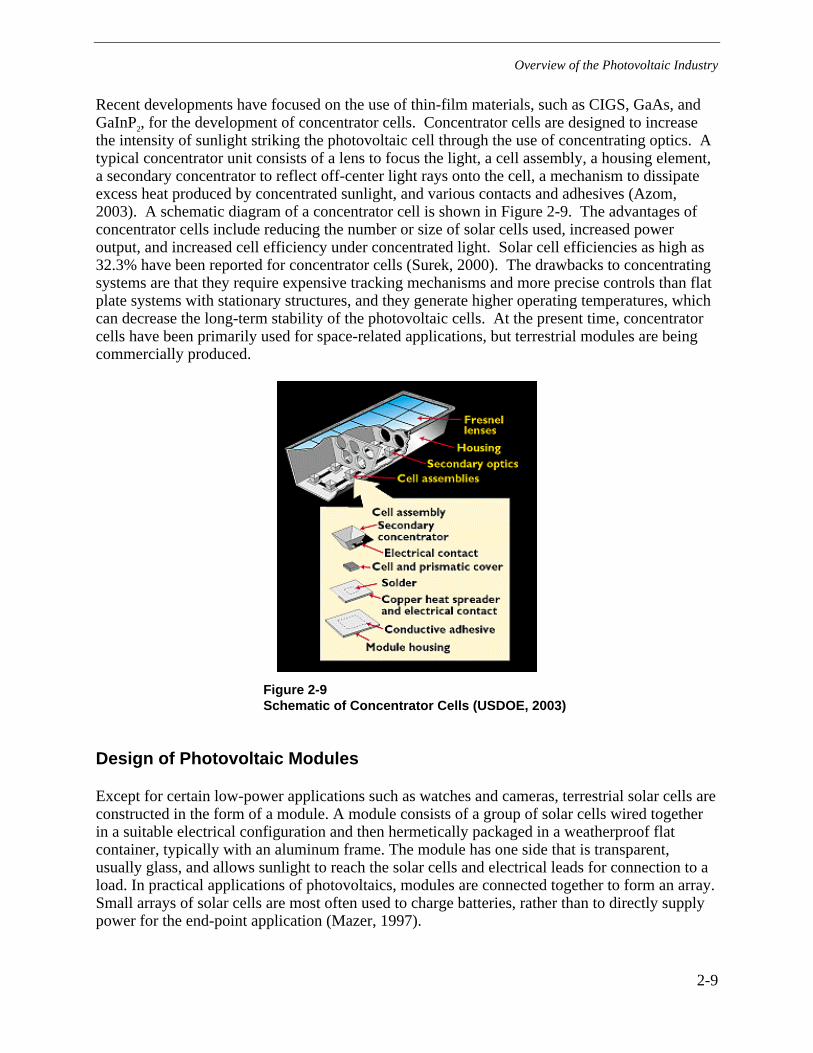
Recent developments have focused on the use of thin-film materials, such as CIGS, GaAs, and GaInP2, for the development of concentrator cells. Concentrator cells are designed to increase the intensity of sunlight striking the photovoltaic cell through the use of concentrating optics. A typical concentrator unit consists of a lens to focus the light, a cell assembly, a housing element, a secondary concentrator to reflect off-center light rays onto the cell, a mechanism to dissipate excess heat produced by concentrated sunlight, and various contacts and adhesives (Azom, 2003). A schematic diagram of a concentrator cell is shown in Figure 2-9. The advantages of concentrator cells include reducing the number or size of solar cells used, increased power output, and increased cell efficiency under concentrated light. Solar cell efficiencies as high as 32.3% have been reported for concentrator cells (Surek, 2000). The drawbacks to concentrating systems are that they require expensive tracking mechanisms and more precise controls than flat plate systems with stationary structures, and they generate higher operating temperatures, which can decrease the long-term stability of the photovoltaic cells. At the present time, concentrator cells have been primarily used for space-related applications, but terrestrial modules are being commercially produced.
Figure 2-9 Schematic of Concentrator Cells (USDOE, 2003)
Design of Photovoltaic Modules
Except for certain low-power applications such as watches and cameras, terrestrial solar cells are constructed in the form of a module. A module consists of a group of solar cells wired together in a suitable electrical configuration and then hermetically packaged in a weatherproof flat container, typically with an aluminum frame. The module has one side that is transparent, usually glass, and allows sunlight to reach the solar cells and electrical leads for connection to a load. In practical applications of photovoltaics, modules are connected together to form an array. Small arrays of solar cells are most often used to charge batteries, rather than to directly supply power for the end-point application (Mazer, 1997).
2-9
Overview of the Photovoltaic Industry
Solar cell designs have been developed for either terrestrial or outer space applications. The space cell market is driven by a need for high-efficiency cells and is dominated by thin silicon cells and GaAs cells on Ge substrates (Mazer, 1997). These cells must be able to withstand the hostile environment found outside of the earth’s atmosphere, where they are exposed to high-energy nuclear particle bombardment and high levels of ultraviolet radiation. Nearly all U.S. spacecraft have utilized solar cell arrays for their long-term electrical power needs.
The use of solar cells as an alternative energy source for terrestrial applications arose in the mid-1970s. The main reasons for increased interest in solar energy during this time period were the political crisis in the Middle East, the oil embargo, and the realization that fossil fuel sources were limited (Moller, 1993). Since the beginning of the 1980s, new solar cell materials and innovative design concepts have been evaluated. These research efforts have greatly enhanced knowledge of the structural, electronic, and technological aspects of semiconductor materials. The improvements over the last twenty years have allowed the cost of PV cells to come down more than twenty-fold (EEO, 1993).
Growth of the Photovoltaic Industry
Information on the number and types of terrestrial applications of PV cells was first collected separately from information on the space applications of PV modules in 1982 by the U.S. DOE Energy Information Administration (EIA). Electric utilities and non-utility companies that produce over 1 megawatt of electricity from PV systems or that tie their PV system into the electric power grid are required to report to the EIA. The information is summarized annually and made available to the public on the EIA website (www.eia.doe.gov). On a world-wide basis, the number of PV cells/modules has increased from units delivering 57.9 peak megawatts (MWp) in 1986 to 381.3 MWp in 2001 (EIA, 2002). As seen in Figure 2-10, the rate of growth of the photovoltaic market has increased substantially since 1998. The photovoltaic world market today can supply up to 381.3 megawatts per year of electricity, corresponding to a value of over 1 billion U.S. dollars (Goetzberger and Hebling, 2003). In 1998, solar cells contributed about 1 percent of the renewable energy used in the US (Figure 2-11). As seen in Figure 2-12, renewable sources produced 6 percent of the total electricity generated in the United States, down from 8 percent in 1998. The decrease in renewable energy sources was attributed to a decrease in hydropower generation. PV systems continued to contribute about 1 percent of all renewable sources in both 2000 and 2001, as seen in Figure 2-13.
2-10
Overview of the Photovoltaic Industry
Module World Market
88.677.769.460.157.9125.8 151.7
201.5277.9
381.3
0
100
200
300
400
500
1992 1993 1994 1995 1996 1997 1998 1999 2000 2001
Year
Meg
awat
t
Figure 2-10 Growth of PV Modules for Power Generation (Goetzberger et al., 2003).
Sources: Energy Information Administration (EIA), Annual Energy Review 1998, DOE/EIA-0384(98) (Washington, DC, July 1999), Table 1.3. 1998 Renewable Energy: Consumption values based on the sum of electricity consumption from EIA, Electric Power Annual 1998, Volume II, DOE/EIA-0348(98)/2 (Washington, DC, December 1999), and non-electricity consumption based on analysis by the Office of Coal, Nuclear, Electric and Alternate Fuels.
Figure 2-11 Comparison of U.S. Renewable Energy Sources with Fossil Fuel Sources in 1998.
2-11
Overview of the Photovoltaic Industry
Figure 2-12 Sources of Energy Consumed in the United States in 2001 (EIA, 2002)
Figure 2-13 Breakdown of Types of Renewable Energy Sources in 2001 (EIA, 2002)
2-12

Overview of the Photovoltaic Industry
In 1998, 21 companies produced and shipped PV cells or modules capable of producing 50.6 MWp, as shown in Table 2-2, comprising a total value of $185 million (EIA, 2000). In 2001, 19 companies produced PV cells capable of producing 97.7 MWp, representing a total value of $305 million (EIA, 2002). The end-uses of these cells/modules are shown in Table 2-3. Crystalline silicon cells are the most commonly-used type for all categories. In California, solar/PV modules are used for power generation by electric utilities and by non-utility users. A small number of PV cells/modules are imported from Japan, Australia, England, and India (EIA, 2000). About 63 percent of modules produced were exported in 2001: 63.8 percent to Europe, 16.1 percent to Asia, 7.6 percent to North America, 4.8 percent to Africa, and 0.1 percent to South America (EIA, 2002). The number of complete PV module systems increased from 1,077 in 1995 to 10,737 in 2000, but decreased to 6,759 in 2001. However, the power generation capability increased from 4,099 MWp in 2000 to 10,075 MWp in 2001 (EIA, 2002). The number of people employed in the PV industry increased from 1,588 in 1991 to 2,666 in 2001. Of the total of 19 companies involved in the PV industry, 11 were involved in the manufacture of cells, 14 were involved in cell design, 14 sold to wholesale distributors, and 7 sold to retail outlets (Table 2-4).
Twelve companies were involved in prototype module development in 2001, down from 17 companies in 2000. Of these new products, most were still expected to be silicon-based, as seen in Table 2-5. Research is underway on eight new types of PV cells (Table 2-6). Chemicals used in the new types that have not previously been used in PV cells include copper phthalocyanine and tungsten.
Table 2-2 Annual Shipments of Photovoltaic Cells and Modules for Terrestrial Applications, 1987-2001(EIA, 2002)
Total PV Cell and Module Shipments (Peak Kilowatts) Year Number of Companies
Totala Imports Exports
1987 17 6,850 921 3,821 1988 14 9,676 1,453 5,358 1990b 19 13,837 1,398 7,544 1991 23 14,939 2,059 8,905 1992 21 15,583 1,602 9,823 1993 19 20,951 1,767 14,814 1994 22 26,077 1,960 17,714 1995 24 31,059 1,337 19,871 1996 25 35,464 1,864 22,448 1997 21 46,354 1,853 33,793 1998 21 50,562 1,931 35,493 1999 19 76,787 4,784 55,562 2000 21 88,221 8,821 68,382 2001 19c 97,666 10,204 61,356 aTotal includes imported cells and modules later shipped to domestic or export markets.
bIncludes data for one company that left business in 1990. cData for merged company of BP Solar and Solarex were reported separately in 2000, but combined in 2001.
2-13

Overview of the Photovoltaic Industry
Table 2-3 Shipments of Photovoltaic Cells and Modules by Market Sector and End Use in 2000-2001 (Peak Kilowatts)
Sector and End Use
Crystalline Silicona
Thin-film Silicon
Concentrator Silicon
2001 Total Shipments
2000 Total Shipments
Market Industrial 24,754 3,135 174 28,063 28,808 Residential 28,307 4,955 0 33,262 24,814 Commercial 13,440 2,270 0 15,710 13,962 Transportation 7,525 961 0 8,486 5,502 Utility 4,799 747 300 5,846 6,298 Governmentb 5,375 353 0 5,728 4,417 Otherc 451 120 0 571 4,690 Total 84,651 12,541 474 97,666 88,221 End Use Elec Gen-grid 22,444 4,482 300 27,226 21,713 Elec Gen-remote 18,772 2,501 174 21,447 14,997 Communications 12,974 1,769 0 14,743 12,269 Consumer Goods 3,664 395 0 4,059 2,870 Transportation 10,803 1,833 0 12,636 12,804 Water Pumping 6,737 708 0 7,444 5,644 Cells/Modules to OEMd
5,778 490 0 6,268 12,153
Health 2,931 272 0 3,203 2,742 Othere 549 92 0 641 3,028 Total 84,651 12,541 474 97,666 88,221 aIncludes single crystal, cast, and ribbon types. bIncludes Federal, state, and local government agencies and military cIncludes shipments manufactured for research dOEM = original equipment manufacturer eIncludes uses such as cooking food, desalinization, distillation, etc. Data are from Form EIA-63B “Annual Photovoltaic Module/Cell Manufacturers Survey (EIA, 2002).
2-14
Overview of the Photovoltaic Industry
Table 2-4 Number of Companies Involved in Photovoltaic-Related Activities, 1997-2001
Type of Activity 1997 1998 1999 2000 2001
Cell Manufacturing 13 13 13 12 11
Module or System Design 18 18 18 17 14
Prototype Module Development
14 16 16 17 12
Prototype Systems Development
10 14 14 15 14
Wholesale Distribution 15 17 16 15 14
Retail Distribution 4 5 5 7 7
Installation 5 6 6 7 7
Noncollector System Component Manufacturing
4 6 5 4
Data are from Form EIA-63B “Annual Photovoltaic Module/Cell Manufacturers Survey (EIA, 2002).
Table 2-5 Companies Expecting To Introduce New Photovoltaic Products in 2002
New Product Type 1999 2002
Crystalline Silicon
Single-crystal Silicon Modules 4 4
Cast Silicon Modules 2 2
Ribbon Silicon Modules 4 3
Thin Film
Amorphous Silicon Module 6 3
Other thin-film Materials 4 1
Other Flat Plate 0 0
Concentrators 2 0
Nonmodule System Components 2 0
Data are from Form EIA-63B “Annual Photovoltaic Module/Cell Manufacturers Survey.
2-15
Overview of the Photovoltaic Industry
Table 2-6 Status of Manufacturing Facilities for Photovoltaic Cells in 2002
PV Cell Type Manufactured in the U.S.
Number of Manufacturing Companies
States where Facilities are Located
Amorphous Silicon Cells & Modules 5 IA, MI, NJ, NY
Crystalline Silicon Cells & Modules 8 CA, DE, MA, MD, PA, TX
Copper Indium Diselenide 3 AZ, CA
Copper Indium Gallium Diselenide 1 AZ
Gallium Arsenide 1 CA
Cadmium Telluride 1 AZ, NY, (OH, CA prior to 11/2002)
PV Cell Types Not Currently Manufactured in the U.S. on a Commercial Basis
Copper Sulfide/Cadmium Sulfide
Copper Phthalocyanine
Cuprous Oxide
Indium Phosphide
Sulfur Nitride
Tungsten Diselenide
Zinc Phosphide
Dye-Sensitized Cells (laboratory research stage)
Organic Solar Cells using pentacene or conjugated polymer/fullerene mixtures (laboratory research stage)
Other companies use cells manufactured elsewhere to assemble products.
Of these types, the one closest to commercial production is copper sulfide/cadmium sulfide. As discussed previously, only CdTe and CIS cells have a measurable market share compared to all cell types, and that was less than 1 percent for each of these two types in 2001 (EIA, 2002). Another new cell type currently in the laboratory research stage is the nanocrystalline dye-sensitized cell, which uses ruthenium-based organic dyes (Green, 2000). A second type of dye-sensitized cell uses a porous layer of titanium dioxide (TiO2) covered with a layer of dye molecules (Goetzberger and Hebling, 2000). These molecules absorb light, which excites electrons, resulting in flow to the TiO2 layer. These cells are also in the early research stage. A
2-16

Overview of the Photovoltaic Industry
new type of organic solar cell is in the laboratory research stage, which uses plastic materials such as pentacene or a conjugated polymer/fullerene interpenetrating network as the semiconductor material (Goetzberger et al., 2003). A summary of firms involved in PV manufacturing or assembly of PV cells or modules is included in Appendix A.
Uses of PV Systems
Solar cells have been used to power a variety of different devices and systems. Small electronic devices such as watches, calculators, telephones, computers, and cameras have utilized small solar cells as a power source. Consumer products such as solar-powered watches and calculators, using amorphous thin-film silicon, accounted for about one third of the PV market in 1993 (EEO, 1993). These small PV products have been an important proving ground for thin-film PV technologies. Even in 1998, the use of thin-film silicon cells was greater in consumer products than the use of crystalline silicon cells. Since 1993, PV systems have increasingly been used for electric power generation, and thus the percent of PV cells used in consumer products has decreased to 7 percent of the total PV market (based on peak kilowatts).
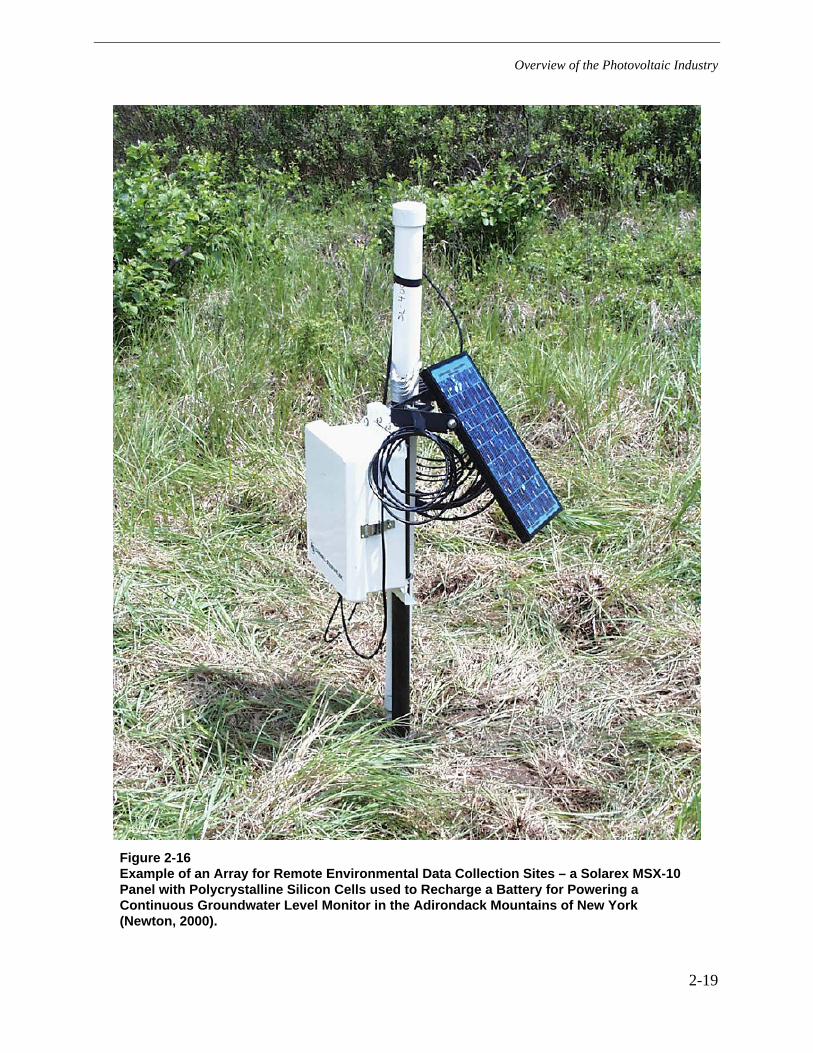
Larger applications of photovoltaic technologies include residential and commercial buildings, remote weather recording and data transmission stations, communication systems, street lights, water pumps in remote areas, and microwave telephone repeaters. In remote locations, not served by electric transmission grids, PV cells coupled to batteries can provide a less expensive source of electricity. Figure 2-14 is a picture of a residential dwelling powered by a 3-kW solar system. Figure 2-15 is a picture of a microwave telephone repeater that utilizes solar power. Photovoltaic technologies have gained popularity in countries such as Indonesia, India, and Africa where they are used to provide power to houses in remote areas. Photovoltaic modules are also ideally suited for powering remote monitoring sites. Figure 2-16 shows a small array linked to a battery that operates a groundwater elevation gauge in a well located in the backcountry of the Adirondack Mountains in New York (Newton, 2000).
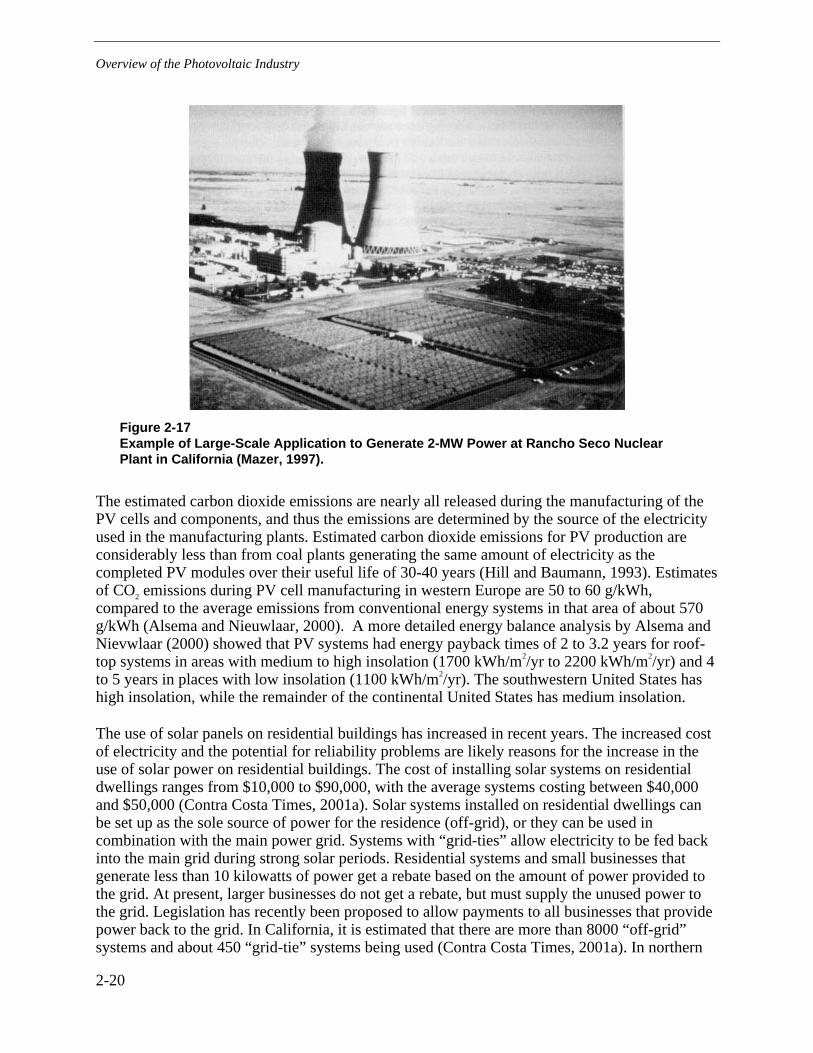
One of the newest and largest applications of photovoltaic arrays has been for central station generation of electric power. Several utility companies have installed prototype PV generating facilities that have solar arrays of hundreds of kilowatts or larger (Mazer, 1997). One of these facilities is a 2-megawatt photovoltaic installation located at the Rancho Seco nuclear plant in California (Figure 2-17). Other existing photovoltaic generating stations include a 1-megawatt facility located in Davis, California, a 1-megawatt facility operated in southern California by Southern California Edison, and a 6.5-megawatt facility operated in northern California by PG&E. A major benefit of photovoltaic systems is that they do not produce any greenhouse gases, other than the carbon dioxide gases emitted during manufacture of the original PV units.
2-17

Overview of the Photovoltaic Industry
Figure 2-14 Example of Rooftop Solar Cell Arrays for Home Application with 50 Solarex MSX-60 Modules to Produce up to 3-kW of Electricity (Mazer, 1997).
Figure 2-15 Example of a Commercial Application as a Power Supply for a Microwave Repeater at Clay Hills, Utah (Mazer, 1997).
2-18
Overview of the Photovoltaic Industry
Figure 2-16 Example of an Array for Remote Environmental Data Collection Sites – a Solarex MSX-10 Panel with Polycrystalline Silicon Cells used to Recharge a Battery for Powering a Continuous Groundwater Level Monitor in the Adirondack Mountains of New York (Newton, 2000).
2-19
Overview of the Photovoltaic Industry
Figure 2-17 Example of Large-Scale Application to Generate 2-MW Power at Rancho Seco Nuclear Plant in California (Mazer, 1997).
The estimated carbon dioxide emissions are nearly all released during the manufacturing of the PV cells and components, and thus the emissions are determined by the source of the electricity used in the manufacturing plants. Estimated carbon dioxide emissions for PV production are considerably less than from coal plants generating the same amount of electricity as the completed PV modules over their useful life of 30-40 years (Hill and Baumann, 1993). Estimates of CO2 emissions during PV cell manufacturing in western Europe are 50 to 60 g/kWh, compared to the average emissions from conventional energy systems in that area of about 570 g/kWh (Alsema and Nieuwlaar, 2000). A more detailed energy balance analysis by Alsema and Nievwlaar (2000) showed that PV systems had energy payback times of 2 to 3.2 years for roof-top systems in areas with medium to high insolation (1700 kWh/m2/yr to 2200 kWh/m2/yr) and 4 to 5 years in places with low insolation (1100 kWh/m2/yr). The southwestern United States has high insolation, while the remainder of the continental United States has medium insolation.
The use of solar panels on residential buildings has increased in recent years. The increased cost of electricity and the potential for reliability problems are likely reasons for the increase in the use of solar power on residential buildings. The cost of installing solar systems on residential dwellings ranges from $10,000 to $90,000, with the average systems costing between $40,000 and $50,000 (Contra Costa Times, 2001a). Solar systems installed on residential dwellings can be set up as the sole source of power for the residence (off-grid), or they can be used in combination with the main power grid. Systems with “grid-ties” allow electricity to be fed back into the main grid during strong solar periods. Residential systems and small businesses that generate less than 10 kilowatts of power get a rebate based on the amount of power provided to the grid. At present, larger businesses do not get a rebate, but must supply the unused power to the grid. Legislation has recently been proposed to allow payments to all businesses that provide power back to the grid. In California, it is estimated that there are more than 8000 “off-grid” systems and about 450 “grid-tie” systems being used (Contra Costa Times, 2001a). In northern
2-20

Overview of the Photovoltaic Industry
California, grid-tie systems have increased from 12 in 1997 to 217 in 2001 (Contra Costa Times, 2001b). Colorado and Arizona also have numerous “off-grid” systems in remote areas. A series of incentive programs to promote use of PV systems for electricity by residential and commercial users has been implemented in California ranging from property tax reductions to rebates based on the amount of power generated (Contra Costa Times, 2001b). Incentive programs have been used in other countries to increase the use of PV systems for residences and small businesses (e.g., the 1,000 roof program in Germany completed in 1995, and a plan for installing 70,000 PV roof-top systems in Japan by 2005 (Jackson and Oliver, 2000)). By the end of 1999, over 20,000 PV roof-top systems had been installed in Japan (Green, 2000). A program to install one million PV roof-top systems in the United States was begun in 1997, with subsidies consisting of tax credits, grants, and loans.
A constraint on increased use of photovoltaic systems for the generation of electricity is the high cost compared to alternative fuel sources. In 1997, the cost of PV-generated electricity was typically 2.5 to 5 times higher than that of fossil fuel generated electricity (Mazer, 1997). The higher cost of PV-generated electricity is a result of the high cost of semiconductor materials and the expense of processing these materials into usable solar cells. The U.S. DOE National Center for Photovoltaics (www.nrel.gov/ncpv/) has sponsored research to improve the manufacturing processes in terms of efficiency and reducing costs. Examples of improvements have been automation of the various steps in the process, and reductions in the quantity of material used.
Another important factor in the cost of PV electricity is the insolation available to the PV power plant or facility. When more insolation is available to a facility, more electricity can be generated and the cost of generating the electricity on a kilowatt-hour basis is lower. Based on the effects of insolation, sunny sites offer cost advantages over sites with a higher number of cloudy days. The generation of electricity by PV systems is intermittent, and for a residential or business application, back-up power or battery storage is necessary, which also increases the cost of an off-grid system.
2-21
3 HANDLING OF CHEMICALS USED IN PHOTOVOLTAIC SYSTEMS
Chemicals Used in the Production of Photovoltaic Cells
The production of photovoltaic devices involves the use of a variety of chemicals and materials. The amounts and types of chemicals used will vary depending upon the type of cell being produced. There is also some variability among the different photovoltaic companies with respect to the chemicals used for manufacturing the same type of photovoltaic cells.
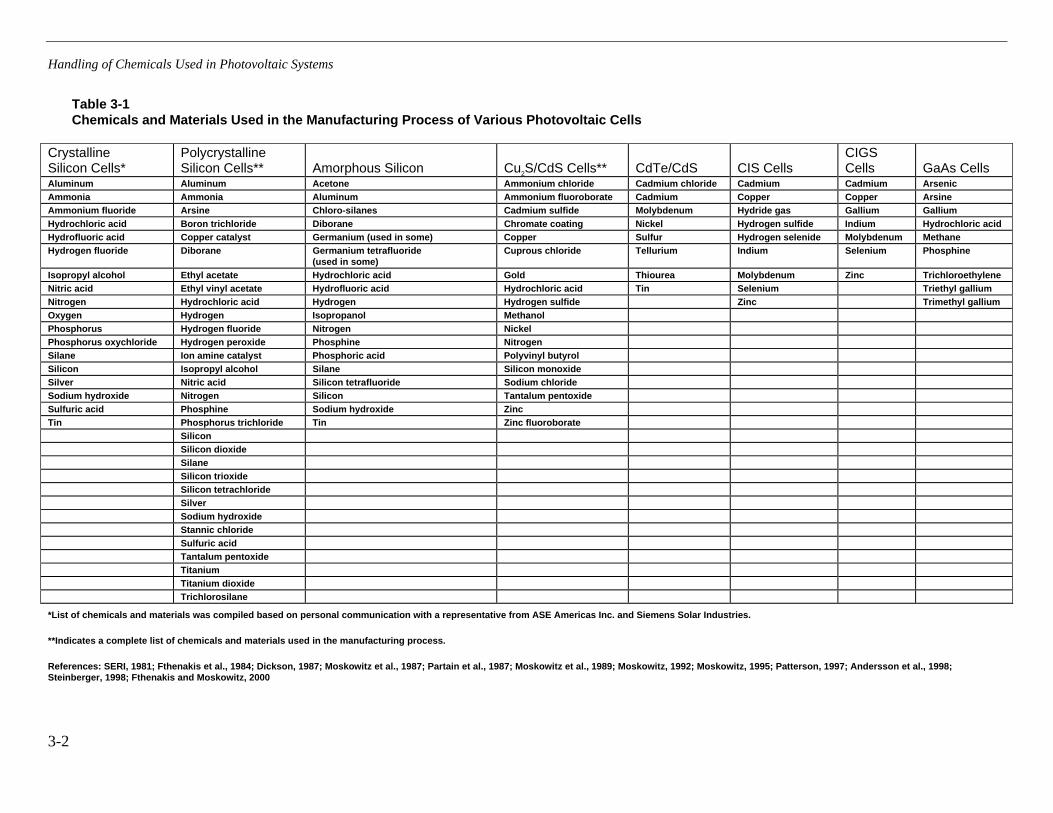
Table 3-1 provides a general list of chemicals and materials used in the production of silicon and thin-film solar cells. The list is complete for the polycrystalline silicon and copper/cadmium sulfide photovoltaic cells. For other types of cells, complete information was not available; all known chemicals are listed. Physical and chemical properties of these chemicals are provided in Appendix B.
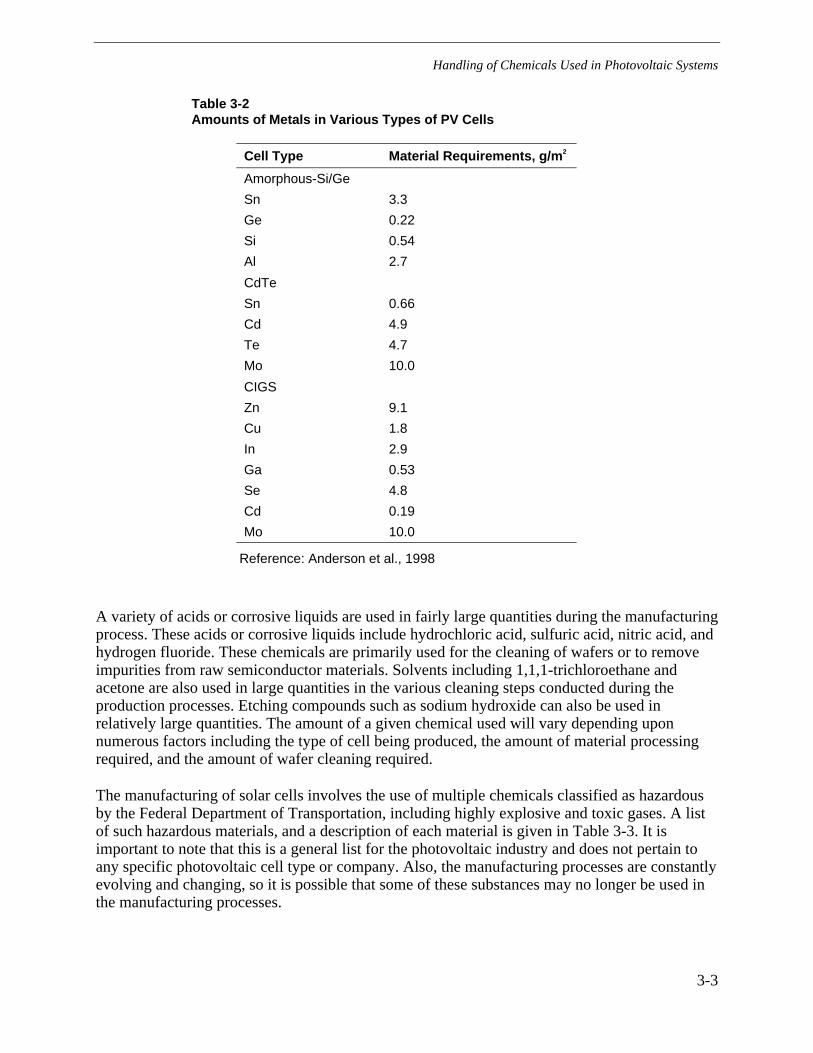
The quantities of various chemicals used during the manufacturing of photovoltaic devices vary greatly. The semiconductor materials themselves are used in small quantities, since only a limited amount is needed to produce the ultra-thin layers of a PV cell. For example, a yearly production volume of 2000 tons of solar panels, capable of producing about 10 MW of electricity, requires only about 20 tons of semiconductor material; the rest is mostly glass (Fthenakis, 2000). The amount of cadmium in a CIS PV module is estimated as 0.04 g/m2 and in a CdTe module as 5 g/m2 (Hill and Baumann, 1993). The amounts of metals in other types of PV cells are listed in Table 3-2.
Research is underway to reduce the amount of cadmium used in PV cells (Zweibel et al., 1998). Present CdTe cells use a 2 micron layer, but theoretically only a layer of 0.5 microns would be needed to effectively absorb sunlight. With light-trapping methods, the required layer may be reduced to as little as 0.2 microns. The amount of cadmium in CdTe layers of different thicknesses was 5.5 g/m2 in a 2 micron layer, 1.4 g/m2 in a 0.5 micron layer, and 0.55 g/m2 in a 0.2 micron layer. The CdS layer in CdTe cells is about 0.1 microns thick, and in the future may not be needed at all or would have a thickness of about 0.03 microns, consisting of about 0.1 g/m2. Due to losses during thin-film processing, about 25 to 50 percent more cadmium feedstock is needed than is incorporated into the final product.
3-1
Handling of Chemicals Used in Photovoltaic Systems
Table 3-1 Chemicals and Materials Used in the Manufacturing Process of Various Photovoltaic Cells
Crystalline Silicon Cells*
Polycrystalline Silicon Cells** Amorphous Silicon Cu2S/CdS Cells** CdTe/CdS CIS Cells
CIGS Cells GaAs Cells
Aluminum Aluminum Acetone Ammonium chloride Cadmium chloride Cadmium Cadmium Arsenic Ammonia Ammonia Aluminum Ammonium fluoroborate Cadmium Copper Copper ArsineAmmonium fluoride Arsine Chloro-silanes Cadmium sulfide Molybdenum Hydride gas Gallium Gallium Hydrochloric acid Boron trichloride Diborane Chromate coating Nickel Hydrogen sulfide Indium Hydrochloric acidHydrofluoric acid Copper catalyst Germanium (used in some) Copper Sulfur Hydrogen selenide Molybdenum Methane Hydrogen fluoride Diborane Germanium tetrafluoride
(used in some) Cuprous chloride Tellurium Indium Selenium Phosphine
Isopropyl alcohol Ethyl acetate Hydrochloric acid Gold Thiourea Molybdenum Zinc TrichloroethyleneNitric acid Ethyl vinyl acetate Hydrofluoric acid Hydrochloric acid Tin Selenium Triethyl galliumNitrogen Hydrochloric acid Hydrogen Hydrogen sulfide Zinc Trimethyl gallium Oxygen Hydrogen Isopropanol Methanol Phosphorus Hydrogen fluoride Nitrogen Nickel Phosphorus oxychloride Hydrogen peroxide Phosphine Nitrogen Silane Ion amine catalyst Phosphoric acid Polyvinyl butyrol Silicon Isopropyl alcohol Silane Silicon monoxide Silver Nitric acid Silicon tetrafluoride Sodium chloride Sodium hydroxide Nitrogen Silicon Tantalum pentoxide Sulfuric acid Phosphine Sodium hydroxide Zinc Tin Phosphorus trichloride Tin Zinc fluoroborate Silicon Silicon dioxide Silane Silicon trioxide Silicon tetrachloride Silver Sodium hydroxide Stannic chloride Sulfuric acid Tantalum pentoxide Titanium Titanium dioxide Trichlorosilane
*List of chemicals and materials was compiled based on personal communication with a representative from ASE Americas Inc. and Siemens Solar Industries.
**Indicates a complete list of chemicals and materials used in the manufacturing process.
References: SERI, 1981; Fthenakis et al., 1984; Dickson, 1987; Moskowitz et al., 1987; Partain et al., 1987; Moskowitz et al., 1989; Moskowitz, 1992; Moskowitz, 1995; Patterson, 1997; Andersson et al., 1998; Steinberger, 1998; Fthenakis and Moskowitz, 2000
3-2
Handling of Chemicals Used in Photovoltaic Systems
Table 3-2 Amounts of Metals in Various Types of PV Cells
Cell Type Material Requirements, g/m2
Amorphous-Si/Ge
Sn 3.3
Ge 0.22
Si 0.54
Al 2.7
CdTe
Sn 0.66
Cd 4.9
Te 4.7
Mo 10.0
CIGS
Zn 9.1
Cu 1.8
In 2.9
Ga 0.53
Se 4.8
Cd 0.19
Mo 10.0
Reference: Anderson et al., 1998
A variety of acids or corrosive liquids are used in fairly large quantities during the manufacturing process. These acids or corrosive liquids include hydrochloric acid, sulfuric acid, nitric acid, and hydrogen fluoride. These chemicals are primarily used for the cleaning of wafers or to remove impurities from raw semiconductor materials. Solvents including 1,1,1-trichloroethane and acetone are also used in large quantities in the various cleaning steps conducted during the production processes. Etching compounds such as sodium hydroxide can also be used in relatively large quantities. The amount of a given chemical used will vary depending upon numerous factors including the type of cell being produced, the amount of material processing required, and the amount of wafer cleaning required.
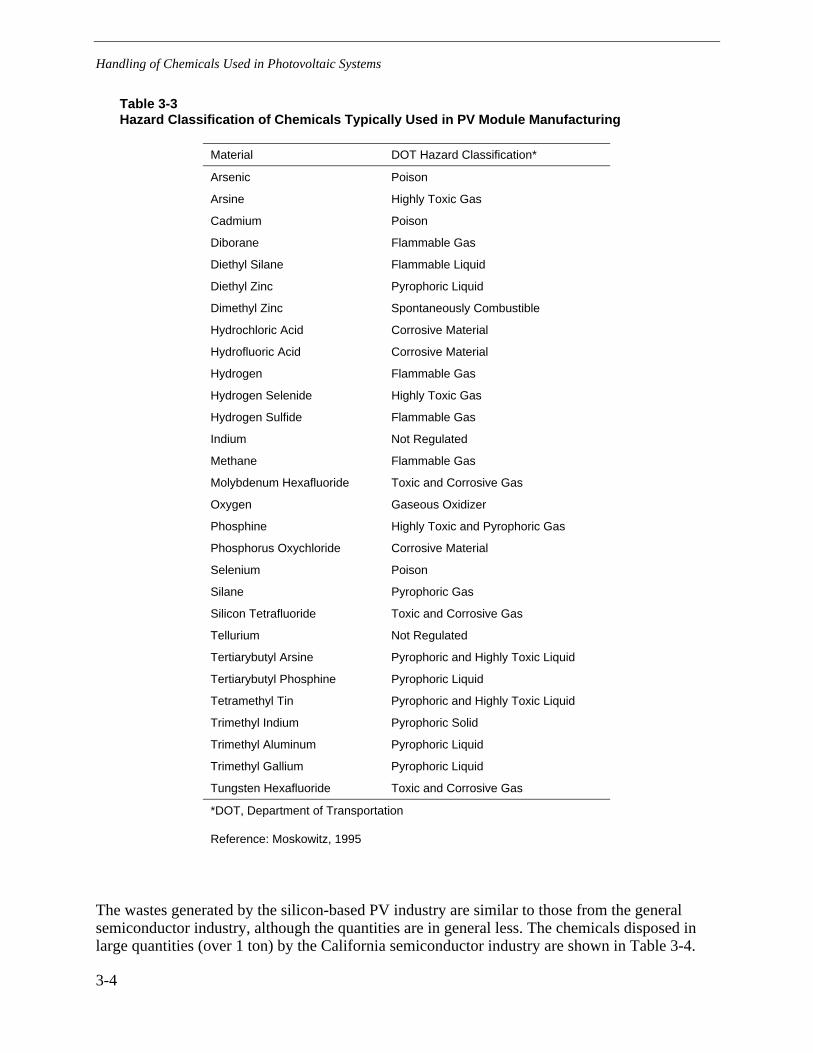
The manufacturing of solar cells involves the use of multiple chemicals classified as hazardous by the Federal Department of Transportation, including highly explosive and toxic gases. A list of such hazardous materials, and a description of each material is given in Table 3-3. It is important to note that this is a general list for the photovoltaic industry and does not pertain to any specific photovoltaic cell type or company. Also, the manufacturing processes are constantly evolving and changing, so it is possible that some of these substances may no longer be used in the manufacturing processes.
3-3
Handling of Chemicals Used in Photovoltaic Systems
Table 3-3 Hazard Classification of Chemicals Typically Used in PV Module Manufacturing
Material DOT Hazard Classification*
Arsenic Poison
Arsine Highly Toxic Gas
Cadmium Poison
Diborane Flammable Gas
Diethyl Silane Flammable Liquid
Diethyl Zinc Pyrophoric Liquid
Dimethyl Zinc Spontaneously Combustible
Hydrochloric Acid Corrosive Material
Hydrofluoric Acid Corrosive Material
Hydrogen Flammable Gas
Hydrogen Selenide Highly Toxic Gas
Hydrogen Sulfide Flammable Gas
Indium Not Regulated
Methane Flammable Gas
Molybdenum Hexafluoride Toxic and Corrosive Gas
Oxygen Gaseous Oxidizer
Phosphine Highly Toxic and Pyrophoric Gas
Phosphorus Oxychloride Corrosive Material
Selenium Poison
Silane Pyrophoric Gas
Silicon Tetrafluoride Toxic and Corrosive Gas
Tellurium Not Regulated
Tertiarybutyl Arsine Pyrophoric and Highly Toxic Liquid
Tertiarybutyl Phosphine Pyrophoric Liquid
Tetramethyl Tin Pyrophoric and Highly Toxic Liquid
Trimethyl Indium Pyrophoric Solid
Trimethyl Aluminum Pyrophoric Liquid
Trimethyl Gallium Pyrophoric Liquid
Tungsten Hexafluoride Toxic and Corrosive Gas
*DOT, Department of Transportation
Reference: Moskowitz, 1995
The wastes generated by the silicon-based PV industry are similar to those from the general semiconductor industry, although the quantities are in general less. The chemicals disposed in large quantities (over 1 ton) by the California semiconductor industry are shown in Table 3-4.
3-4
Handling of Chemicals Used in Photovoltaic Systems
Solvents and acids each comprised about one-third of the total wastes by weight (about 7,000 tons) (Gilles and Loehr, 1994). Ammonia solutions comprised about 10 percent of the total waste. Only two metals were included in the list of large-quantity chemicals: lead (about 0.5 percent) and zinc (less than 0.1 percent). In PV cells, lead is used for the leads from the cell to the electrical load, and is not an integral part of the cell, and zinc is used for the back contact layer. About 35 percent of the semiconductor wastes were discharged as dilute acid solutions to sewage treatment plants or to publicly-owned treatment works (POTWs), and 37 percent were sent to offsite treatment facilities. About 27 percent of the wastes were released to the atmosphere. Wastes discharged directly to surface water represented only 0.8 percent of the total, while discharges to landfills were 0.015 percent (Gilles and Loehr, 1994). The disposal of wastes primarily to POTWs and air is similar to the present practice in the PV industry, as discussed later in this section.
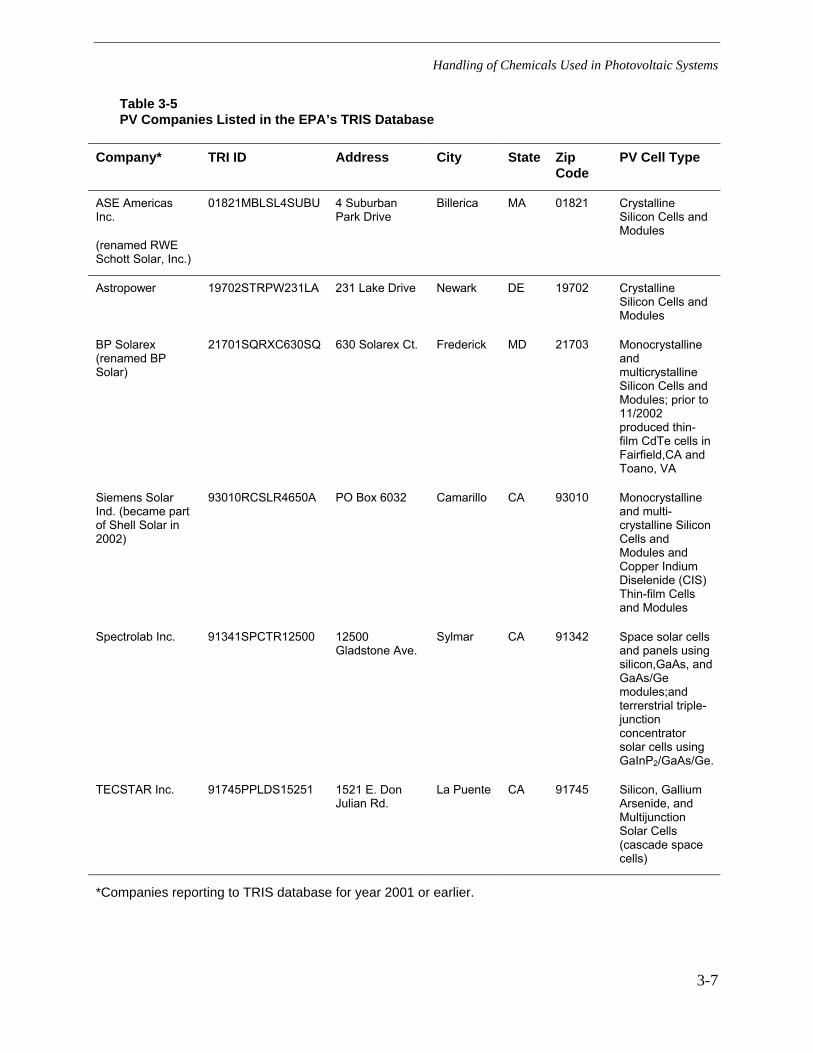
Chemicals Disposed by Photovoltaic Manufacturing Facilities
Based on a review of the chemical information reported in the U.S. EPA’s Toxics Release Inventory System (TRIS) database for six photovoltaic companies producing solar cells, it appears that most of the chemicals used by the manufacturing companies are not released in reportable quantities. The TRIS database was set up under Section 313 of the Emergency Planning and Community Right-to-Know Act (EPCRA) of 1986 and Section 6607 of the Pollution Prevention Act of 1990. Table 3-5 lists the photovoltaic facilities reviewed from the TRIS database that reported for year 2001 or earlier. As seen in Figure 3-1, there are a number of threshold requirements that must be met before facilities are required to report to TRIS. In addition, small quantities of chemicals are considered “de minimus” and do not need to be reported. These quantities are less than 1 percent for most chemicals, but 0.1 percent for those classified as OSHA-defined carcinogens (US EPA, 1999). It is estimated that only about 25% of the chemicals are disposed in reportable quantities: 25,000 pounds/year of manufactured or processed chemicals on the EPCRA Section 313 list or 10,000 pounds/year of “otherwise-used” chemicals. Many of the chemicals used by the PV industry qualify as “otherwise-used” chemicals, such as etching and cleaning solutions (U.S. EPA,1999). The TRIS database tracks whether chemicals were released to air or surface water, sent to land disposal sites or underground injection facilities, or treated in on-site or off-site facilities (Figure 3-2). The photovoltaic facilities reviewed had air emissions, and some chemicals were sent for off-site disposal or treatment. There were no discharges of chemicals directly into streams or other bodies of water for any of the six photovoltaic facilities reviewed.
Air Emissions
The releases of chemicals to the air from the photovoltaic facilities were reported as both air stack emissions and fugitive air emissions. All six of the photovoltaic companies reviewed reported air stack emissions of some compounds used for cleaning and etching. The chemicals released in the largest quantities in air stack emissions included 1,1,1-trichloroethane, acetone, ammonia, isopropyl alcohol, and methanol (Table 3-6). These chemicals are also used in large
3-5

Handling of Chemicals Used in Photovoltaic Systems
Table 3-4 Total Chemical Releases for 1987-1990: California Semiconductor Industry (after Gilles and Loehr, 1994)
Chemical Total Releases (tons) Percent of Total
*1,1,1-Trichloroethane 447 6.9
1,1,2-Trichloroethane 7.5 0.12
1,2,4-Trichlorobenzene 7.9 0.12
1,2-Dichlorobenzene 125 1.9
2-Ethoxyethanol 6.6 0.1
*Acetone 813 12.5
*Ammonia 260 4
Ammonium nitrate solution 202 3.1
Ammonium sulfate solution 227 3.5
*Dichloromethane 5.4 <0.1
Ethylene glycol 101 1.5
*Freon 113 529 8.2
Glycol ethers 238 3.7
*Hydrochloric acid 290 4.5
*Hydrogen fluoride 263 4
*Isopropyl alcohol 216 3.3
Lead 12 0.19
Lead compounds 23 0.35
*Methanol 211 3.3
Methyl ethyl ketone 117 1.8
Nickel compound 211 3.3
*Nitric acid 317 4.9
Phenol 97 1.5
*Phosphoric acid 121 1.9
*Sulfuric acid 1220 18.8
Tetrachloroethylene 108 1.7
Toluene 7 0.11
Xylene (mixed isomers) 308 4.7
*Zinc compound 3.4 <0.1
Total 6492 100
Only total releases of 1.0 ton or more are included.
*Indicates chemical that is known to be used in the manufacturing of photovoltaic cells.
Adapted from Draft Report (1992) - Toxic Release Inventory
Experience of the California-based Semiconductor Industry 1987-1990.
3-6
Handling of Chemicals Used in Photovoltaic Systems
Table 3-5 PV Companies Listed in the EPA’s TRIS Database
Company* TRI ID Address City State Zip Code
PV Cell Type
ASE Americas Inc.
(renamed RWE Schott Solar, Inc.)
01821MBLSL4SUBU 4 Suburban Park Drive
Billerica MA 01821 Crystalline Silicon Cells and Modules
Astropower 19702STRPW231LA 231 Lake Drive Newark DE 19702 Crystalline Silicon Cells and Modules
BP Solarex (renamed BP Solar)
21701SQRXC630SQ 630 Solarex Ct. Frederick MD 21703 Monocrystalline and multicrystalline Silicon Cells and Modules; prior to 11/2002 produced thin-film CdTe cells in Fairfield,CA and Toano, VA
Siemens Solar Ind. (became part of Shell Solar in 2002)
93010RCSLR4650A PO Box 6032 Camarillo CA 93010 Monocrystalline and multi-crystalline Silicon Cells and Modules and Copper Indium Diselenide (CIS) Thin-film Cells and Modules
Spectrolab Inc. 91341SPCTR12500 12500 Gladstone Ave.
Sylmar CA 91342 Space solar cells and panels using silicon,GaAs, and GaAs/Ge modules;and terrerstrial triple-junction concentrator solar cells using GaInP2/GaAs/Ge.
TECSTAR Inc. 91745PPLDS15251 1521 E. Don Julian Rd.
La Puente CA 91745 Silicon, Gallium Arsenide, and Multijunction Solar Cells (cascade space cells)
*Companies reporting to TRIS database for year 2001 or earlier.
3-7

Handling of Chemicals Used in Photovoltaic Systems
Figure 3-1 EPCRA Section 313 Reporting Decision Diagram.
3-8

Handling of Chemicals Used in Photovoltaic Systems
Figure 3-2 Release and Other Waste Management Activity Calculation Approach.
3-9

Handling of Chemicals Used in Photovoltaic Systems
Table 3-6 Chemicals Released in Air Stack Emissions by PV Companies Listed in the TRIS Database
Company and Year
1,1,1-Trichloroethane Acetone Aluminum Ammonia
HydrochloricAcid
HydrogenFluoride
IsopropylAlcohol
Lead Compounds Methanol
Nitric Acid
N-Methyl-2- Pyrrolidone
Sodium Hydroxide
Sulfuric Acid
Trichloro-ethylene
ASE Americas Inc.
1990 -
- - - - - - - - 40 - - - -
1991 - - - - - - - - - 55 - - - -
1992 - - - - - - - - - 56 - - - -
1993 - - - - - - - - - 53 - - - -
1994 - - - - - - - - - 75 - - - -
1995 - - - - - 72 - - - 357 - - - -
1996 - - - - - 220 - - - 988 - - - -
1997 - - - - - 44 - - - 186 - - - -
1998 - - - - - 87 - - - 221 - - - -
1999 - - - - - 87 - - - 110 - - - -
2000 - - - - - 1466 - - - 446 - - - -
2001 - - - - - 890 - - - 214 - - - -
Astropower
2001 - - - - - - - 0.63 - - - - - -
BP Solarex
1990 - - - - 27 - - - - - - - - -
1991 - - 250 - 250 5 - - - - - - - -
1992 - - 250 - 250 - - - - - - - - -
1993 - - - - 250 - - - - - - - - -
1994 - - - - 250 - - - - - - - 5 -
1995 - - - - - - - - - - - - - -
1996 - - - - - - - - - - - - - -
1997 - - - - - - - - - - - - - -
1998 - - - - - - - - - - - - - -
1999 - - - - - - - - - - - - - -
2000 - - - - - - - - - - - - - -
2001 - - - - - 20 - - - - - - - -
Siemens Solar Industries
1987 34657 - - - - - - - - - - 250 - -
1988 25050 - - - - - - - - - - 250 - -
1989 17086 - - - - - - - - - - - - -
1990 2390 - - - - - - - - - - - - -
1991 2000 - - - - - - - - - - - - -
1992 - - - - - - - - - - - - - -
1993 No compounds reported in 1993 or 1994 - - - - - - -
Spectrolab Inc.
1987 - - - 0 0 - - - - - - - - -
3-10

Handling of Chemicals Used in Photovoltaic Systems
Table 3-6 (continued) Chemicals Released in Air Stack Emissions by PV Companies Listed in the TRIS Database
Company and Year
1,1,1-Trichloroethane Acetone
-
Aluminum AmmoniaHydrogenFluoride
IsopropylAlcohol
Lead Compounds Methanol
Nitric Acid
Sodium Hydroxide
SulfuricAcid
Trichloro-ethylene
Spectrolab, Inc continued
1988 8800 8000 - 0 0 - - - - - - -
250 750 - 0 - - - - 0 - - -
1990 250 - - - - - - - - - -
1991 1629 283 - - - -
Hydro-chloric
Acid N-Methyl-2- Pyrrolidone
0 0
1989 0 -
250 - -
- - - - - - - -
1992 1051 - - - - - - - - - -
1993 - 431 - - - - - - - - - -
1994 - - - 1700 258 - - - 92 - - -
1995 - - 1700 - - - - - - - -
1996 - - 2193 - - - - - - - - -
1997 - - - 1277 668 - - - - - - -
1998 - - 250 - - - - 250 250 - -
1999 - - 33 - - - - - 66 - - -
2000 - - - -
1743 - -
- -
50 -
- - -
- -
- -
- - -
- -
- - - - - - 42 - - -
2001 - - 250 - - - - - 40 - - -
1987 - 13000 - 250 250 - - 250 - - 250 250
1988 9330 - - - - - - - - - 250
1989 11400 66700 - 250 250 13800 - 250 - - 250 250
1990 - 7259 - - 250 - - - 250 - 5 250
1991 7932 - - - - - - - - - 250
1992 - 8249
- -
TECSTAR Inc.
- -
- - 250
- 13450
- -
- - 250
- - - - - - - - - - - 250
1993 - 2946 - 5 - - - - - - - - 250 250
1994 - - 5 - - - - - - - - 250 250
1995 - - - 5 - - - - - - - - - 250
1996 - - - - - - - - - - - - 250 250
The values listed are in pounds.
Dash indicates compound not reported.
3-11
Handling of Chemicals Used in Photovoltaic Systems
quantities by the semiconductor industry in general. Some chemicals (e.g., trichloroethylene) were reported for only one facility. Four out of the six photovoltaic companies with reported data provided estimates of fugitive air emissions. Chemicals released in fugitive air emissions included 1,1,1-trichloroethane, acetone, ammonia, dichloromethane, freon 113, hydrochloric acid, isopropyl alcohol, lead, methanol, sulfuric acid, and trichloroethylene (Table 3-7). The metals used in the thin-film semiconductors were not released to the air in reportable quantities, with two exceptions: aluminum at only one facility in 1991 and 1992 and lead at one facility. Release of aluminum to the air would not be expected from current PV manufacturing operations. Lead is used for the electrical contacts and not the PV cell itself.
Off-Site Treatment
A variety of off-site treatment methods are utilized to manage the chemicals produced by photovoltaic facilities. The types of treatment facilities used include POTWs, metals recovery systems, solvents/organics recovery systems, and energy recovery systems. A summary of the off-site treatment types utilized and the quantity of waste materials sent to these off-site treatment facilities is given in Table 3-8.
Four out of the six photovoltaic companies reviewed sent waste chemicals to POTWs. The types of waste materials sent to the POTWs included acetone, ammonia, nitrate compounds, lead, hydrochloric acid, hydrogen fluoride, nitric acid, sulfuric acid, and sodium hydroxide. Three out of the five photovoltaic companies reviewed sent waste products to companies involved in recovering metals or solvents from waste materials. Aluminum and lead were sent to metals recovery facilities by one facility in 1991 and 1992 and one in 2001. Freon and solvents including 1,1,1-trichloroethane and acetone were recovered from waste solutions. Acetone and n-methyl-2-pyrrolidone from waste materials produced by two of the photovoltaic companies were used in energy recovery systems. Based on the June 1999 U.S. EPA guidance document for the semiconductor industry, acetone does not need to be reported. Because it represents about 10 percent of the wastestream of the PV industry, it has been reported anyway.
Off-Site Disposal
Waste materials produced by photovoltaic facilities were also sent off-site for disposal. Disposal methods listed for these waste materials were landfilling and incineration. One of the six photovoltaic facilities reviewed sent waste materials to landfills for disposal in 1987 and 1988, including hydrochloric acid and sodium hydroxide, possibly as sludge. A different facility sent these same two chemicals to landfills in 2001. No waste materials were sent to landfills from this facility between 1989 and 1994 (Table 3-9). Three out of the six photovoltaic facilities reviewed sent waste materials to incinerators for disposal. The waste products that were incinerated included 1,1,1-trichloroethane, acetone, and ammonia (See Table 3-8). In contrast to landfilling, incineration or other thermal treatment was used as a disposal method for photovoltaic waste products as recently as 1998. Because many of the chemicals used in large quantities are liquids, disposal in landfills is not likely to be the primary disposal option.
3-12

Handling of Chemicals Used in Photovoltaic Systems
Table 3-7 Chemicals Released in Fugitive Air Emissions by PV Companies Listed in the TRIS Database
Company and Year
1,1,1-Trichloroethane Acetone Ammonia Dichloromethane
Freon113
HydrochloricAcid
Isopropyl Alcohol
Lead Compounds Methanol
SulfuricAcid
Trichloro-ethylene
Astropower
2001 - - - - - - 0.11 - - Siemens Solar Industries 1987 - -
- 9718
- - - - - - -1988 13100 - - - - - - - - - -1989 7975 - - - - - - - - - -1990 9570 - - - - - - - - - -1991 9000 - - - 250 250 - - - - -1992 - - - - 250 250 - - - - -1993 - - - - 250 250 - - - - -1994 - - - - 250 250 - - - - -Spectrolab Inc. 1987 -
- - - - - - - - - -1988 250 250 - - - - - - - - -1989 250 250 - 750 - - - - - - -1990 3226
250 - - - - - - - - -
1991 - - - - - - - - - - -1992 - 536 - - - - - - - - -1993 - 46 - - - - - - - - -1994 No chemicals were reported as released in the years from 1994
through 2001 - - - - - -
TECSTAR Inc. 1987
- 250 250 - - - - - - 0 2501988 - 250 250 - - - - - - - 2501989 250 250 250 - - - 250 - 250 0 2501990 - 250 250 - - - - - - - 2501991 - 750 750 - - - - - - 250 2501992 - 750 750 - - - - - - - 2501993 - 250 250 - - - - - - 250 2501994 - - 250 - - - - - - 250 2501995 - - 250 - - - - - - 250 2501996 - - - - - - - - - 250 250The values listed are in pounds. Dash indicates that chemical was not reported. ASE Americas Inc. and BP Solarex reported no fugitive air emissions.
3-13
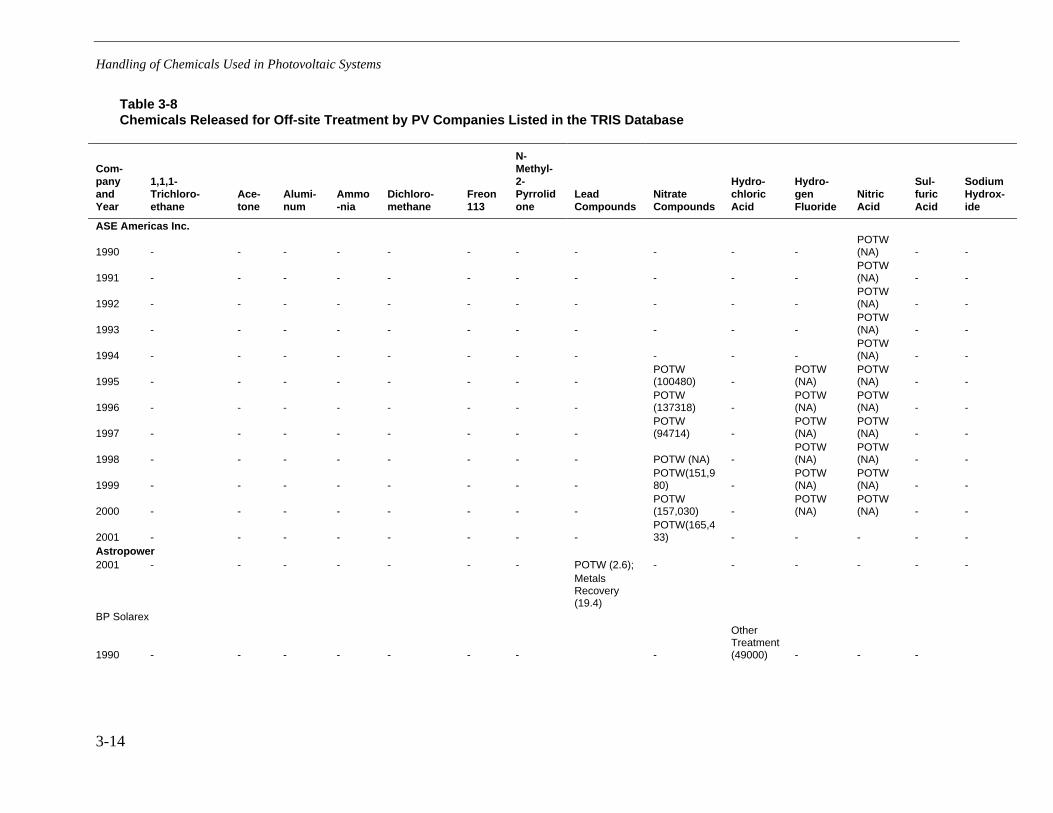
Handling of Chemicals Used in Photovoltaic Systems
Table 3-8 Chemicals Released for Off-site Treatment by PV Companies Listed in the TRIS Database
Com-pany and Year
1,1,1-Trichloro-ethane
Ace-tone
Alumi-num
Ammo-nia
Dichloro-methane
Freon 113
N-Methyl-2-Pyrrolidone
Lead Compounds
Nitrate Compounds
Hydro-chloric Acid
Hydro-gen Fluoride
Nitric Acid
Sul- furic Acid
Sodium Hydrox-ide
ASE Americas Inc.
1990
- - - - - - - - - - -POTW (NA) - -
1991 - - - - - - - - - - -POTW (NA) - -
1992 - - - - - - - - - - -POTW (NA) - -
1993 - - - - - - - - - - -POTW (NA) - -
1994 - - - - - - - - - - -POTW (NA) - -
1995 - - - - - - - -POTW (100480) -
POTW (NA)
POTW (NA) - -
1996 - - - - - - - -POTW (137318) -
POTW (NA)
POTW (NA) - -
1997 - - - - - - - -POTW (94714) -
POTW (NA)
POTW (NA) - -
1998 - - - - - - - - POTW (NA) -POTW (NA)
POTW (NA) - -
1999 - - - - - - - -POTW(151,980) -
POTW (NA)
POTW (NA) - -
2000 - - - - - - - -POTW (157,030) -
POTW (NA)
POTW (NA) - -
2001 - - - - - - - -POTW(165,433) - - - - -
Astropower 2001 - - - - - - - POTW (2.6);
Metals Recovery (19.4)
- - - - - -
BP Solarex
1990 - - - - - - - -
Other Treatment (49000) - - -
3-14
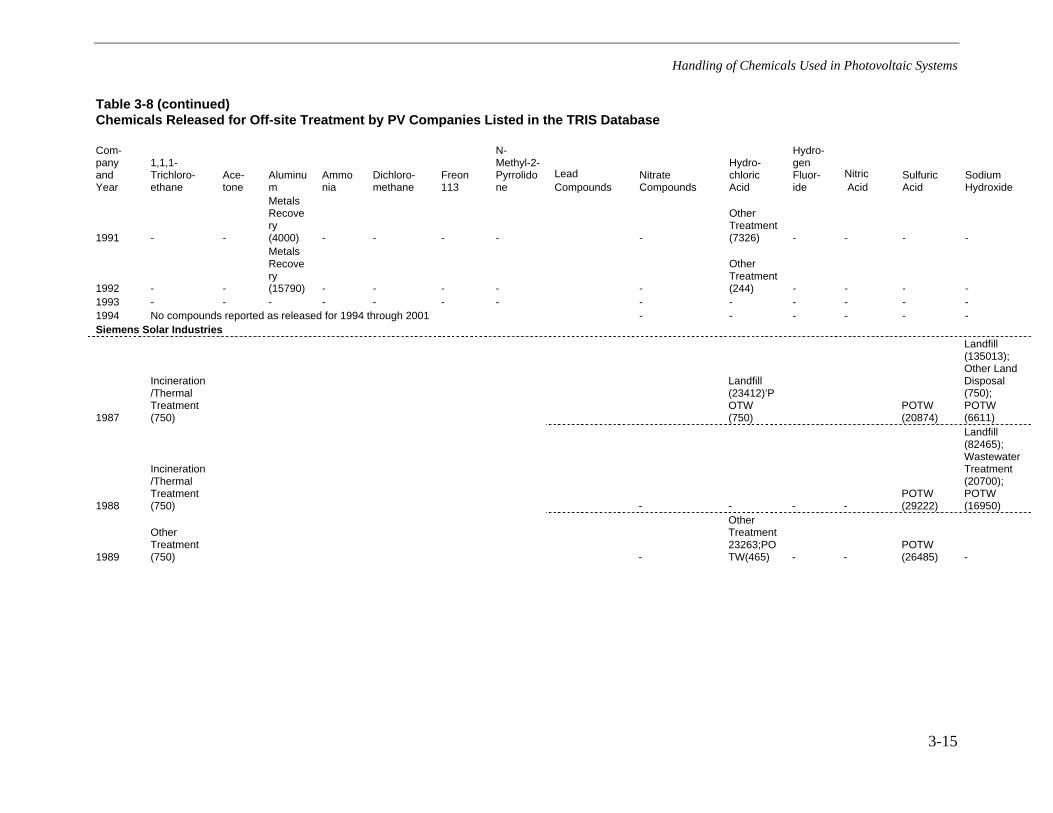
Handling of Chemicals Used in Photovoltaic Systems
Table 3-8 (continued) Chemicals Released for Off-site Treatment by PV Companies Listed in the TRIS Database
Com-pany and Year
1,1,1-Trichloro-ethane
Ace-tone
Aluminum
Ammonia
Dichloro-methane
Freon 113
N-Methyl-2-Pyrrolidone
Lead Compounds
Nitrate Compounds
Hydro-chloric Acid
Hydro-gen Fluor-ide
Nitric Acid
Sulfuric Acid
Sodium Hydroxide
1991
- -
Metals Recovery (4000) - - - - -
Other Treatment (7326) - - - -
1992 - -
Metals Recovery (15790)
- - - - -
Other Treatment (244)
- - - -1993 - - - - - - - - - - - - -1994 No compounds reported as released for 1994 through 2001 - - - - - - Siemens Solar Industries
1987
Incineration/Thermal Treatment (750)
Landfill (23412)’POTW (750)
POTW (20874)
Landfill (135013); Other Land Disposal (750); POTW (6611)
1988
Incineration/Thermal Treatment (750) - - - -
POTW (29222)
Landfill (82465); Wastewater Treatment (20700); POTW (16950)
1989
Other Treatment (750) -
Other Treatment 23263;POTW(465) - -
POTW (26485) -
3-15
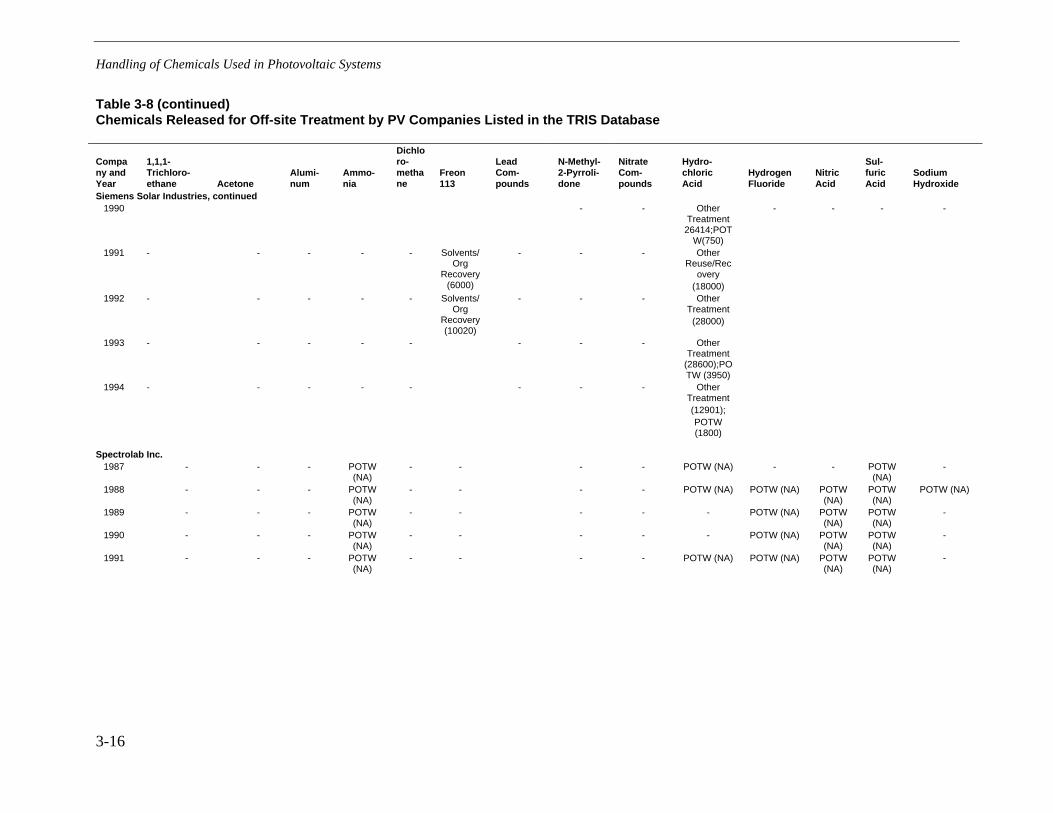
Handling of Chemicals Used in Photovoltaic Systems
Table 3-8 (continued) Chemicals Released for Off-site Treatment by PV Companies Listed in the TRIS Database
Company and Year
1,1,1-Trichloro-ethane Acetone
Alumi-num
Ammo-nia
Dichloro-methane
Freon 113
Lead Com-pounds
N-Methyl-2-Pyrroli-done
Nitrate Com-pounds
Hydro-chloric Acid
Hydrogen Fluoride
Nitric Acid
Sul-furic Acid
Sodium Hydroxide
Siemens Solar Industries, continued
1990
- - OtherTreatment
26414;POTW(750)
- - - -
1991 - - - - - Solvents/Org
Recovery (6000)
- - - OtherReuse/Rec
overy (18000)
1992 - - - - - Solvents/Org
Recovery (10020)
- - - OtherTreatment (28000)
1993 - - - - - - - - OtherTreatment
(28600);POTW (3950)
1994 - - - - - - - - OtherTreatment (12901); POTW (1800)
Spectrolab Inc.
1987 - - - POTW
(NA) - - - - POTW (NA) - - POTW
(NA) -
1988 - - - POTW(NA)
- - - - POTW (NA) POTW (NA) POTW (NA)
POTW (NA)
POTW (NA)
1989 - - - POTW(NA)
- - - - - POTW (NA) POTW(NA)
POTW (NA)
-
1990 - - - POTW(NA)
- - - - - POTW (NA) POTW(NA)
POTW (NA)
-
1991 - - - POTW(NA)
- - - - POTW (NA) POTW (NA) POTW (NA)
POTW (NA)
-
3-16
Handling of Chemicals Used in Photovoltaic Systems
Table 3-8 (continued) Chemicals Released for Off-site Treatment by PV Companies Listed in the TRIS Database
Company and Year
1,1,1-Trichloroethane Acetone Aluminum Ammonia
Dichloro-methane
Freon 113
Lead Compounds
N-Methyl-2-Pyrroli-done
Nitrate Com-pounds
Hydrochloric Acid
Hydro-gen Fluoride
Nitric Acid
Sul-furic Acid
Sodium Hydroxide
1992
Incineration/Thermal(38498)
Incineration/Thermal (23332)
- - - - - - - - - - -
1993 - EnergyRecovery
(8066)
- POTW (NA) - - - - POTW (NA) POTW (NA)
POTW (NA)
POTW (NA)
-
1994 - - - POTW (NA) - - - - POTW (NA) POTW (NA)
POTW (NA)
POTW (NA)
-
1995 - - - - - - - - - - - - -1996 - - - POTW (NA) - - - POTW (NA) - POTW
(24747) - - -
1997 - - - OtherWaste
Treatment (250)
- - - - POTW(24747)
- POTW(37873)
- - -
1998 - - - POTW(NA);
Incineration (250)
- - - POTW(NA)
Energy Recovery (229400)
POTW (37873)
- - - - -
1999 - - - POTW(NA);
Incineration (Fuel
Value250)
- - - POTW(NA)
Energy Recovery (84882)
2000 - - - - - - - POTW(NA)
Energy Recovery (345290)
The value in parentheses is the amount of the given chemical in pounds. Dash indicates that chemical was not reported.
Table 3-8 (continued) Chemicals Released for Off-site Treatment by PV Companies Listed in the TRIS Database
Company 1,1,1-Trichloro-
Acetone Aluminum Ammonia Dichloro- Freon
Lead Com-
N-Methyl-2-Pyrro-
Nitrate Com-
Hydro-chloric
Hydro-gen Nitric
Sul-furic
Sodium Hydrox
3-17
Handling of Chemicals Used in Photovoltaic Systems
and Year ethane methane 113 pounds lidone pounds Acid Fluoride Acid Acid -ide
Spectrolab Inc.
2001
- - - POTW (NA);Incineration/Thermal Treatment (250)
- - - POTW (NA)Energy Recovery (51137)
- - - - - -
TECSTAR Inc.
1987
- OtherTreatment (42600)
- - - - - - - - - - - -
1988 - OtherTreatment (31300)
- POTW (250) - - - - - - - - POTW(250)
-
1989 - - - POTW (250) - - - - - POTW(250)
POTW (250)
POTW (250)
POTW (250)
-
1990 - OtherTreatment (17395)
- POTW (250) - - - - - - - - - -
1991 - Solvents/Org.Recovery (18146); POTW (1000)
- POTW (250) - - - - - - - - POTW(5)
-
1992 - Solvents/Org.Recovery (9449); Incin./ Thermal Treatment (967); POTW (1000)
- POTW (750) - - - - - - - - - -
1993 - Solvents/Org.Recovery (15663); Incin./Thermal Treatment (303); POTW (250)
- POTW (750) - - - - - - - - POTW(250)
-
1994 - - - POTW (750) - - - - - - - - POTW(250)
-
1995 - - - POTW (750)
- - - - - - - - - -1996 - - - - - - - - - - - - - -
The value in parentheses is the amount of the given chemical in pounds. Dash indicates that chemical was not reported
3-18

Handling of Chemicals Used in Photovoltaic Systems
Table 3-9 Chemicals Released for Landfill Disposal by PV Companies Listed in the TRIS Databases
Company and Year
Hydrochloric Acid
Lead Compounds
Sodium Hydroxide
Astropower
2001 18.9
Siemens Solar Industries
1987 23,412 - 136,763
1988 - - 82,465
1989 - - -
1990 - - -
1991 - - -
1992 - - -
1993 - - -
1994 - - -
Values are in pounds. No other companies reported disposal to landfills. Dash indicates that chemical was not reported.
TRIS does not track disposal of the completed products, only specific chemicals. Because the expected life of installed PV systems for power generation is on the order of 30 to 40 years, there is little experience or information on disposal of old systems. Disposal of spent calculators or watch batteries is most likely to municipal landfills. This is unlikely to cause problems due to the small volume and the sealed nature of the products.
Recycling of Photovoltaic Modules
Recycling is thought to be the likely handling method for spent PV modules in the future. Because the expected life of most modules is about 30 years, there is limited experience with large-scale programs. A promising approach that is being used at some major PV manufacturing facilities is called “cradle to cradle”. The intent is to recycle the materials, particularly the toxic materials, into new products. This approach reduces the potential for release of toxic materials into the environment and reduces the quantity of new resources that must be obtained.
Fthenakis (2000) explored the applicability of three different models of recycling used by the nickel-cadmium (NiCd) battery industry, the electronics industry, and the utility industry, first discussed by Reaven et al. (1996). The large-scale power plant installations may be handled in a centralized manner by the owner-utility with the solar panels being sent to a central recycling processor. The costs could be combined into the electric rate paid by power users, similar to the present system for decommissioning of power plants. This type of centralized model is not as practicable for the widely dispersed PV industry. Defective PV systems from manufacturing
3-19

Handling of Chemicals Used in Photovoltaic Systems
plants and used PV modules could be handled by PV manufacturers or by a recycling company set-up by the PV manufacturers in a manner similar to the collection-recycling system for NiCd batteries. Arrangements could be made for retailers to return modules to the recyclers. Options for payment are available (e.g., the manufacturers, an escrow fund from a surcharge on the purchase price, or industry dues to recyclers). The battery industry had more of an impetus to set up a recycling system, because the batteries are classified as hazardous waste based on the Toxicity Characteristic Leaching Procedure (TCLP). The batteries have more cadmium than present PV cells and use Cd oxide and hydroxide, which are more soluble than CdTe. The electronics model could involve an intermediary company that would collect the PV modules, dismantle them, and distribute the usable parts. This model is less applicable to the PV industry, because the valuable materials are in small quantities, and the modules are more difficult to disassemble. For example, indium, the most expensive of the materials used in CIS cells, represents only 2.5 to 5 percent of the total cost of a CIS module (Fthenakis, 2000). Thus, economics alone are unlikely to generate interest in recycling.
Currently, scrap PV modules are recycled by large metal smelters that also recycle electronics and telecommunication equipment. The benefit of using spent PV modules in the smelters is the silica for flux. The estimated cost for recycling of silicon cells is $175–200/ton or about $0.02 per watt for large shipments in 20 ton containers, plus transportation costs of $27–400/ton (Fthenakis, 2000). The estimated cost of recycling CIS modules is $0.08–0.11/watt by smelting, excluding transportation. Recovery of cadmium from CIS modules would require use of a copper and zinc smelter. CdTe cannot be processed in a zinc smelter. A method of recycling CdTe modules has been developed by Solar Cells Inc for an estimated cost of about $0.04–0.05/watt, excluding transportation (Bohland et al., 1998). This method involves disassembly of the module, followed by glass crushing and separation of the metals using a combination of chemical dissolution, mechanical separation, precipitation, and electrodeposition. About 80 percent of the original tellurium is recovered. Another method has been developed by Drinkard Metalox Inc. (DMI) for recycling CdTe and CIS modules for an estimated cost of $0.09/watt (Goozner et al., 1998). The DMI method uses chemical stripping, electrodeposition, precipitation, and evaporation. About 95 percent of the tellurium and 96 percent of the lead is recovered. The metal conducting layer remains attached to the glass substrate, potentially allowing reuse of the substrate. Other companies are developing methods using pyrolysis for removing the usable silicon from cells and even regenerating cells (Bohland et al., 1998).
Research has been conducted on a method of recycling CIS and CdTe modules using electrochemical reactions in a closed loop system (Menezes, 2000). This approach may also lead to better efficiency in the original CIS cells. Recent work has been done using electrochemical reactions to recyle CdS/CdTe modules (Menezes, 2001).
A major reason for developing feasible, cost-effective approaches for recycling PV modules is the scarcity of some of the exotic metals used in the PV cells. The crustal abundance of metals, current reserves, and amount used in selected PV cells are shown in Table 3-10. Germanium and indium have the lowest reserves, followed by tellurium (Andersson et al, 2000). Germanium is added to amorphous-silicon cells to improve conversion efficiency;otherwise amorphous-silicon cells have no material constraints. Production of tellurium at 1998 levels would limit increased production of CdTe cells sooner than for other types of cells, since it is used in greater amounts in the CdTe cells. Tellurium is a by-product of copper mining, while indium, germanium, and cadmium are by-products of zinc mining. A possible source of gallium and germanium is coal
3-20
Handling of Chemicals Used in Photovoltaic Systems
ash (Andersson, 2000). Ruthenium used in the new dye-based cells is a by-product of platinum mining, and is also a scarce metal. Given expected growth of thin-film PV cells, material constraints are not thought to be likely prior to about 2015 (Andersson and Jacobsson, 2000).
Table 3-10 Availability of Selected Metals Used in PV Industry
Technology Metal
Metals Requirementsb (g/m2)
Reserves 1998c (Gg)
Refinery Production 1997 (Mg/yr)
Average Crustal Abundance (ppm)
CdTe Cd 6.3 600 20000 0.1
Te 6.5 20 290 0.005
CIGS Se 4.8 70 2200 0.12
Ga 0.53 110 54 15
In 2.9 2.6 200 0.05
aSiGe Ge 0.44 2 63 1.4
Dye-sensitized Ru 0.1 6 11 0.001
a Source: Andersson 2000, and Andersson and Jacobsson, 2000. b CdTe (2 •m); CIGS (2 •m) and the composition CuIn0.75 Ga0.25 Se2 : a-SiGe (2 •m) layer in double junction aSi/aSiGe cell, atomic Ge:Si ratio is set to 2:3. c Figures on indium and germanium reserves are estimates that do not include all economic deposits.
Waste Minimization
Waste minimization is practiced in the semiconductor industry in general, and is applicable to the PV industry. Methods include reduction of wastewater and rinse water volumes, reuse of rinse water after treatment, switching to less hazardous chemicals when possible, control of spills and leaks, reduction of vapor losses, and selection of processes that use fewer chemicals. Methods such as reuse of rinsewaters are not widely used in the semiconductor industry due to the need for high purity materials. Recycling/reuse of chemicals has been used in semiconductor plants to reduce quantities of hydrofluoric acid, n-methyl pyrrolidone, and solvents. Process changes have been made such as using acid spray cleaning instead of batch processing and switching from hazardous to less toxic chemicals (e.g., copper instead of chromium in etching solutions) (Gilles and Loehr, 1994). Separation of spent solvents by type (e.g., chlorinated and non-chlorinated) has helped increase the amount of solvents that can be recycled, and has made reprocessing of solvents more feasible.
Additional research is being conducted, for example research on reducing the amount of cadmium used in the manufacturing process for CdS thin films, which are used in CdS/CdTe modules and CIS cells. By varying the solution composition and temperature, up to ten times less than the typical concentration of cadmium can be used in the chemical bath deposition process (Bayer, et al., 2000). Better methods for separating the glass from the remaining metal
3-21
Handling of Chemicals Used in Photovoltaic Systems
components of the PV cells are being developed by the U.S. DOE. These methods have the potential for reducing the amount of waste by three orders of magnitude (Fthenakis, 2000).
3-22
4 POTENTIAL HEALTH AND ENVIRONMENTAL CONCERNS
Introduction
The photovoltaic industry uses a variety of chemicals, some of which can be toxic to humans and biota. This chapter discusses the relative toxicity of the chemicals, in particular those that have been identified as animal or human carcinogens. The potential for health effects is not solely a function of toxicity, however. For there to be a realistic risk to humans, the following conditions must be met:
• The compound must exhibit toxicity or carcinogenicity
• The concentration must be high enough to be a concern in a given media
• A receptor must be in the vicinity of where the compound is used
• There must be a complete exposure pathway from the compound to a receptor
• The actual exposure or dose must constitute a risk or hazard to the receptor.
Risk assessments typically construct conceptual models of the possible pathways from a facility to determine whether complete pathways for exposure to nearby receptors exist. A complete pathway indicates that exposure could possibly occur; it does not mean that exposure has occurred or would actually occur. For example, a conceptual risk model for a hypothetical photovoltaic manufacturing facility would show that the primary receptors of concern are the plant workers. The most likely exposure route for workers is inhalation of vapors or dusts and secondarily via direct contact if spills occur. A minor pathway would be incidental ingestion. Receptors outside a manufacturing facility could be exposed to the chemicals via inhalation from stack emissions or fugitive air emissions or from an accidental release after a fire or explosion. Because the chemicals would be dispersed in the ambient air, the exposure of nearby residents or exposure of other workers would be less than the plant workers. A conceptual model for a hypothetical photovoltaic installation on a commercial building would show that the primary receptors of concern are either the workers inside the building or nearby residents/workers. The most likely exposure route for both receptor groups is via inhalation, but only if a leak or fire occurs, both of which are unlikely. At a hypothetical photovoltaic installation on a residential dwelling, the most likely route of exposure is also via inhalation if a leak or fire occurs. At a hypothetical landfill containing spent photovoltaic modules, there are more possible pathways. For example, groundwater seepage could reach a drinking water well or river, but in both cases there would be dilution of the waste leachate before the water was used. Any vapor emissions would be diluted by the ambient air before reaching nearby residents.
4-1
Potential Health and Environmental Concerns
Although the more likely route of exposure (inhalation) is similar in the different settings, the list of chemicals present is quite different for a manufacturing facility and a final PV module installation. As discussed in Section 3, manufacturing photovoltaic cells requires large quantities of chemicals such as solvents and acids for cleaning the semiconductor parts, gases for depositing the ultra-thin layers of material, and metals depending on the specific type of PV module being made. Many of these chemicals are highly toxic. The completed module, however, is a solid contained in glass or another sealed container. No solvents or acids are present inside the container, and the metals present would have to be leached out of the solid, broken into particles small enough to be respirable, or released into the air during a fire before there would be any likely route of exposure at a site with installed PV modules.
Potential for Human Health Effects
Relative Toxicity and Carcinogenicity of Photovoltaic Chemicals
Human health effects of the chemicals used to manufacture photovoltaic devices can be divided into two categories: carcinogenic effects and noncarcinogenic effects. Noncarcinogenic effects include effects on specific organs, the reproductive system, the nervous system, or the immune system, as well as more subtle effects such as reduced growth or appetite. A chemical is considered noncarcinogenic if it has not been shown to promote cancerous tumor growth in either humans or animals. Carcinogenic chemicals are those chemicals that have been shown to promote cancerous tumor growth in humans, animals or both. Carcinogenic chemicals may also have other effects on human health.
The noncarcinogenic effects of the chemicals are measured using various toxicity factors developed by U.S. EPA and sometimes state agencies. These factors include oral reference doses, inhalation reference doses, direct contact reference doses, and skin absorption rates. The toxicity of a given chemical often varies depending upon how it was introduced into the body (e.g., orally or via inhalation). This discussion will focus on the use of oral and inhalation reference doses to compare the toxicity of the various compounds used by the photovoltaic industry, as summarized in Table 4-1. The reference dose represents the amount of a chemical that a person can be exposed to via a specific route with no adverse effects. Thus, a chemical with a large reference dose is less toxic than one with a small reference dose. Not all of the substances have been assigned oral and/or inhalation toxicity factors. To determine whether there actually could be effects to a given receptor at a specific facility, a hazard index is calculated. These calculations consider the exposure dose, duration of exposure, route (e.g., inhalation or oral), and situation (e.g., the receptor is an adult worker or a child). The chemical is considered a potential concern if the hazard index exceeds 1 for a given exposure pathway and receptor.
The relative carcinogenicity of the various chemicals is measured using slope factors, with separate factors depending on exposure route. The larger the slope factor, the more carcinogenic the compound. Cancer risks are expressed based on exposure for a lifetime and are expressed as a probability. The U.S. EPA considers a risk higher than one in a million for residential receptors or one in ten thousand for industrial receptors as a potential concern.
4-2
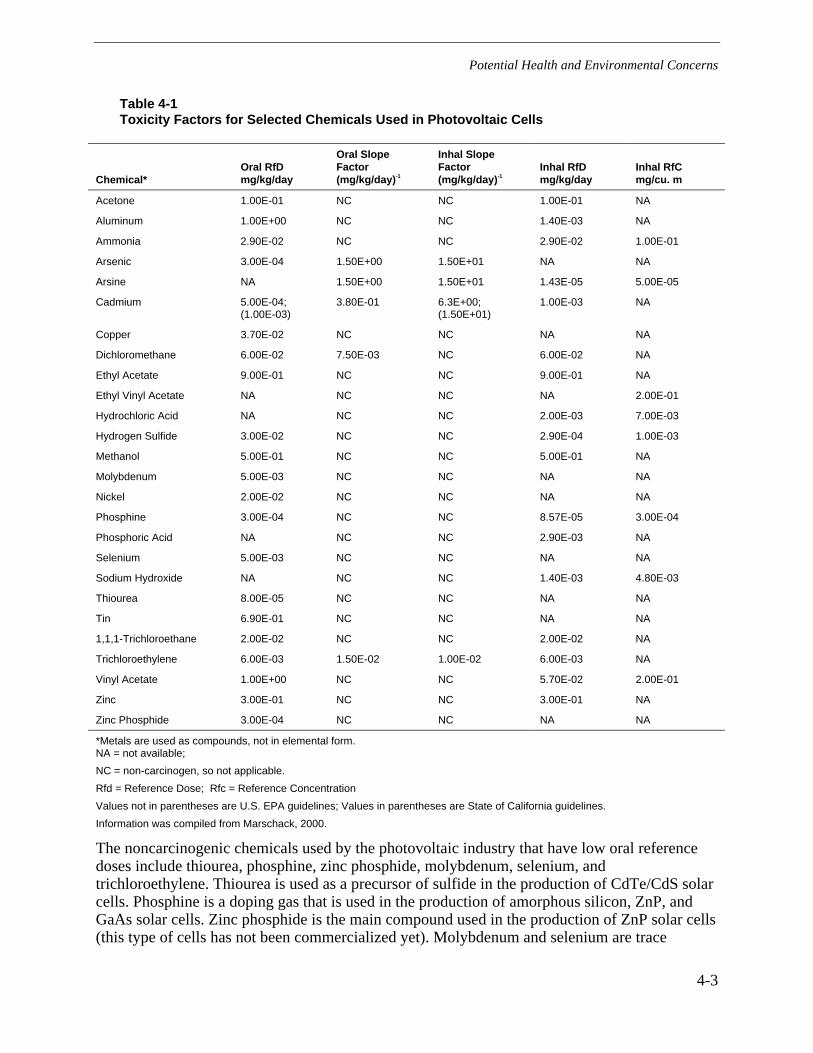
Potential Health and Environmental Concerns
Table 4-1 Toxicity Factors for Selected Chemicals Used in Photovoltaic Cells
Chemical* Oral RfD mg/kg/day
Oral Slope Factor (mg/kg/day)-1
Inhal Slope Factor (mg/kg/day)-1
Inhal RfD mg/kg/day
Inhal RfC mg/cu. m
Acetone 1.00E-01 NC NC 1.00E-01 NA
Aluminum 1.00E+00 NC NC 1.40E-03 NA
Ammonia 2.90E-02 NC NC 2.90E-02 1.00E-01
Arsenic 3.00E-04 1.50E+00 1.50E+01 NA NA
Arsine NA 1.50E+00 1.50E+01 1.43E-05 5.00E-05
Cadmium 5.00E-04; (1.00E-03)
3.80E-01 6.3E+00; (1.50E+01)
1.00E-03 NA
Copper 3.70E-02 NC NC NA NA
Dichloromethane 6.00E-02 7.50E-03 NC 6.00E-02 NA
Ethyl Acetate 9.00E-01 NC NC 9.00E-01 NA
Ethyl Vinyl Acetate NA NC NC NA 2.00E-01
Hydrochloric Acid NA NC NC 2.00E-03 7.00E-03
Hydrogen Sulfide 3.00E-02 NC NC 2.90E-04 1.00E-03
Methanol 5.00E-01 NC NC 5.00E-01 NA
Molybdenum 5.00E-03 NC NC NA NA
Nickel 2.00E-02 NC NC NA NA
Phosphine 3.00E-04 NC NC 8.57E-05 3.00E-04
Phosphoric Acid NA NC NC 2.90E-03 NA
Selenium 5.00E-03 NC NC NA NA
Sodium Hydroxide NA NC NC 1.40E-03 4.80E-03
Thiourea 8.00E-05 NC NC NA NA
Tin 6.90E-01 NC NC NA NA
1,1,1-Trichloroethane 2.00E-02 NC NC 2.00E-02 NA
Trichloroethylene 6.00E-03 1.50E-02 1.00E-02 6.00E-03 NA
Vinyl Acetate 1.00E+00 NC NC 5.70E-02 2.00E-01
Zinc 3.00E-01 NC NC 3.00E-01 NA
Zinc Phosphide 3.00E-04 NC NC NA NA
*Metals are used as compounds, not in elemental form. NA = not available;
NC = non-carcinogen, so not applicable.
Rfd = Reference Dose; Rfc = Reference Concentration
Values not in parentheses are U.S. EPA guidelines; Values in parentheses are State of California guidelines.
Information was compiled from Marschack, 2000.
The noncarcinogenic chemicals used by the photovoltaic industry that have low oral reference doses include thiourea, phosphine, zinc phosphide, molybdenum, selenium, and trichloroethylene. Thiourea is used as a precursor of sulfide in the production of CdTe/CdS solar cells. Phosphine is a doping gas that is used in the production of amorphous silicon, ZnP, and GaAs solar cells. Zinc phosphide is the main compound used in the production of ZnP solar cells (this type of cells has not been commercialized yet). Molybdenum and selenium are trace
4-3
Potential Health and Environmental Concerns
elements that are used in the production of CIS and CIGS solar cells. Trichloroethylene is a solvent used for cleaning purposes in the production of GaAs solar cells. Oral reference doses for these and other chemicals used by the photovoltaic industry can be found in column 2 of Table 4-1.
The noncarcinogenic chemicals used by the photovoltaic industry that have low inhalation reference doses include phosphine, hydrogen sulfide, phosphoric acid, and hydrochloric acid. The photovoltaic technologies that use phosphine were discussed in the previous paragraph. Hydrogen sulfide is a gas that is used in the production of CIS solar cells. Phosphoric acid and hydrochloric acid are primarily used for the cleaning of wafers or to remove impurities from raw semiconductor materials. Phosphoric acid is used in the production of amorphous silicon solar cells but may also be used in the production of other types of solar cells. Hydrochloric acid is used in the production of a variety of solar cells including crystalline silicon, polycrystalline silicon, amorphous silicon, CdS, GaAs and others. Inhalation reference doses for these and other chemicals used by the photovoltaic industry can be found in column 5 of Table 4-1.
Carcinogenic chemicals used by the photovoltaic industry include arsenic, arsine, cadmium, dichloromethane, and trichloroethylene. All five of the carcinogenic chemicals listed have established oral slope factors. Four out of the five carcinogenic chemicals also have established inhalation slope factors. Dichloromethane is the only carcinogenic chemical that does not have an established inhalation slope factor. For both oral ingestion and inhalation, arsenic, arsine, and cadmium are the chemicals with the highest carcinogenicity. All three of these chemicals are more carcinogenic through inhalation than oral ingestion. The oral and inhalation slope factors for the carcinogenic chemicals are listed in columns 3 and 4 of Table 4-1.
The carcinogenic chemicals listed above have other effects on human health that are not associated with increased cancer risks. Arsenic, cadmium, dichloromethane, and trichloroethylene have established oral reference doses. Based on the oral reference dose values for these four chemicals, arsenic is the most toxic chemical through oral ingestion, although the time of exposure and concentration of the chemicals is also important in determining the actual hazard index. Arsine, cadmium, dichloromethane, and trichloroethylene have established inhalation reference doses. Out of these four chemicals, arsine is the most toxic via the inhalation exposure route. The oral and inhalation reference dose values for the carcinogenic chemicals are listed in columns 2 and 5 of Table 4-1.
The use of the various carcinogenic compounds varies among the different photovoltaic technologies. Cadmium compounds are used for the production of various thin-film solar cells. CdTe and CdS are used in the production of CdTe/CdS cells. CdS is used in CIS and CIGS solar cells and in newer types under development using Cu2S/CdS (Patterson et al., 1994). Some technologies for producing CIS and CIGS cells can substitute another heterojunction material for the cadmium sulfide layer present on the top of the thin-film CIS and CIGS cells to improve energy efficiency (Goetzberger and Hebling, 2000).
Arsine is a doping gas that is used in the production of polycrystalline silicon cells and gallium arsenide solar cells (Fthenakis and Moskowitz, 1995 and 1997). Gases are used to produce the thin layers of metals, but are not present in the final modules. Arsenic is a metalloid that is used to produce gallium arsenide crystals used in GaAs solar cells, which are used for space applications. Trichloroethylene and dichloromethane are solvents that are used primarily for
4-4
Potential Health and Environmental Concerns
cleaning purposes. These types of solvents may be used in the production of several different types of photovoltaic modules.
Chemicals with Drinking Water Standards
The photovoltaic chemicals with established drinking water standards are listed in Table 4-2. Both the California and EPA drinking water standards are included in this table. The standards listed for drinking water are the primary and secondary maximum contaminant levels (MCLs). Primary MCLs are derived from health-based criteria using a one-in-a-million incremental cancer risk for carcinogens and threshold toxicity levels for noncarcinogens. Secondary MCLs are derived from human welfare considerations that include taste, odor, and laundry staining. The specific MCLs can take economic costs of treatment into account. As can be seen from the table, most photovoltaic chemicals do not have established drinking water standards. The primary chemicals used by the PV industry that have established drinking water standards are arsenic, cadmium, copper, zinc, and solvents.
Chemicals with Air-Related Exposure Levels
The relative toxicity and allowable exposure limits for air exposures vary greatly among the different chemicals used in the production of photovoltaic devices. Table 4-3 lists the threshold limit values (TLV), immediately dangerous to life or health concentrations (IDLH), short-term exposure levels (STEL), and permissible exposure limits (PEL) for a variety of chemicals used by the photovoltaic industry. These exposure limits were developed by various government agencies to protect worker health in manufacturing facilities. The PEL and TLV values focus on worker exposure during the daily workday or workweek, and the IDLH and STEL values focus on short-term exposures to chemicals. The chemicals of most concern for short-term exposure are the gases such as hydrogen selenide, hydrogen, and arsine. Cadmium dust fumes also have low allowable exposure limits.
4-5

Potential Health and Environmental Concerns
Table 4-2 Drinking Water Standards for Photovoltaic Chemicals
Drinking Water Criteria (µg/L) Chemical CA Primary MCL CA Secondary MCL EPA Primary MCL EPA Secondary MCL Acetone - - - - Aluminum 1000 200 - 50 to 200 Ammonia - - - - Ammonium chloride - - - - Ammonium fluoroborate - - - - Arsenic 50 - 50/10* - Arsine - - - - Boron trichloride - - - - Cadmium and compounds 5 - 5 - Copper and compounds 1300** 1000 1300** 1000 Diborane - - - - Dichloromethane 5 - 5 - Ethyl acetate - - - - Ethyl vinyl acetate - - - - Gallium - - - - Germane - - - - Germanium - - - - Germanium tetrafluoride - - - - Hydrochloric acid - - - - Hydrogen selenide - - - - Hydrogen sulfide - - - - Indium - - - - Isopropyl alcohol - - - - Methanol - - - - Molybdenum - - - - Nickel 100 - - - Nitric acid - - - - Phosphine - - - - Phosphoric acid - - - - Phosphorus oxychloride - - - - Phosphorus trichloride - - - - Selenium 50 - 50 - Silane - - - - Silicon nitride - - - - Silicon tetrafluoride - - - - Silver and compounds - 100 - 100 Sodium chloride - - - - Sodium hydroxide - - - - Sulfuric acid - - - - Tantalum pentoxide - - - - Tellurium - - - - Thiourea - - - - Tin - - - - Titanium tetrachloride - - - - 1,1,1-Trichloroethane 200 - 200 - Trichloroethylene 5 - 5 - Trichlorosilane - - - - Triethyl gallium - - - - Trimethyl gallium - - - - Trimethyl indium - - - - Trimethyl zinc - - - - Vinyl acetate - - - - Zinc - 5000 - 5000 Zinc fluoroborate - - - - Zinc phosphide - - - -
*The second value listed is a proposed drinking water standard. **MCL includes this "Action Level" to be exceeded in no more than 10% of samples at the tap. Reference: Marshack, 2000.
4-6

Potential Health and Environmental Concerns
Table 4-3 Summary of Air Exposure Limits for Selected Photovoltaic Chemicals
Chemical TLV* IDLH* STEL* PEL*
Arsine 0.05 ppm 6 ppm NA NA
Cadmium 0.05 40 NA 0.005 ppm
Chlorosilanes NA 8000 ppm NA 5 ppm
Copper 1 dust; 0.2 fume NA NA 1 dust; 0.1 fume
Diborane 0.1 ppm 40 ppm 0.1 ppm 0.1 ppm
Ethyl Acetate 400 ppm NA NA NA
Germane 0.64; 0.2 ppm NA NA NA
Germanium Tetrafluoride 0.6; 0.2 ppm NA 1.9; 0.6 ppm NA
Hydrogen Fluoride 2.5; 3 ppm 30 ppm 5; 6ppm 2.5; 3 ppm
Hydrogen Selenide 0.16; 0.05 ppm 2 ppm NA 0.16; 0.05 ppm
Hydrogen Sulfide 10 ppm 300 ppm 15 ppm 10 ppm
Indium 0.1 NA NA 0.1
Phosphine 0.3 ppm 200 ppm 1 ppm NA
Selenium 0.2 NA 0.2 0.2
Silane 5 NA NA NA
Tantalum NA NA NA 5 ppm
Tellurium 0.1 NA NA 0.1
Thallium 0.1 (skin) NA NA NA
Tin 2; 0.1 (org cmpd) NA NA NA
Trichloroethylene NA 1000 ppm NA NA
Vinyl Acetate 10 ppm NA NA NA
Zinc 10 dust; 5 fume NA NA NA *Units are mg/m3. unless noted. NA means not available. References: Partain et al., 1987; Wolfson and Vernon, 1987; Fthenakis et al., 1987; Moskowitz et al., 1987; Kalb and Moskowitz, 1989; Moskowitz and Fthenakis, 1991; Moskowitz, 1992 and 1995; Fthenakis and Moskowitz, 1995, 1997, and 2000; Fthenakis et al., 1999; Ullmann, 1999. TLV - Threshold limit value is the recommended maximum time-weighted average concentration for exposures during an 8 hr working day or a 40 hr working week. IDLH - The immediately dangerous to life or health concentration is defined by the National Institute for Occupational Safety and Health (NIOSH) as the maximum concentration from which one could escape within 30 minutes without any escape-impairing symptoms or any irreversible health effects. STEL - The threshold limit value, short term exposure level is defined by the American Conference of Governmental Industrial Hygienists (ACGIH) as the maximum concentration to which workers can be exposed for a period up to 15 minutes, provided not more than four excursions per day are permitted with at least 60 minutes between exposure periods and provided that daily PEL is not also exceeded. PEL - The permissible exposure limit is defined by OSHA as the time-weighted average threshold concentration above which workers must not be exposed during work-shifts (8 hr/day, 40 hr/week).
4-7
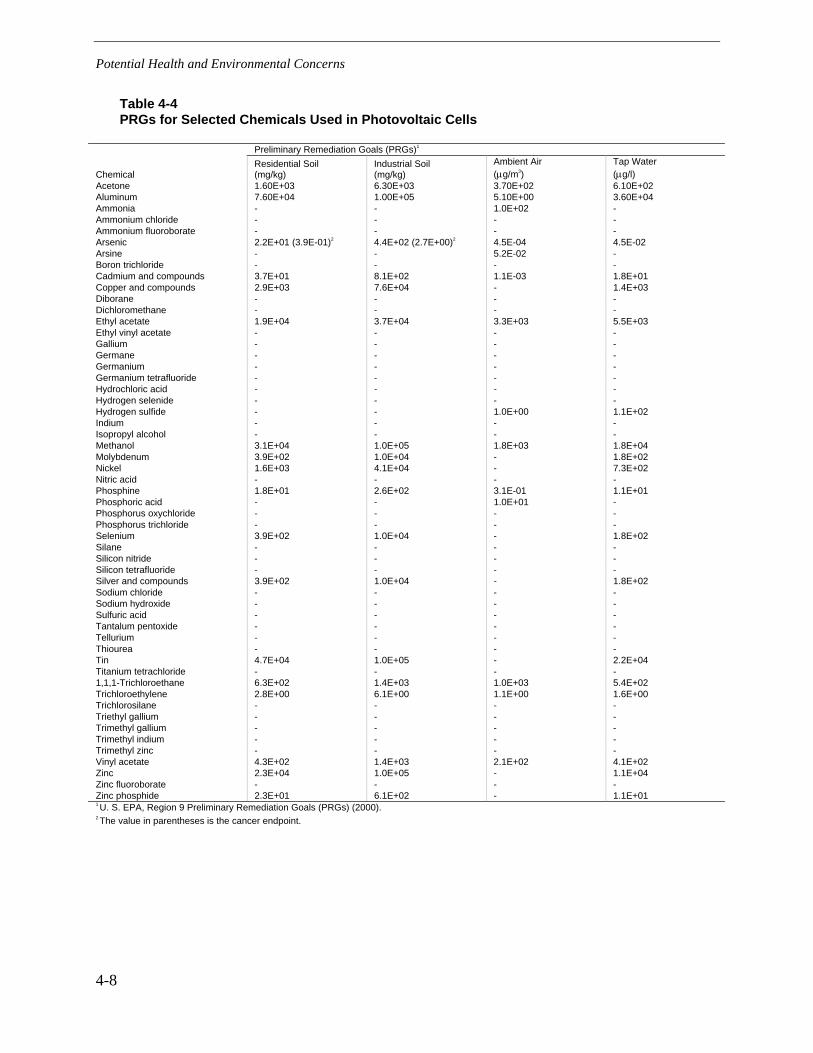
Potential Health and Environmental Concerns
Table 4-4 PRGs for Selected Chemicals Used in Photovoltaic Cells
Preliminary Remediation Goals (PRGs)1
Chemical Residential Soil (mg/kg)
Industrial Soil (mg/kg)
Ambient Air (µg/m3)
Tap Water (µg/l)
Acetone 1.60E+03 6.30E+03 3.70E+02 6.10E+02 Aluminum 7.60E+04 1.00E+05 5.10E+00 3.60E+04 Ammonia - - 1.0E+02 - Ammonium chloride - - - - Ammonium fluoroborate - - - - Arsenic 2.2E+01 (3.9E-01)2 4.4E+02 (2.7E+00)2 4.5E-04 4.5E-02 Arsine - - 5.2E-02 - Boron trichloride - - - - Cadmium and compounds 3.7E+01 8.1E+02 1.1E-03 1.8E+01 Copper and compounds 2.9E+03 7.6E+04 - 1.4E+03 Diborane - - - - Dichloromethane - - - - Ethyl acetate 1.9E+04 3.7E+04 3.3E+03 5.5E+03 Ethyl vinyl acetate - - - - Gallium - - - - Germane - - - - Germanium - - - - Germanium tetrafluoride - - - - Hydrochloric acid - - - - Hydrogen selenide - - - - Hydrogen sulfide - - 1.0E+00 1.1E+02 Indium - - - - Isopropyl alcohol - - - - Methanol 3.1E+04 1.0E+05 1.8E+03 1.8E+04 Molybdenum 3.9E+02 1.0E+04 - 1.8E+02 Nickel 1.6E+03 4.1E+04 - 7.3E+02 Nitric acid - - - - Phosphine 1.8E+01 2.6E+02 3.1E-01 1.1E+01 Phosphoric acid - - 1.0E+01 - Phosphorus oxychloride - - - - Phosphorus trichloride - - - - Selenium 3.9E+02 1.0E+04 - 1.8E+02 Silane - - - - Silicon nitride - - - - Silicon tetrafluoride - - - - Silver and compounds 3.9E+02 1.0E+04 - 1.8E+02 Sodium chloride - - - - Sodium hydroxide - - - - Sulfuric acid - - - - Tantalum pentoxide - - - - Tellurium - - - - Thiourea - - - - Tin 4.7E+04 1.0E+05 - 2.2E+04 Titanium tetrachloride - - - - 1,1,1-Trichloroethane 6.3E+02 1.4E+03 1.0E+03 5.4E+02 Trichloroethylene 2.8E+00 6.1E+00 1.1E+00 1.6E+00 Trichlorosilane - - - - Triethyl gallium - - - - Trimethyl gallium - - - - Trimethyl indium - - - - Trimethyl zinc - - - - Vinyl acetate 4.3E+02 1.4E+03 2.1E+02 4.1E+02 Zinc 2.3E+04 1.0E+05 - 1.1E+04 Zinc fluoroborate - - - - Zinc phosphide 2.3E+01 6.1E+02 - 1.1E+01 1 U. S. EPA, Region 9 Preliminary Remediation Goals (PRGs) (2000). 2 The value in parentheses is the cancer endpoint.
4-8
Potential Health and Environmental Concerns
Preliminary Remediation Goals for Chemicals Used in the PV Industry
Table 4-4 lists preliminary remediation goals (PRGs) for the identified chemicals used by the photovoltaic industry. PRGs provide a useful screening tool to identify chemicals that could be of concern and the media where the concentrations should be evaluated. PRGs are also used for evaluating whether contaminated sites need to be remediated. They are risk-based concentrations derived from standardized equations, combining exposure information assumptions and toxicity data (U.S. EPA, 2000). The remediation goals listed in the table include those established for residential soil, industrial soil, ambient air, and tap water. Only about a third of the chemicals used by the photovoltaic industry have established PRGs. The chemicals with PRGs include most of the heavy metals (e.g, arsenic, cadmium, copper, zinc), solvents, and some of the gases. The chemicals of potential concern are arsenic, cadmium, phosphine, and trichloroethylene. As discussed below, the potential for exposure to arsenic, phosphine and trichloroethylene is at manufacturing facilities, not at completed installations. The potential for exposure to cadmium compounds is small at completed installations.
Potential for Human Health Risks Associated with PV Devices
The production of photovoltaic devices can involve the use of some toxic and explosive gases, corrosive liquids, and suspected carcinogenic compounds. The magnitude of potential effects will vary based on the materials’ toxicological properties, and the intensity, frequency, and duration of human exposure (Fthenakis and Moskowitz, 2000). The potential for human exposure to these materials can occur during the manufacturing process, from the leaching of cracked or broken modules, or from the combustion of modules.
The greatest possibility of human health risks associated with photovoltaic devices is related to manufacturing, rather than installation, of these devices. Because of the higher risks of worker exposure, extensive work has been conducted on methods to reduce the hazards to manufacturing plant workers (Moskowitz, 1995). Worker safety is also regulated by the federal Occupational Safety and Health Administration (OSHA) and similar state agencies. OSHA sets standards for allowable chemical concentrations that workers can be exposed to over an 8-hour work day, in addition to the maximum allowable concentrations without personal protective equipment.
Potential for Effects at Manufacturing Facilities
Short-term exposures to highly toxic substances used in the photovoltaic industry would primarily be associated with the accidental release of toxic gases. This type of accidental release may present health risks to both workers and the general public. The production of photovoltaic devices can involve the use of a number of gases including silane, arsine, phosphine, hydrogen sulfide, and hydrogen selenide. Due to the toxic and explosive nature of these gases, the possible dangers to health from these gases can be both physical (explosions) and biological (inhalation of gases) (Moskowitz, 1995).
Accidental releases of toxic gases are likely to be contained within the manufacturing plant, therefore, plant workers would be at the highest risk for exposure to toxic gases. However, the
4-9
Potential Health and Environmental Concerns
general public living in the vicinity of the plant may be at risk from a catastrophic release of toxic gases (e.g., a large explosion at the manufacturing facility). The likelihood of such a catastrophic release of gas is extremely remote, and at the present time, no catastrophic releases of toxic gases from photovoltaic manufacturing facilities are known to have occurred. Also, any toxic gas released from the plant would be diluted by atmospheric dispersion processes and would not likely present a significant risk to public health (Moskowitz, 1995).
In the manufacturing plant, the release of gases may be associated with the storage, distribution, use, and disposal of these gases (Fthenakis and Moskowitz, 1987). Typically, accidental releases of toxic gases can be caused by either human error or equipment failure. The mishandling of pressurized gas containers, inadequate purging of gas manifolds, and the cross-threading of valves on gas containers are common human errors that can lead to gas leaks. However, several prevention and control options exist to prevent or minimize leaks (Fthenakis, 1998). The existence of these prevention and safety systems to detect leaks and the fact that releases are likely to occur outside of occupied work space greatly reduces the human health risks associated with the use of toxic gases.
The exposure to low levels of toxic materials used by the photovoltaic industry over long periods of time may present potential health risks to both workers and the general public. In production facilities, workers may be directly exposed to hazardous compounds through the air they breathe, from ingestion by hand to mouth contact, or from absorption through the skin (Moskowitz, 1995). The general public may be exposed to low levels of chemicals from photovoltaic production facilities through indirect pathways (Fthenakis and Moskowitz, 2000). An example of an indirect pathway would be the contamination of public drinking water from the improper disposal or treatment of plant effluent.
Potential for Hazards at PV Installations
Potential human health risks could occur from the leaching of materials from broken photovoltaic modules. Leaching from cracked or broken modules may occur while the modules are still in service or after they have been disposed of. The primary chemicals of concern from the leaching of photovoltaic modules are heavy metals such as cadmium and selenium. Modules leaching metals onto rooftops of residential houses or commercial buildings appear to pose little risk to human or environmental health. Steinberger concluded in a 1998 study that leaching of broken modules into garden water or into soil of a residential house does not appear to represent an acute risk to human beings or the environment. Table 4-5 presents results from the leaching of CdTe small panel, CdTe large panel, CdTe, and CIS modules. Cadmium exceeded EPA guidelines in leaching tests involving early CdTe modules, and mercury exceeded EPA guidelines in leaching tests conducted on both CdTe and CIS modules. Current-generation CdTe modules pass the TCLP test. For example, TCLP tests on the CdTe Apollo thin-film cells had Cd concentrations of 0.1 to 0.45 mg/L, depending on sample size (Cunningham, 1998). The higher Cd concentration occurred in the smaller sample sizes. Mercury is not a component of PV cells, so the reason for the exceedance in the tests is unknown. The detected mercury could be due to contamination in the laboratory. Leaching data were not available for other types of photovoltaic modules. However, standard leaching tests are likely to overestimate the actual risk at an installation, because the modules are sealed containers and do not contain liquid or gases when completed.
4-10
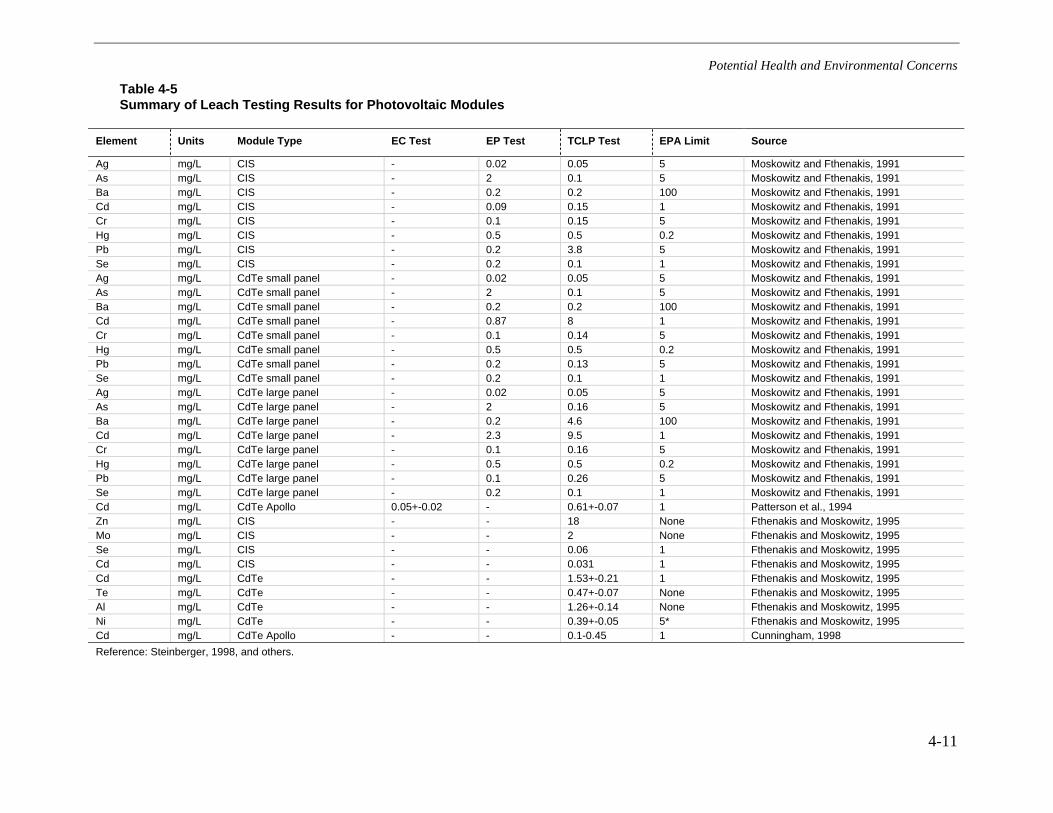
Potential Health and Environmental Concerns
Table 4-5 Summary of Leach Testing Results for Photovoltaic Modules
Element Units Module Type EC Test EP Test TCLP Test EPA Limit Source
Ag mg/L CIS - 0.02 0.05 5 Moskowitz and Fthenakis, 1991 As mg/L CIS - 2 0.1 5 Moskowitz and Fthenakis, 1991 Ba mg/L CIS - 0.2 0.2 100 Moskowitz and Fthenakis, 1991 Cd mg/L CIS - 0.09 0.15 1 Moskowitz and Fthenakis, 1991 Cr mg/L CIS - 0.1 0.15 5 Moskowitz and Fthenakis, 1991 Hg mg/L CIS - 0.5 0.5 0.2 Moskowitz and Fthenakis, 1991 Pb mg/L CIS - 0.2 3.8 5 Moskowitz and Fthenakis, 1991 Se mg/L CIS - 0.2 0.1 1 Moskowitz and Fthenakis, 1991 Ag mg/L CdTe small panel - 0.02 0.05 5 Moskowitz and Fthenakis, 1991 As mg/L CdTe small panel - 2 0.1 5 Moskowitz and Fthenakis, 1991 Ba mg/L CdTe small panel - 0.2 0.2 100 Moskowitz and Fthenakis, 1991 Cd mg/L CdTe small panel - 0.87 8 1 Moskowitz and Fthenakis, 1991 Cr mg/L CdTe small panel - 0.1 0.14 5 Moskowitz and Fthenakis, 1991 Hg mg/L CdTe small panel - 0.5 0.5 0.2 Moskowitz and Fthenakis, 1991 Pb mg/L CdTe small panel - 0.2 0.13 5 Moskowitz and Fthenakis, 1991 Se mg/L CdTe small panel - 0.2 0.1 1 Moskowitz and Fthenakis, 1991 Ag mg/L CdTe large panel - 0.02 0.05 5 Moskowitz and Fthenakis, 1991 As mg/L CdTe large panel - 2 0.16 5 Moskowitz and Fthenakis, 1991 Ba mg/L CdTe large panel - 0.2 4.6 100 Moskowitz and Fthenakis, 1991 Cd mg/L CdTe large panel - 2.3 9.5 1 Moskowitz and Fthenakis, 1991 Cr mg/L CdTe large panel - 0.1 0.16 5 Moskowitz and Fthenakis, 1991 Hg mg/L CdTe large panel - 0.5 0.5 0.2 Moskowitz and Fthenakis, 1991 Pb mg/L CdTe large panel - 0.1 0.26 5 Moskowitz and Fthenakis, 1991 Se mg/L CdTe large panel - 0.2 0.1 1 Moskowitz and Fthenakis, 1991 Cd mg/L CdTe Apollo 0.05+-0.02 - 0.61+-0.07 1 Patterson et al., 1994 Zn mg/L CIS - - 18 None Fthenakis and Moskowitz, 1995 Mo mg/L CIS - - 2 None Fthenakis and Moskowitz, 1995 Se mg/L CIS - - 0.06 1 Fthenakis and Moskowitz, 1995 Cd mg/L CIS - - 0.031 1 Fthenakis and Moskowitz, 1995 Cd mg/L CdTe - - 1.53+-0.21 1 Fthenakis and Moskowitz, 1995 Te mg/L CdTe - - 0.47+-0.07 None Fthenakis and Moskowitz, 1995 Al mg/L CdTe - - 1.26+-0.14 None Fthenakis and Moskowitz, 1995 Ni mg/L CdTe - - 0.39+-0.05 5* Fthenakis and Moskowitz, 1995 Cd mg/L CdTe Apollo - - 0.1-0.45 1 Cunningham, 1998
Reference: Steinberger, 1998, and others.
4-11

Potential Health and Environmental Concerns
Accidental fires on rooftops or combustion of spent modules in a municipal solid waste incinerator could theoretically release fumes or vapors into the atmosphere. The inhalation of these fumes or vapors by nearby populations could affect human health. The nearby populations are of primary concern because the concentrations of chemicals in the air decline rapidly as distance from the source increases (Moskowitz, 1995). The types of chemicals released by a fire vary depending upon the type of photovoltaic module installed. As discussed in Section 3, incineration of spent modules is not a likely disposal method, compared to eventual recycling.
A study conducted by Moskowitz and Fthenakis in 1990 focused on materials released during the combustion of CIS, CdTe, and GaAs modules. GaAs modules are produced only for space applications. CdTe is nonflammable and does not melt until temperatures are over 1000°C (Zweibel, et al., 1998). The study concluded that the overall risk to public health from a fire involving photovoltaic modules would be highest for commercial buildings and would be very small for residential buildings. This conclusion was based on the fact that there could be higher concentrations of chemicals released by a fire due to the larger quantity of photovoltaic modules on a commercial building. The study also found that fires involving photovoltaic modules are typically short-term events. Due to the fact that these fires are short-term in nature, the authors concluded that alerting all residents within about 1 – 2 km of a fire to remain in their homes and to close all their windows should protect public health (Moskowitz and Fthenakis, 1990).
Potential for Hazards at Landfills with PV Modules
Disposal of large quantities of modules in a single landfill could lead to increased potential risks to humans and biota. The leaching of chemicals from these landfilled modules has the potential to contaminate local ground and surface water. As discussed previously, cadmium exceeded EPA TCLP criterion in leaching tests involving early CdTe modules, and mercury exceeded TCLP criterion in leaching tests conducted on both CdTe and CIS modules (Table 4-5). However, newer CdTe cells did not exceed the cadmium criteria, and the source of the mercury is in question as it is not a component used in cell manufacturing. At present CdTe modules represent only about 0.4 percent of the PV modules being used worldwide, and CIS modules are about smaller percentage (0.2 percent) (Goetzberger et al., 2003). The standard leaching tests are intended to be conservative, and overestimate the potential for release of metals from the enclosed solid PV modules. Because of the relatively long life of PV modules and the fact that the photovoltaic industry is comparatively new, no relevant leachate data from landfills were available.
Relative Toxicity to Biota
Biota inhabiting the areas in the vicinity of an accidental release at a manufacturing facility could be exposed to elevated concentrations of chemicals through direct ingestion of compounds, ingestion of contaminated water, contact with contaminated soils, or inhalation of contaminated air. Exposure to chemicals can lead to a variety of impacts on organisms, including impaired reproduction, decreased pulmonary activity, increased mortality, and reduced growth. The severity of any effects will vary depending upon the amount and type of chemical being released.
4-12
Potential Health and Environmental Concerns
To protect aquatic organisms, National Ambient Water Quality Criteria have been developed for numerous chemicals. National Ambient Water Quality Criteria present both acute and chronic limits for a given chemical. Acute concentration criteria are designed to protect an aquatic organism from short-term, high-level exposures to a pollutant and are expressed as 1-hour average or instantaneous maximum concentrations. Chronic concentration criteria are designed to protect an aquatic organism from long-term, low-level exposures to a pollutant and are expressed as 4-day or 24-hr average concentrations (Marshack, 2000). Table 4-6 lists the National Ambient Water Quality Criteria for Freshwater Aquatic Life Protection for the chemicals used in the production of photovoltaic devices. The table also includes the lowest observed effect level (LOEL) value for dichloromethane, 1,1,1-trichloroethane, and trichloroethylene. The LOEL is defined as the lowest dose that resulted in a measurable detrimental effect to study animals.
Ammonia, arsenic, and heavy metals are the only photovoltaic chemicals with established aquatic life criteria. Based on the criteria, cadmium appears to be the chemical most toxic to aquatic organisms (2.2 µg/L chronic and 4.3 µg/L acute). Toxicity tests conducted by the U.S. Fish and Wildlife Service have shown that elevated levels of cadmium are associated with high mortality, reduced growth, inhibited reproduction, and other adverse effects on aquatic organisms (Eisler, 1985). The impact of cadmium on aquatic organisms depends on the its form; various forms of cadmium have different toxicities and bioconcentration factors (EPA, 1984).
Studies conducted by the National Institute of Environmental Health Studies (NIEHS) (e.g., Morgan et al., 1999 and Fthenakis et al., 1999) looked at some toxicological impacts on rats from exposure to CdTe, CIS, and CGS. The study focused on systemic, reproductive, and pulmonary systems. The systemic and reproductive impacts of these compounds were assessed using direct ingestion of these compounds. The potential impacts of these compounds on the pulmonary system were assessed through the inhalation of these compounds. Various doses of each compound were used in the studies to determine a maximum tolerable dose.
4-13
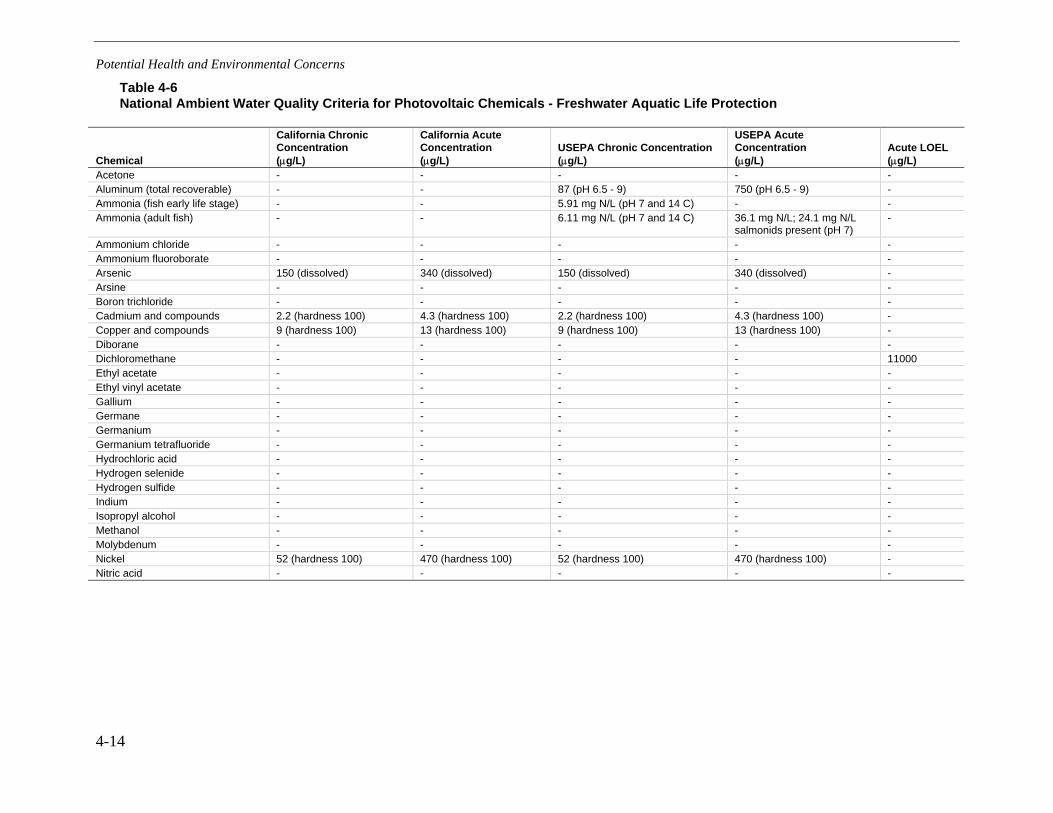
Potential Health and Environmental Concerns
Table 4-6 National Ambient Water Quality Criteria for Photovoltaic Chemicals - Freshwater Aquatic Life Protection
Chemical
California Chronic Concentration (µg/L)
California Acute Concentration (µg/L)
USEPA Chronic Concentration (µg/L)
USEPA Acute Concentration (µg/L)
Acute LOEL (µg/L)
Acetone - - - - -Aluminum (total recoverable) - - 87 (pH 6.5 - 9) 750 (pH 6.5 - 9) - Ammonia (fish early life stage) - - 5.91 mg N/L (pH 7 and 14 C) - - Ammonia (adult fish) - - 6.11 mg N/L (pH 7 and 14 C) 36.1 mg N/L; 24.1 mg N/L
salmonids present (pH 7) -
Ammonium chloride - - - - - Ammonium fluoroborate - - - - - Arsenic 150 (dissolved) 340 (dissolved) 150 (dissolved) 340 (dissolved) - Arsine - - - - -Boron trichloride - - - - - Cadmium and compounds 2.2 (hardness 100) 4.3 (hardness 100) 2.2 (hardness 100) 4.3 (hardness 100) - Copper and compounds 9 (hardness 100) 13 (hardness 100) 9 (hardness 100) 13 (hardness 100) - Diborane - - - - -Dichloromethane - - - - 11000Ethyl acetate - - - - - Ethyl vinyl acetate - - - - - Gallium - - - - -Germane - - - - -Germanium - - - - -Germanium tetrafluoride - - - - - Hydrochloric acid - - - - - Hydrogen selenide - - - - - Hydrogen sulfide - - - - -
- -Isopropyl alcohol - - - - - Methanol - - - - -
- - -Nickel 52 (hardness 100) 470 (hardness 100) 52 (hardness 100) 470 (hardness 100) -
- - - - -
Indium - - -
Molybdenum - -
Nitric acid
4-14

Potential Health and Environmental Concerns
Table 4-6 (continued) National Ambient Water Quality Criteria for Photovoltaic Chemicals - Freshwater Aquatic Life Protection
Chemical
California Chronic Concentration (µg/L)
California Acute Concentration (µg/L)
USEPA Chronic Concentration (µg/L)
USEPA Acute Concentration (µg/L)
Acute LOEL (µg/L)
Phosphine - - - - -
Phosphoric acid - - - - -
Phosphorus oxychloride - - - - -
Phosphorus trichloride - - - - -
Selenium (total recoverable) 5 (not for entire State)* 20 (not for entire State)** 5 (a) -
Silane - - - - -
Silicon nitride - - - - -
Silicon tetrafluoride - - - - -
Silver and compounds - 3.4 (dissolved - hardness 100) - - -
Sodium chloride - - - - -
Sodium hydroxide - - - - -
Sulfuric acid - - - - -
Tantalum pentoxide - - - - -
Tellurium - - - - -
Thiourea - - - - -
Tin - - - - -
Titanium tetrachloride - - - - -
1,1,1-Trichloroethane - - - - 18000
Trichloroethylene - - - - 45000
Trichlorosilane - - - - -
Triethyl gallium - - - - -
Trimethyl gallium - - - - -
Trimethyl indium - - - - -
Trimethyl zinc - - - - -
Vinyl acetate - - - - -
Zinc 120 (hardness 100) 120 (hardness 100) 120 (hardness 100) 120 (hardness 100) -
Zinc fluoroborate - - - - -
Zinc phosphide - - - - -
LOEL - Lowest Observed Effect Level (a) The maximum concentration is equal to 1/((f1/185.9)+(f2/12.83)), where f1 and f2 are the fractions of total selenium that are treated as selenite and selenate, respectively. *Applies to SF Bay through Suisun Bay and Sacramento-San Joaquin Delta, Salt Slough, Mud Slough (north), and San Joaquin River, Sack Dam to mouth of Merced River, does not apply to Grassland Water District, San Luis National Wildlife Refuge, and Los Banos State Wildlife Refuge. **Applies to SF Bay through Suisun Bay and Sacramento-San Joaquin Delta, Salt Slough, Mud Slough (north), and San Joaquin River, Sack Dam to mouth of Merced River, does not apply to San Joaquin River, mouth of Merced to Vernalis. Reference: Marshack, 2000
4-15

Potential Health and Environmental Concerns
The results from these studies are presented in Tables 4-7 and 4-8. Of the three substances tested, the study concluded that CdTe was the most toxic, followed by CIS, and then CGS. Exposure to CdTe led to significant decreases in weight gain, deaths at the highest and second highest doses, and the highest respiratory tract toxicity. The effects of CdTe to the respiratory tract included necrosis of the epithelial lining of the terminal bronchioles and alveolar ducts. It is important to note that these studies were based on exposure through direct ingestion or inhalation of the compounds, which would overestimate the exposure to biotic organisms at or near actual PV manufacturing facilities or installation sites, as actual exposures would involve inhalation of ambient air mixed with the chemicals. Ingestion of compounds by biota at a manufacturing facility or installation is an unlikely pathway.
LC50, LD50, LC100 and other toxicity tests using rats, mice, monkeys, rabbits, and hamsters have been conducted for a limited number of chemicals used to manufacture photovoltaic devices. LC and LD toxicity tests determine the concentration or dose of a given chemical that causes a certain percentage of mortality in a test population of biotic organisms (i.e., LC50 tests determine the concentration causing 50% mortality). These types of toxicity tests are often used to determine criteria values for a given chemical (i.e., National Ambient Water Quality Criteria). Table 4-9 presents the results of toxicity tests conducted on selected chemicals used to manufacture photovoltaic devices. Most of the chemicals with test data would be those used in the manufacturing process, and thus biota are unlikely to be exposed to them except as a result of fires or explosions.
4-16
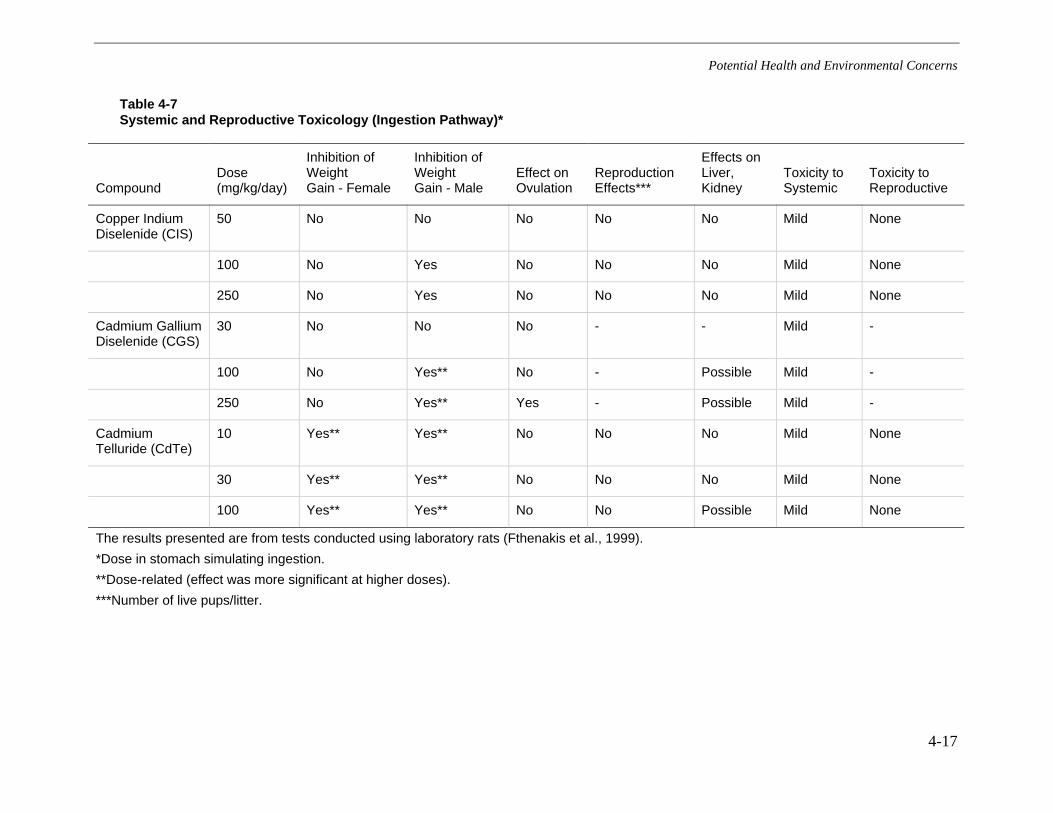
Potential Health and Environmental Concerns
Table 4-7 Systemic and Reproductive Toxicology (Ingestion Pathway)*
Compound Dose (mg/kg/day)
Inhibition of Weight Gain - Female
Inhibition of Weight Gain - Male
Effect on Ovulation
Reproduction Effects***
Effects on Liver, Kidney
Toxicity to Systemic
Toxicity to Reproductive
Copper Indium Diselenide (CIS)
50 No No No No No Mild None
100 No Yes No No Mild None
250 No Yes No No No Mild None
Cadmium Gallium Diselenide (CGS)
30 No No No - - Mild -
100 No - Possible Mild -
250 No Yes** Yes - Possible Mild -
Cadmium Telluride (CdTe)
10 Yes** Yes** No No No Mild None
30 Yes** Yes** No No No Mild None
100 Yes** Yes** No No Possible Mild None
No
No Yes**
The results presented are from tests conducted using laboratory rats (Fthenakis et al., 1999).
*Dose in stomach simulating ingestion.
**Dose-related (effect was more significant at higher doses).
***Number of live pups/litter.
4-17
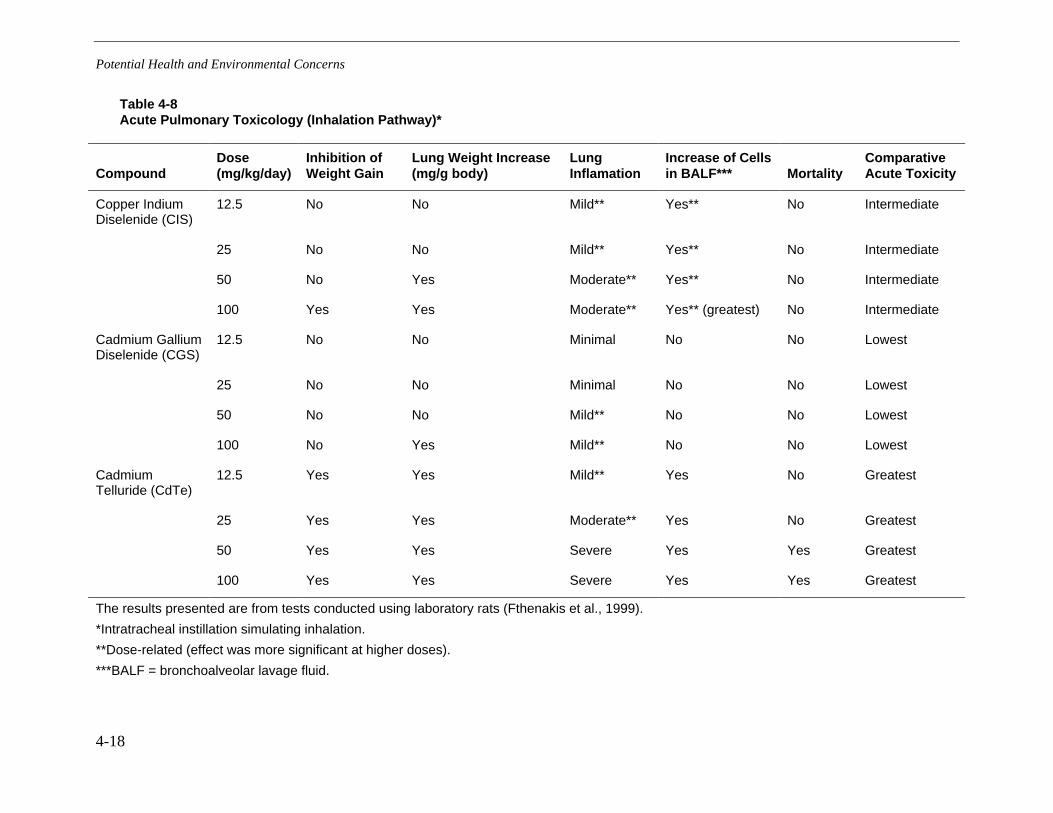
Potential Health and Environmental Concerns
Table 4-8 Acute Pulmonary Toxicology (Inhalation Pathway)*
Compound Dose (mg/kg/day)
Inhibition of Weight Gain
Lung Weight Increase (mg/g body)
Lung Inflamation
Increase of Cells in BALF*** Mortality
Comparative Acute Toxicity
Copper Indium Diselenide (CIS)
12.5 No No Mild** Yes** No Intermediate
25 No No Mild** Yes** No Intermediate
50 No Yes Moderate** Yes** No Intermediate
100 Yes Yes Moderate** Yes** (greatest) No Intermediate
Cadmium Gallium Diselenide (CGS)
12.5 No No Minimal No No Lowest
25 No No Minimal No No Lowest
50 No No Mild** No No Lowest
100 No Mild** No No Lowest
Cadmium Telluride (CdTe)
12.5 Yes Yes Mild** Yes No Greatest
25 Yes Yes Moderate** Yes No Greatest
50 Yes Yes Severe Yes Yes Greatest
100 Yes Yes Severe Yes Yes Greatest
Yes
The results presented are from tests conducted using laboratory rats (Fthenakis et al., 1999).
*Intratracheal instillation simulating inhalation.
**Dose-related (effect was more significant at higher doses).
***BALF = bronchoalveolar lavage fluid.
4-18

Potential Health and Environmental Concerns
Table 4-9 Summary of Toxicity Tests Conducted on Selected Chemicals Used in the Production of PV Devices
Chemical Toxicity Test Type
Exposure Route
Test Species Units Concentration References
Acetone LD50 Oral Rat ml/kg 10.7 Merck, 1996
Dichloromethane LD50 Oral Rat ml/kg 1.6 Merck, 1996
Germane LD100 Inhalation Mouse mg/m3 610 Ullman, 1998
Hydrogen fluoride LC50 (1 hr.) Oral Rat ppm 1278 Merck, 1996
Hydrogen fluoride LC50 (1 hr.) Oral Mice ppm 500 Merck, 1996
Hydrogen fluoride LC50 (1 hr.) Oral Monkey Merck, 1996 ppm 1780
Isopropyl alcohol LD50 Oral Rat g/kg 5.8 Merck, 1996
Phosphine Lowest Lethal Concentration
Inhalation Hamsters 8 ppm Merck, 1996
Sodium hydroxide LD50 Oral Rabbits mg/kg 500 Merck, 1996
Sulfuric acid LD50 Oral Rat g/kg 2.14 Merck, 1996
Tantalum pentoxide LD50 Oral Rat mg/kg 8000 Merck, 1996
Oral mg/kg 1830
Trichloroethylene LD50 Oral Rat ml/kg 4.92 Merck, 1996
Trichloroethylene LC50 (4 hrs.) Oral Rat ppm 8000 Merck, 1996
Trichlorosilane LD50 Oral Rat g/kg 1.03 Merck, 1996
Zinc phosphide LD50 40.5 - 46.7 Oral Rat mg/kg Merck, 1996
Thiourea LD50 Rat Merck, 1996
4-19
5 DISCUSSION
Potential for Impacts
Silicon cells are still the most commonly used PV cells; crystalline silicon cells are expected to continue as the dominant type for the next 5 to 10 years (Goetzberger, et al., 2003). With respect to silicon-based cells, the primary concerns for human health are from the use of toxic gases and solvents during manufacturing. Arsine and phosphine gases are used in the production of silicon-based cells. The potential impacts are primarily at the manufacturing facilities for workers and for nearby residents if accidents occur. The completed, installed silicon-based cells pose minimal risks to human health or the environment. Arsine and phosphine gas are also used in the manufacture of GaAs cells and some new high-performance cells for space applications currently under development. Research is underway to improve efficiency of amorphous-silicon cells and to reduce their manufacturing costs (Andersson and Jacobsson 2000).
The expected future trend in the PV industry is to produce more thin-film PV cells, which have the potential for higher energy efficiency and hence lower cost per unit of electricity generated. Of the compound thin-film PV cells, CdTe (cadmium telluride) and CIS (copper indium selenide) are the most likely to be produced on a larger scale in the near future (Andersson and Jacobsson, 2000). As discussed in Section 2, both CdTe and CIS modules are commercially produced, but in 2001 they represented less than 1 percent of the market for PV cells. Other types of thin film cells expected to have increased production in the future include amorphous silicon cells and CIGS (copper indium gallium diselenide) (Goetzberger et al., 2003).
Cadmium is potentially of concern with the thin-film technologies. Cadmium compounds are used in CdTe, CIS, and CIGS (copper indium gallium selenide) cells, although in very small quantities in the latter two types of cells. (Cadmium compounds are not used by amorphous silicon and crystalline silicon cells or GaAs cells.) CIS and CIGS cells can be made with or without a top CdS layer. Use of cadmium can generate cadmium-containing wastewater, and possibly cadmium fumes and dusts. Tests using standard leaching protocols show that cadmium could be leached out of crushed CdTe modules, although these tests overestimate leaching from intact cells. Recent tests on CdTe and CIS modules show that Cd concentrations were below the TCLP limit. Research is ongoing to reduce the quantity of cadmium used in manufacturing the cells by improving the deposition processes and in the final cell layers.
At completed installations of photovoltaic systems for power generation, the potential for chemical releases appears to be small since the chemicals are present in the sealed PV modules. Releases are likely to occur only due to fires or other unusual accidents. Cadmium could be a potential concern in this setting with thin-film technologies, as would arsenic and zinc to a lesser extent. Other chemicals that have inhalation toxicity factors are present only during the
5-1

Discussion
manufacturing process. Leaching of metals from the installed modules is not likely to be a concern, as documented in a study by Steinberger (1998). Leaching from small cells used in electronic devices is also unlikely to be a concern, given the small amounts of chemicals present and the sealed nature of the devices.
Data Gaps
Little information on disposal of used photovoltaic modules was available. Leaching tests using standard EPA protocols have been conducted on two types of cells containing cadmium, but not on the other types of cells. Copper was not analyzed in the available leaching tests. Both cadmium and copper are a potential concern to biota due to their acute toxicity, depending on the conditions in a given waterbody and the specific type of biota. Leaching tests with water in a “runoff” scenario and a “broken cell” scenario would better represent likely conditions.
Recycling is expected to be the preferred disposal option for spent PV modules in the future, in order to minimize the potential for environmental impacts, reduce disposal costs of spent modules, and recover source metals. Continuing research is needed to determine feasible methods of recycling modules from geographically diverse areas and multiple individual parties.
Comparison of the potential for impacts at PV manufacturing plants making different types of PV cells could be quantitatively assessed if information were available on the actual amounts of waste streams generated during the manufacturing process and their composition. The quantities of wastes from the TRIS inventory provide total masses of chemicals, and not concentrations in the particular wastestreams. Past measurements of a few chemicals in wastewater from integrated circuit plants were available from 1982 (Vagliasindi and Poulsom, 1994), but this information would not represent present conditions. Assessment of human health and environmental impacts require data on concentration of the chemical in a given media (e.g., air or water). This information is also needed to predict the fate of the compounds in surface or groundwater.
5-2
6 REFERENCES
Alsema, EA and E Nieuwlaar, 2000. Energy Viability of Photovoltaic Systems. Energy Policy, Vol. 28, pp. 999-1010.
Andersson, BA, 2000. Materials Availability for Large-scale Thin-film Photovoltaics. Progress in Photovoltaics, Vol. 8 No. 1, pp. 61-76.
Andersson, BA, and S Jacobsson, 2000. Monitoring and Assessing Technology Choice: the Case of Solar Cells. Energy Policy, Vol. 28, pp. 1037-1049.
Andersson, BA, C Azar, J Holmberg, and S Karlsson, 1998. Material Constraints for Thin-film Solar Cells. Energy, Vol. 23, No. 5, pp. 407-411.
Azom. 2003. Photovoltaic –Concentrator Systems. http://www.azom.com/details.asp?ArticleID=1173. 8/2003
Bayer, A, DS Boyle, MR Heinrich, P O’Brien, DJ Otway, and O Robbe, 2000. Developing Environmentally Benign Routes for Semiconductor Synthesis: Improved Approaches to the Solution Deposition of Cadmium Sulfide for Solar Cell Applications. Green Chemistry, April 2000, p. 79-85.
Bohland, J, T Dapkus, K Kamm, and K Smigielski, 1998. Photovoltaics as hazardous materials; the recycling solution. In: Fthenakis et al. (Eds.), Presented at the BNL/NREL Workshop “Photovoltaics and the Environment 1998”, Keystone, CO, July 23-24.
BP Solar, 2003. Press Release – BP Solar Repositions for Growth. http://www.bp.com/centres/press.
California Energy Commission, 1999. Information on Photovoltaic Industry. http://www.energy.ca.gov/development/solar/index.html.
Chapin, DM, CS Fuller, and GL Pearson, 1954. J. Appl. Phys. Vol. 25, p. 676.
Contra Costa Times. 2001a. Solar Power Booming Amid Crisis. Wednesday, January 24, 2001.
Contra Costs Times. 2001b. PG&E’s Absence Doesn’t Mean Residents Lack Power. Sunday, July 29, 2001.
6-1
References
Cunningham, D, 1998. Leaching Tests using CdTe Modules. In: Fthenakis et al. (Eds.), Presented at the BNL/NREL Workshop “Photovoltaics and the Environment 1998”, Keystone, CO, July 23-24.
Dickson, CR, 1986-87. Safety Procedures Used During the Manufacturing of Amorphous Silicon Solar Cells. Solar Cells, Vol. 19, pp. 189-201.
Eisler, R, 1985. Cadmium Hazards to Fish, Wildlife, and Invertebrates: A Synoptic Review. U.S. Fish and Wildlife Service, Laurel, Maryland.
Energy Information Administration (EIA), 2000. Renewable Energy Annual 1999 with Data for 1998. http://www.eia.doe.gov/fuelrenewable.html.
Energy Information Administration (EIA), 2002. Renewable Energy Annual 2001 with Preliminary Data for 2001. http://www.eia.doe.gov/cneaf/solar.renewables/page/rea_data/rea_sum.html.
Energy Educators of Ontario (EEO). 1993. Energy Fact Sheet. http://www.iclei.org/efacts/photovol.htm.
EPV, 2001. Information on CIS Manufacturing. http://www.epv.net/CISMfg.html.
Fthenakis, VM and PD Moskowitz, 1990. Toxic Materials Released from Photovoltaic Modules during Fires: Health Risks. Solar Cells, Vol. 29, pp. 63-71.
Fthenakis, VM and PD Moskowitz, 1995. Thin-film Photovoltaic Cells: Health and Environmental Issues in their Manufacture, Use and Disposal. Progress in Photovoltaics: Research and Applications, Vol. 3, pp. 295-306.
Fthenakis, VM and PD Moskowitz, 1997. Emerging Photovoltaic Technologies: Environmental and Health Issues Update. Photovoltaics Program Review, AIP Press, New York, NY, pp. 903-914.
Fthenakis, VM and PD Moskowitz, 2000. Photovoltaics: Environmental Health and Safety Issues and Perspectives. Progress in Photovoltaics: Research and Applications, Vol. 8, pp. 27-38.
Fthenakis, VM, 1998. Prevention and Control of Accidental Releases of Hazardous Materials in PV Facilities. Progress in Photovoltaics: Research and Applications, Vol. 6, pp. 91-98.
Fthenakis, VM, 2000. End-of-life Management and Recycling of PV Modules. Energy Policy, Vol. 28, p. 1051-1058.
Fthenakis, VM, PD Moskowitz, and JC Lee, 1984. Manufacture of Amorphous Silicon and GaAs Thin-film Solar Cells: An Identification of Potential Health and Safety Hazards. Solar Cells, Vol. 13, pp. 43-58.
6-2

References
Fthenakis, VM, PD Moskowitz, and LD Hamilton, 1986-87. Personal Safety in Thin-film Photovoltaic Cell Industries. Solar Cells, Vol. 19, pp. 269-281.
Fthenakis, VM, SC Morris, PD Moskowitz, and DL Morgan, 1999. Toxicity of Cadmium Telluride, Copper Indium Diselenide, and Copper Gallium Diselenide. Progress in Photovoltaics: Research and Applications, Vol. 7, pp. 489-497.
Gilles, DG and RC Loehr, 1994. Waste Generation and Minimization in Semiconductor Industry. Journal of Environmental Engineering-ASCE, Vol. 120, No. 1, pp. 72-86.
Goetzberger, A and C Hebling, 2000. Photovoltaic Materials, Past, Present, Future. Solar Energy Materials & Solar Cells, Vol. 62, pp. 1-19.
Goetzberger, A, J Luther, and G Willeke, 2002. Solar Cells: Past, Present, Future. Solar Energy/Materials & Solar Cells, vol. 74, p. 1-11.
Goetzberger, A, C Hebling, and HW Schock, 2003. Photovoltaic Materials, History, Status, and Outlook, Materials Science and Engineering, vol. 40, p. 1-46.
Goozner, W Drinkard, M Long, and C Byrd, 1998. In: Fthenakis et al. (Eds.), Presented at the BNL/NREL Workshop “Photovoltaics and the Environment 1998”, Keystone, CO, July 23-24.
Green, MA, 2000. Photovoltaics: technology overview. Energy Policy Vol. 28, pp. 989-998.
Haug, FJ and ETH Zurich, 2003. Solar Cells: Thin Film Solar Cells. http://www.tfp.ethz.ch/Lectures/pv/thin-film.pdf. 8/03
Hill, R and AE Baumann, 1993. Environmental Costs of Photovoltaics. IEE Proceedings, Vol. 140, No. 1, pp. 76-80.
Jackson, T and M Oliver, 2000. The Viability of Solar Photovoltaics. Energy Policy, Vol. 28, pp. 983-988.
Kalb, PD and PD Moskowitz, 1989. Use of GeH4 and GeF4 in a-Si Photovoltaic Cell Manufacture: Hazard Assessment and Management Options. Solar Cells, Vol. 26, pp. 269-291.
Lawrence, K, S Morgan, D Schaller, and T Wilczak, 1981. Environmental, Health, Safety and Regulatory Review of Selected Photovoltaic Options (copper sulfide/cadmium sulfide and polycrystalline silicon). Solar Energy Research Institute, Golden CO (SERI/TR-743-799).
Marshack, JB, 2000. A Compilation of Water Quality Goals. California Regional Water Quality Control Board – Central Valley Region, Sacramento, CA.
Mazer, JA, 1997. Solar Cells: An Introduction to Crystalline Photovoltaic Technology. Kluwer Academic Publishers, Norwell, MA.
6-3

References
Menezes, S, 2000. Electrochemical Solutions to Some Thin-film PV Manufacturing Issues. Thin Solid Films, Vol. 361-362, pp. 278-282.
Menezes, S, 2001. Electrochemical Approach for Removal, Separation, and Retrieval of CdTe and CdS Films from PV Module Waste. Thin Solid Films, Vol. 387, pp. 175-178.
Merck & Company, Incorporated, 1996. The Merck Index: An Encyclopedia of Chemicals, Drugs, and Biologicals (12th Edition). Merck Research Laboratories, Whitehouse Station, NJ.
Moller, JH, 1993. Semiconductors for Solar Cells. ARTECH House, Inc, Norwood, MA.
Morgan, DL, CJ Shines, S Jeter, M Blazka, M Elwell, R Wilson, S Ward, S Price, and PD Moskowitz, 1999. Comparative Pulmonary Absorption, Distribution and Toxicity of Copper Gallium Diselenide, Copper Indium Diselenide, and Cadmium Telluride in Sprague-Dawley Rats. Toxicol. Appl. Pharmacol.
Moskowitz, PD and VM Fthenakis. 1991. Environmental, Health and Safety Issues Associated with the Manufacture and Use of II-VI Photovoltaic Devices. Solar Cells, Vol. 30, pp. 89-99.
Moskowitz, PD, 1992. Environmental, Health and Safety Issues Related to the Production and Use of CdTe Photovoltaic Modules. International Journal of Solar Energy, Vol. 12, pp. 259-281.
Moskowitz, PD, 1995. An Overview of Environmental, Health and Safety Issues in the Photovoltaic Industry. Chapter Eighteen in Solar Cells and Their Applications, John Wiley & Sons, Inc., New York, NY.
Moskowitz, PD, and VM Fthenakis, 1990. Toxic Materials Released from PV Modules During Fires: Health Risks. Solar Cells Vol. 29, pp. 63-71.
Moskowitz, PD, VM Fthenakis, LD Hamilton, and JC Lee. 1986-87. Public Health Issues in Photovoltaic Energy Systems: An Overview of Concerns. Solar Cells, Vol. 19, pp. 287-299.
Moskowitz, PD, VM. Fthenakis, and JC Lee. 1989. Protecting Worker Health and Safety in Photovoltaic Research and Development Laboratories. Solar Cells, Vol. 27, pp. 149-158.
Newton, R. 2000. Photograph of PV cell at field site and information on cell type. Dept. of Geology, Smith College.
Oliver, M and T Jackson, 2000. The Evolution of Economic and Environmental Cost for Crystalline Silicon Photovoltaics. Energy Policy, Vol. 28, pp. 1011-1021.
Partain, LD, 1995. Solar Cells and Their Applications. John Wiley and Sons, Inc., New York, NY.
Partain, LD, LM Fraas, PS McLeod, and JA Cape. 1986-87. Safety Comparisons of Various Gas Source Deposition Technologies for Large-scale Production of III-V Solar Cells. Solar Cells, Vol. 19, pp. 245-257.
6-4
References
Patterson, MH, 1997. The Management of Wastes Associated with Thin Film PV Manufacturing. Environmental Aspects of PV Power Systems: Report on the IEA PVPS Task 1 Workshop - June 25-27, 1997 - Utrecht, The Netherlands. University of Utrecht, The Netherlands.
Patterson, MH, AK Turner, M Sadeghi, and RJ Marshall. 1994. Health, Safety and Environmental Aspects of the Use of Cadmium Compounds in Thin-film PV Modules. Solar Energy Materials and Solar Cells, Vol. 35, pp. 305-310.
Reaven, SJ, PD Moskowitz, and VM Fthenakis, 1996. Model Institutional Infrastructures for Recycling of Photovoltaic Modules. BNL Report No. 62837.
Sittig, M. 1979. Solar Cells for Photovoltaic Generation of Electricity. Noyes Data Corporation, Park Ridge, New Jersey.
Solar Energy Research Institute (SERI), 1981. Golden CO (SERI/TR-743-799). Environmental, health, safety, and regulatory review of selected photovoltaic options: copper sulfide/cadmium sulfide and polycrystalline silicon, pp. 222.
Spectrolab, 2003. Triple-junction Terrestrial Concentrator Solar Cells. http://www.spectrolab.com.
Steinberger, H, 1998. Health, Safety and Environmental Risks from the Operation of CdTe and CIS Thin-film Modules. Progress in Photovoltaics: Research and Applications, Vol. 6, pp. 99-103.
Surek, T, 2003. Photovoltaics: Energy for the New Millenium. http://www.aps.org/units/fps/meetings/april2000/surek.html. 8/03
Ullmann’s Encyclopedia. 1999. Industrial Inorganic Chemicals and Products. Wiley and Sons, New York, NY.
U.S. Environmental Protection Agency. 2000. Preliminary Remediation Goals (PRGs). U.S. EPA Region 9.
U.S. Environmental Protection Agency. 1999. Emergency Planning and Community Right to Know Act Section 313 Reporting Guidance for the Semiconductor Manufacturing Industry. EPA 745-R-99-007. Office of Pollution Prevention and Toxics, Washington, D.C.
U.S. Environmental Protection Agency. 1984. Ambient Water Quality Criteria for Cadmium – 1984. U.S. EPA, Washington, DC.
Vagliasindi, FGA and SR Poulsom, 1994. Waste Generation and Management in the Seniconductor Industry: A Case Study. Water Science Technology, Vol. 29, No. 9, pp. 331-341.
Wolfson, RG and SM Vernon. 1986-87. Safety in Thin Film Semiconductor Deposition. Solar Cells, Vol. 19, pp. 215-224.
6-5

References
Zweibel, K, P Moskowitz, and V Fthenakis, 1998. Thin-film Cadmium Telluride Photovoltaics: Environmental Safety & Health Issues, Solutions, and Perspectives. National Renewable Energy Laboratory Report NREL/TP-520-24057, 4 p.
6-6
A INFORMATION ON COMPANIES LISTED AS PHOTOVOLTAIC MODULE MANUFACTURERS
A-1
Information on Companies Listed as Photovoltaic Module Manufacturers
Company State City AddressZip Code Phone Web Address Contact
PV Materials Produced/Developed Comments
Photocomm, Inc. (now Kyocera America, Inc.)
AZ Scottsdale 7681 E. Gray Rd. 85260-3469
800-223-9580
www.kyocera.com NA Crystalline siliconcells and modules
They are now part of Kyocera America, Inc.. Kyocera manufactures the cells and modules in Japan and has them shipped to the USA.
SunCat Solar AZ Phoenix 17626 N. 33rd Pl.
85032 602-404-4929
www.users.uswest.net/~tkreider NA Solar cars, balloons, and boats
Information was obtained from the web site. Unable to contact the company at phone number given. There is no listing for them in directory assistance. They put together modules and sell solar items. It appears that they do not make any PV materials.
Global Solar Energy, L.L.C.
AZ Tucson 5575 S.Houghton Rd.
85747 520-546-6313
www.globalsolar.com JanelFunke
Thin-film copper indium gallium diselenide (CIS, CIGS) cells and modules
They manufacture the PV cells that they use in their Tucson, AZ plant. Have done some large projects for the government.
Solar Cells, Inc. (name changed to First Solar, Inc.)
AZ Phoenix 4050 East CottonCenter
85040 602-414-9300
www.firstsolar.com NA Cadmium telluridecells and modules
They manufacture their own PV cells (cadmium telluride). Everything is manufactured on-site.
Atlantis Energy Systems
CA Sacramento 9275 BeattyDrive
95820 916-438-2930
www.atlantisenergy.com JoeMorrisey
Monocrystalline silicon modules
Do not manufacture their own photovoltaic cells (system integrator). The PV cells they use are provided by Astropower, Inc. in Delaware and Shell Solar in California.
International Solar Electric Technology, Inc.
CA 8635 Aviation Blvd.
Copperdiselenide modules
Inglewood 90301 310-216-1423
Wwtinc.comw.is NA indium They are a technology demonstration company involved with the development of CIS modules. They do not manufacture any photovoltaic materials.
Kyocera America, Inc.
CA San Diego 8611 BalboaAvenue
92123 858-576-2647
www.kyocera.com Al Panton Crystalline silicon cells and modules
Kyocera manufactures the cells and modules in Japan and has them shipped to the USA.
A-2

Information on Companies Listed as Photovoltaic Module Manufacturers
Company State City Address Zip Code Phone Web Address Contact
PV Materials Produced/Developed Comments
Photovoltaics International, LLC
CA Santa Clara 3500 Thomas Rd., Suite E
95054 NA 408-986-9231
NA NA Unable to contact the company at phone number given. There is no listing for them in directory assistance.
Siemens Solar Industries (part of Shell Solar in 2002)
CA Camarillo 4650 Adohr Lane 93010 805-482-6800
www.shell.com/home/Framework?SiteID=ShellSolar ArthurRudin
Crystalline silicon and Copper indium diselenide modules
Pioneered the use of photovoltaics in power plants. Developed a 1 megawatt plant for Southern California Edison and a 6.5 megawatt plant for PG&E.
Solec International, Inc.
Now part of Sanyo Corp.)
CA Carson 970 East 236 St. 90745 310-834-5800
www.sanyo.com/aboutsanyo/corp_pro_man_sil.cfm NA Crystalline siliconmodules
Do not manufacture their own PV cells.
Spectrolab, Inc. CA Sylmar 12500 Gladstone Avenue
91342 818-898-2802
www.spectrolab.com RonDiamond
Gallium arsenide modules
They are involved in the use of gallium arsenide modules for concentrator systems. Do not manufacture their own PV cells.
TECSTAR, Inc. (became Applied Solar Energy Group)
CA City ofIndustry
15251 Don Julian Rd.
91745-1002
818-968-6581
NA NA In past - Silicon, gallium arsenide, and multijunction solar cells (cascade space cells)
The cells that they produce are primarily used by the space industry. (company may no longer exist as separate unit)
Utility Power Group, SECO Company
CA Chatsworth 9410-G DesotoAvenue
91311 818-932-9480
NA NA In past -Crystallinesilicon modules
Do not manufacture their own PV cells. They are a distributor for Kyocera America, Inc. (may no longer exist).
Materials Research Group
CO 12441 W. 49th Avenue
WheatRidge
80033 720-480-4313
NA NA Deposition systemsfor manufacturing
Do not manufacture any PV materials.
AstroPower, Inc.
DE Newark 231 Lake Drive 19702 302-366-0400
www.astropower.com Multicrystalline silicon cells and modules
GingerCurtis
They manufacture their own PV cells (crystalline silicon). Everything is manufactured on-site.
Iowa Thin Film Technologies
IA Boone 2337 230th St. 50036 515-292-1922
www.iowathinfilm.com DerrickGrimmer
Thin-film amorphous silicon cells
They manufacture their own PV cells (amorphous silicon - roll to roll process). Everything is manufactured on-site.
A-3
Information on Companies Listed as Photovoltaic Module Manufacturers
Company State City Address Zip Code Phone Web Address Contact
PV Materials Produced/Developed Comments
Midway Labs, Inc.
IL Chicago 350 N. Ogden 60607 312-432-1796
NA NA Low cost concentrator PV modules (silicon modules)
Information was obtained from web site. Unable to contact anyone at the lab. Could not identify where they get their solar cells.
ASE Americas, Inc. (renamed RWE Schott Solar, Inc.)
MA Billerica 4 Suburban ParkDrive
018121 978-667-5901
www.asepv.com TerryFontannay
Crystalline silicon modules and cells; Crystalline EFG ribbon silicon cells
They manufacture their own PV cells (crystalline silicon). Everything is manufactured on-site.
Crystal Systems, Inc.
MA Salem 27 CongressStreet
01970-5597
978-745-0088
www.crystalsystems.com ChandraKhattak
Multicrystalline silicon ingot production systems
They produce the furnaces used to make solar-grade silicon materials.
Evergreen Solar, Inc.
MA Marlboro 259 Cedar Hill St.
01752 508-357-2221
www.evergreensolar.com NA Crystalline siliconModules
Product information obtained from website.
Spire Corporation
MA Bedford One PatriotsPark
01730-2369
781-275-6000
www.spirecorp.com SteveHogan
PV manufacturing equipment
They manufacture the equipment to make PV materials.
BP Solar Corporation (formerly BP Solarex)
MD Frederick 630 SolarexCourt
21701 301-698-4200
www.bpsolar.com DanJohnson
Crystalline and polycrystalline silicon cells and modules. CdTe cells prior to 11/2002.
They produce polycrystalline silicon cells at the Frederick, MD plant. They are part of BP Solar which produces four types of PV cells at their different plants.
United Solar Systems Corp./Energy Conversion Devices (now United Solar Ovionic Corp.)
MI Auburn Hills 3800 Lupeer Rd. 48326 248475-0100
www.uni-solar.com MirandaCasey
Thin-film amorphous silicon cells and modules
They manufacture their own PV cells (thin-film amorphous silicon). Everything is manufactured on-site. Have done large projects (200 megawatt steel plant).
Keep It Simple Systems (now Power Line Solar Products)
MT Helena 32 S. Ewing, Suite 330
59601 The crystalline silicon modules that they sell are manufactured in China.
406-442-3434
www.wildwestweb.com DeannaThompson
Specialty modules for powering and charging computers (crystalline silicon)
Energy Photovoltaics, Inc.
NJ Princeton P.O. Box 7456 08453 609-587-3000
www.epv.net DoloresPhillips
Thin-film amorphous silicon cells and modules; PV factory equipment
They manufacture their own PV cells (thin-film amorphous silicon). They also develop equipment and factories that produce PV materials.
A-4
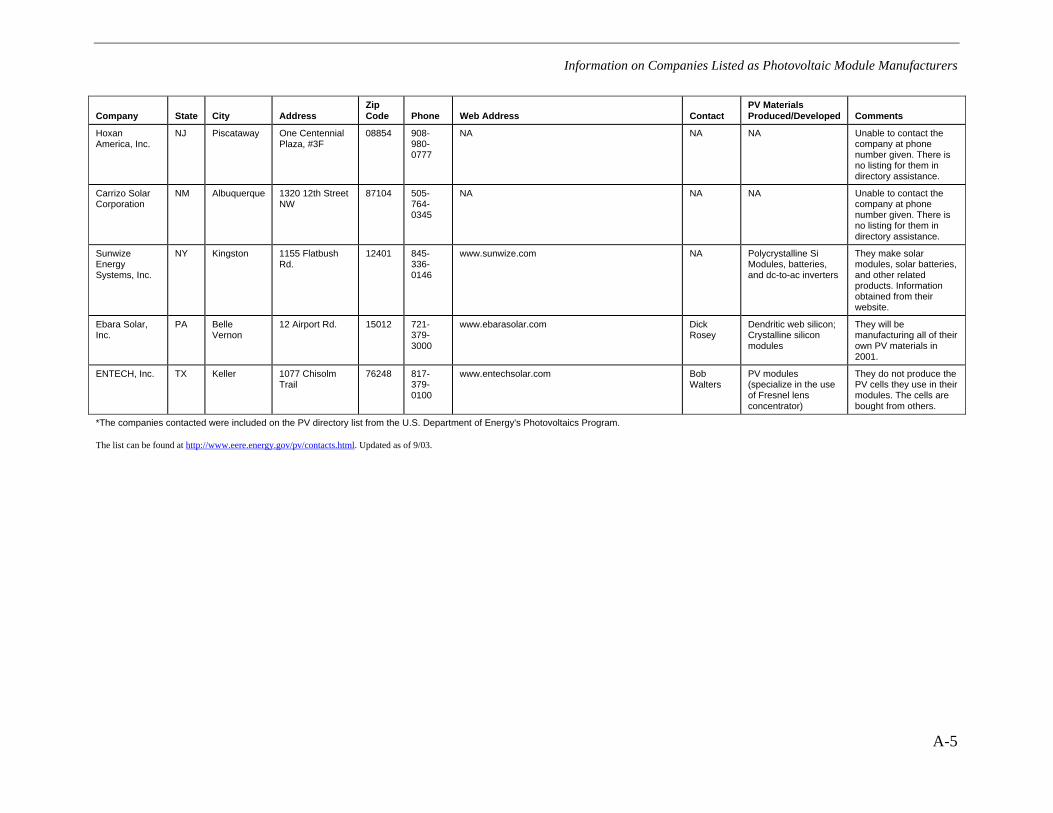
Information on Companies Listed as Photovoltaic Module Manufacturers
Company State City Address Zip Code Phone Web Address Contact
PV Materials Produced/Developed Comments
Hoxan America, Inc.
NJ Piscataway One CentennialPlaza, #3F
08854 908-980-0777
NA NA NA Unable to contact the company at phone number given. There is no listing for them in directory assistance.
Carrizo Solar Corporation
NM Albuquerque 1320 12th Street NW
87104 505-764-0345
NA NA NA Unable to contact the company at phone number given. There is no listing for them in directory assistance.
NY Kingston 1155 FlatbushRd.
12401 845-336-0146
www.sunwize.com Polycrystalline SiModules, batteries, and dc-to-ac inverters
They make solar modules, solar batteries, and other related products. Information obtained from their website.
Ebara Solar, Inc.
PA BelleVernon
12 Airport Rd. 15012 721-379-3000
www.ebarasolar.com DickRosey
Dendritic web silicon; Crystalline silicon modules
They will be manufacturing all of their own PV materials in 2001.
ENTECH, Inc. TX Keller 1077 Chisolm Trail
76248 817-379-0100
www.entechsolar.com BobWalters
PV modules (specialize in the use of Fresnel lens concentrator)
They do not produce the PV cells they use in their modules. The cells are bought from others.
Sunwize Energy Systems, Inc.
NA
*The companies contacted were included on the PV directory list from the U.S. Department of Energy's Photovoltaics Program.
The list can be found at http://www.eere.energy.gov/pv/contacts.html. Updated as of 9/03.
A-5

B PHYSICAL AND CHEMICAL PROPERTIES OF SELECTED CHEMICALS AND COMPOUNDS USED IN PHOTOVOLTAIC CELLS
B-1

Physical and Chemical Properties of Selected Chemicals and Compounds Used in Photovoltaic Cells
Chemical CAS
Molecular Weight (g/mol) Water Solubility Vapor Pressure Description Comments
Acetone 67-64-1 58 1000000 mg/L; miscible with water
Volatile, highly flammable liquid; pungent odor, sweetish taste
Keep away from fire; LD50 (orally) in rats - 10.7 ml/kg
Aluminum 7429-90-5 26.98 Insoluble in water Silvery white, ductile metal
Finely divided aluminum dust is easily ignited and may cause explosions.
Ammonia 7664-41-7 17.03 47% at 0 deg C; 31% at 25 deg C; 28% at 50 deg C
8.5 atm at 20 deg C
Colorless gas; very pungent odor
Mixtures of ammonia and air will explode under favorable conditions; corrosive, alkaline gas; good solvent for many elements and compounds
Ammonium fluoroborate
13826-83-0
104.84 25 g/100 cc water at 16 deg C; 97 g/100 cc water at 100 deg C
0.001 lb/sq inch at 100 deg F
White, rhombic crystals Corrosive to aluminum; soluble in ammonium hydroxide
Arsine 7784-42-1 77.95 Slightly; 28 mL/100 g water (760 mm) at 20 degrees C
Colorless, neutral gas; disagreeable garlic odor
On exposure to light, moist arsine decomposes quickly depositing shiny black arsenic; human inhalation - TCLo - 3 mL/m3, LCLo (30 min) - 25 mL/m3, TCLo - 93 uL/m3
Cadmium 7440-43-9 112.41 Insoluble in water 1 mm Hg at 394 deg C
Silver-white blue-tinged lustrous solid; malleable; odorless.
Tarnishes in moist air. Becomes brittle at 80 deg C
Dichloromethane 75-09-2 84.93 Soluble in about 50 parts water
Colorless liquid Vapor is not flammable and when mixed with air is not explosive; LD50 (orally) in rats - 1.6 ml/kg
Diborane 19287-45-7
27.67 Hydrolizes quickly; Hydrolizes in water to H3BO3.
224 mm Hg at 112 deg C
Colorless, flammable gas; repulsive, sickly-sweet odor
Reacts with NH3 to form diborane diammoniate; reacts slowly with Br2 and explosively with Cl2 to form boron halides; reacts with hydrocarbons or organoboron compounds to give alkyl- or aryl- boron compounds
B-2

Physical and Chemical Properties of Selected Chemicals and Compounds Used in Photovoltaic Cells
Chemical CAS
Molecular Weight (g/mol) Water Solubility Vapor Pressure Description Comments
Ethyl acetate 141-78-6 88.11 More soluble at lower temperatures and less soluble at higher temperatures; 7.87 g/100 g water at 18 deg C
93.2 mm Hg at 25 deg C
Clear, volatile, flammable liquid; agreeable odor; pleasant taste when diluted / bittersweet, wine-like burning taste
Ethyl vinyl acetate Acetaldehyde is a hydrolysis product of vinyl acetate
Gallium 7440-55-3 69.72 Reacts with alkalies to evolve H2
Grayish metal or silvery white liquid
Reacts with alkalies with evolution of hydrogen; readily attacked by halogens
Germane 7782-65-2 76.64 Colorless gas LD100 (mouse inhalation) - 610 mg/m3
Germanium 7440-56-4 72.59 Insoluble in water 0 mm Hg at 25 deg C
Grayish-white, lustrous, brittle metalloid
Relatively stable, unaffected by air, becomes oxidized above 600 deg C
Germanium tetrafluoride
148.6 Hydrolizes in water to GeO2 and H2GeF6.
Colorless gas; odor of garlic
Thermally stable up to about 1000 deg C
Hydrochloric acid (hydrogen chloride)
7647-01-0 36.46 82.3 g/100 g water at 0 deg C; 67.3 g/ 100 g water at 30 deg C; 56.1 g/100 g water at 60 deg C
Fumes in air (may be colored yellow by traces of iron, chlorine, and organic matter); suffocating odor
Causes corrosive burns to skin
Hydrogen 1333-74-0 2.016 0.0182 v/v at 20 deg C
Colorless gas Flammable gas;explosive when mixed with oxygen, chlorine, or air
Hydrogen fluoride 7664-39-3 20.006 Very soluble in water Colorless, fuming, mobile liquid; solid phase is HF
Highly irritating, corrosive, and poisonous; Anhydr HF is one of the most acidic substances known; LC50 (1 hr) in rats, mice, monkeys: 1278, 500, 1780 ppm by inhalation
B-3
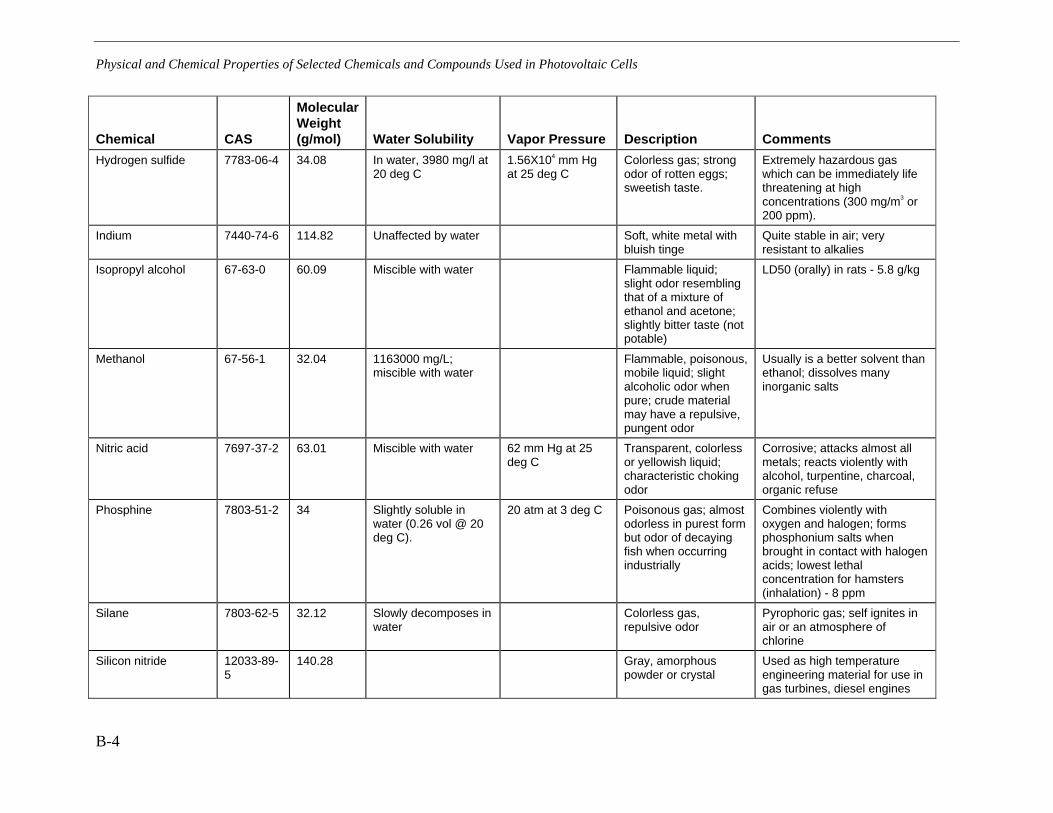
Physical and Chemical Properties of Selected Chemicals and Compounds Used in Photovoltaic Cells
Chemical CAS
Molecular Weight (g/mol) Water Solubility Vapor Pressure Description Comments
Hydrogen sulfide 7783-06-4 34.08 In water, 3980 mg/l at 20 deg C
1.56X104 mm Hg at 25 deg C
Colorless gas; strong odor of rotten eggs; sweetish taste.
Extremely hazardous gas which can be immediately life threatening at high concentrations (300 mg/m3 or 200 ppm).
Indium 7440-74-6 114.82 Unaffected by water Soft, white metal with bluish tinge
Quite stable in air; very resistant to alkalies
Isopropyl alcohol 67-63-0 60.09 Miscible with water Flammable liquid; slight odor resembling that of a mixture of ethanol and acetone; slightly bitter taste (not potable)
LD50 (orally) in rats - 5.8 g/kg
Methanol 67-56-1 32.04 1163000 mg/L; miscible with water
Flammable, poisonous, mobile liquid; slight alcoholic odor when pure; crude material may have a repulsive, pungent odor
Usually is a better solvent than ethanol; dissolves many inorganic salts
Nitric acid 7697-37-2 63.01 Miscible with water 62 mm Hg at 25 deg C
Transparent, colorless or yellowish liquid; characteristic choking odor
Corrosive; attacks almost all metals; reacts violently with alcohol, turpentine, charcoal, organic refuse
Phosphine 7803-51-2 34 Slightly soluble in water (0.26 vol @ 20 deg C).
20 atm at 3 deg C Poisonous gas; almost odorless in purest form but odor of decaying fish when occurring industrially
Combines violently with oxygen and halogen; forms phosphonium salts when brought in contact with halogen acids; lowest lethal concentration for hamsters (inhalation) - 8 ppm
Silane 7803-62-5 32.12 Slowly decomposes in water
Colorless gas, repulsive odor
Pyrophoric gas; self ignites in air or an atmosphere of chlorine
Silicon nitride 12033-89-5
140.28 Gray, amorphous powder or crystal
Used as high temperature engineering material for use in gas turbines, diesel engines
B-4

Physical and Chemical Properties of Selected Chemicals and Compounds Used in Photovoltaic Cells
Chemical CAS
Molecular Weight (g/mol) Water Solubility Vapor Pressure Description Comments
Silicon tetrafluoride 7783-61-1 104.08 Hydrolyzed by water; Decomposed by water into silic acid and HF
Colorless gas; very pungent odor
Forms heavy clouds with moist air
Sodium hydroxide 1310-73-2 40 29.6 g/100 g water at 0 deg C; 53.3 g/100 g water at 25 deg C; 77.6 g/100g water at 100 deg C
White solid; fused solid with crystalline fracture
Corrosive to animal and vegetable tissue; corrosive to aluminum metal in the presence of moisture; generates considerable heat when dissolving or when mixed with an acid; LD50 (orally) in rabbits - 500 mg/kg
Sulfuric acid 7664-93-9 98.08 Miscible with water Clear, colorless, oily liquid
Very corrosive; absorbs moisture from atmosphere; can char organic materials; LD50 (orally) in rats - 2.14 g/kg
Tantalum pentoxide 1314-61-0 441.89 Insoluble in water White, microcrystalline, infusible powder
LD50 (orally) in rats - 8000 mg/kg
Tellurium 13494-80-9
127.6 Insoluble in water Grayish-white, lustrous, brittle, crystalline solid, hexagonal, rhombohedral structure, or dark-gray to brown, amorphous powder with metal characteristics
Burns in air with a greenish-blue flame, forming the dioxide; reacts with nitric acid; combines with halogens
Thiourea 2.8X10^(-3) mm Hg at 25 deg C; 8.85X10^(-4) mm Hg at 93.9 deg C
62-56-6 76.12 Soluble in 11 parts water; 10 g/100 g water at 20 deg C
Crystals Forms addition compounds with metallic salts; LD50 (oral) in Norway rats - 1830 mg/kg
Tin 7440-31-5 118.69 Insoluble in water 1 mm Hg at 1492 deg C
Almost silver-white, lustrous soft, very malleable & ductile metal; highly crystalline; odorless.
Generally considered to be of low toxicity
B-5
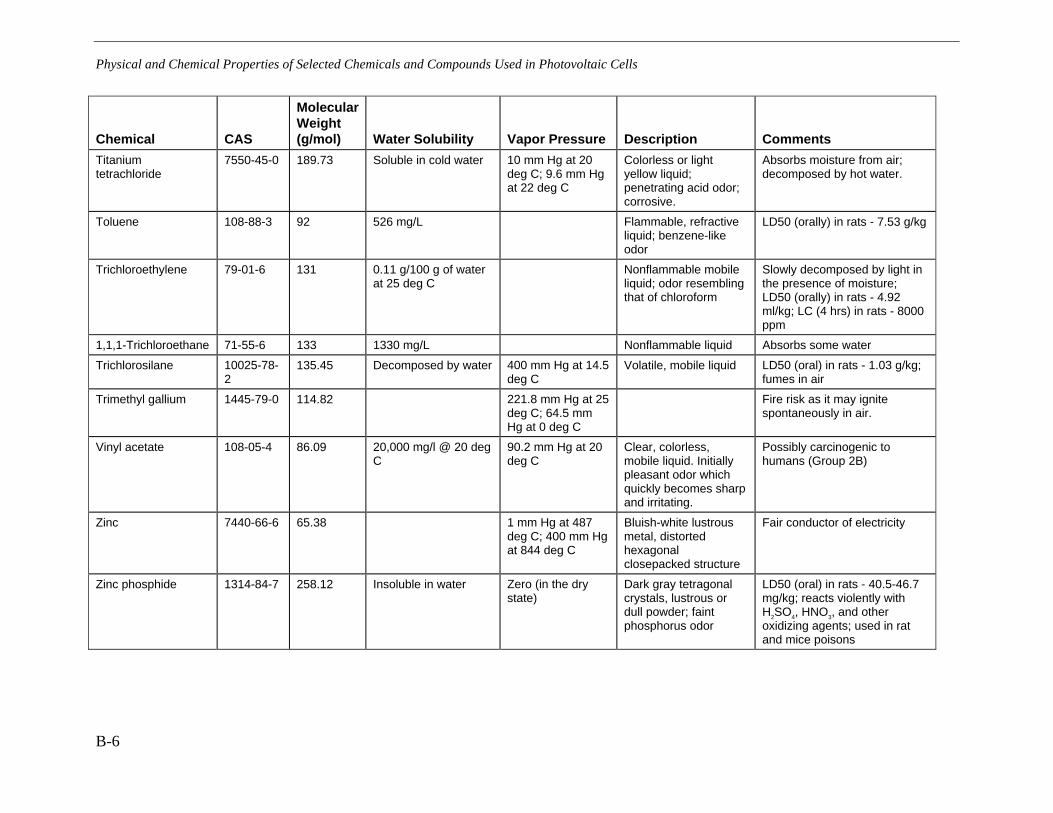
Physical and Chemical Properties of Selected Chemicals and Compounds Used in Photovoltaic Cells
B-6
Chemical CAS
Molecular Weight (g/mol) Water Solubility Vapor Pressure Description Comments
Titanium tetrachloride
Absorbs moisture from air; decomposed by hot water.
7550-45-0 189.73 Soluble in cold water 10 mm Hg at 20 deg C; 9.6 mm Hg at 22 deg C
Colorless or light yellow liquid; penetrating acid odor; corrosive.
Toluene 108-88-3 92 526 mg/L Flammable, refractive liquid; benzene-like odor
LD50 (orally) in rats - 7.53 g/kg
Trichloroethylene 79-01-6 131 0.11 g/100 g of water at 25 deg C
Nonflammable mobile liquid; odor resembling that of chloroform
Slowly decomposed by light in the presence of moisture; LD50 (orally) in rats - 4.92 ml/kg; LC (4 hrs) in rats - 8000 ppm
1,1,1-Trichloroethane 71-55-6 133 1330 mg/L Nonflammable liquid Absorbs some water
Trichlorosilane 10025-78-2
135.45 Decomposed by water 400 mm Hg at 14.5 deg C
Volatile, mobile liquid LD50 (oral) in rats - 1.03 g/kg; fumes in air
Trimethyl gallium 1445-79-0 114.82 221.8 mm Hg at 25 deg C; 64.5 mm Hg at 0 deg C
Fire risk as it may ignite spontaneously in air.
Vinyl acetate Possibly carcinogenic to humans (Group 2B)
108-05-4 86.09 20,000 mg/l @ 20 deg C
90.2 mm Hg at 20 deg C
Clear, colorless, mobile liquid. Initially pleasant odor which quickly becomes sharp and irritating.
Zinc 1 mm Hg at 487 deg C; 400 mm Hg at 844 deg C
7440-66-6 65.38 Bluish-white lustrous metal, distorted hexagonal closepacked structure
Fair conductor of electricity
Zinc phosphide 1314-84-7 258.12 Insoluble in water Zero (in the dry state)
Dark gray tetragonal crystals, lustrous or dull powder; faint phosphorus odor
LD50 (oral) in rats - 40.5-46.7 mg/kg; reacts violently with H2SO4, HNO3, and other oxidizing agents; used in rat and mice poisons
© 2003 Electric Power Research Institute (EPRI), Inc.All rightsreserved. Electric Power Research Institute and EPRI are registered service marks of the Electric Power Research Institute, Inc.EPRI. ELECTRIFY THE WORLD is a service mark of the ElectricPower Research Institute, Inc.
Printed on recycled paper in the United States of America
1000095
Program:
Groundwater Protection and Combustion By-Products Management
EPRI • 3412 Hillview Avenue, Palo Alto, California 94304 • PO Box 10412, Palo Alto, California 94303 • USA800.313.3774 • 650.855.2121 • [email protected] • www.epri.com
About EPRI
EPRI creates science and technology solutions for
the global energy and energy services industry. U.S.
electric utilities established the Electric Power
Research Institute in 1973 as a nonprofit research
consortium for the benefit of utility members, their
customers, and society. Now known simply as EPRI,
the company provides a wide range of innovative
products and services to more than 1000 energy-
related organizations in 40 countries. EPRI’s
multidisciplinary team of scientists and engineers
draws on a worldwide network of technical and
business expertise to help solve today’s toughest
energy and environmental problems.
EPRI. Electrify the World
About PIER
The Public Interest Energy Research (PIER) Program
supports public interest energy research and
development that will help improve the quality of
life in California by bringing environmentally safe,
affordable and reliable energy services and products
to the marketplace.
The PIER Program annually awards up to $62 million
to conduct the most promising public interest
energy research by partnering with RD&D
organizations including individuals, businesses,
utilities and public or private research institutions.
PIER brings new energy services and products to
the marketplace and creates state-wide
environmental and economic benefits.