“potential effects of climate change on the...
TRANSCRIPT
University of South Carolina
“Potential Effects of Climate Change on the Ecotoxicology of
Pesticides and Contaminants of Emerging Concern: Implications
for Ocean Acidification Interactions ”
Geoffrey I. Scott
Professor and Chair
Dept. of Env. Health Sciences
Arnold School of Public Health
University of South Carolina
Columbia, SC 29208
(email: [email protected]; Phone: 803/777-8964)
Collaborators
NOAA, NOS, NCCOS, Coastal Center for Environmental Health and Biomolecular Research and Hollings Marine Laboratory, Center of Excellence in Oceans and Human Health Research
Mike Fulton, Marie De Lorenzo, Paul Pennington, Ed Wirth and Jan Moore
University of South Carolina, Arnold School of Public Health and Baruch Institute
Tom Chandler, Sean Norman, and Dwayne Porter
Centre for Atmospheric Research Experiments, Environment Canada
Terry Biddleman
NOAA, National Climate Data Center
Thomas C. Peterson
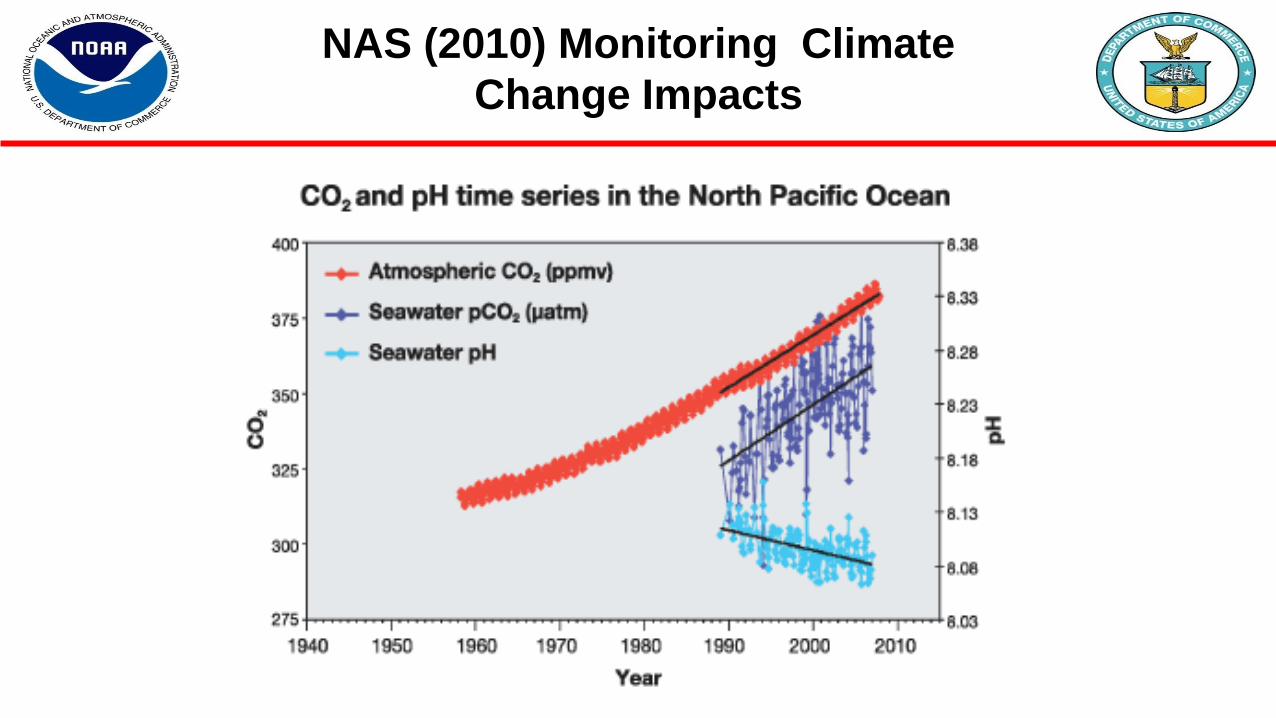
NAS (2010) Monitoring Climate
Change Impacts
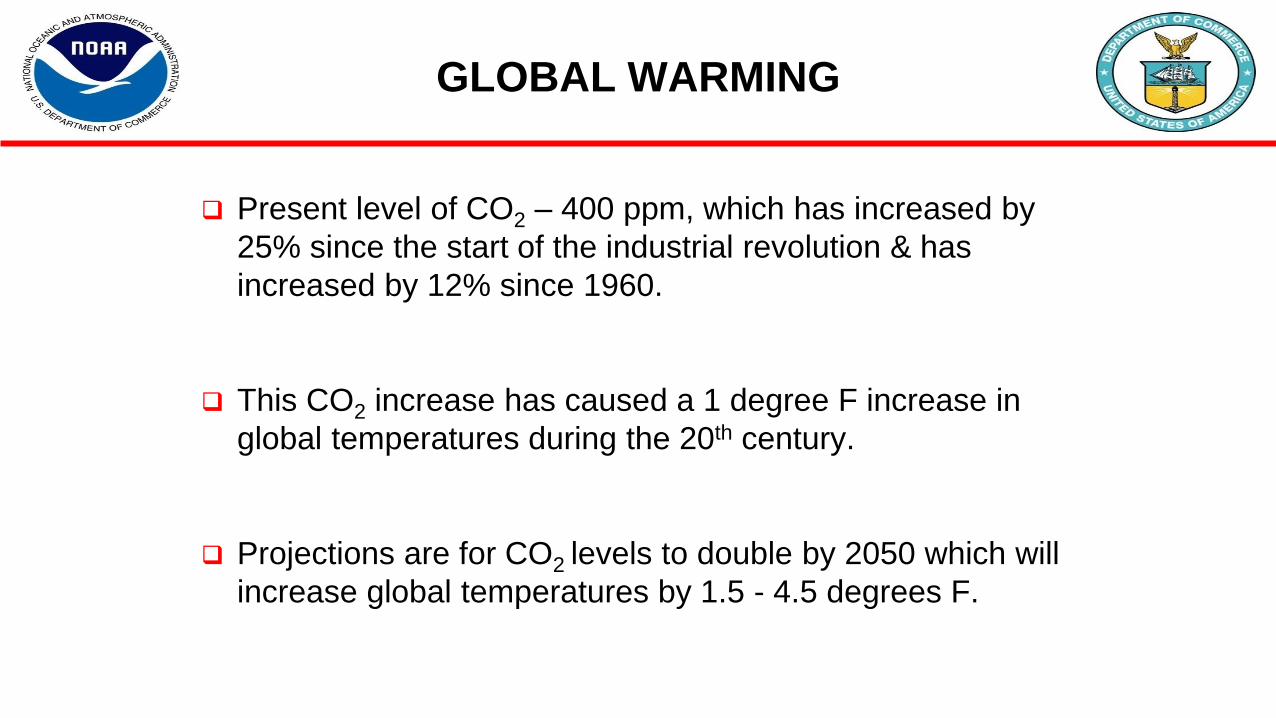
GLOBAL WARMING
Present level of CO2 – 400 ppm, which has increased by
25% since the start of the industrial revolution & has
increased by 12% since 1960.
This CO2 increase has caused a 1 degree F increase in
global temperatures during the 20th century.
Projections are for CO2 levels to double by 2050 which will
increase global temperatures by 1.5 - 4.5 degrees F.
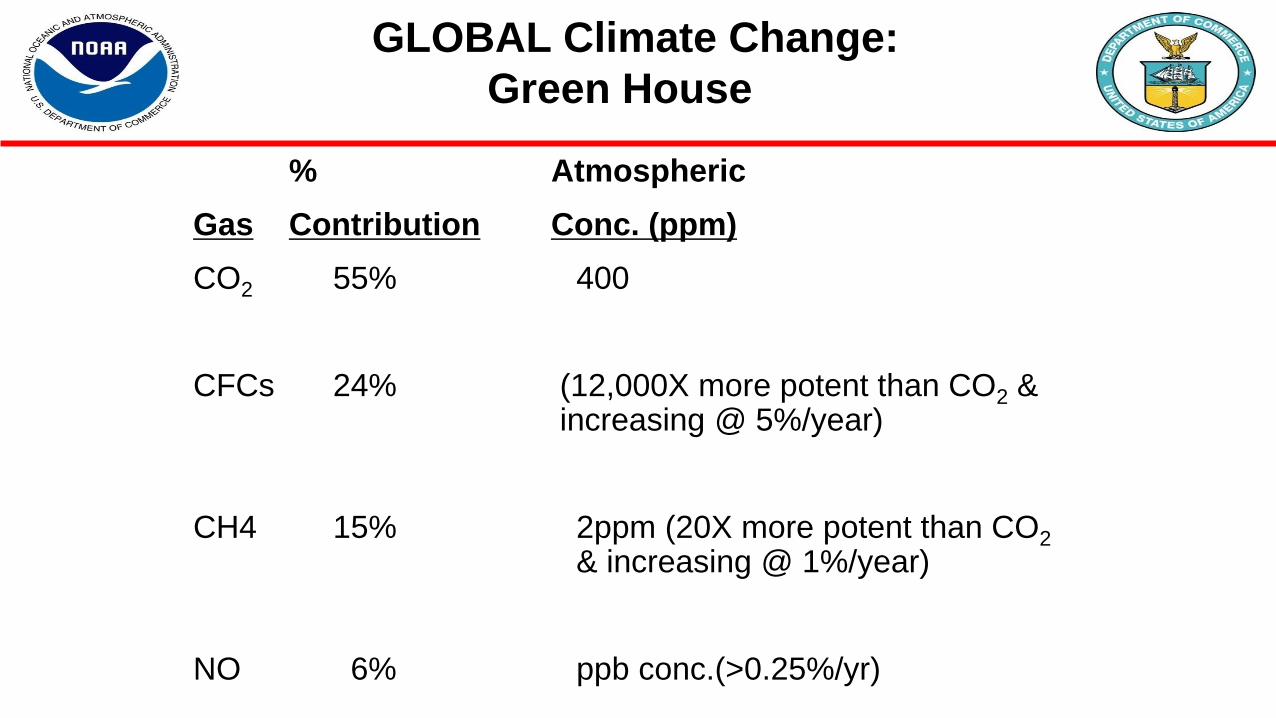
GLOBAL Climate Change:
Green House Gases
% Atmospheric
Gas Contribution Conc. (ppm)
CO2 55% 400
CFCs 24% (12,000X more potent than CO2 & increasing @ 5%/year)
CH4 15% 2ppm (20X more potent than CO2
& increasing @ 1%/year)
NO 6% ppb conc.(>0.25%/yr)
6FIFRA SAP, Washington, D.C., December 7, 2010 6
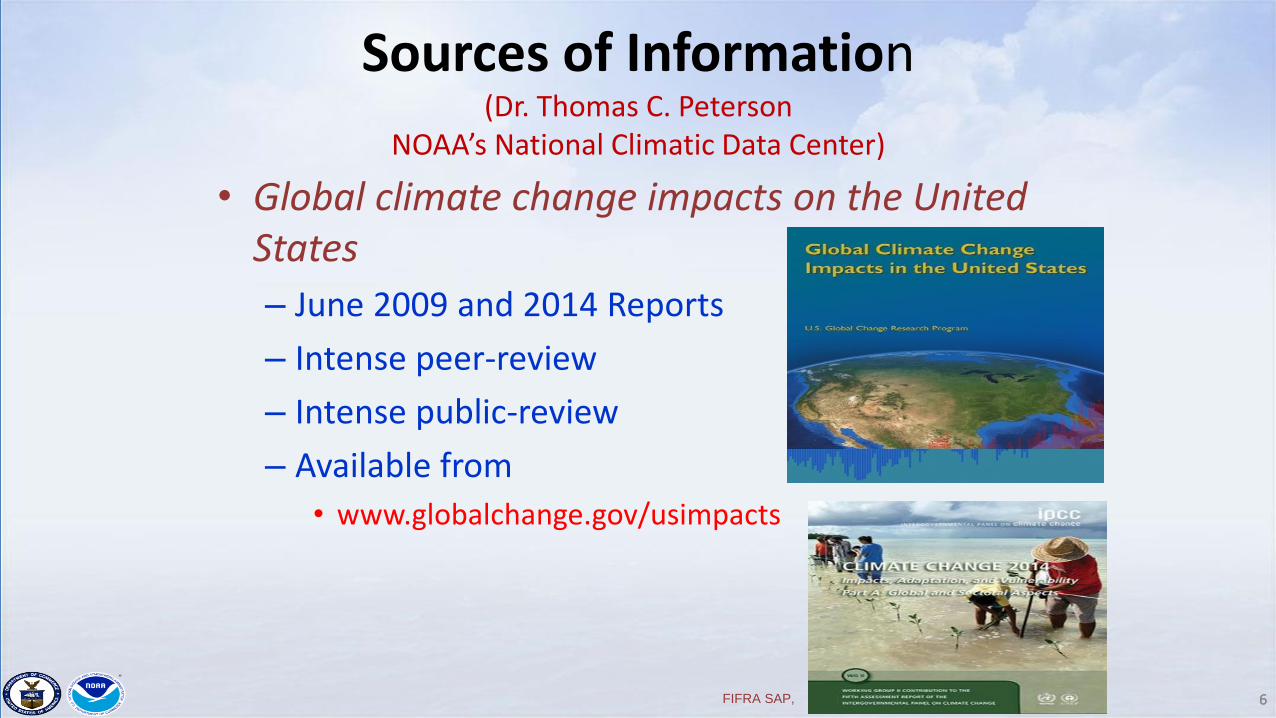
Sources of Information(Dr. Thomas C. Peterson
NOAA’s National Climatic Data Center)
• Global climate change impacts on the United States
– June 2009 and 2014 Reports
– Intense peer-review
– Intense public-review
– Available from
• www.globalchange.gov/usimpacts
7FIFRA SAP, Washington, D.C., December 7, 2010
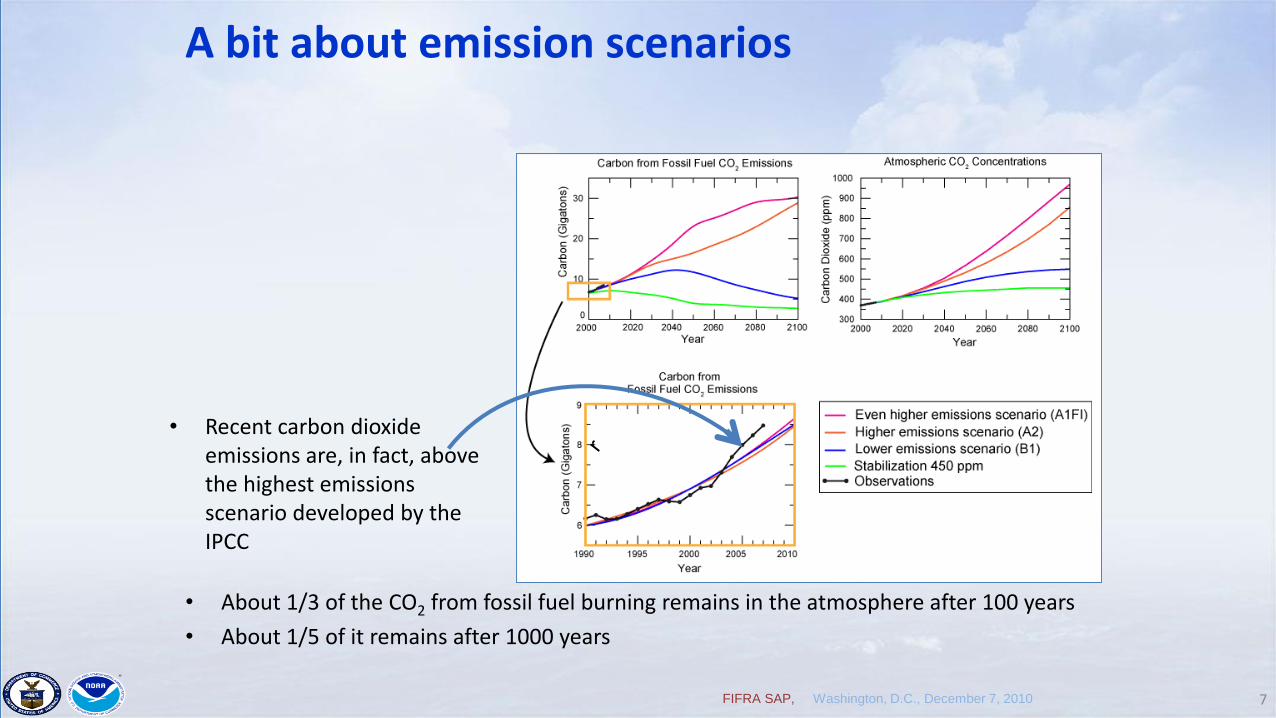
• About 1/3 of the CO2 from fossil fuel burning remains in the atmosphere after 100 years
• About 1/5 of it remains after 1000 years
A bit about emission scenarios
• Recent carbon dioxide emissions are, in fact, above the highest emissions scenario developed by the IPCC
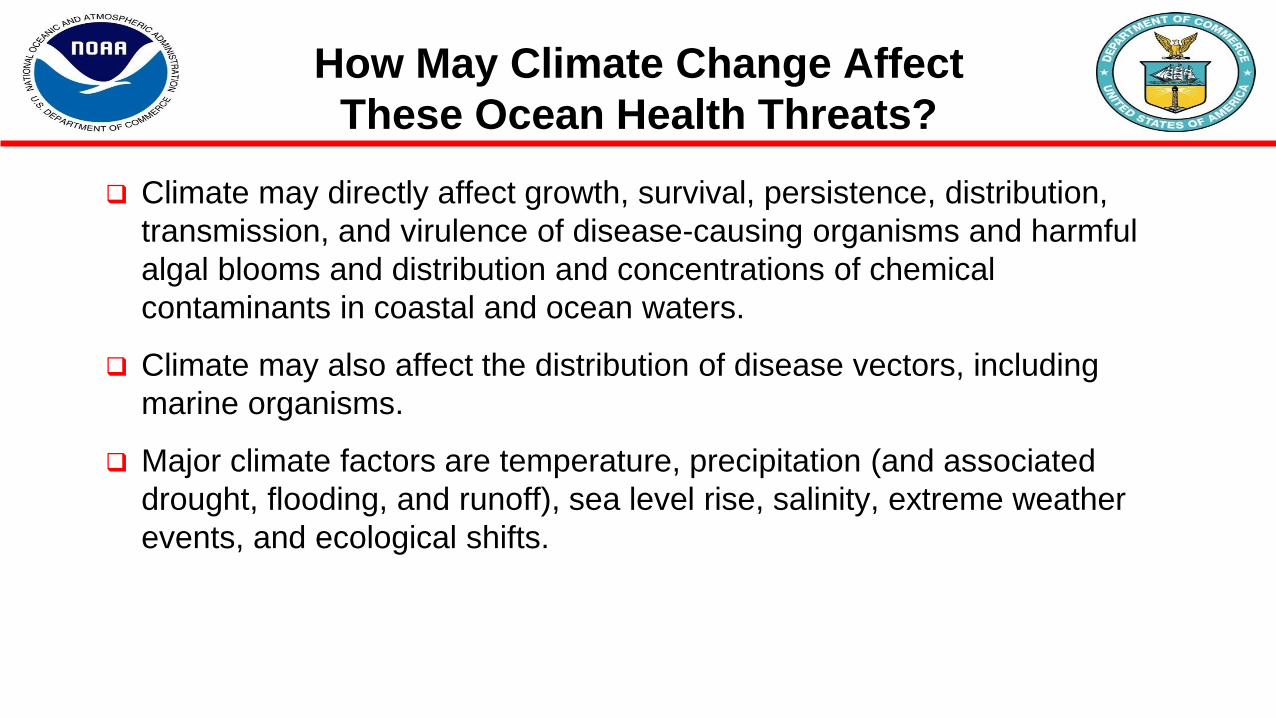
How May Climate Change Affect
These Ocean Health Threats?
Climate may directly affect growth, survival, persistence, distribution,
transmission, and virulence of disease-causing organisms and harmful
algal blooms and distribution and concentrations of chemical
contaminants in coastal and ocean waters.
Climate may also affect the distribution of disease vectors, including
marine organisms.
Major climate factors are temperature, precipitation (and associated
drought, flooding, and runoff), sea level rise, salinity, extreme weather
events, and ecological shifts.
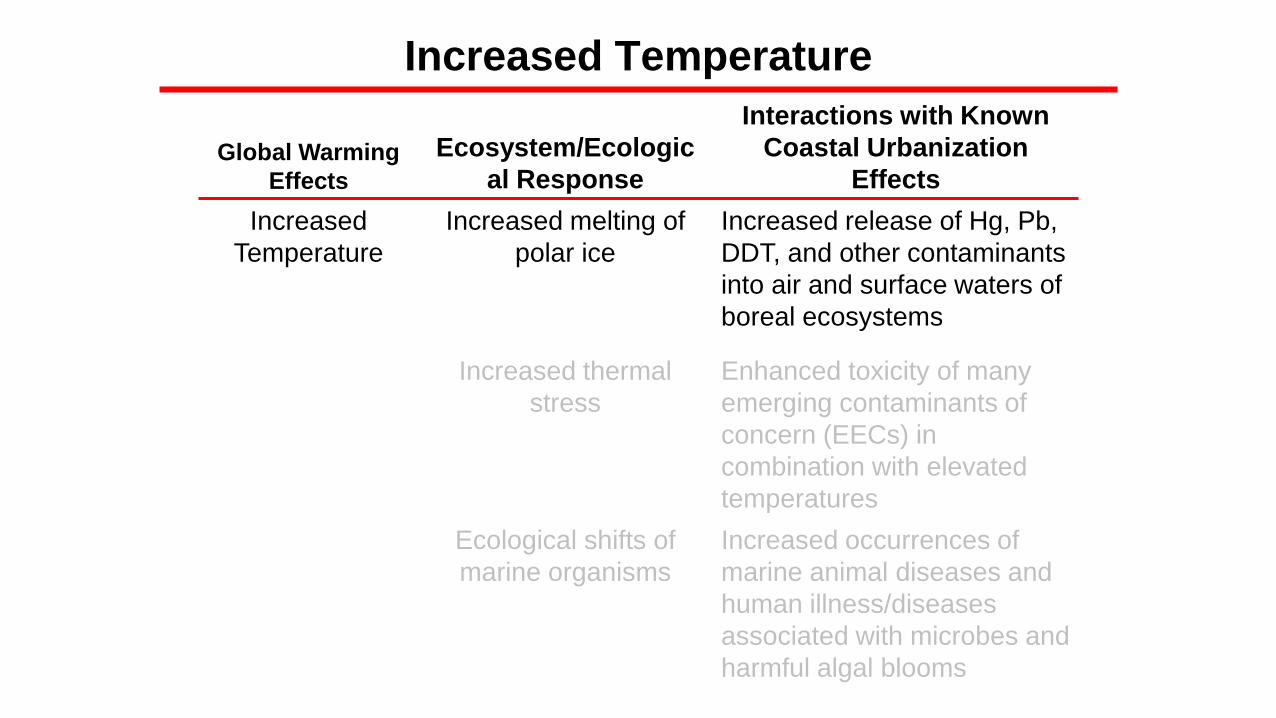
Increased Temperature
Global Warming
Effects
Ecosystem/Ecologic
al Response
Interactions with Known
Coastal Urbanization
Effects
Increased
Temperature
Increased melting of
polar ice
Increased release of Hg, Pb,
DDT, and other contaminants
into air and surface waters of
boreal ecosystems
Increased thermal
stress
Enhanced toxicity of many
emerging contaminants of
concern (EECs) in
combination with elevated
temperatures
Ecological shifts of
marine organisms
Increased occurrences of
marine animal diseases and
human illness/diseases
associated with microbes and
harmful algal blooms
10FIFRA SAP, Washington, D.C., December 7, 2010
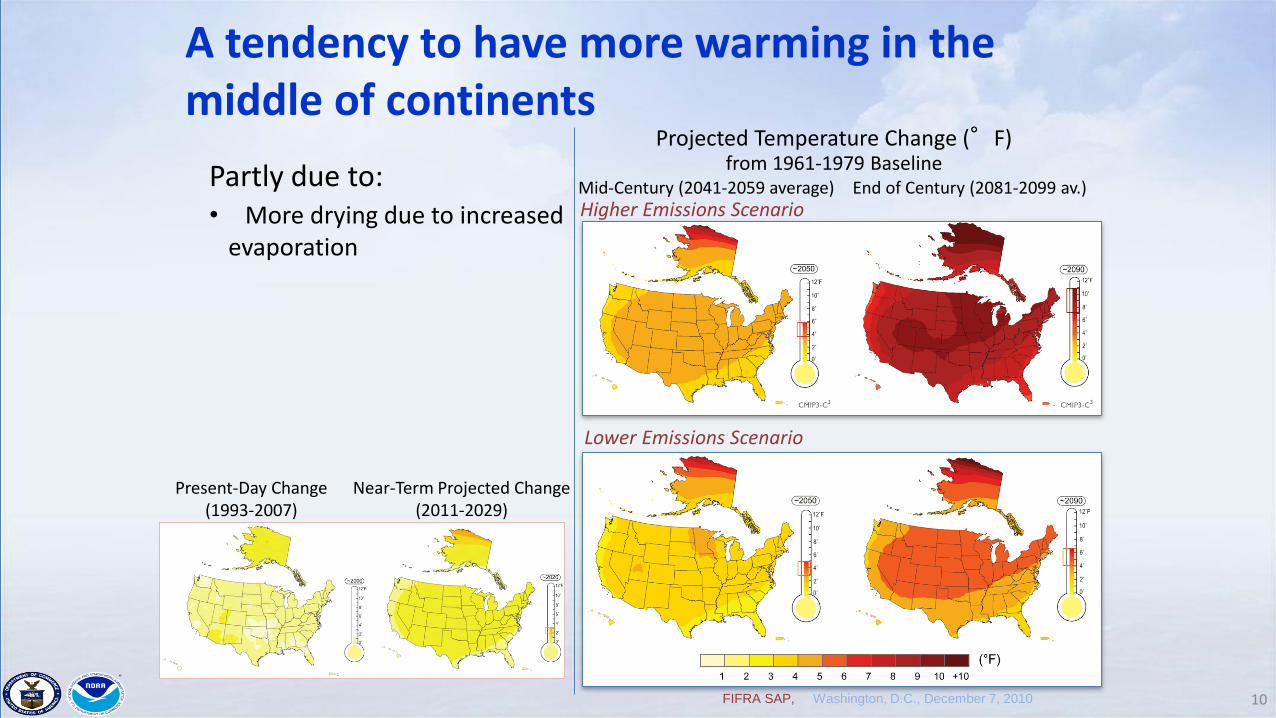
Projected Temperature Change (°F) from 1961-1979 Baseline
A tendency to have more warming in the middle of continents
Higher Emissions Scenario
Present-Day Change(1993-2007)
Near-Term Projected Change(2011-2029)
Lower Emissions Scenario
Mid-Century (2041-2059 average) End of Century (2081-2099 av.)Partly due to: • More drying due to increased
evaporation
11FIFRA SAP, Washington, D.C., December 7, 2010
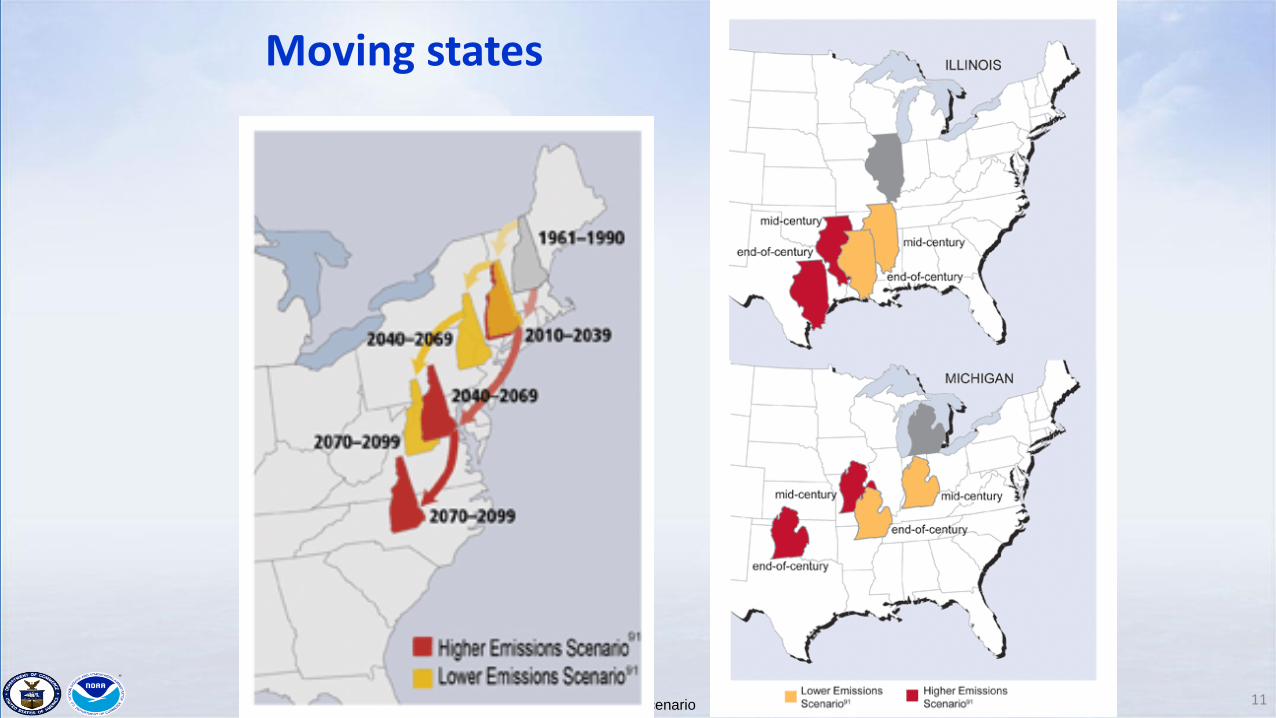
Moving states
Even higher emission scenario
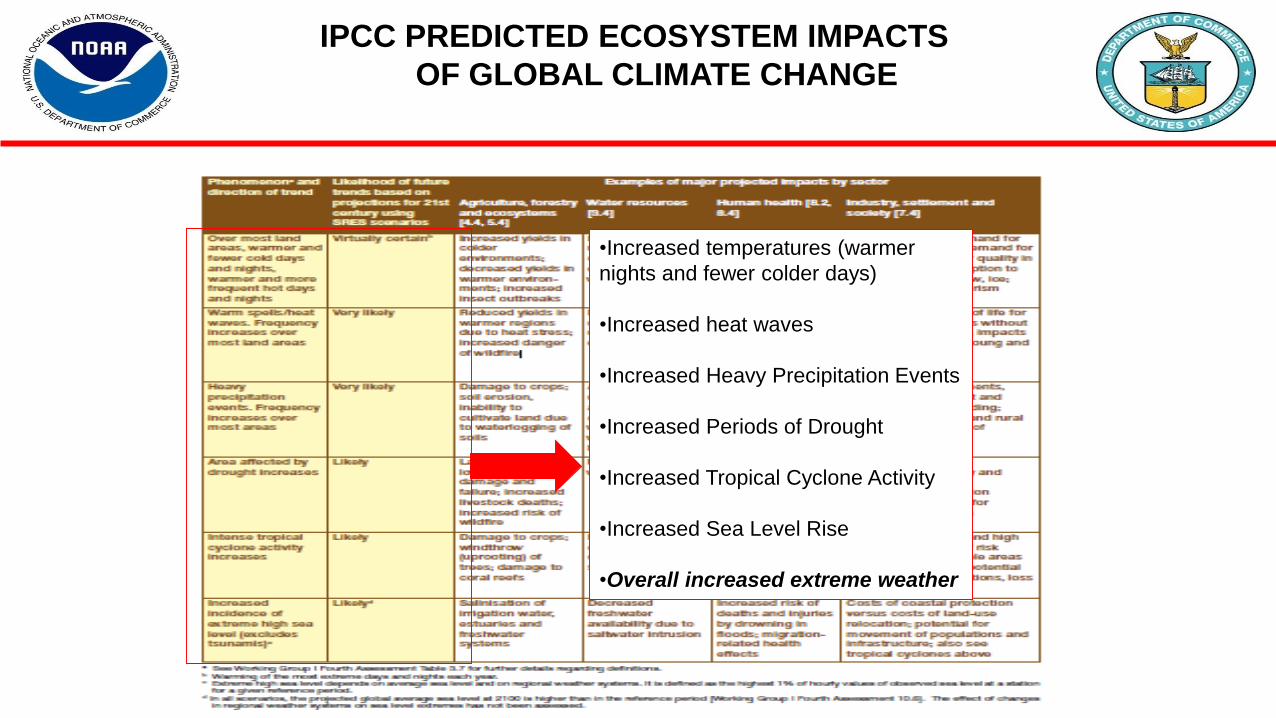
IPCC PREDICTED ECOSYSTEM IMPACTS
OF GLOBAL CLIMATE CHANGE
•Increased temperatures (warmer
nights and fewer colder days)
•Increased heat waves
•Increased Heavy Precipitation Events
•Increased Periods of Drought
•Increased Tropical Cyclone Activity
•Increased Sea Level Rise
•Overall increased extreme weather
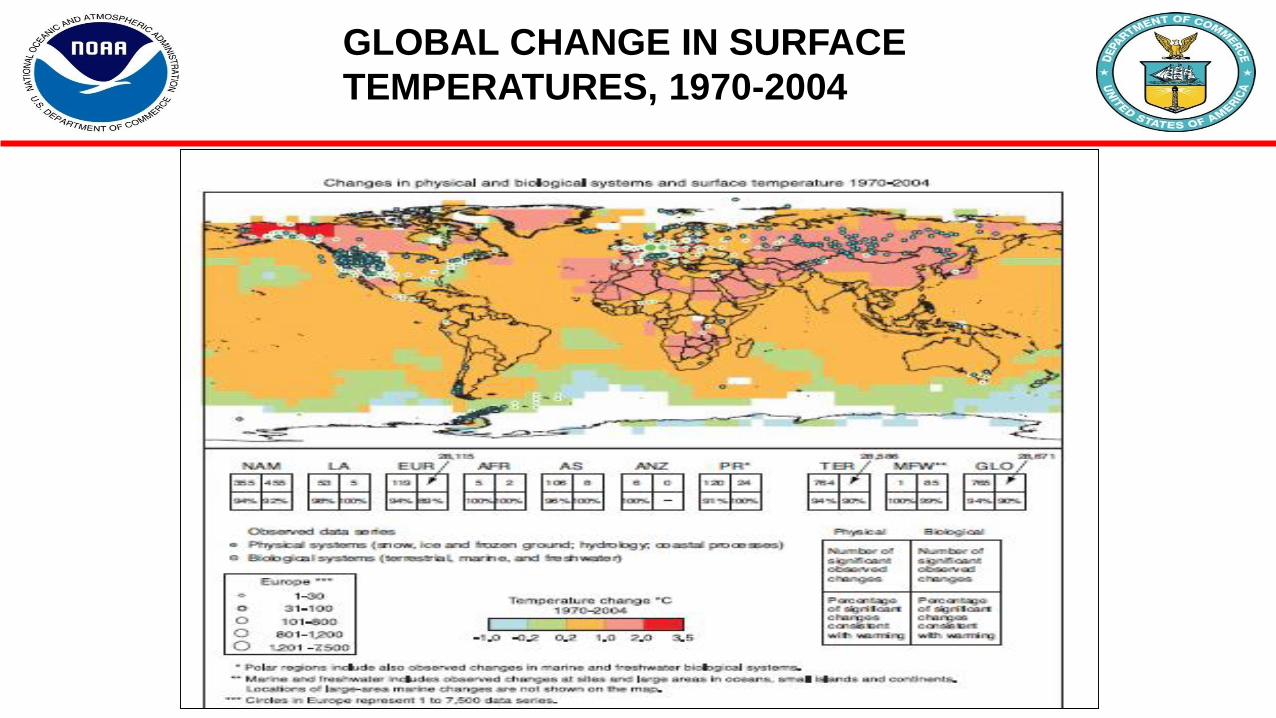
GLOBAL CHANGE IN SURFACE
TEMPERATURES, 1970-2004
Global Warming:
Melting of Polar Ice
Temperatures in the Arctic are rising at almost twice the rate of that of the rest of
the world.
According to the multinational Arctic Climate Impact Assessment, at least half of
the Arctic's summer sea ice will melt by the century's end. The Arctic region is
likely to warm 7 to 13 degrees Fahrenheit (4 to 7 degrees Celsius) during
the same time.
By all accounts, the glaciers of Greenland are melting twice as fast as they were
five years ago. Recorded spring temperatures on the ice cap have reached
almost 20 degrees above normal, hovering just below freezing.
Glaciers in British Columbia have shrunk by 16 percent in total area between
1985 and 2000.
Average temperatures worldwide have increased by 0.6 degrees Celsius, which
is enough to raise sea levels and change rainfall patterns.
Average temperature in Antarctica has increased 60C over the past 30
years.
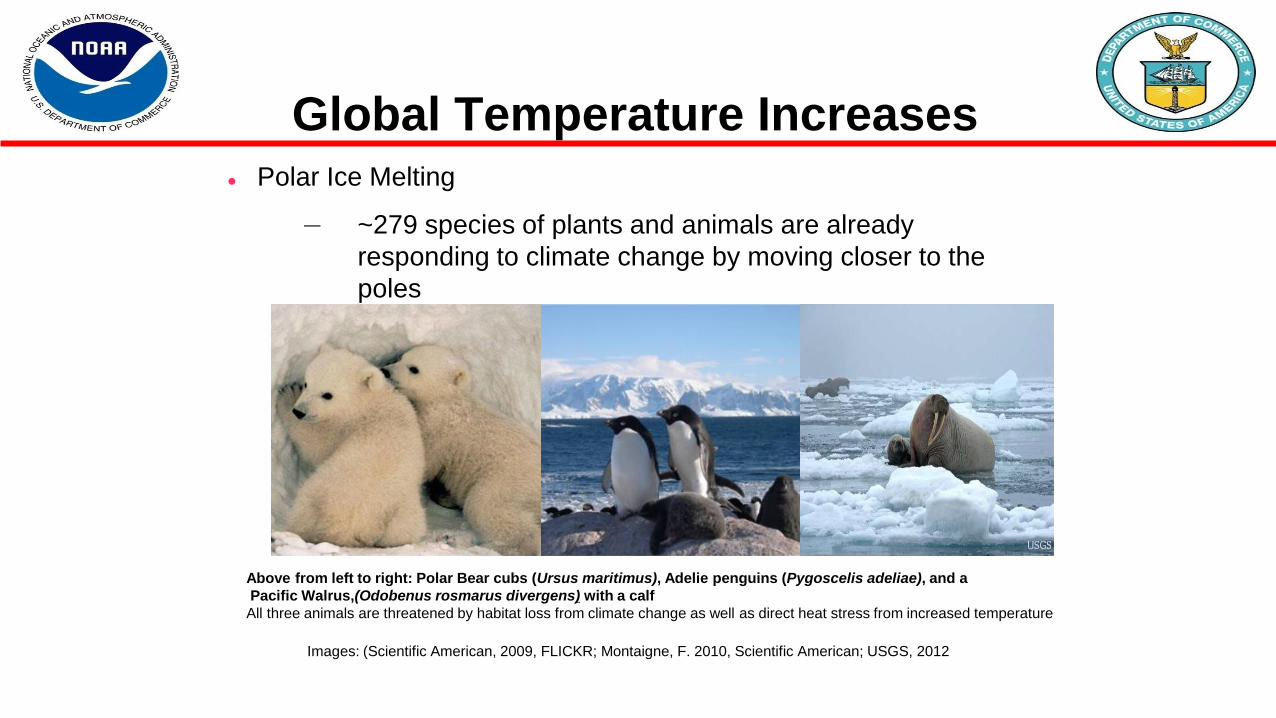
Global Temperature Increases Polar Ice Melting
– ~279 species of plants and animals are already
responding to climate change by moving closer to the
poles
( Gore, A., 2006;Issacson, A., 2011; Jay and Ficshbach, 2008; National Wildlife Federation, 2013)
Images: (Scientific American, 2009, FLICKR; Montaigne, F. 2010, Scientific American; USGS, 2012)
Above from left to right: Polar Bear cubs (Ursus maritimus), Adelie penguins (Pygoscelis adeliae), and a
Pacific Walrus,(Odobenus rosmarus divergens) with a calf
All three animals are threatened by habitat loss from climate change as well as direct heat stress from increased temperatures
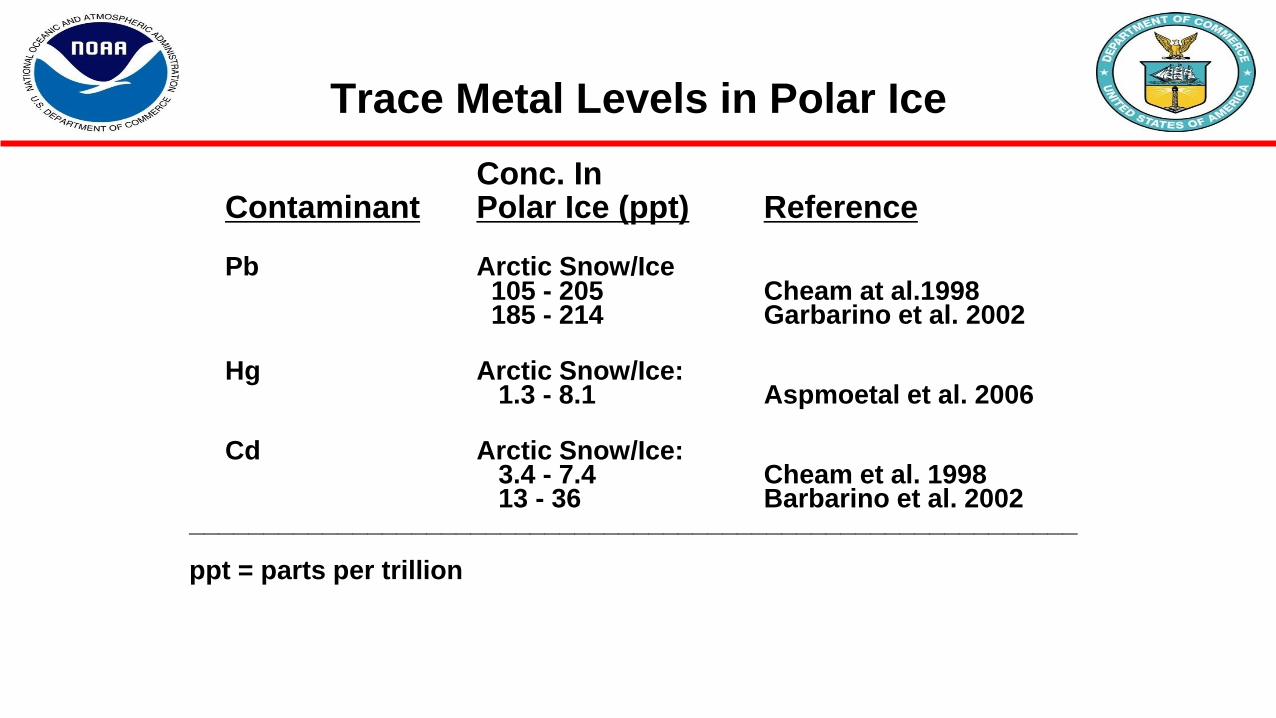
Trace Metal Levels in Polar Ice
Conc. In Contaminant Polar Ice (ppt) Reference
Pb Arctic Snow/Ice105 - 205 Cheam at al.1998185 - 214 Garbarino et al. 2002
Hg Arctic Snow/Ice:1.3 - 8.1 Aspmoetal et al. 2006
Cd Arctic Snow/Ice:3.4 - 7.4 Cheam et al. 199813 - 36 Barbarino et al. 2002
____________________________________________________________
ppt = parts per trillion
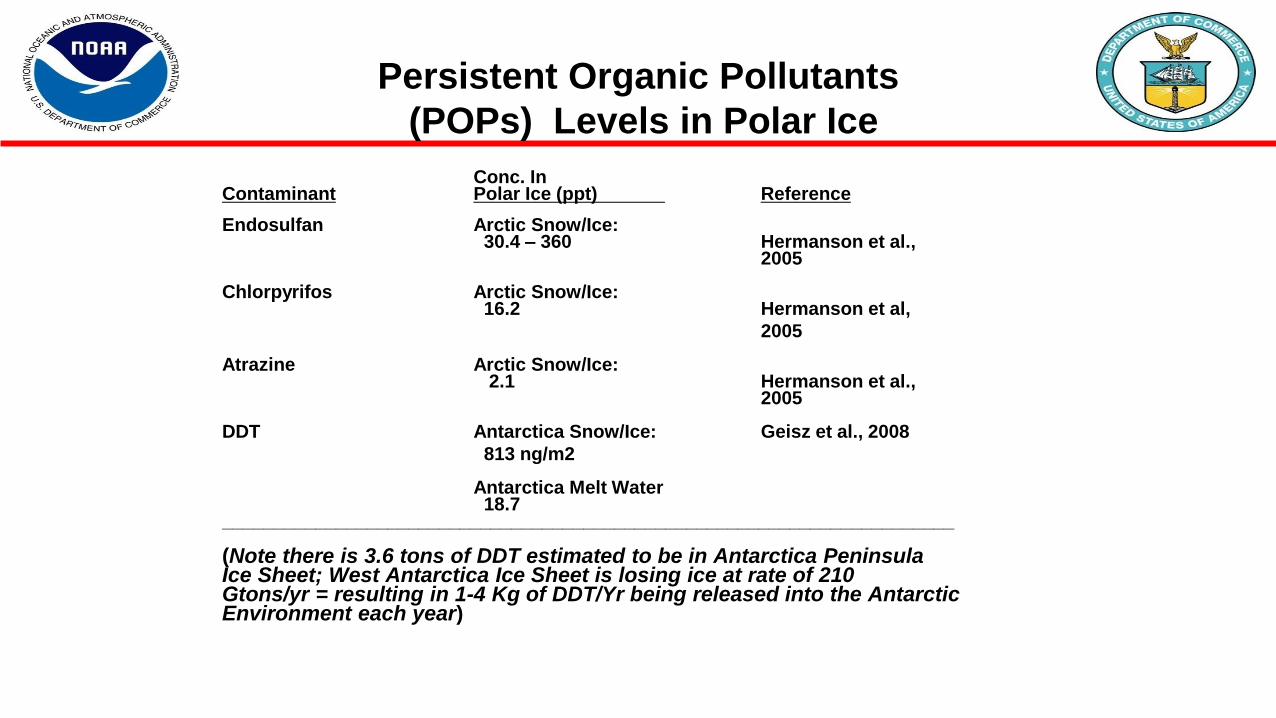
Persistent Organic Pollutants
(POPs) Levels in Polar Ice
Conc. In Contaminant Polar Ice (ppt) Reference
Endosulfan Arctic Snow/Ice:30.4 – 360 Hermanson et al.,
2005
Chlorpyrifos Arctic Snow/Ice:16.2 Hermanson et al,
2005
Atrazine Arctic Snow/Ice:2.1 Hermanson et al.,
2005
DDT Antarctica Snow/Ice: Geisz et al., 2008
813 ng/m2
Antarctica Melt Water18.7
_______________________________________________________________________
(Note there is 3.6 tons of DDT estimated to be in Antarctica Peninsula Ice Sheet; West Antarctica Ice Sheet is losing ice at rate of 210 Gtons/yr = resulting in 1-4 Kg of DDT/Yr being released into the Antarctic Environment each year)
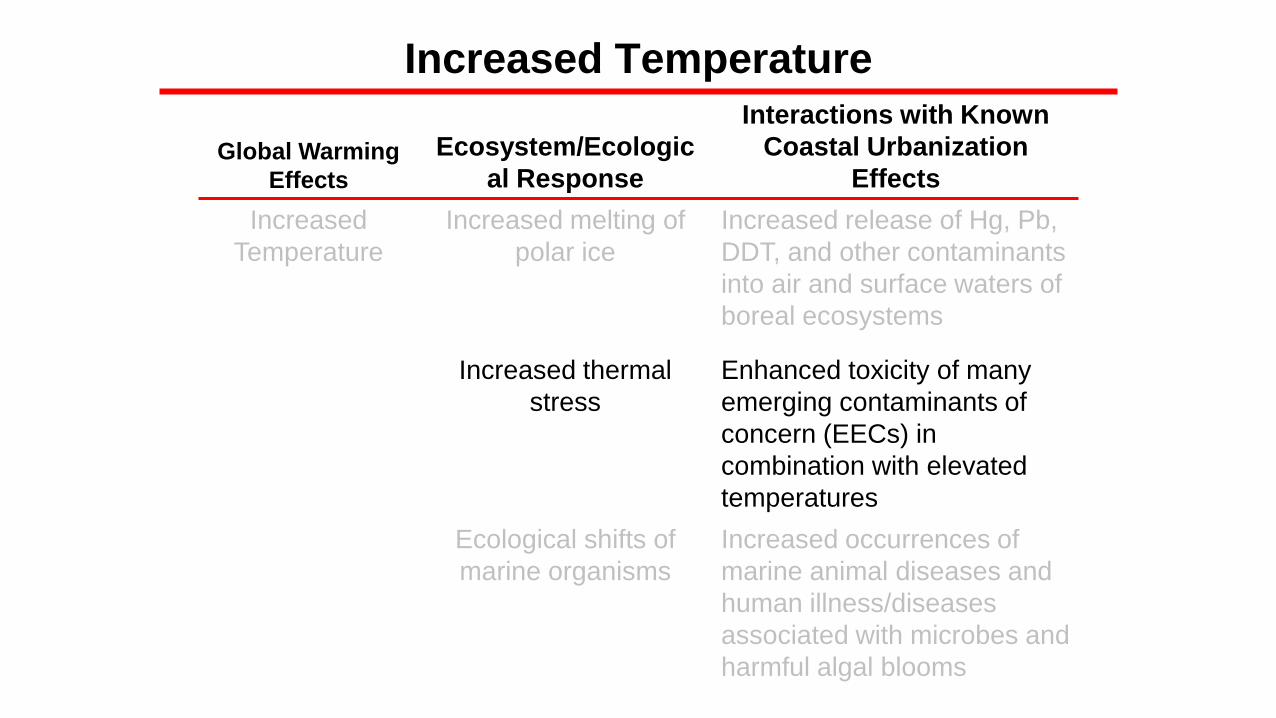
Increased Temperature
Global Warming
Effects
Ecosystem/Ecologic
al Response
Interactions with Known
Coastal Urbanization
Effects
Increased
Temperature
Increased melting of
polar ice
Increased release of Hg, Pb,
DDT, and other contaminants
into air and surface waters of
boreal ecosystems
Increased thermal
stress
Enhanced toxicity of many
emerging contaminants of
concern (EECs) in
combination with elevated
temperatures
Ecological shifts of
marine organisms
Increased occurrences of
marine animal diseases and
human illness/diseases
associated with microbes and
harmful algal blooms
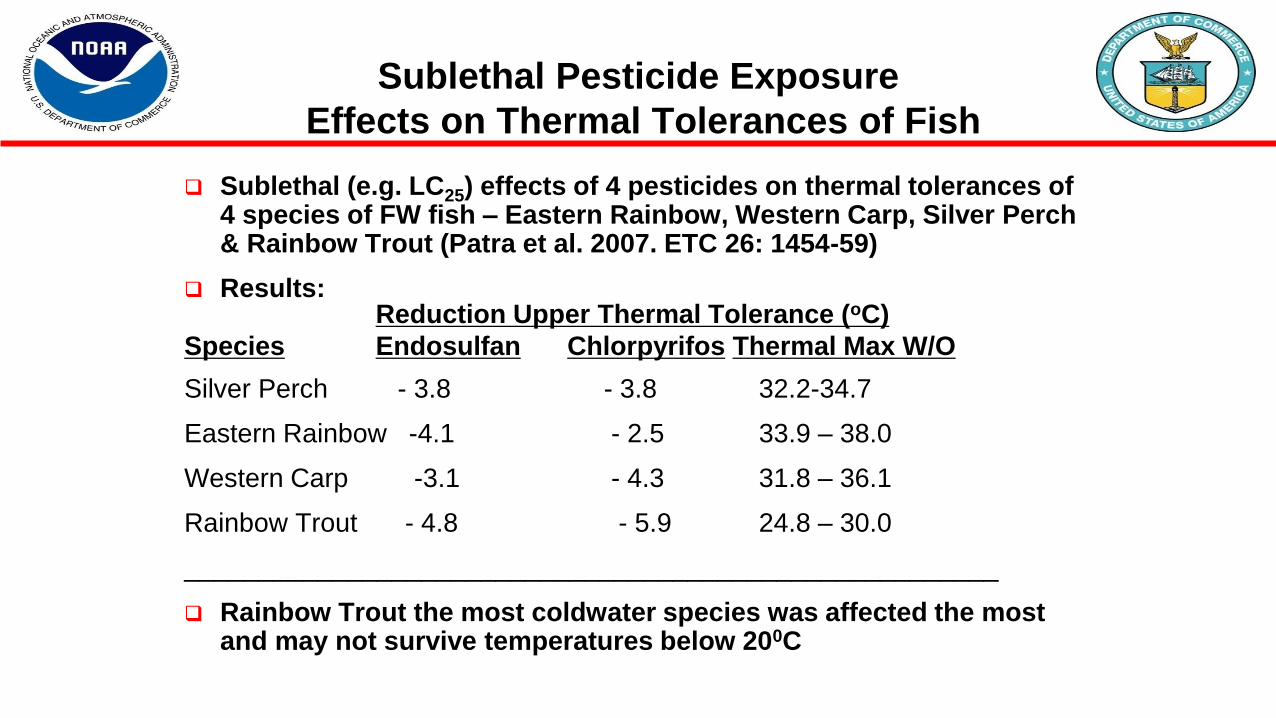
Sublethal Pesticide Exposure
Effects on Thermal Tolerances of Fish
Sublethal (e.g. LC25) effects of 4 pesticides on thermal tolerances of 4 species of FW fish – Eastern Rainbow, Western Carp, Silver Perch & Rainbow Trout (Patra et al. 2007. ETC 26: 1454-59)
Results:Reduction Upper Thermal Tolerance (oC)
Species Endosulfan Chlorpyrifos Thermal Max W/O
Silver Perch - 3.8 - 3.8 32.2-34.7
Eastern Rainbow -4.1 - 2.5 33.9 – 38.0
Western Carp -3.1 - 4.3 31.8 – 36.1
Rainbow Trout - 4.8 - 5.9 24.8 – 30.0
_______________________________________________________
Rainbow Trout the most coldwater species was affected the most and may not survive temperatures below 200C
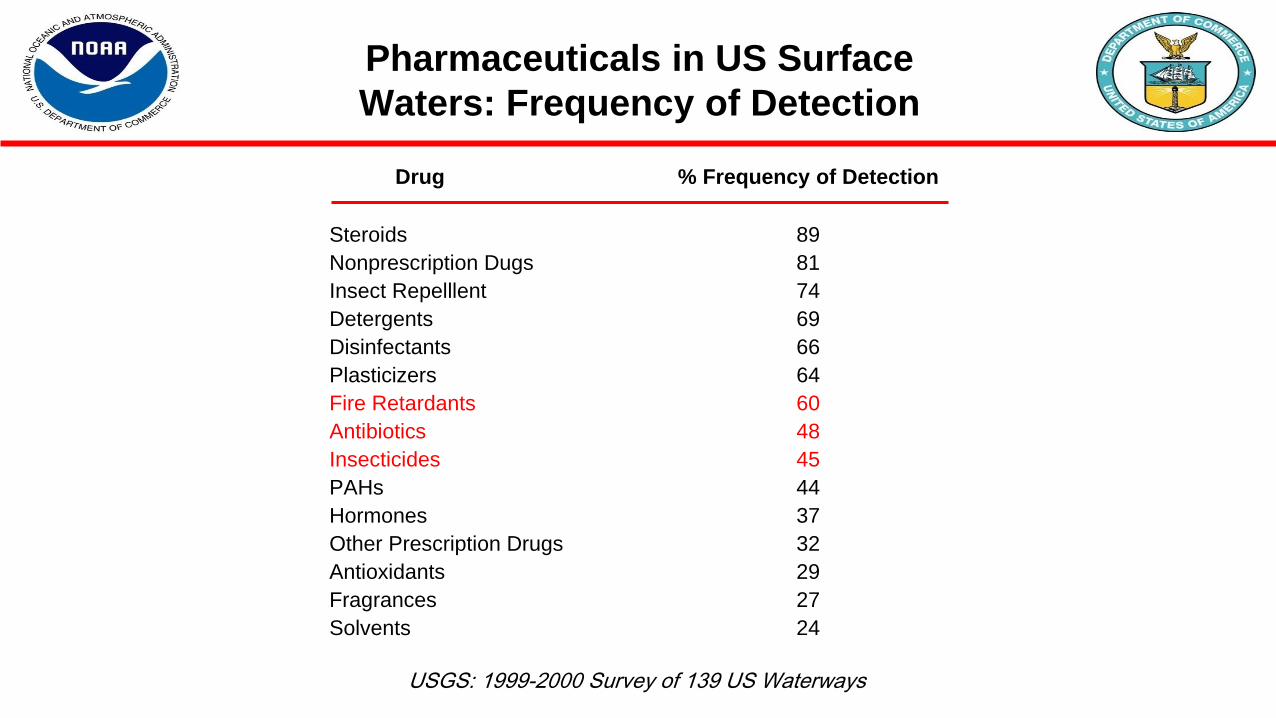
Drug % Frequency of Detection
Steroids 89
Nonprescription Dugs 81
Insect Repelllent 74
Detergents 69
Disinfectants 66
Plasticizers 64
Fire Retardants 60
Antibiotics 48
Insecticides 45
PAHs 44
Hormones 37
Other Prescription Drugs 32
Antioxidants 29
Fragrances 27
Solvents 24
USGS: 1999-2000 Survey of 139 US Waterways
Pharmaceuticals in US Surface
Waters: Frequency of Detection
0
500
1000
1500
2000
2500
3000
3500
Baltic
Sea
Ringed
seal
Beaufort
Sea
Polar
bear
CHS
SC
IRL
FL
bottlenose dolphin
Riccione,
Italy
captive
Midwest
USA
Bald
eagle
USA
Human
Canada
Human
Production
Plant
Workers,
USA
Human
PF
OS
(n
g/m
L=
pp
b)
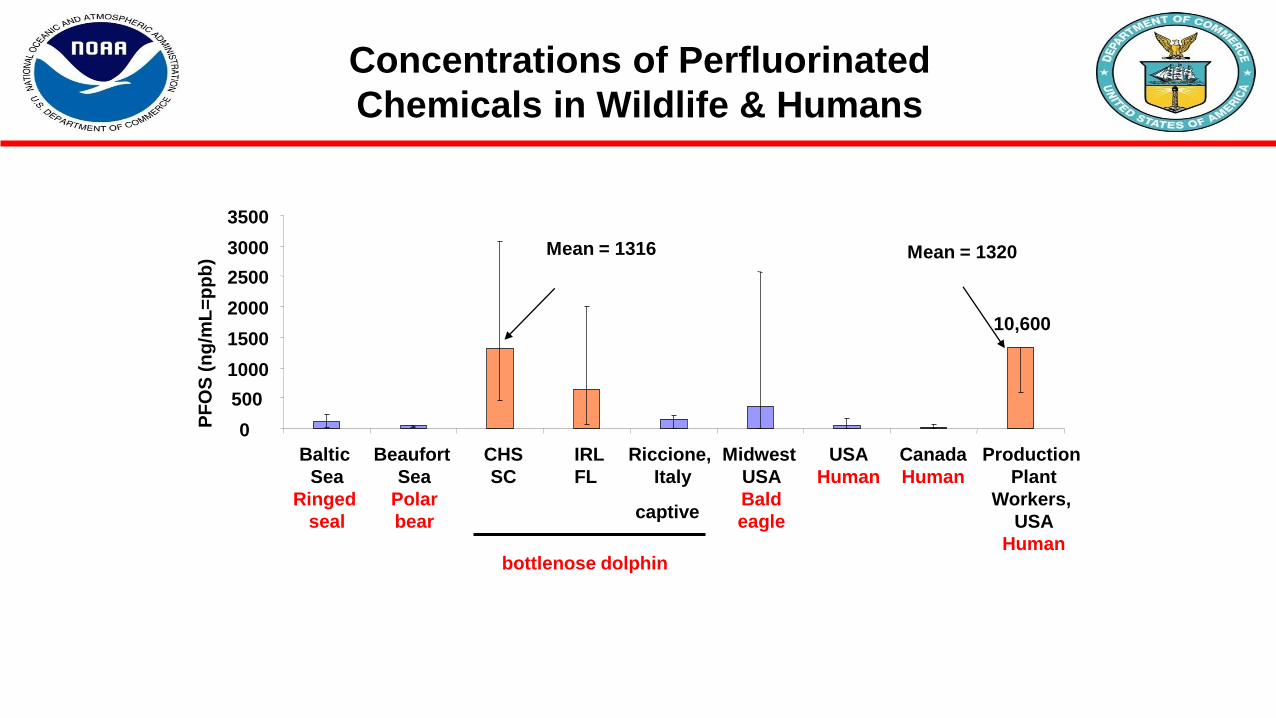
10,600
Mean = 1316 Mean = 1320
Concentrations of Perfluorinated
Chemicals in Wildlife & Humans
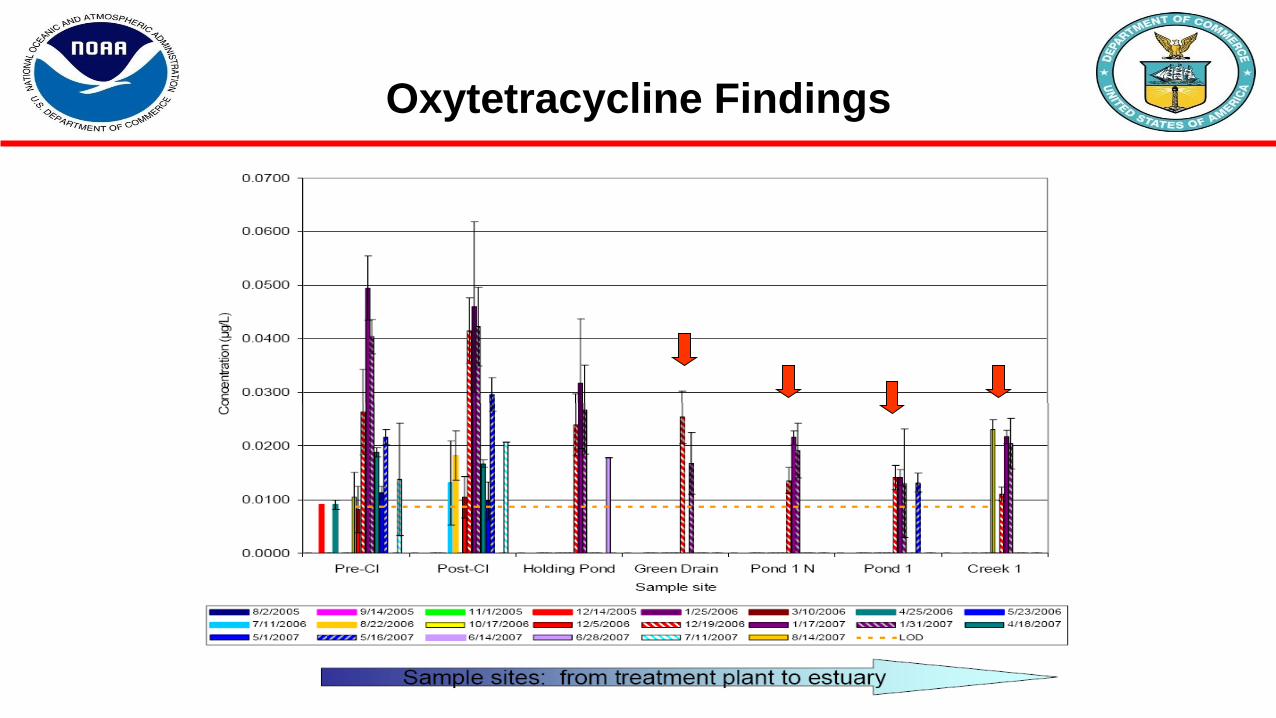
Oxytetracycline Findings
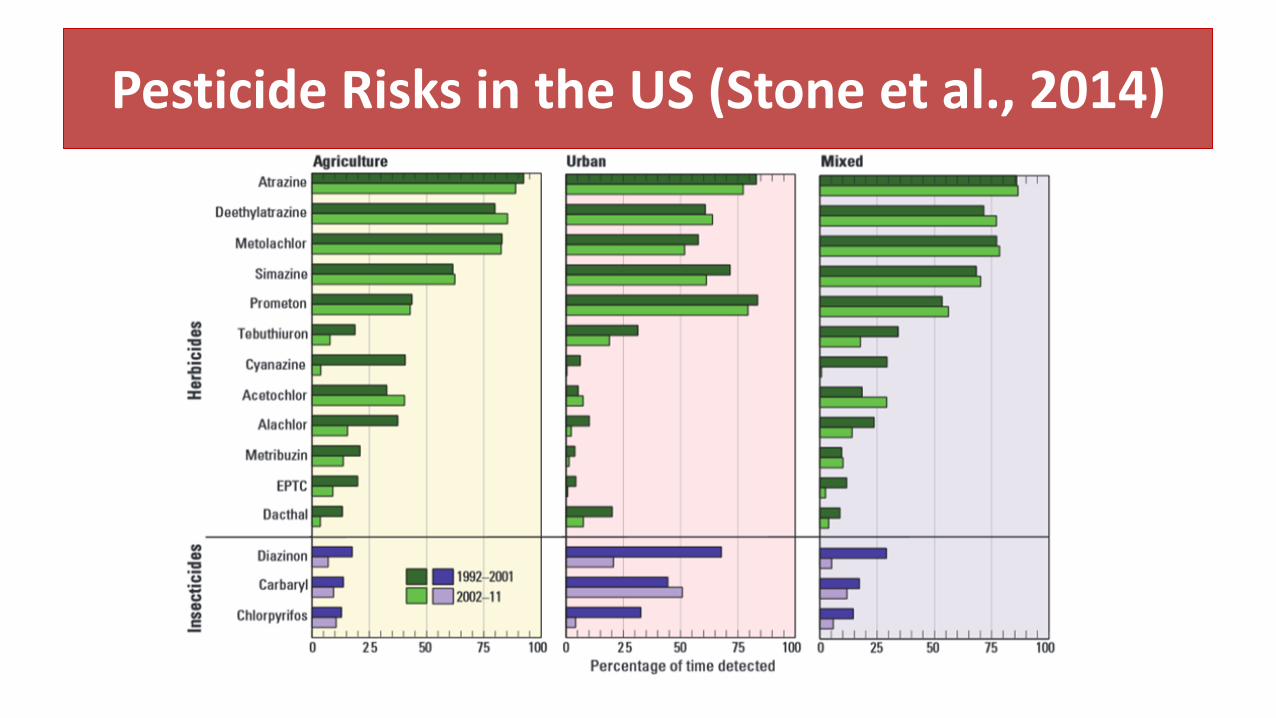
Pesticide Risks in the US (Stone et al., 2014)
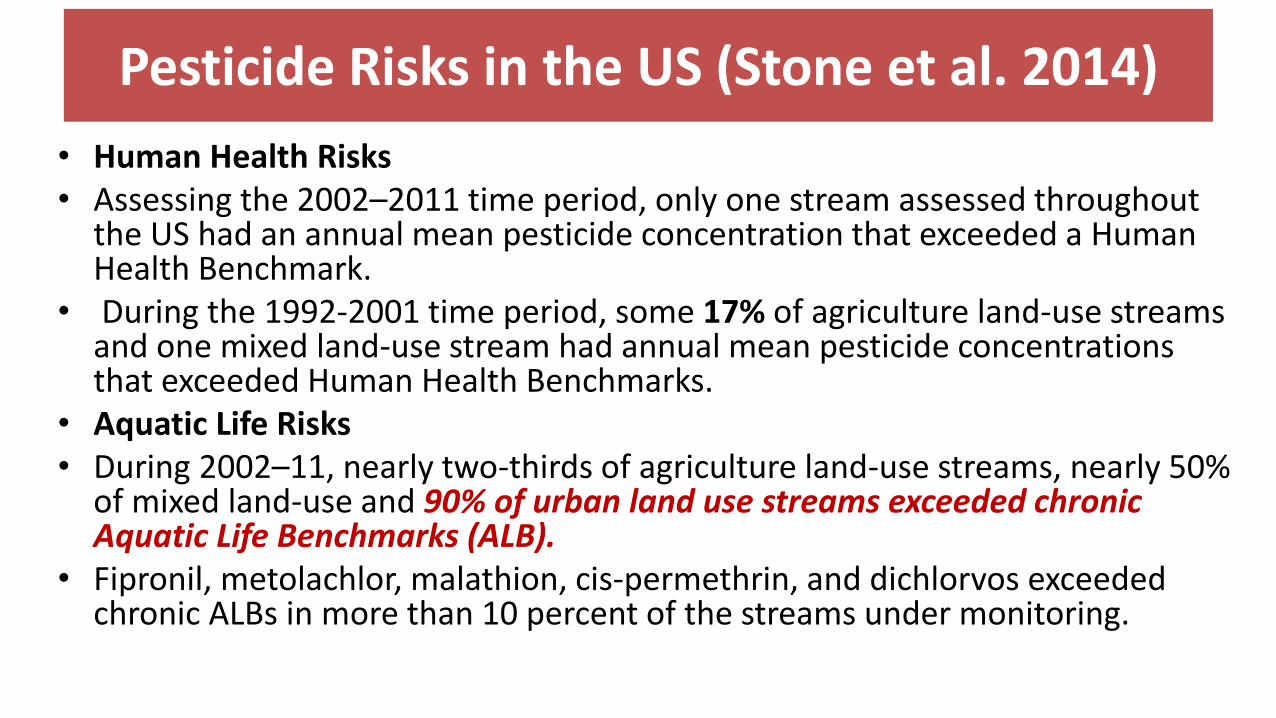
Pesticide Risks in the US (Stone et al. 2014)
• Human Health Risks• Assessing the 2002–2011 time period, only one stream assessed throughout
the US had an annual mean pesticide concentration that exceeded a Human Health Benchmark.
• During the 1992-2001 time period, some 17% of agriculture land-use streams and one mixed land-use stream had annual mean pesticide concentrations that exceeded Human Health Benchmarks.
• Aquatic Life Risks• During 2002–11, nearly two-thirds of agriculture land-use streams, nearly 50%
of mixed land-use and 90% of urban land use streams exceeded chronic Aquatic Life Benchmarks (ALB).
• Fipronil, metolachlor, malathion, cis-permethrin, and dichlorvos exceeded chronic ALBs in more than 10 percent of the streams under monitoring.
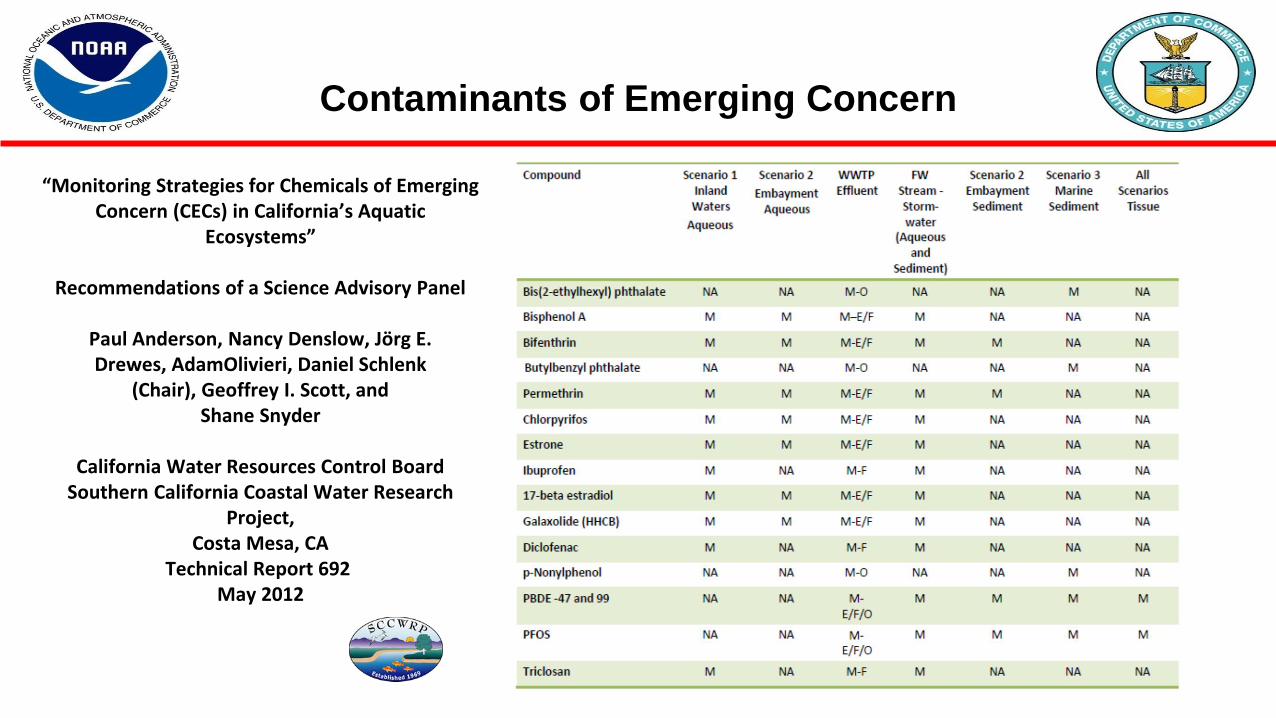
Contaminants of Emerging Concern
“Monitoring Strategies for Chemicals of Emerging Concern (CECs) in California’s Aquatic
Ecosystems”
Recommendations of a Science Advisory Panel
Paul Anderson, Nancy Denslow, Jörg E.Drewes, AdamOlivieri, Daniel Schlenk
(Chair), Geoffrey I. Scott, andShane Snyder
California Water Resources Control BoardSouthern California Coastal Water Research
Project, Costa Mesa, CA
Technical Report 692May 2012
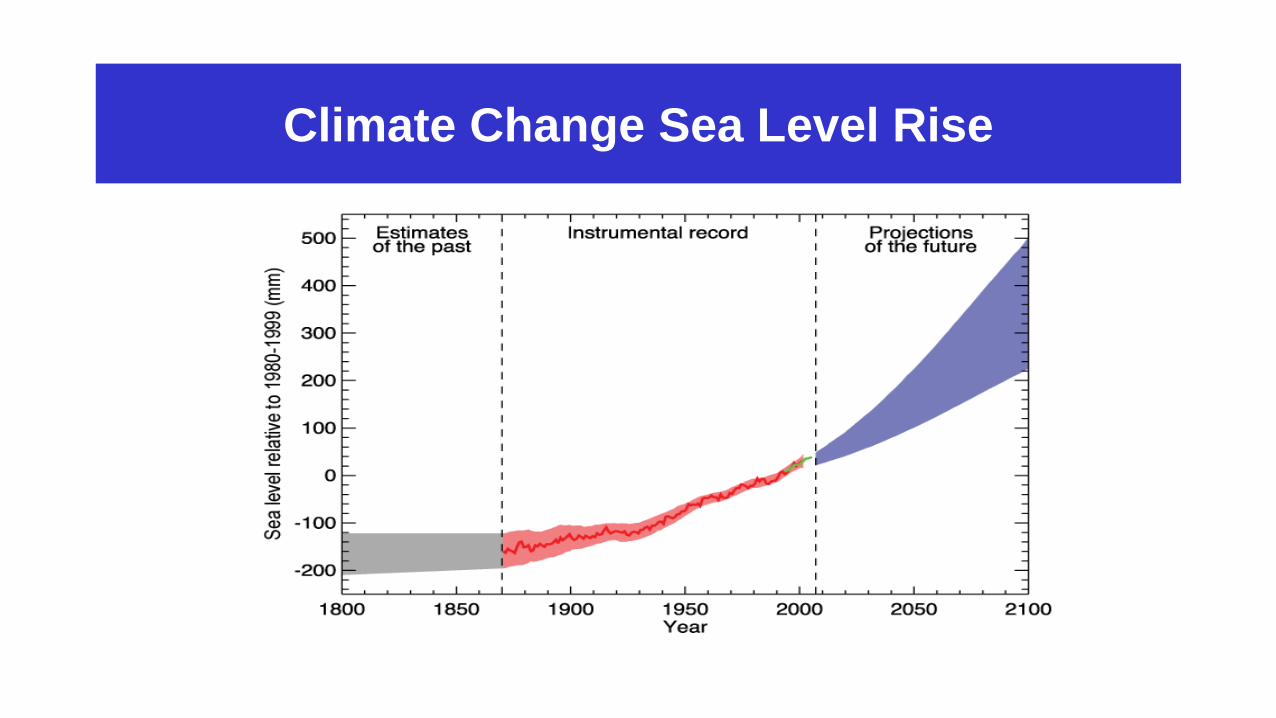
Climate Change Sea Level Rise
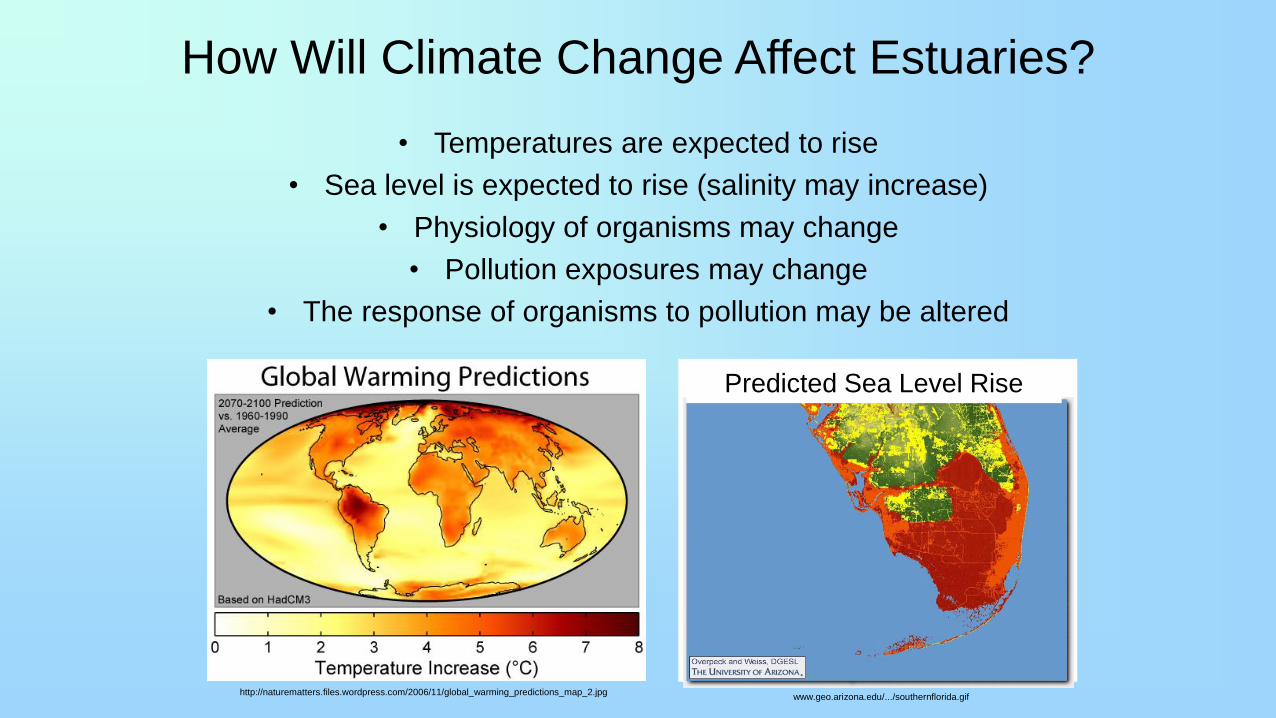
How Will Climate Change Affect Estuaries?
• Temperatures are expected to rise
• Sea level is expected to rise (salinity may increase)
• Physiology of organisms may change
• Pollution exposures may change
• The response of organisms to pollution may be altered
http://naturematters.files.wordpress.com/2006/11/global_warming_predictions_map_2.jpgwww.geo.arizona.edu/.../southernflorida.gif
Predicted Sea Level Rise
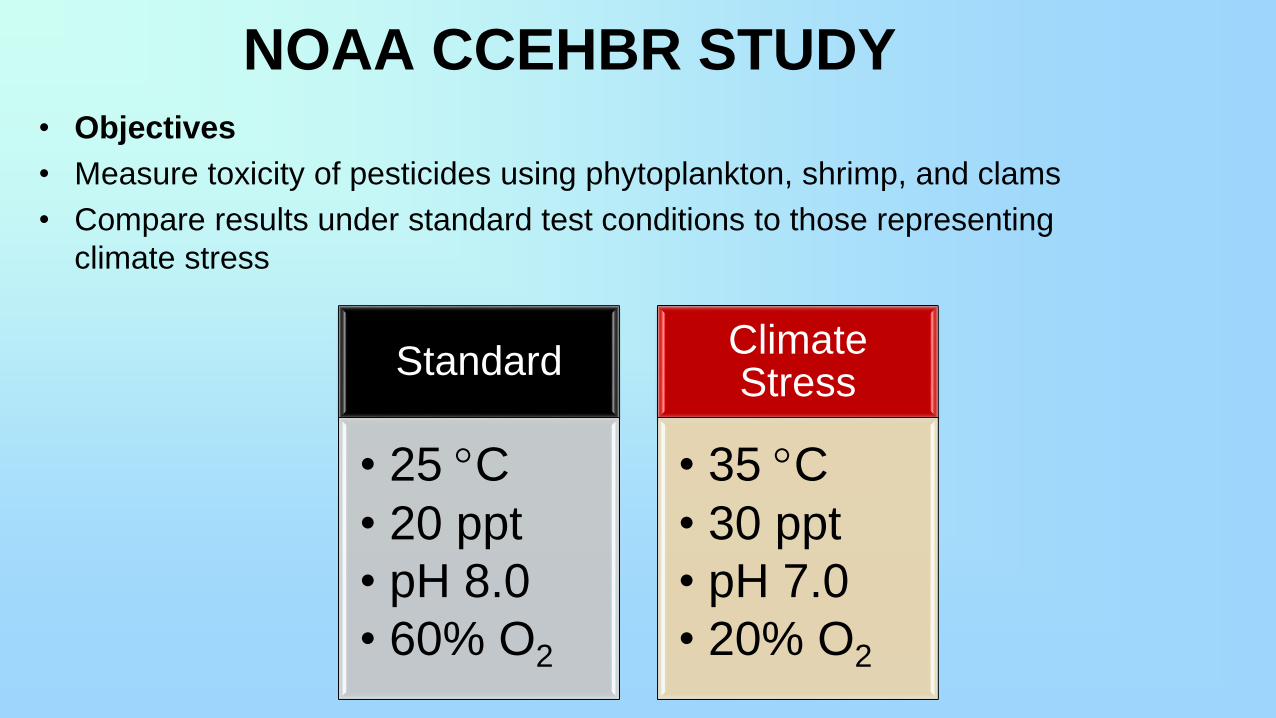
NOAA CCEHBR STUDY
• Objectives
• Measure toxicity of pesticides using phytoplankton, shrimp, and clams
• Compare results under standard test conditions to those representing
climate stress
Standard
• 25 C
• 20 ppt
• pH 8.0
• 60% O2
Climate Stress
• 35 C
• 30 ppt
• pH 7.0
• 20% O2
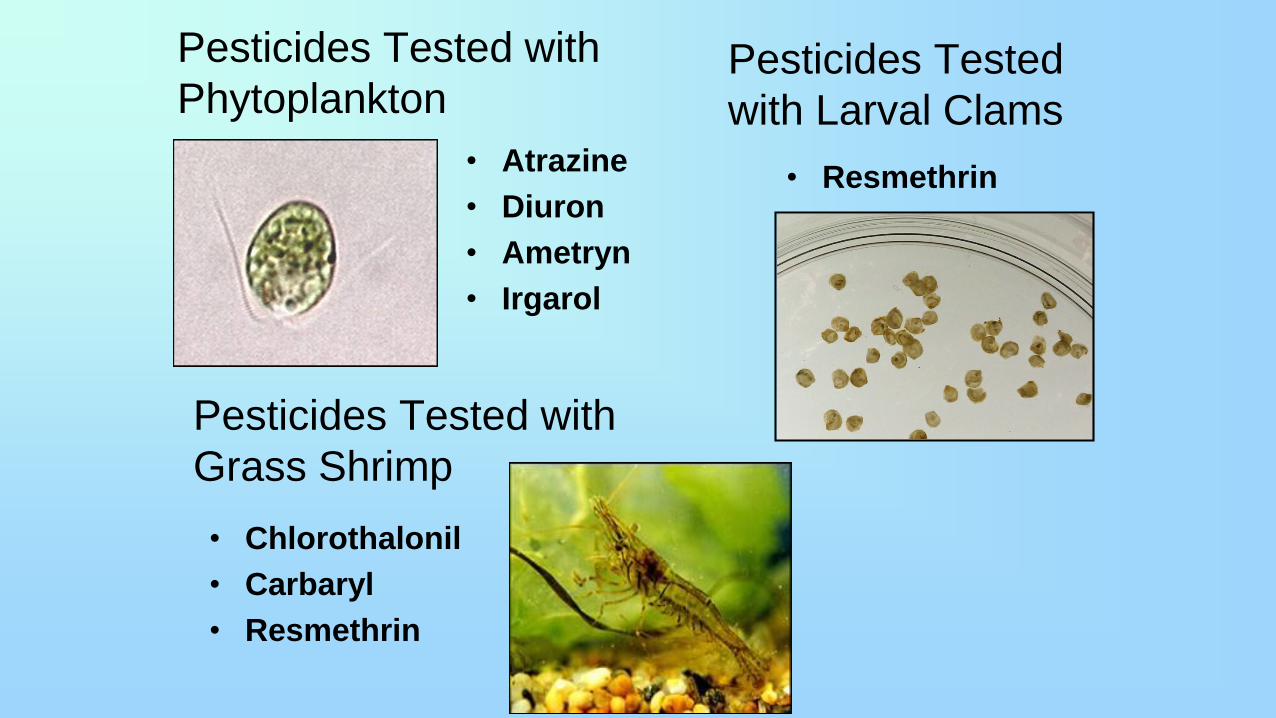
Pesticides Tested with
Phytoplankton
• Atrazine
• Diuron
• Ametryn
• Irgarol
Pesticides Tested with
Grass Shrimp
• Chlorothalonil
• Carbaryl
• Resmethrin
Pesticides Tested
with Larval Clams
• Resmethrin
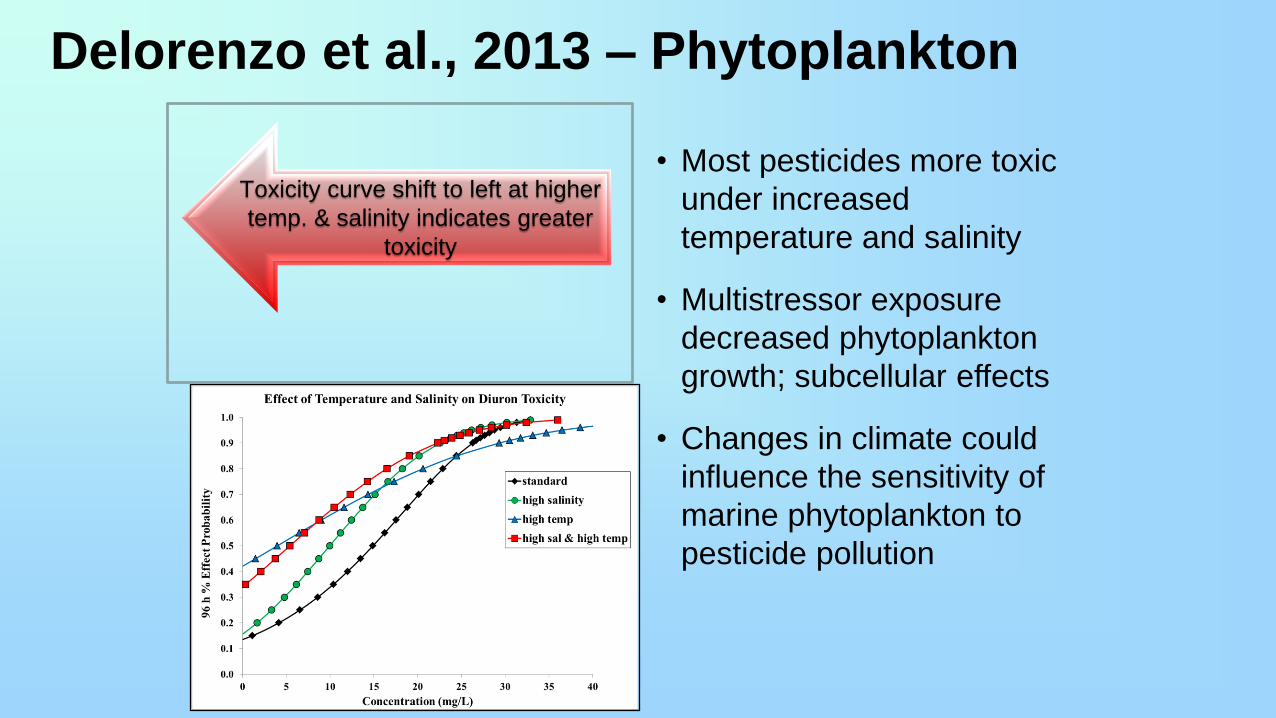
Delorenzo et al., 2013 – Phytoplankton
• Most pesticides more toxic
under increased
temperature and salinity
• Multistressor exposure
decreased phytoplankton
growth; subcellular effects
• Changes in climate could
influence the sensitivity of
marine phytoplankton to
pesticide pollution
Toxicity curve shift to left at higher
temp. & salinity indicates greater
toxicity
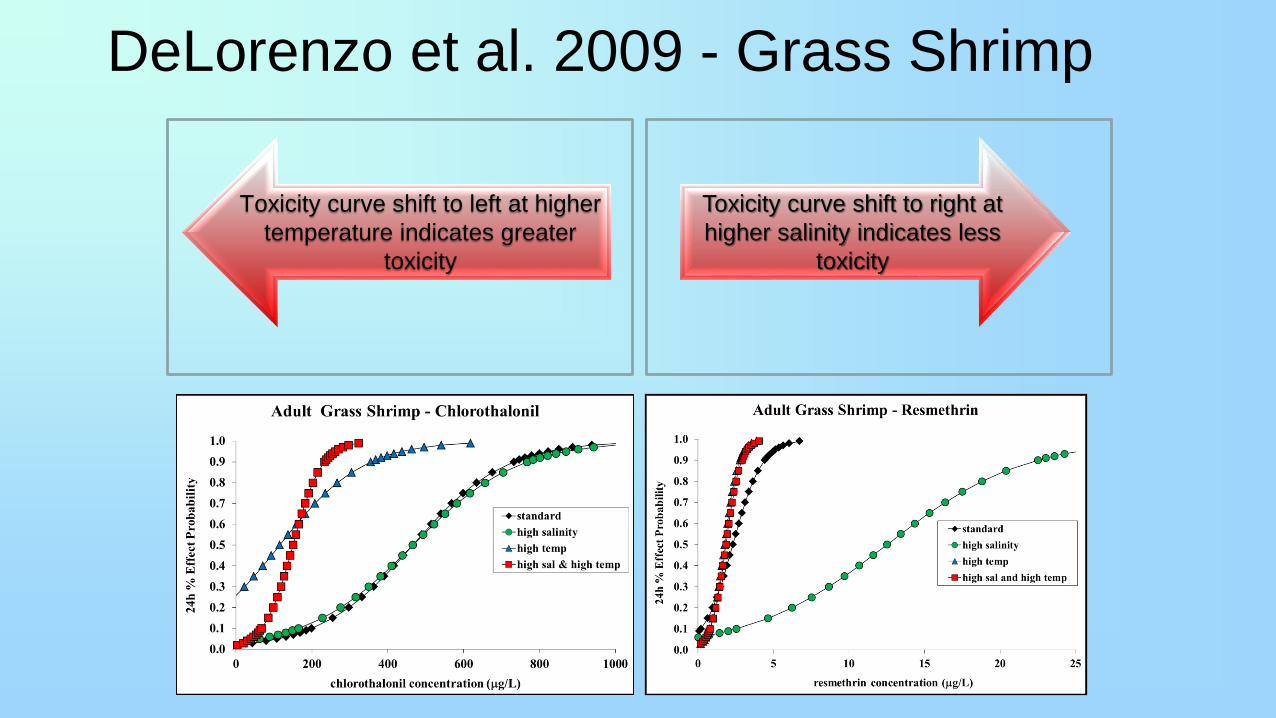
DeLorenzo et al. 2009 - Grass Shrimp
• Most pesticides more toxic
under increased
temperature than under
standard testing conditions
• Effect of increasing salinity
not consistent across
pesticides
Toxicity curve shift to left at higher
temperature indicates greater
toxicity
Toxicity curve shift to right at
higher salinity indicates less
toxicity
32FIFRA SAP, Washington, D.C., December 7, 2010 32
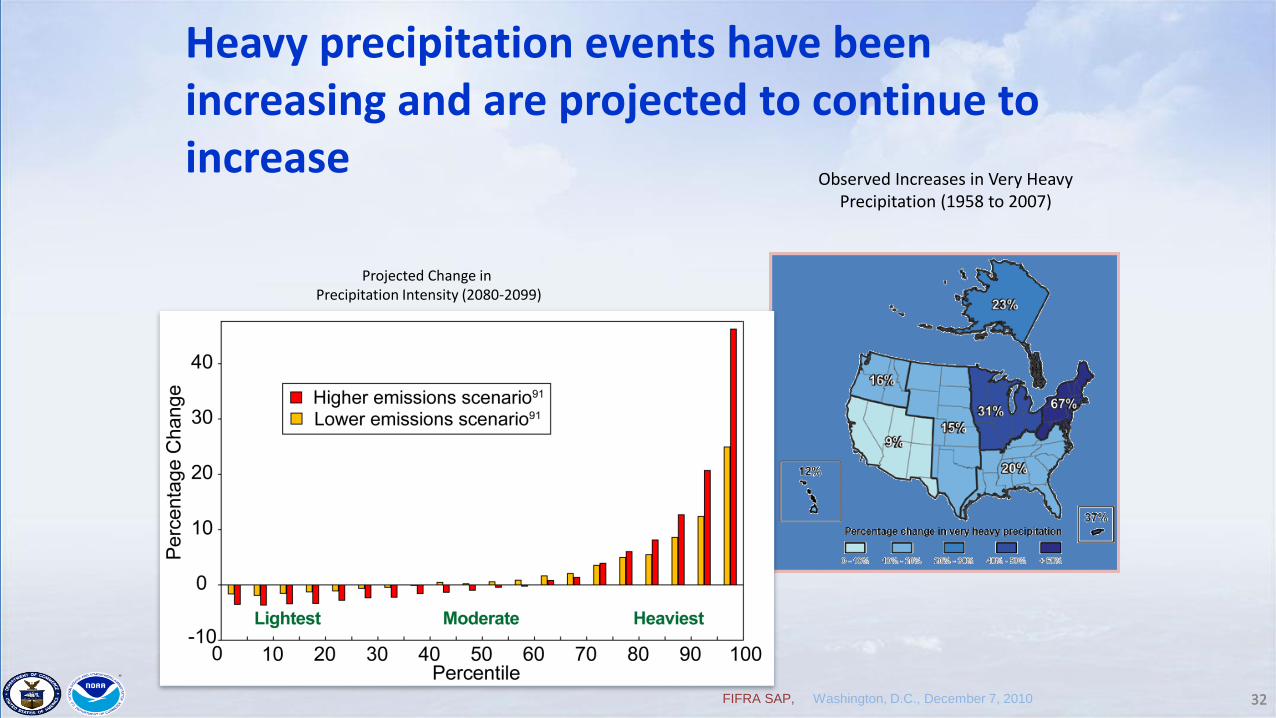
Heavy precipitation events have been increasing and are projected to continue to increase
Projected Change inPrecipitation Intensity (2080-2099)
Observed Increases in Very Heavy Precipitation (1958 to 2007)
Urbanization in
Coastal Ecosystems
Globally > 55% of the world’s population lives within 50 miles
of the coast, 33 of the 50 largest cities in the world are located
in coastal areas & more than 80% of world commerce is
transported by ships (Dean, 1997)
Half of the US population (>141 million people) reside within
50 miles of the coast, which occupies less than 11% of the
land area of the lower 48 states (NOAA, 1999; 2005)
U.S. population has increased by 33 million (28%) since 1980
and is expected to increase by anther 12 million by 2015
(Crossett et al.; 2004)
PEW COMMSSION: 25% of all conversion of rural land into
suburban/urban land use in the last 300 years for the U.S. has
occurred in the 15 year period from 1982-1997 (NRI, 2000)
Consequences of Differences in Economic and Population Growth on the Coastal Zone
• Thus there is 5.19 times more commercial development/land area in the coastal zone and 5.38 times more people/land area in the coastal zone
• Both economic and urban development may result in increased emissions of air and water pollution.
• Thus there will be increased impacts to the environment quality in coastal zone and coastal communities as a result = May Impact Both Ecosystem and Human Health
Urbanization in
Coastal Ecosystems
This influx of people, and the associated residential and commercial development of the coastal zone has resulted in significant modification of landscapes such as increased imperviousness.
Major alterations of the hydrological cycle, which change the transport and delivery of water to coastal watersheds.
This in turn results in increased discharges of toxic chemicals (pesticides, trace metals, PAHs, personal care products, and pharmaceuticals), nutrients, and microbes.
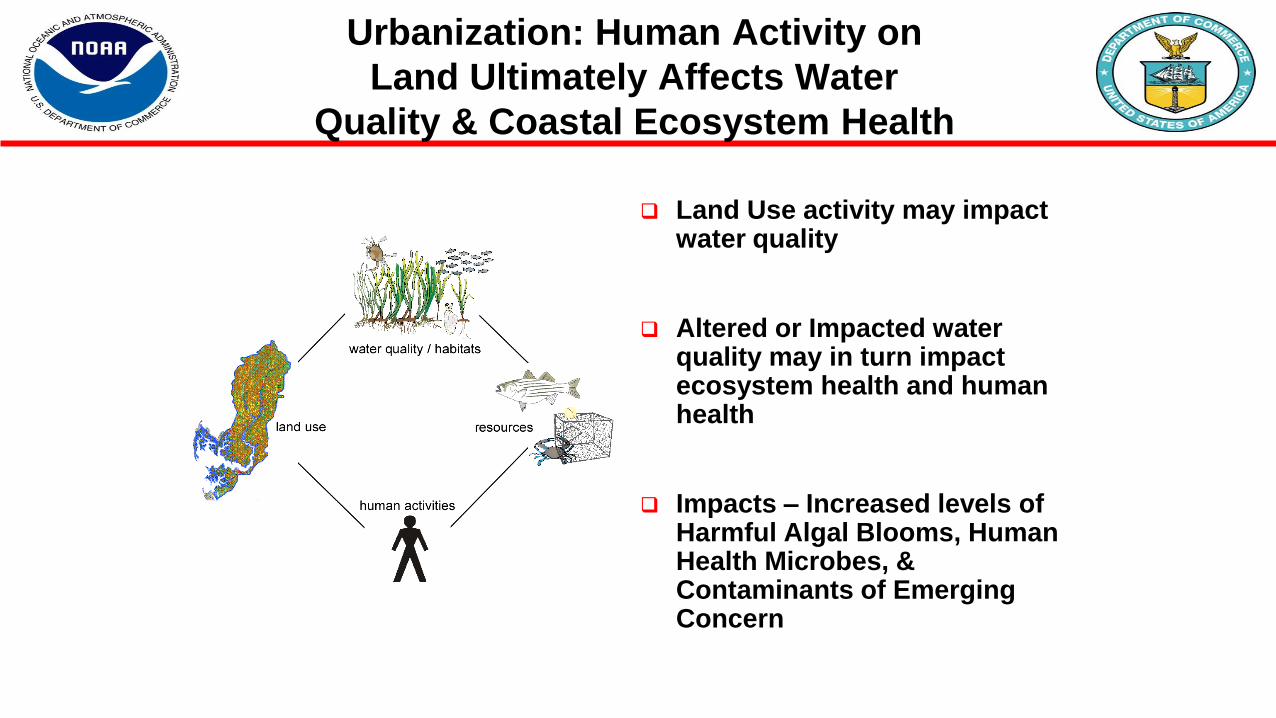
Urbanization: Human Activity on
Land Ultimately Affects Water
Quality & Coastal Ecosystem Health
Land Use activity may impact water quality
Altered or Impacted water quality may in turn impact ecosystem health and human health
Impacts – Increased levels of Harmful Algal Blooms, Human Health Microbes, & Contaminants of Emerging Concern
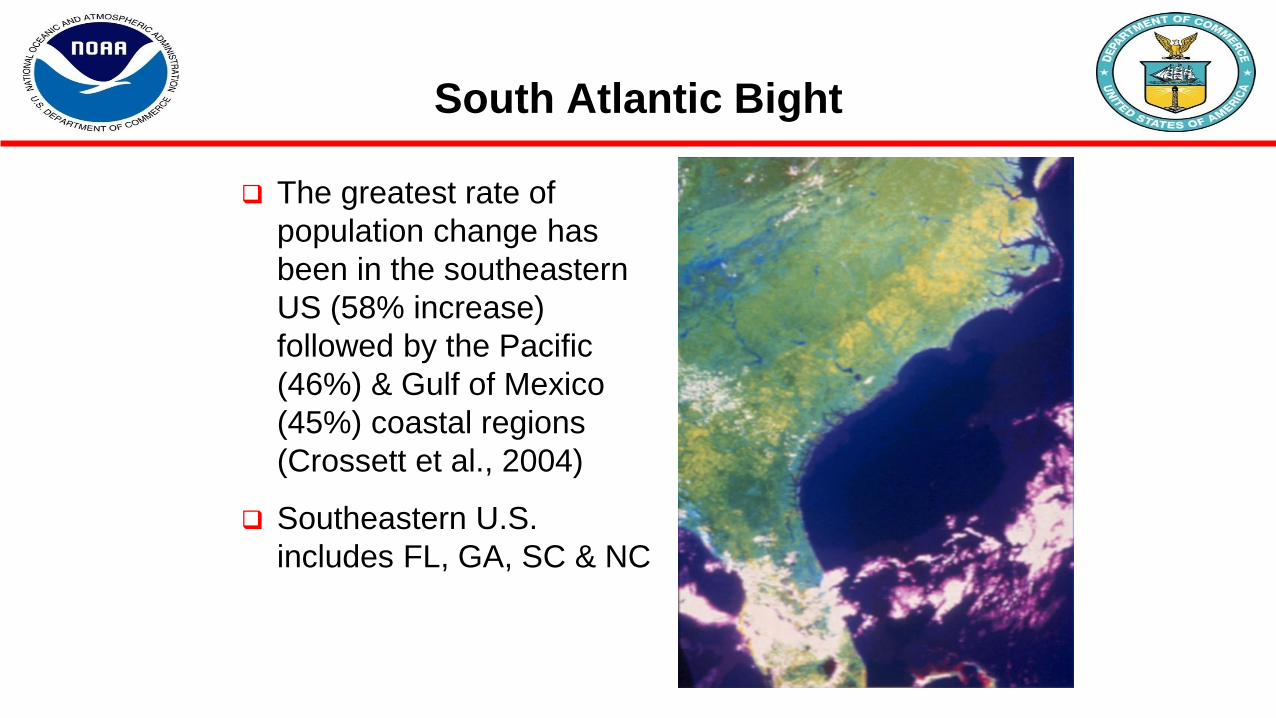
South Atlantic Bight
The greatest rate of
population change has
been in the southeastern
US (58% increase)
followed by the Pacific
(46%) & Gulf of Mexico
(45%) coastal regions
(Crossett et al., 2004)
Southeastern U.S.
includes FL, GA, SC & NC
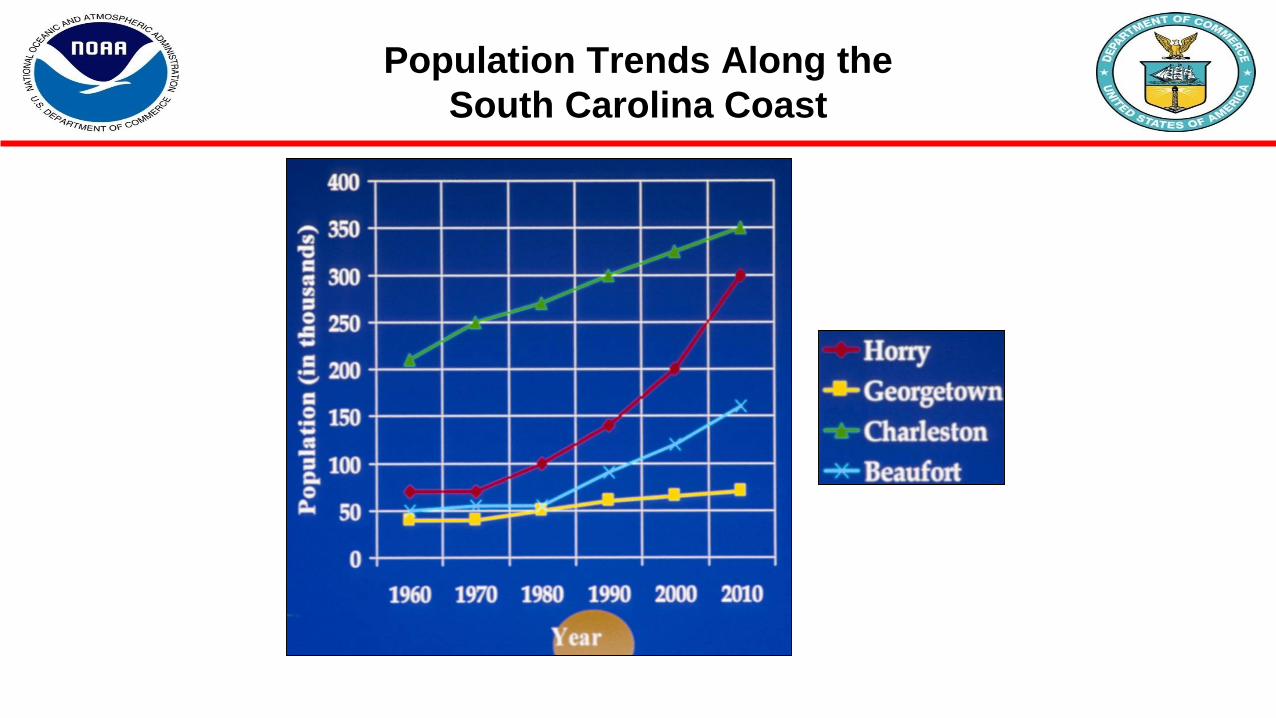
Population Trends Along the
South Carolina Coast
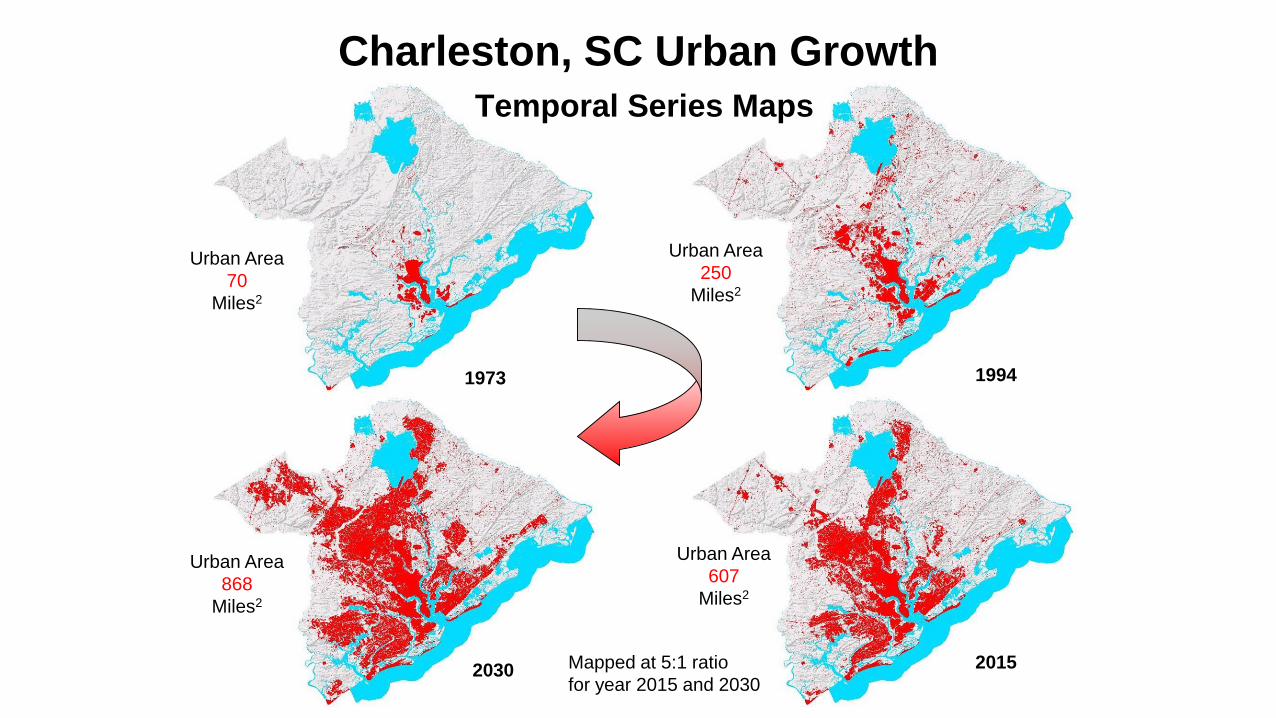
1973 1994
20152030
Urban Area
70
Miles2
Urban Area
250
Miles2
Urban Area
607
Miles2
Urban Area
868
Miles2
Mapped at 5:1 ratio
for year 2015 and 2030
Charleston, SC Urban Growth
Temporal Series Maps
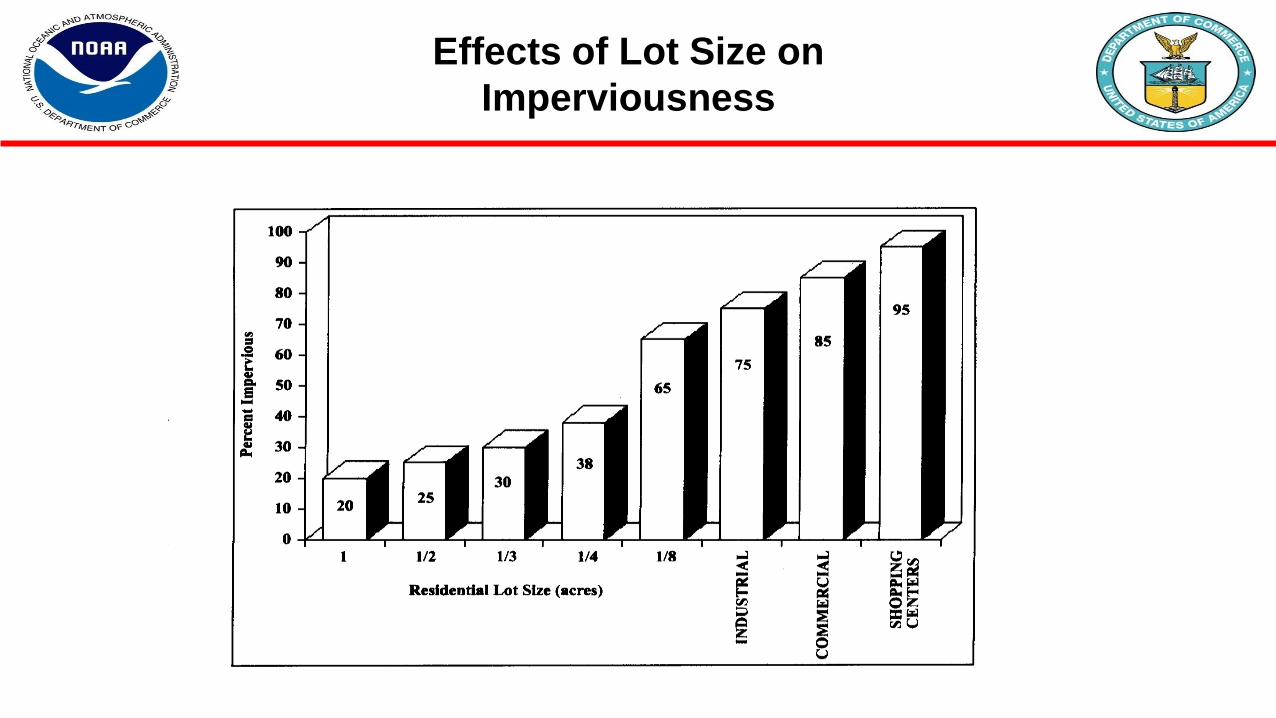
Effects of Lot Size on
Imperviousness
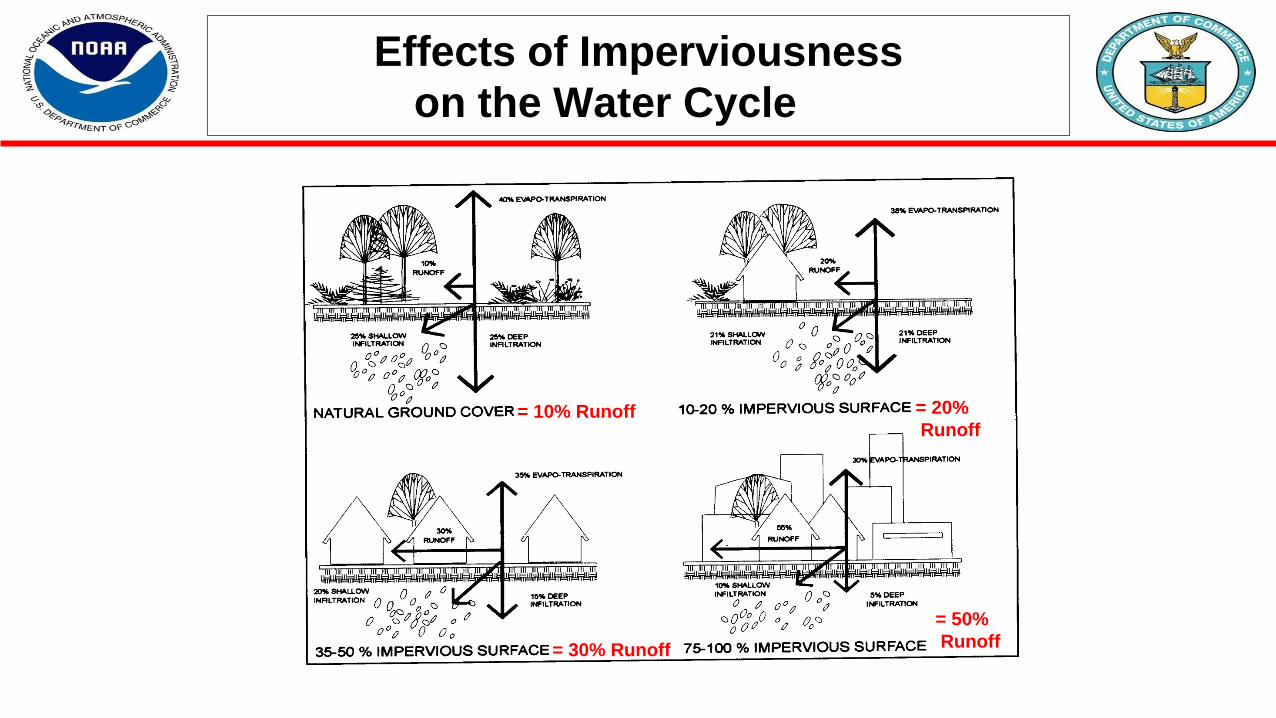
Effects of Imperviousness
on the Water Cycle Cycle
= 10% Runoff = 20%
Runoff
= 30% Runoff
= 50%
Runoff
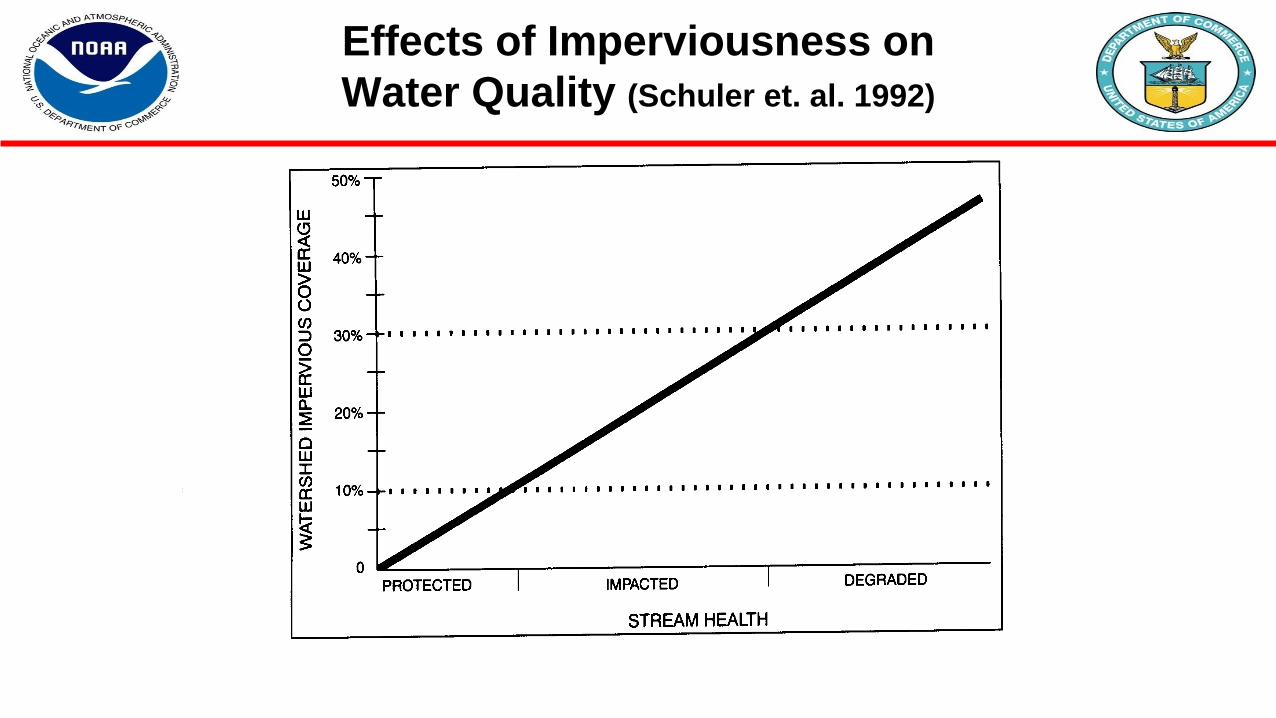
Effects of Imperviousness on
Water Quality (Schuler et. al. 1992)
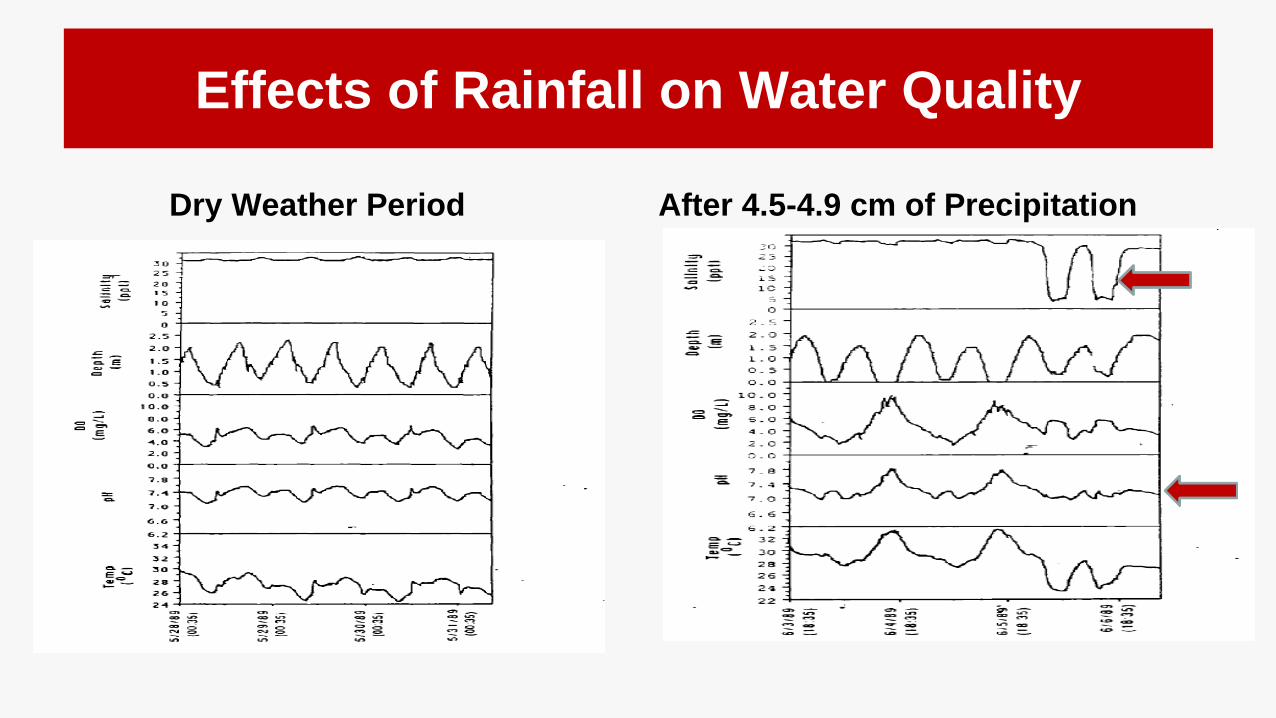
Effects of Rainfall on Water Quality
Dry Weather Period After 4.5-4.9 cm of Precipitation
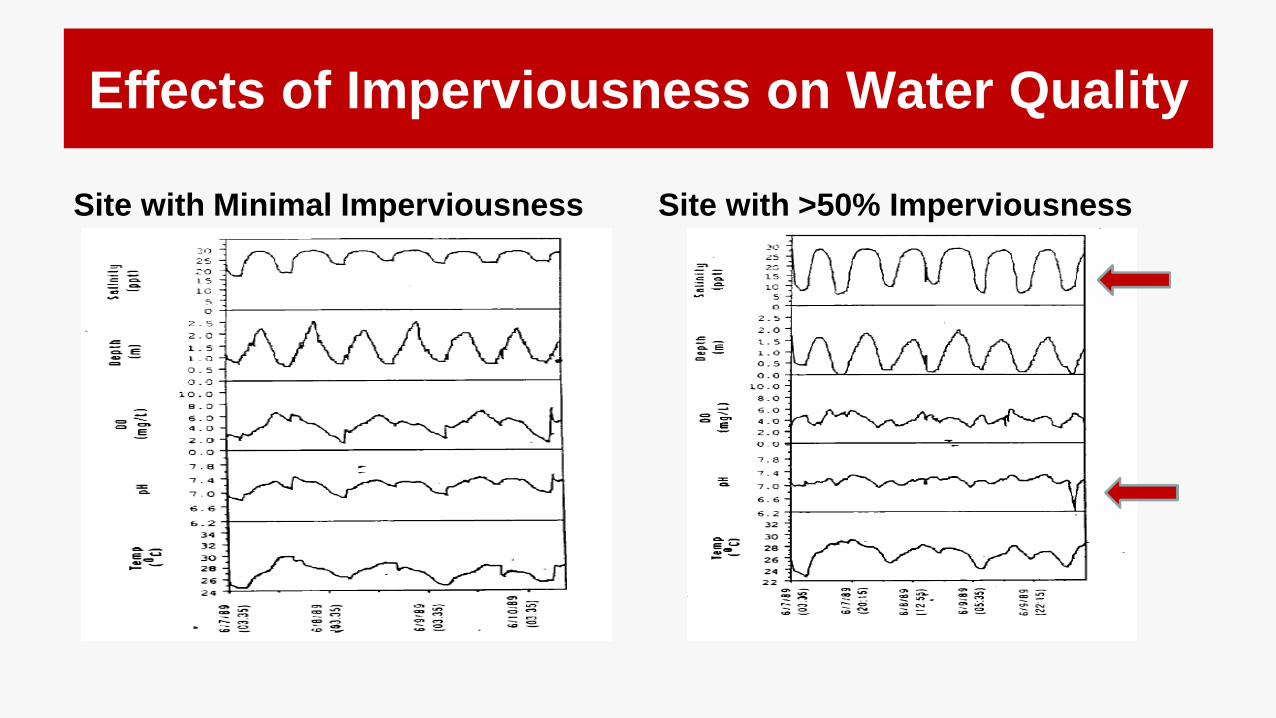
Effects of Imperviousness on Water Quality
Site with >50% ImperviousnessSite with Minimal Imperviousness
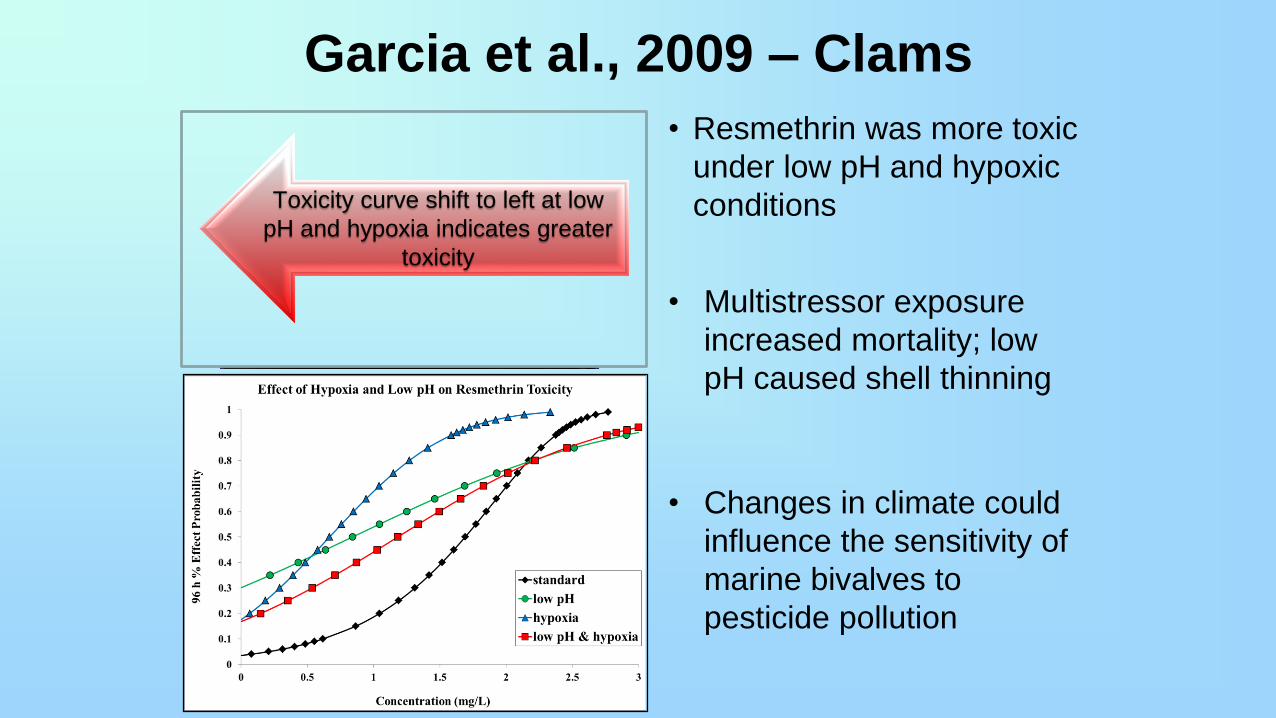
Garcia et al., 2009 – Clams
Toxicity curve shift to left at low
pH and hypoxia indicates greater
toxicity
• Resmethrin was more toxic
under low pH and hypoxic
conditions
• Multistressor exposure
increased mortality; low
pH caused shell thinning
• Changes in climate could
influence the sensitivity of
marine bivalves to
pesticide pollution
Global Climate Change:
Agricultural Effects
Diminishing Crop Production
- Mid West will have 30-60% less rain, which will reduce
crop production
-Decreasing protein content of P3 plants (soybeans)
- Weeds (P4 plants) will have higher growth rates in CO2
enriched air = more herbicide use
-Insect pests will consume more P3 plants to meet protein
needs = more insecticide use
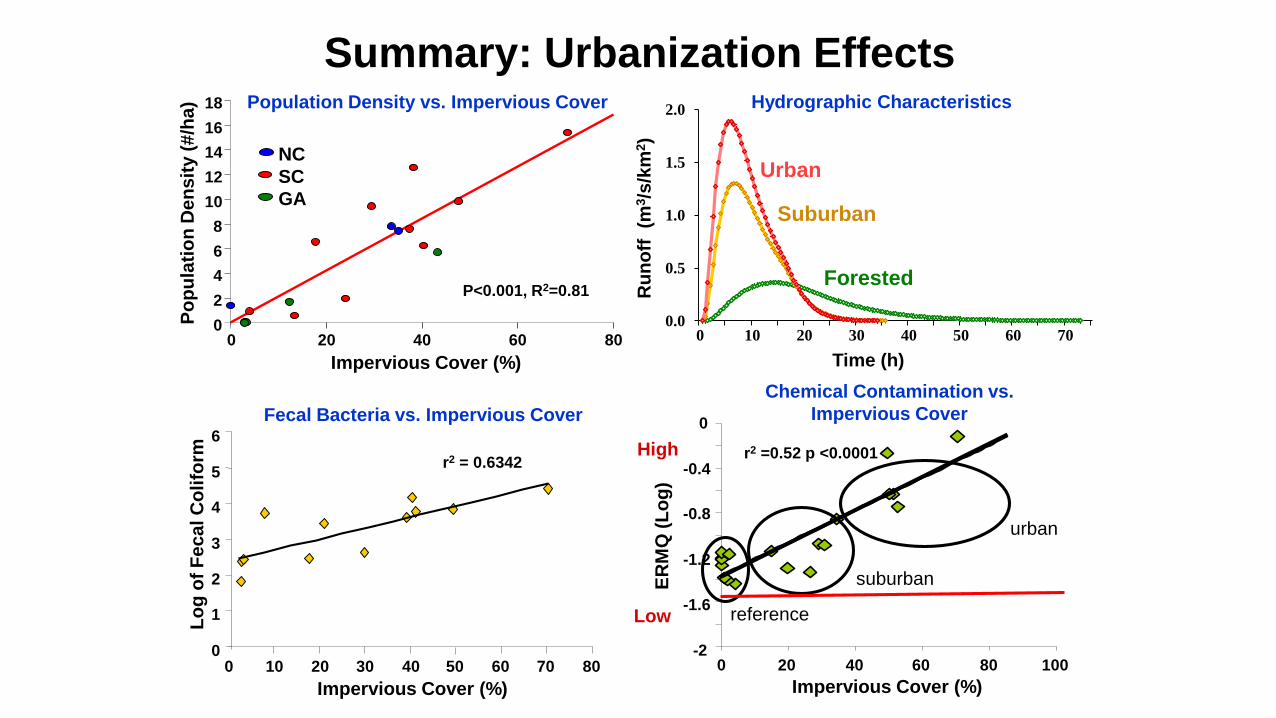
Summary: Urbanization Effects
Impervious Cover (%)
Po
pu
lati
on
Den
sit
y (
#/h
a)
P<0.001, R2=0.81
0 20 40 60 800
2
4
6
8
10
12
14
16
18
NC
SC
GA
Population Density vs. Impervious Cover
Lo
g o
f F
ec
al C
oli
form
Impervious Cover (%)
r2 = 0.6342
0
1
2
3
4
5
6
0 10 20 30 40 50 60 70 80
Fecal Bacteria vs. Impervious Cover
-2
-1.6
-1.2
-0.8
-0.4
0
ER
MQ
(L
og
)
Impervious Cover (%)
0 20 40 60 80 100
r2 =0.52 p <0.0001High
Low
suburban
reference
urban
Chemical Contamination vs.
Impervious Cover
Hydrographic Characteristics
0.0
0.5
1.0
1.5
2.0
0 10 20 30 40 50 60 70
Ru
no
ff (m
3/s
/km
2).
.
Time (h)
Urban
Forested
Suburban
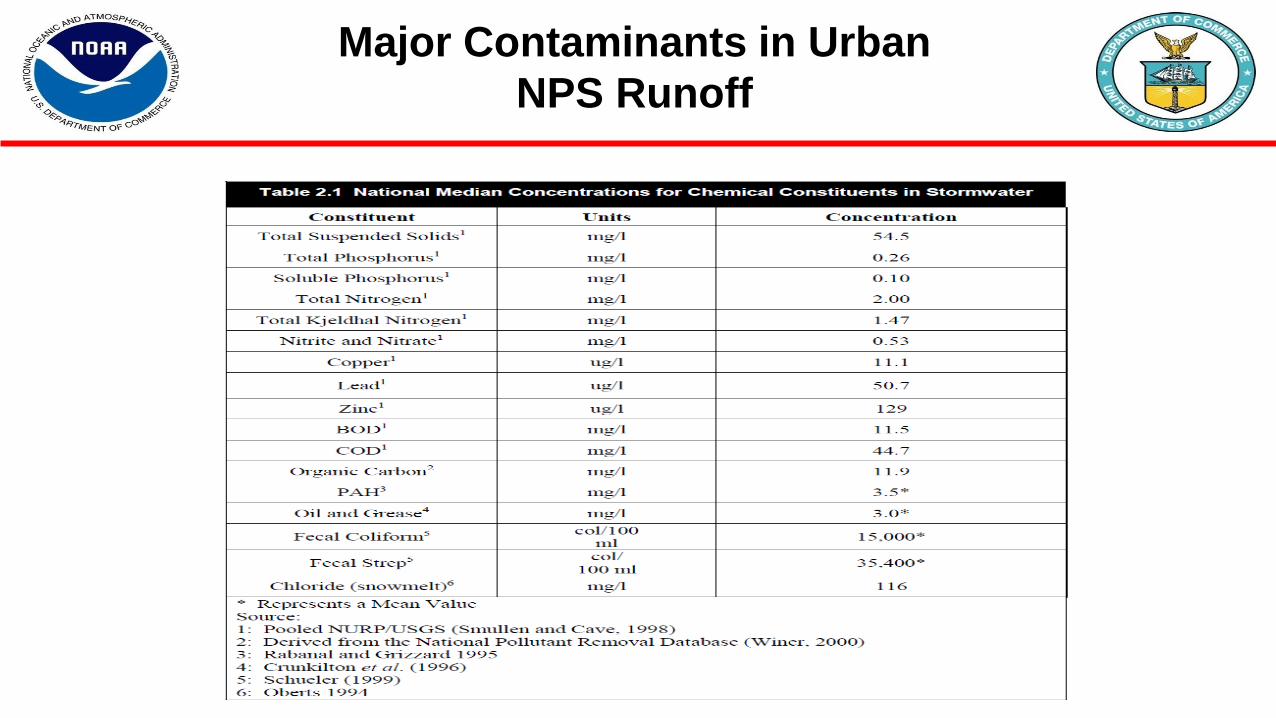
Major Contaminants in Urban
NPS Runoff

Major Contaminants in Urban
NPS Runoff
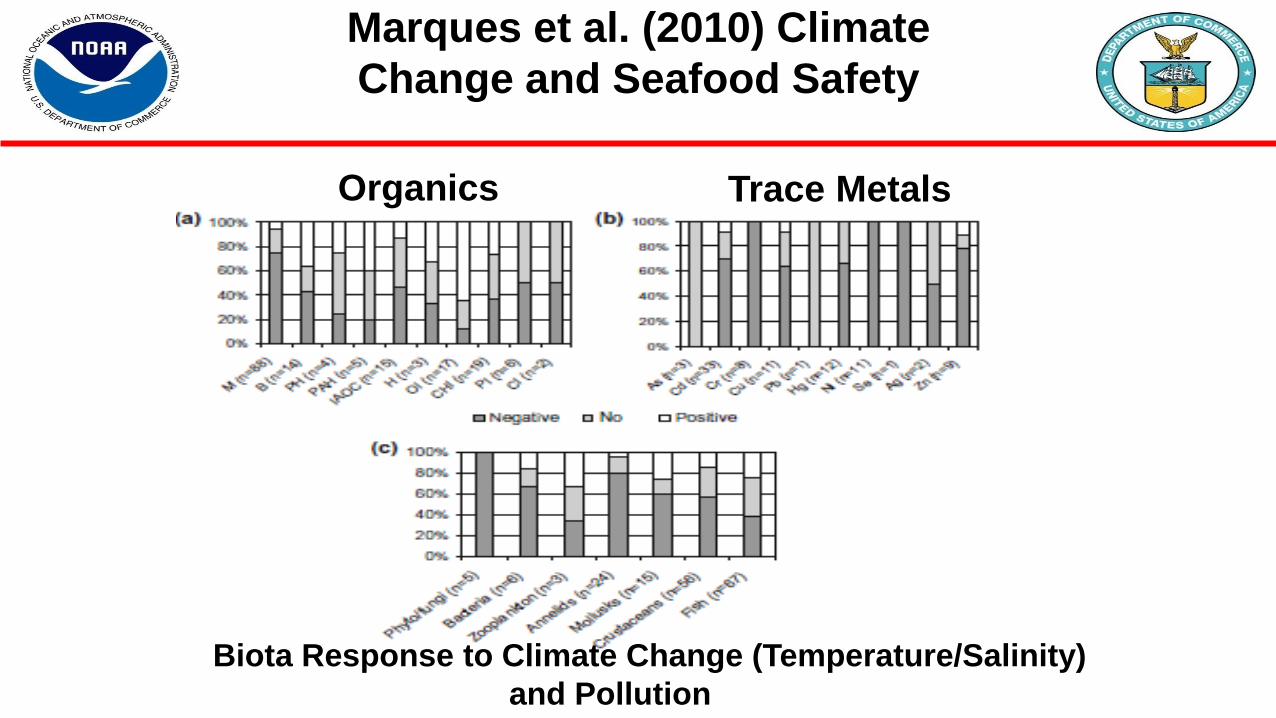
Marques et al. (2010) Climate
Change and Seafood Safety
Organics Trace Metals
Biota Response to Climate Change (Temperature/Salinity)
and Pollution
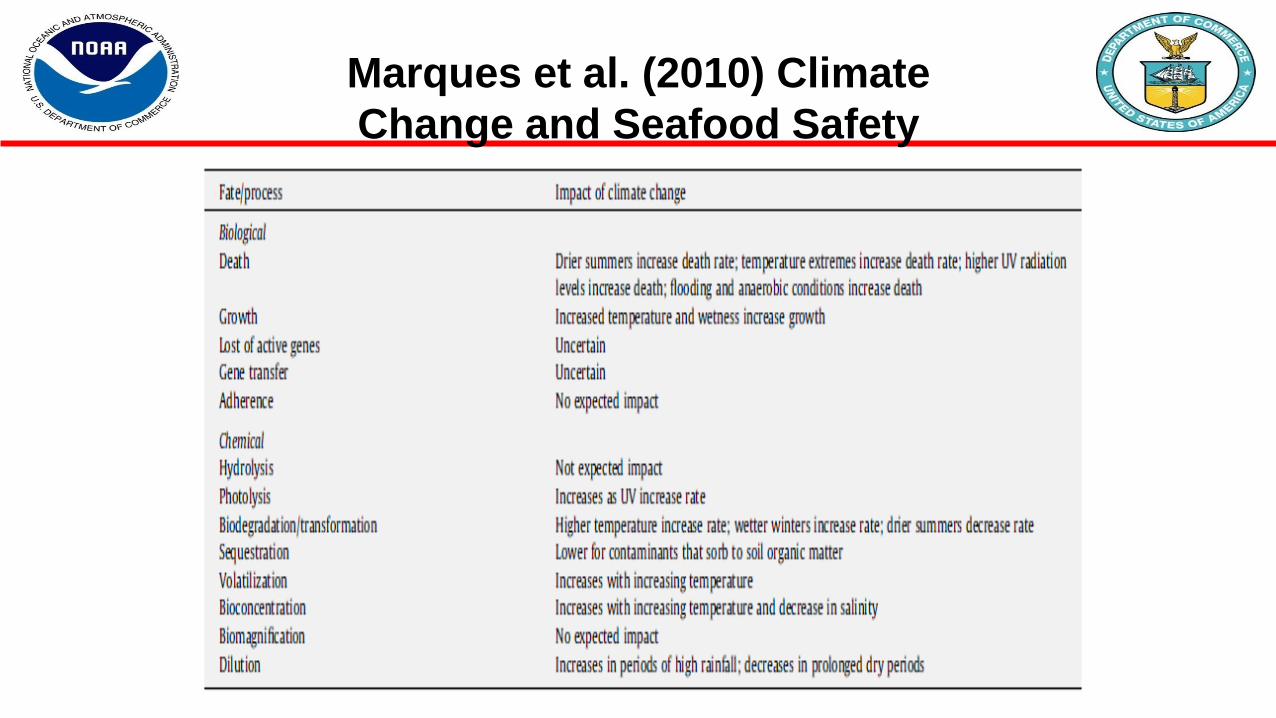
Marques et al. (2010) Climate
Change and Seafood Safety
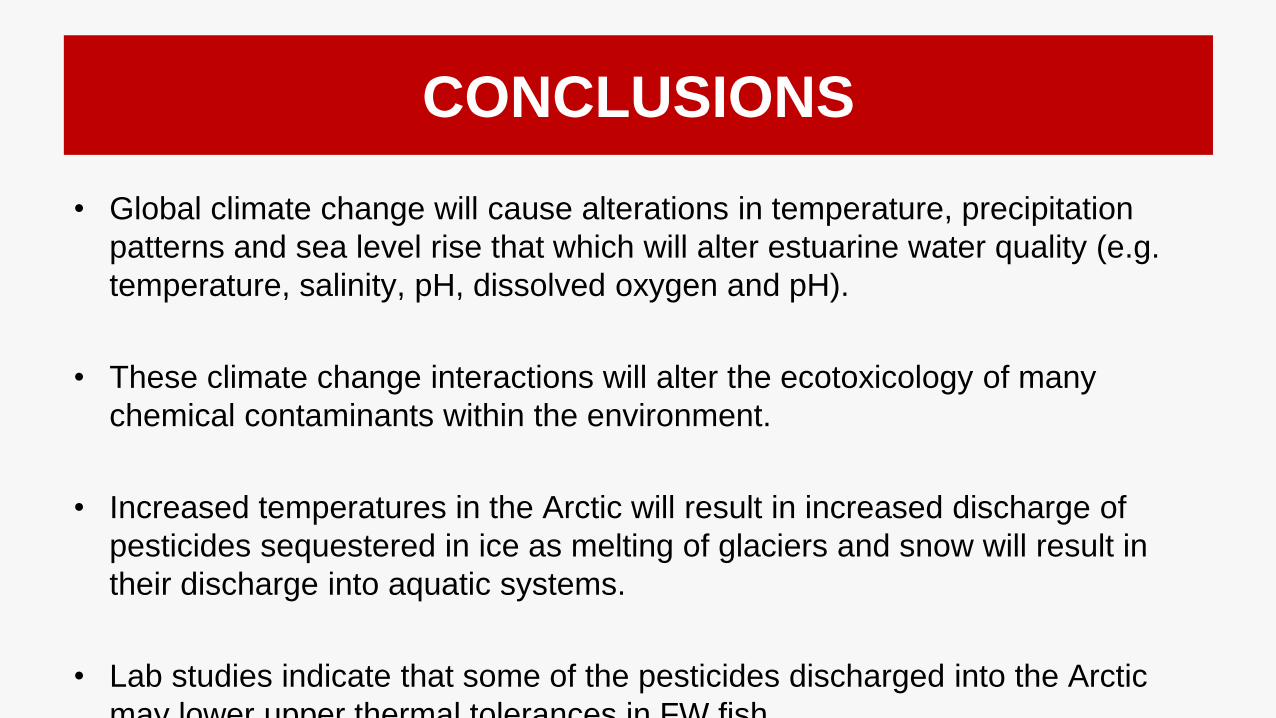
CONCLUSIONS
• Global climate change will cause alterations in temperature, precipitation
patterns and sea level rise that which will alter estuarine water quality (e.g.
temperature, salinity, pH, dissolved oxygen and pH).
• These climate change interactions will alter the ecotoxicology of many
chemical contaminants within the environment.
• Increased temperatures in the Arctic will result in increased discharge of
pesticides sequestered in ice as melting of glaciers and snow will result in
their discharge into aquatic systems.
• Lab studies indicate that some of the pesticides discharged into the Arctic
may lower upper thermal tolerances in FW fish.
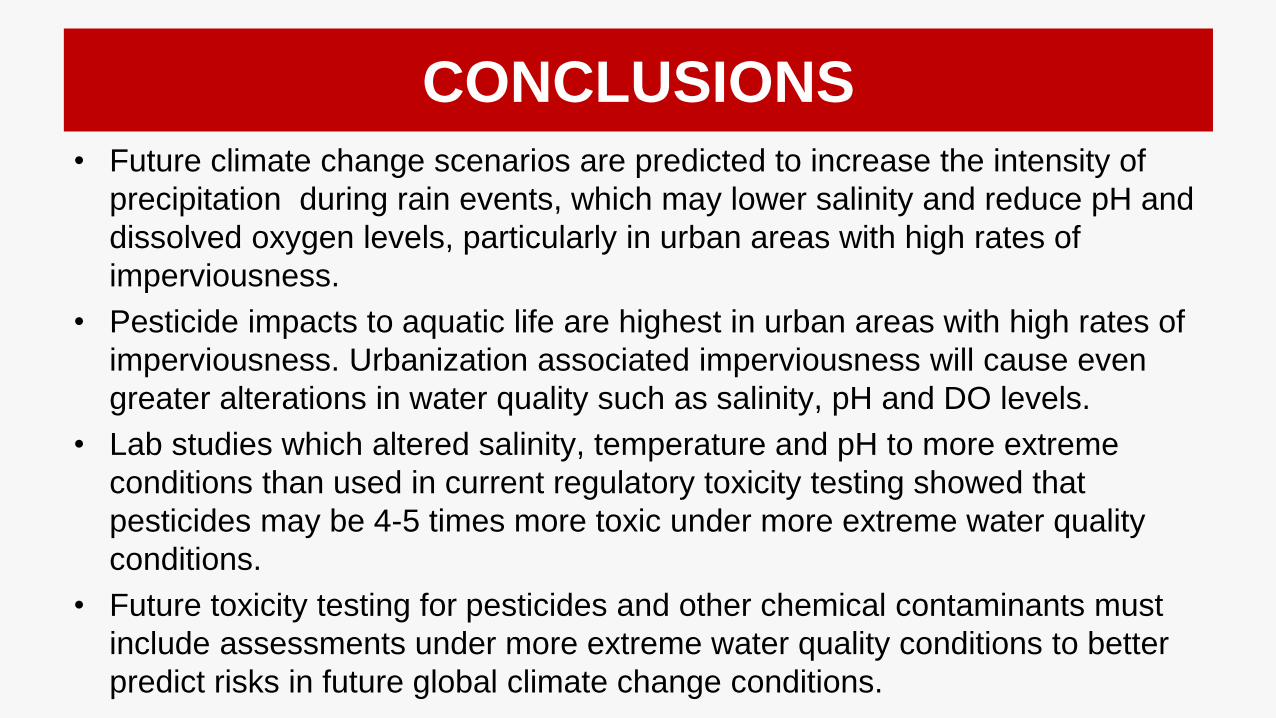
CONCLUSIONS
• Future climate change scenarios are predicted to increase the intensity of
precipitation during rain events, which may lower salinity and reduce pH and
dissolved oxygen levels, particularly in urban areas with high rates of
imperviousness.
• Pesticide impacts to aquatic life are highest in urban areas with high rates of
imperviousness. Urbanization associated imperviousness will cause even
greater alterations in water quality such as salinity, pH and DO levels.
• Lab studies which altered salinity, temperature and pH to more extreme
conditions than used in current regulatory toxicity testing showed that
pesticides may be 4-5 times more toxic under more extreme water quality
conditions.
• Future toxicity testing for pesticides and other chemical contaminants must
include assessments under more extreme water quality conditions to better
predict risks in future global climate change conditions.
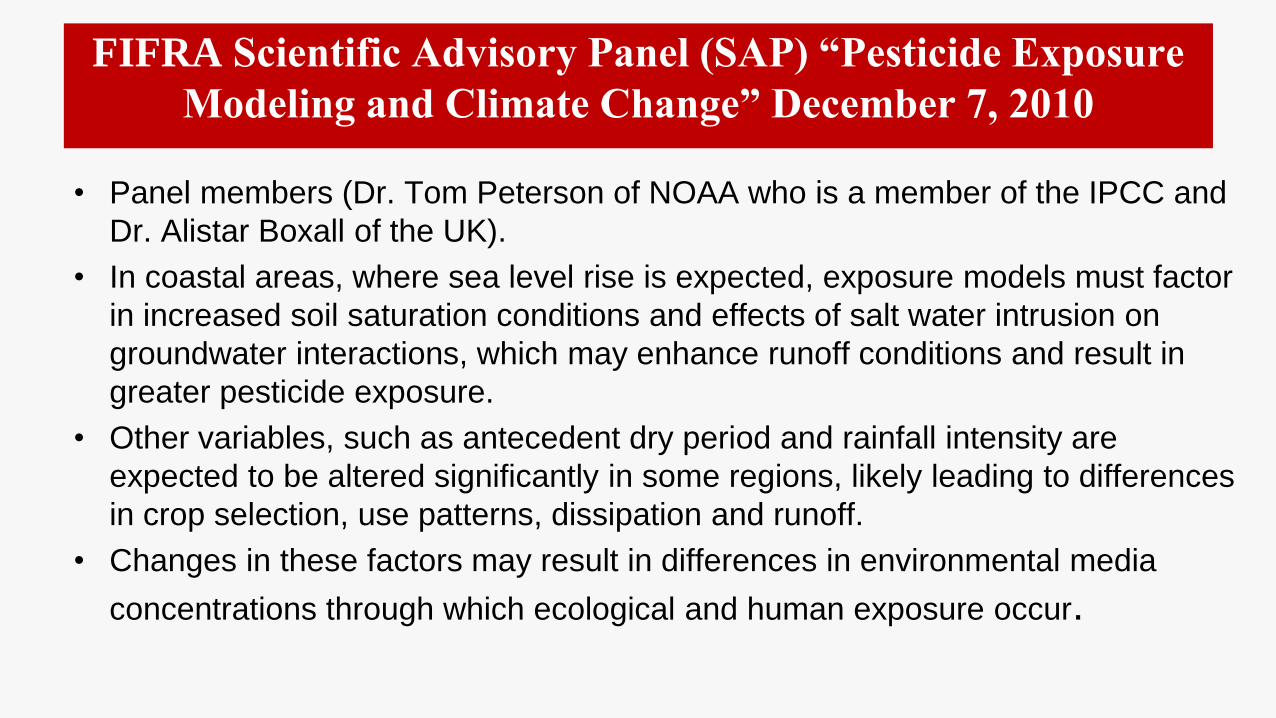
FIFRA Scientific Advisory Panel (SAP) “Pesticide Exposure
Modeling and Climate Change” December 7, 2010
• Panel members (Dr. Tom Peterson of NOAA who is a member of the IPCC and
Dr. Alistar Boxall of the UK).
• In coastal areas, where sea level rise is expected, exposure models must factor
in increased soil saturation conditions and effects of salt water intrusion on
groundwater interactions, which may enhance runoff conditions and result in
greater pesticide exposure.
• Other variables, such as antecedent dry period and rainfall intensity are
expected to be altered significantly in some regions, likely leading to differences
in crop selection, use patterns, dissipation and runoff.
• Changes in these factors may result in differences in environmental media
concentrations through which ecological and human exposure occur.
Important References To Consult
• Delorenzo, M.E., S.C. Wallace, L.E. Danese, T.D. Baird. 2009. Temperature and salinity effects
on the toxicity of common pesticides to the grass shrimp, Palaemonetes pugio. Journal of
Environmental Science and Health. Part B: Pesticides, Food Contaminants, and Agricultural
Wastes, 44 (5) (2009), pp. 455–460.
• DeLorenzo, M.E., Danese, L.E., Baird, T.D. 2013. Influence of increasing temperature and
salinity on herbicide toxicity in estuarine phytoplankton. Environmental Toxicology. 28(7):359-371.
• Garcia, R. N.,K. W. Chung, P. B. Key, L. E. Burnett, L. D. Coen and M. E. DeLorenzo. 2014.
Interactive Effects of Mosquito Control Insecticide Toxicity, Hypoxia, and Increased Carbon Dioxide
on Larval and Juvenile Eastern Oysters and Hard Clams. Arch Environ Contam Toxicol 66: 450–
462. DOI 10.1007/s00244-014-0002-1.
• Marques , A., M. L. Nunes, S. K. Moore, and M. S. Strom. 2010. Climate change and seafood
safety: Human health implications. Food Research International
(2010),doi:10.1016/j.foodres.2010.02.010
University of South Carolina
CONTACT INFORMATION
Dr. Geoffrey I. Scott
Professor and Chair
Dept. of Env. Health Sciences
Arnold School of Public Health
University of South Carolina
PHRC 401E, 921 Assembly Street
Columbia, SC 29208
Email: [email protected]; Phone: 803/777-8964