potassium needs and current approaches in almond...
TRANSCRIPT
Potassium Needs and Current Approaches in Almond Production
Roger DuncanUCCE Pomology & Viticulture Advisor
Stanislaus County

Potassium Nutrition
• Essential for formation of starch
• Essential for translocation of sugars
• Regulates opening and closing of stomata– K+ is pumped into guard cells– water moves into guard cells in response to
osmotic gradient– guard cells swell, open stomata

Potassium Nutrition
• Promotes root growth– produces large, uniformly distributed xylem
vessels in root system
• Increases size and quality of fruits and nuts*

Potassium Deficiency Symptoms Include...
• Slow growth– leaves become pale– leaf size and shoot growth are reduced
• The tip and subterminal margins of leaves become necrotic– leaf tip sometimes curls upward– Vikings “prow”
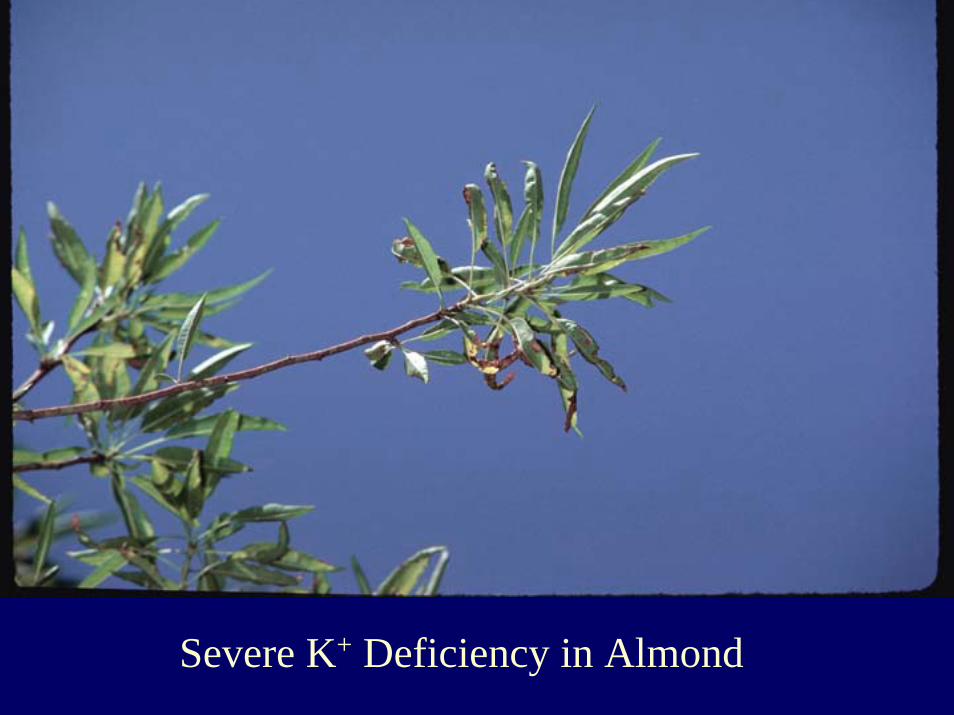
Severe K+ Deficiency in Almond

How do we know if we need to apply potassium fertilizer?
LEAF ANALYSES!

The University “Party Line”• Deficient: below 1% K• Adequate: over 1.4% K
• *based on leaves sampled from non-fruiting spurs in July
• **What???
• ***Numbers were developed many decades ago based on foliar symptoms - not yield
• ****Growers are no longer satisfied with yields less than 2000 lb per acre

.
• Word on the street says K+ values should be 2% or higher
• IS THIS TRUE???

Comparison of Leaf Potassium Values vs. Nonpareil Yield
A survey of 10 Stanislaus County orchards, 1997
• Survey of 10 “comparable” orchards
– Nonpareil variety– Similar age (not too old, not too young, not too sick)
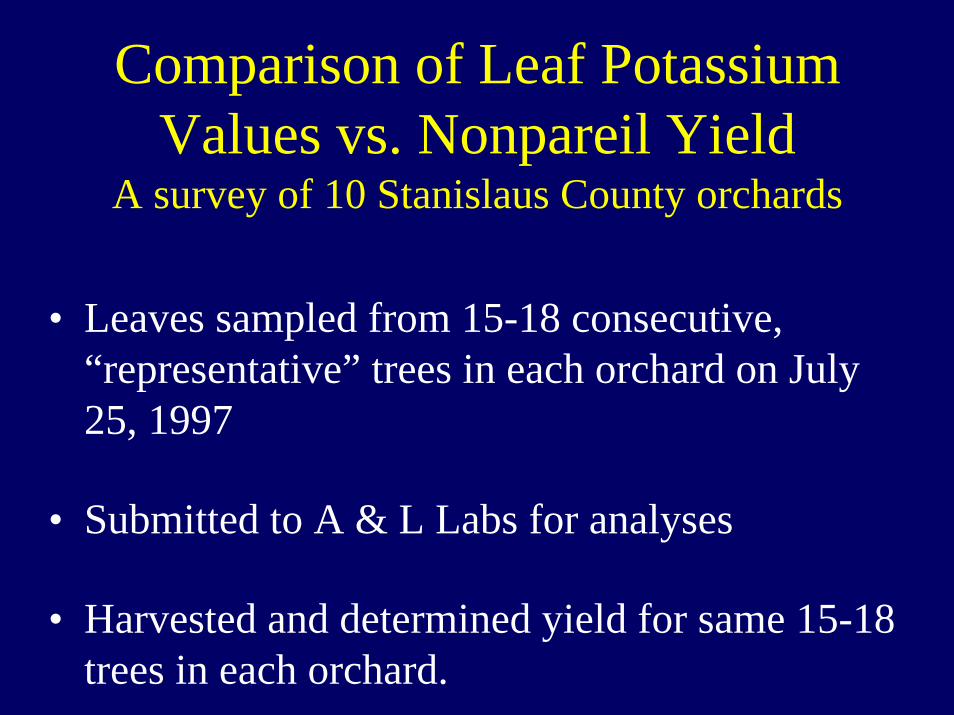
Comparison of Leaf Potassium Values vs. Nonpareil Yield
A survey of 10 Stanislaus County orchards
• Leaves sampled from 15-18 consecutive, “representative” trees in each orchard on July 25, 1997
• Submitted to A & L Labs for analyses
• Harvested and determined yield for same 15-18 trees in each orchard.

Comparison of Leaf Potassium Values vs. Nonpareil Yield
A survey of 10 Stanislaus County orchards, 1997
0
1000
2000
3000
4000
5000
0 0.5 1 1.5 2 2.5 3
Leaf K+ in July Samples
Mea
t Pou
nds p
er A
cre
Current K threshold is 1.4%

Comparison of Leaf Potassium Values vs. Kernel size
A survey of 10 Stanislaus County orchards, 1997
100
110
120
130
140
150
0 0.5 1 1.5 2 2.5 3
Leaf K+ in July Samples
Mas
s of 1
00 k
erne
ls (g
)

Summary• Almost all orchards were above the currently recommended
1.4% K threshold.
• No apparent relationship between leaf K values and yield.
• No relationship between leaf K and kernel size.
• Differences may be masked by other contributing factors (differences in other cultural practices, etc.).
• OR – Increasing potassium levels above 1.4% may not lead to higher yields (i.e., the established critical level may be correct!)
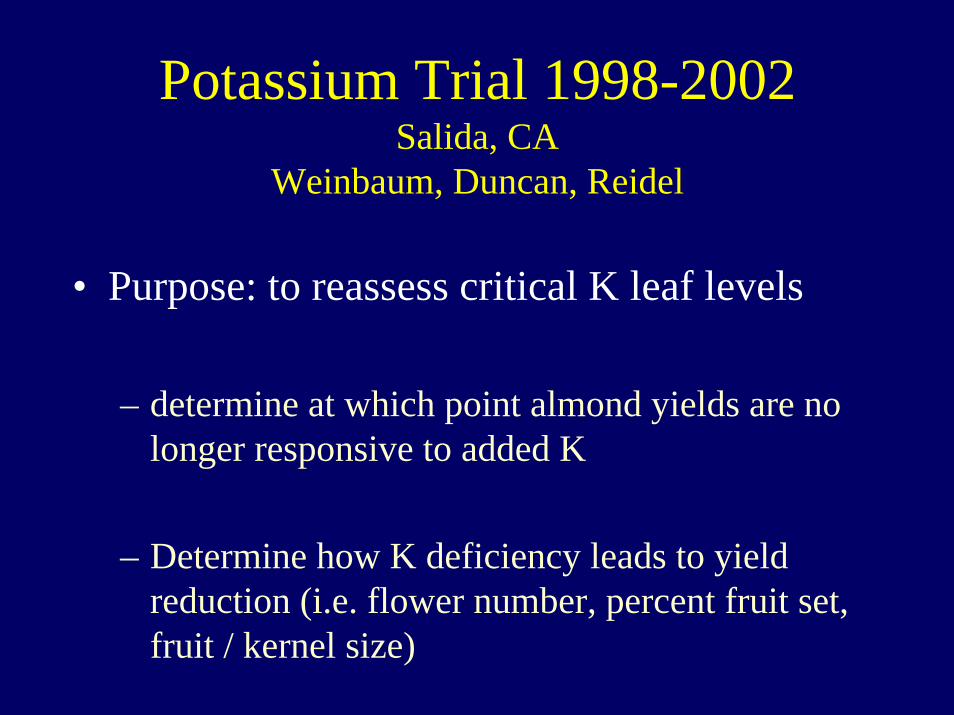
Potassium Trial 1998-2002Salida, CA
Weinbaum, Duncan, Reidel
• Purpose: to reassess critical K leaf levels
– determine at which point almond yields are no longer responsive to added K
– Determine how K deficiency leads to yield reduction (i.e. flower number, percent fruit set, fruit / kernel size)
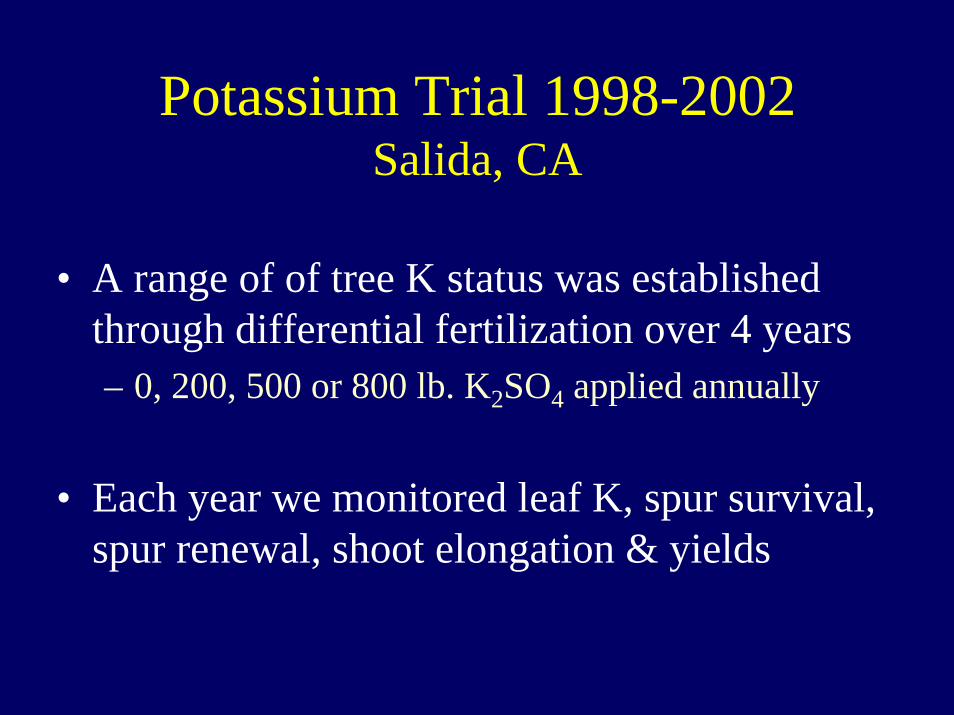
Potassium Trial 1998-2002Salida, CA
• A range of of tree K status was established through differential fertilization over 4 years– 0, 200, 500 or 800 lb. K2SO4 applied annually
• Each year we monitored leaf K, spur survival, spur renewal, shoot elongation & yields

Leaf Potassium Dynamics During FourYears of Differential Fertilization with
Potassium Sulfate
00.20.40.60.8
11.21.41.61.8
2
1998 1999 2000 2001
July
Lea
f K (%
)
0 lb200 lb500 lb800 lb

Yield of Nonpareil Almond Trees After Four Years of Differential Potassium Fertilizer Rates
2002
0
500
1000
1500
2000
2500
3000
3500
Mea
t lb
per
acre
0 200 500 800Pounds of sulfate of potash applied per acre each year.
AA
B AB

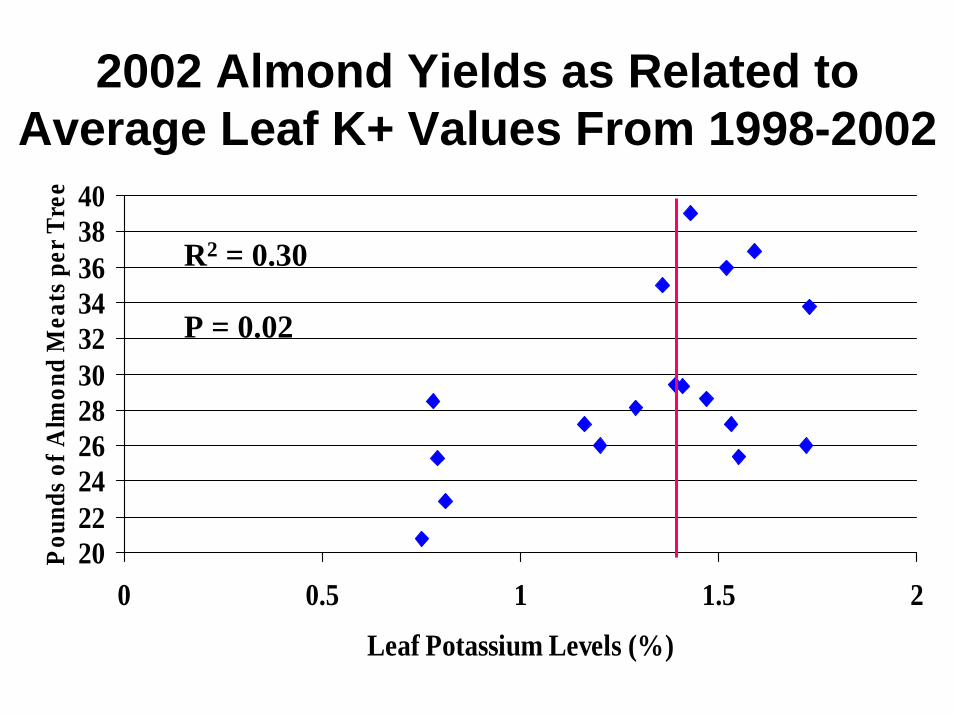
2002 Almond Yields as Related to Average Leaf K+ Values From 1998-2002
2022242628303234363840
0 0.5 1 1.5 2
Leaf Potassium Levels (%)
Pou
nds o
f Alm
ond
Mea
ts p
er T
ree
R2 = 0.30
P = 0.02
2002 Almond Yields as Related to Average Leaf K+ Values From 1998-2002
2022242628303234363840
0 0.5 1 1.5 2
Leaf Potassium Levels (%)
Pou
nds o
f Alm
ond
Mea
ts p
er T
ree
R2 = 0.30
P = 0.02
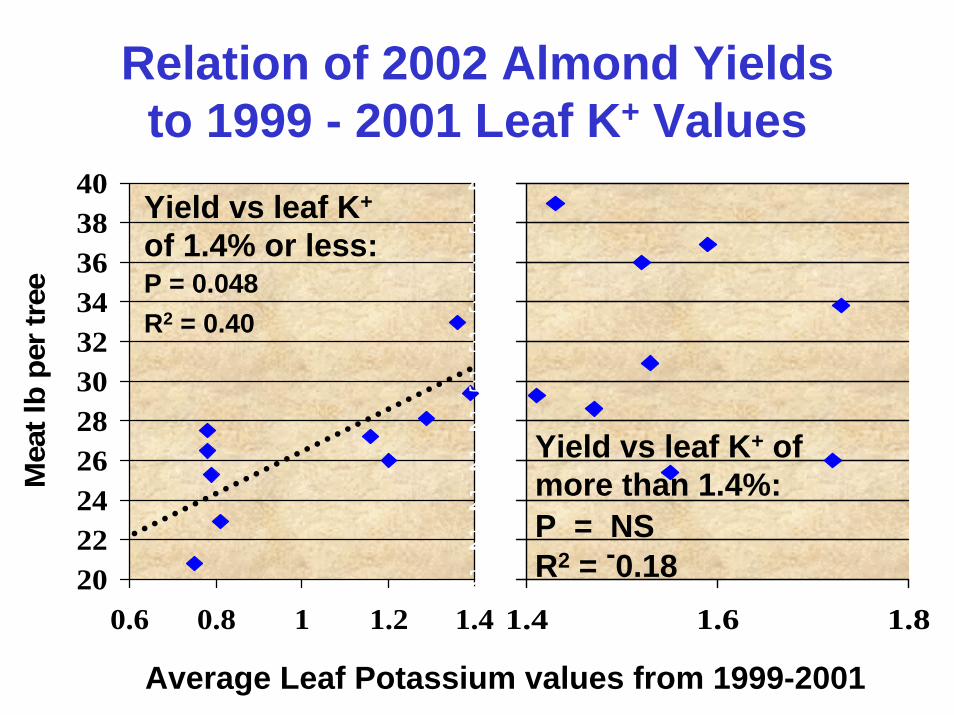
Relation of 2002 Almond Yields to 1999 - 2001 Leaf K+ Values
2022242628303234363840
0.6 0.8 1 1.2 1.4
Mea
t lb
per t
ree
2022242628303234363840
1.4 1.6 1.8
P = 0.048R2 = 0.40
P = NSR2 = -0.18
Average Leaf Potassium values from 1999-2001
Yield vs leaf K+
of 1.4% or less:
Yield vs leaf K+ of more than 1.4%:

Summary of Results of 5 Year Trial
• 200 lb of annually applied sulfate of potash barely maintained K leaf levels
• It took 4 years of 800 lb K2SO4 applications to raise leaf levels from 1.2% to 1.9 %
• Unfertilized trees fell from 1.2% to 0.6%
• Leaf symptoms not obvious until 1% K or less

Summary of Results of 5 Year Trial
• It took three years to significantly affect yield
• Inadequate K did not affect – percent fruit set
– kernel size

Summary of Results of 5 Year Trial
• Inadequate potassium reduced yield because:
– Mortality of fruiting spurs was increased
– Flowering of surviving spurs was reduced
– Shoot growth and spur renewal was reduced

Summary of Results of 5 Year Trial
Data suggest that 1.4% K+ in July sampled leaves is pretty close to
correct economic threshold

Now that we have established that the K+ critical level is 1.4%, what
is the best way to fertilize?

Annual Potassium Needs
• Almonds– nitrogen ~ 200 lb. N / acre– potassium ~ 250 lb. K2O / acre
• Peaches– nitrogen ~ 100 lb. N / acre– potassium ~ 125 lb. K2O / acre

Annual Potassium Needs
• Although peaches and almonds use more potassium than nitrogen each year, do we need to add more potassium than nitrogen each year to maintain sufficient levels??
• Not always (not usually??)

Annual Potassium Needs
• Depends on:– soil parent material
– soil texture (leaching)
– irrigation system
– amount of potassium carried away each year
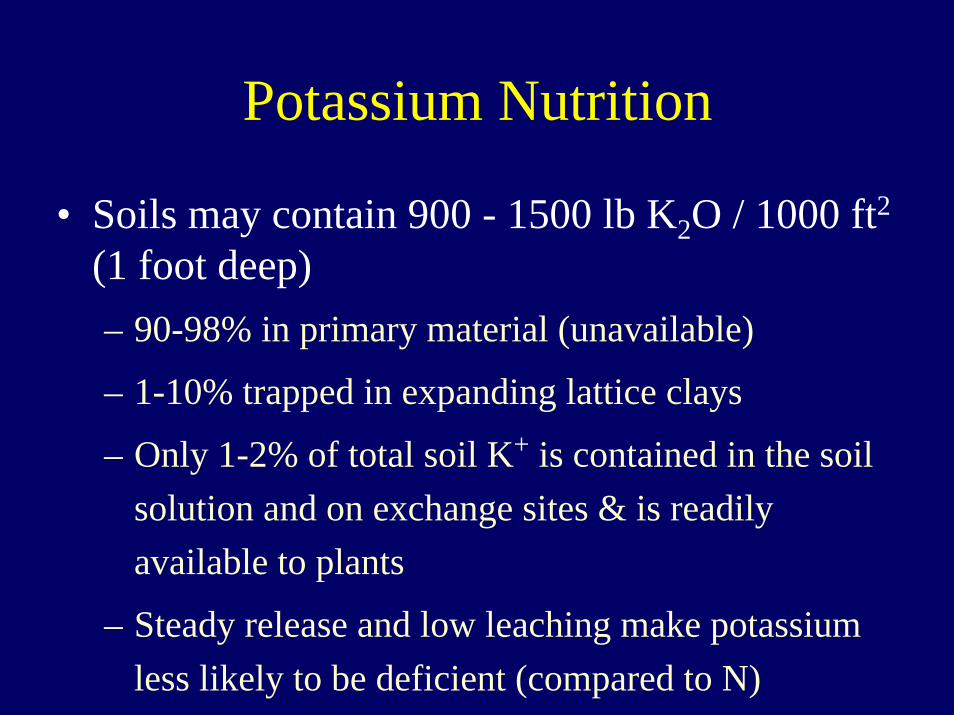
Potassium Nutrition
• Soils may contain 900 - 1500 lb K2O / 1000 ft2
(1 foot deep)– 90-98% in primary material (unavailable)
– 1-10% trapped in expanding lattice clays
– Only 1-2% of total soil K+ is contained in the soil solution and on exchange sites & is readily available to plants
– Steady release and low leaching make potassium less likely to be deficient (compared to N)

Potassium Nutrition
• Fertilizers are expressed as % K20
• Taken up by plant as K+
• Remains in the plant as K+

Potassium Fertilizers Should be Applied in a Concentrated Band
• Soil particles are negatively (-) charged• K+ ions are bound tightly to soil particles• Soil particles must be saturated with K+
before it is available in soil solution
Is it cost efficient to apply a “Tree & Vine” fertilizer (i.e. 15-15-15)?

Cost to Supply 250 lb K2O Using Various K Fertilizers (2004)
}• Muriate of potash (KCl): 60-63% K2O
– 400 lb KCl @ $185 / ton = $38 / acre• Sulfate of potash (K2SO4) ~ 52% K2O
– 480 lb K2SO4 @ $270 / ton = $65 / acre
• Potassium thio sulfate (0-0-25-17)– 1000 lb @ $270 / ton = $135 / acre
• Liquid K2SO4 (1-0-8-2.5)– 3125 lb @ $85 / ton = $133 / acre
Banded
} Injected

One last K Trial-Roland Meyer & John Edstrom, 1996-1999
• Experiment compared surface banded K2SO4 with injected K sources:– potassium sulfate– potassium chloride– potassium thiosulfate– mono-potassium sulfate
• Three irrigation systems– microsprinklers– double-lined drip– single-lined drip

Yield & Leaf K Values Related to Potassium Fertilizer Formulation
Single line drip 1998 leaf K+ 1998 yield 1999 leaf K+ 1999 yield
No K 1.18 d 2449 ab 1.09 d 2383 c
1 lb K20 / tree (K2SO4) 1.78 b 2469 ab 1.73 ab 2944 abc
2 lb K20 (K2SO4) 1.87 ab 2494 ab 1.94 a 2607 bc
1 lb K20 (MKP) 1.77 b 2786 a 1.37 cd 3280 a
1 lb K20 (KTS) 1.73 bc 2307 ab 1.71 ab 2741 abc
2 lb K20 (K2SO4 band) 1.48 c 2102 b 1.53 bc 2431 c

Yield & Leaf K Values Related to Potassium Fertilizer Formulation
Microsprinklers 1998 leaf K+ 1998 yield 1999 leaf K+ 1999 yield
No K 1.26 f 2645 abc 1.38 f 2332 e
1 lb K20 (K2SO4) 1.71 e 2916 abc 1.87 e 2725 cde
2 lb K20 (K2SO4) 2.33 bc 2698 abc 2.63 bc 3054 abcd
1 lb K20 (MKP) 2.06 cde 2952 ab 2.04 de 3475 ab
1 lb K20 (KTS) 1.81 de 3207 a 1.91 e 2500 de
2 lb K20 (K2SO4 band)
2.11 cd 2325 c 2.07 de 3456 ab

Bottom Line for Nickels Field Trial• Injected mono-potassium phosphate tended to give
the highest yields, followed by injected K2SO4
• Banded K2SO4 increased leaf K and yield substantially in microsprinkler and double-lined drip plots, but not in single-lined drip plots
• There was no relationship between K fertilization and kernel size

Drip hose too far from K application

Drip hose needs to be over K fertilizer

Roger’s Recommendations
1.4% leaf K is probably a pretty accurate critical value
I don’t argue with any grower who wants 2-3% K - its their money!
I am skeptical of grower testimonials that higher K = higher yields

Roger’s Recommendations
Banding dry K fertilizers is probably best for flood irrigation, maybe micros
Using KCl instead of K2SO4 is probably OK in flood-irrigated, sandy locations
(monitor Cl)
Banding is not efficient in drip-irrigated orchards - better to inject
.Correcting K+ deficiency takes a long time with substantial loss in yield
By the time you see deficiency symptoms, trees are already deficient
and yield is lost
Monitor with leaf samples - maintain an ‘adequate’ cushion above 1.4% K