postneonatal mortality among alaska native infants — alaska, … · the alaska bureau of vital...
TRANSCRIPT

Weekly / Vol. 61 / No. 1 January 13, 2012
U.S. Department of Health and Human ServicesCenters for Disease Control and Prevention
Morbidity and Mortality Weekly Report
INSIDE 6 Surveillance for Chronic Hepatitis B Virus Infection —
New York City, June 2008–November 2009 10 CDC Grand Rounds: Prescription Drug Overdoses —
a U.S. Epidemic 14 Vital Signs: Binge Drinking Prevalence, Frequency,
and Intensity Among Adults — United States, 201020 Notice to Readers 21 QuickStats
Alaska’s postneonatal mortality rate of 3.4 deaths per 1,000 live births during 2006–2008 was 48% higher than the 2007 U.S. rate of 2.3 per 1,000 (1,2). Among American Indian/Alaska Native (AI/AN) infants, the Alaska rate of 8.0 per 1,000 was 70% higher than the U.S. rate of 4.7. The Alaska Division of Public Health analyzed a linked birth-infant death file for 1989–2009 to examine temporal trends in postneonatal mortality in Alaska, specifically in the Alaska Native (AN) population. Overall and non-Alaska Native (non-AN) rates declined during the entire period, but no significant trends in AN-specific mortality were apparent. Infant mortality review committee findings indicated a decline during 1992–2007 among all postneonatal deaths attributed to sudden infant death syndrome (SIDS) or sudden unexplained infant death (SUID), but not for other causes. Lack of progress in reducing postneonatal mortality, particularly among AN infants, indi-cates a need for renewed emphasis within the Alaska health-care community. Current initiatives to reduce preventable causes of postneonatal mortality should be evaluated and successful models more widely implemented.
The Alaska Bureau of Vital Statistics provided an electronic file with linked records for the 222,317 recorded live births and 821 postneonatal deaths among infants aged 28–364 days born to Alaska residents during 1989–2009. Potential risk factors for infant mortality that might be determined from information included on birth certificates were identified through prior research and literature review. Those risk factors included infant birth weight and gestational age; maternal race, years of education, age, and prenatal cigarette, smokeless tobacco, and alcohol use; and a composite variable reflecting maternal marital status and presence of a father’s name on the birth certificate (1,3). Race was categorized as AN, which included all indigenous groups, or non-AN, based on mother’s race.
For the analysis, logistic regression modeling was conducted, as was joinpoint testing for significance of trends and to detect significant points of change in the slope of linear trends. In join-point, the permutation test was used, and log-linear models created
to calculate annual percent change (APC) in the linear trend of mortality rates. Average annual percentage change (AAPC) was calculated to summarize and compare trends in the prevalences of risk factors among births during 2000–2009 (4). Cause of death was obtained from the Alaska Maternal Infant Mortality Review (MIMR), a committee coordinated by the Alaska Division of Public Health and consisting of private physicians, nurses, and other child health experts. At the time of this report, the MIMR committee had reviewed medical records, autopsy reports, police reports, and other records for >99% of Alaskan postneonatal deaths that occurred during 1992–2007 and issued findings regarding causes and contributing factors to the deaths and pre-ventability recommendations.
Overall postneonatal mortality declined from 4.9 deaths per 1,000 births in 1989 to 3.9 in 2009 (APC = -2.2; 95% confidence interval [CI] = -3.3 to -1.0). The non-AN rate also declined during the study period (APC = -2.8; CI = -4.5 to -1.1), although annual rates fluctuated (Figure). Among non-AN, 1989 and 2009 rates were identical (3.0 per 1,000 births), yet joinpoint analysis selected a single declining slope as the best fit linear trend for the entire study period. No significant trends in AN mortality rates were apparent (APC = -1.5; CI = -3.6 to 0.6), and no significant changes in slope were identified. The AN rate was higher than the non-AN rate during the first half and the second half of the study period (1989–1999
Postneonatal Mortality Among Alaska Native Infants — Alaska, 1989–2009

Morbidity and Mortality Weekly Report
2 MMWR / January 13, 2012 / Vol. 61 / No. 1
The MMWR series of publications is published by the Office of Surveillance, Epidemiology, and Laboratory Services, Centers for Disease Control and Prevention (CDC), U.S. Department of Health and Human Services, Atlanta, GA 30333.Suggested citation: Centers for Disease Control and Prevention. [Article title]. MMWR 2012;61:[inclusive page numbers].
Centers for Disease Control and PreventionThomas R. Frieden, MD, MPH, Director
Harold W. Jaffe, MD, MA, Associate Director for ScienceJames W. Stephens, PhD, Director, Office of Science Quality
Stephen B. Thacker, MD, MSc, Deputy Director for Surveillance, Epidemiology, and Laboratory ServicesStephanie Zaza, MD, MPH, Director, Epidemiology and Analysis Program Office
MMWR Editorial and Production StaffRonald L. Moolenaar, MD, MPH, Editor, MMWR Series
John S. Moran, MD, MPH, Deputy Editor, MMWR SeriesTeresa F. Rutledge, Managing Editor, MMWR Series
Douglas W. Weatherwax, Lead Technical Writer-EditorDonald G. Meadows, MA, Jude C. Rutledge, Writer-Editors
Martha F. Boyd, Lead Visual Information Specialist
Maureen A. Leahy, Julia C. Martinroe, Stephen R. Spriggs, Terraye M. Starr
Visual Information SpecialistsQuang M. Doan, MBA, Phyllis H. King
Information Technology Specialists
MMWR Editorial BoardWilliam L. Roper, MD, MPH, Chapel Hill, NC, Chairman
Virginia A. Caine, MD, Indianapolis, INMatthew L. Boulton, MD, MPH, Ann Arbor, MI
Jonathan E. Fielding, MD, MPH, MBA, Los Angeles, CADavid W. Fleming, MD, Seattle, WA
William E. Halperin, MD, DrPH, MPH, Newark, NJKing K. Holmes, MD, PhD, Seattle, WADeborah Holtzman, PhD, Atlanta, GATimothy F. Jones, MD, Nashville, TN
Dennis G. Maki, MD, Madison, WIPatricia Quinlisk, MD, MPH, Des Moines, IA
Patrick L. Remington, MD, MPH, Madison, WIJohn V. Rullan, MD, MPH, San Juan, PR
William Schaffner, MD, Nashville, TNDixie E. Snider, MD, MPH, Atlanta, GA
John W. Ward, MD, Atlanta, GA
rate ratio [RR] = 2.4; CI = 2.0 – 2.9; 2000–2009 RR = 3.1; CI = 2.5 – 3.9).
Among AN infants, significant bivariate risk factors for postneonatal mortality during 2000–2009 included pre-term birth (RR for birth at <34 weeks = 4.6; RR for birth at
34–36 weeks = 1.9) and low birth weight (RR = 3.8), unmar-ried mother with no father indicated (RR = 3.5), maternal pre-natal alcohol and cigarette use (RR = 2.2 and 1.9, respectively), and maternal education <12 years (RR = 1.6) (Table 1). In a multivariate logistic regression model containing education, cigarette use, alcohol use, and partner status, education was no longer significant and therefore was dropped from the final model. The prevalence of AN births to unmarried mothers with no father indicated on the birth certificate increased during 2000–2009 (AAPC = 7.3; CI = 4.1 to 10.6).
Cause-specific mortality rates, allowing for multiple causes of death, were calculated for 4-year intervals because of the small numbers of events (Table 2). The overall postneona-tal mortality rate for SIDS or SUID declined from 2.2 per 1,000 births during 1992–1995 to 1.4 per 1,000 during 2004–2007 (APC = -13.3; CI = -24.3 to -0.7), but no trends were observed for other causes. Less than five postneonatal deaths during 1992–1995 were attributed to preterm birth or perinatal events, compared with 11 or more deaths related to preterm birth during other 4-year periods and 10 perinatal event-related deaths during 2004–2007. Among AN infants only, no cause-specific trends were significant.
Reported by
Margaret B. Young, MPH, Bradford D. Gessner, MD, Alaska Division of Public Health. Corresponding contributor: Margaret B. Young, [email protected], 907-269-5657.
0
2
4
6
8
10
12
14
1989 1991 1993 1995 1997 1999 2001 2003 2005 2007 2009
Rate
Year
Alaska NativeOverallNon-Alaska Native
FIGURE. Annual postneonatal mortality rates,* overall and by Alaska Native status — Alaska 1989–2009
* Per 1,000 live births.

Morbidity and Mortality Weekly Report
MMWR / January 13, 2012 / Vol. 61 / No. 1 3
TABLE 1. Risk factors listed on birth certificate among Alaska Native births and postneonatal deaths — Alaska, 2000–2009
Risk factor Births
Post-neonatal
deaths PNM rate*
Rate ratio (95% CI) AOR† (95% CI)
2009 birth
prevalence(%)
AAPC§ for birth
prevalence2000–2009
Overall 26,386 179 6.8Birth weight (gms)
<2,500 1,498 33 22.0 3.8 (2.6–5.5) (6.3) 0.6≥2,500 24,679 143 5.8 Ref (93.7) 0.0
Gestational age (wks)<34 889 23 25.9 4.6 (3.0–7.1) (3.6) -0.834–36 2,374 26 11.0 1.9 (1.3–3.0) (10.1) 0.2≥37 23,123 130 5.6 Ref (86.3) -0.1
Maternal education (yrs)<12 6,992 65 9.3 1.6 (1.2–2.2) (27.0) 0.1≥12 18,640 106 5.7 Ref (73.0) 0.0
Maternal age (yrs)<19 2,796 17 6.1†† 1.2 (0.6–2.5) (9.8) -1.3¶
19–34 21,024 149 7.1 1.4 (0.8–2.5) (81.4) 0.8¶
≥35 2,557 13 5.1†† Ref (8.7) -3.4¶
Prenatal substance use**Cigarette 8,470 84 9.9 1.9 (1.4–2.5) 1.7 (1.2–2.2) (32.0) -0.3Smokeless tobacco 3,539 27 7.6 1.1 (0.8–1.7) (12.4) -3.0¶
Alcohol 1,258 18 14.3†† 2.2 (1.4–3.6) 1.7 (1.0–2.8) (5.3) -0.8Partner status
Married 9,515 51 5.4 Ref Ref (33.1) -2.8¶
Unmarried, father listed 14,128 76 5.4 1.0 (0.7–1.4) 0.9 (0.6–1.3) (50.7) 0.2Unmarried, no father listed 2,743 52 19.0 3.5 (2.4–5.1) 3.1 (2.1–4.7) (16.2) 7.3¶
Abbreviations: PNM = postneonatal mortality; CI = confidence interval; AOR = adjusted odds ratios; AAPC = average annual percent change; Ref = referent. * Number of infants who died after age 27 days and before age 1 year / number of live births during same calendar year × 1,000. † For final model containing prenatal cigarette, prenatal alcohol, and partner status. § Calculated in joinpoint. ¶ Statistically significant AAPC, based on 95% confidence interval. ** For each substance listed, the reference group for ratios is births with no prenatal use of the substance indicated on the birth certificate. †† Rates based on fewer than 20 occurrences are statistically unreliable and should be used with caution.
TABLE 2. Cause-specific postneonatal mortality rates (allowing for multiple causes of death), by 4-year periods — Alaska Maternal Infant Mortality Review, 1992–2007
Cause of death*
1992–1995 1996–1999 2000–2003 2004–2007
Post-neonatal
deathsMortality
rate
Post-neonatal
deathsMortality
rate
Post-neonatal
deathsMortality
rate
Post-neonatal
deathsMortality
rate
All postneonatal deathsSIDS/SUID/asphyxia† 94 2.2 67 1.7 67 1.7 58 1.4Preterm birth — 11 0.3§ 15 0.4§ 15 0.4§
Congenital anomalies 26 0.6 34 0.9 23 0.6 27 0.6Infections 27 0.6 27 0.7 35 0.9 28 0.7Perinatal events — — — 10 0.2§
Injury 14 0.3§ 7 0.2§ 17 0.4§ 15 0.4§
Unknown 19 0.4§ 8 0.2§ 15 0.4§ 13 0.3§
Alaska Native postneonatal deathsSIDS/SUID/asphyxia 37 3.8 29 3.0 35 3.6 29 2.7Preterm birth — 5 0.5§ 10 1.0§ —Congenital anomalies 9 0.9§ 10 1.0§ 12 1.2§ 15 1.4§
Infections 12 1.2§ 13 1.4§ 19 1.9§ 12 1.1§
Perinatal events — — — —Injury — — — 6 0.6§
Unknown 6 0.6§ — 8 0.8§ 9 0.8§
Abbreviations: SIDS = sudden infant death syndrome; SUID = sudden unexplained infant death.* Rates were not calculated for 4-year periods that had fewer than five deaths attributed to a specific cause.† Significant linear trend based on 95% confidence interval for the average percent change in the rate.§ Rates based on fewer than 20 occurrences are statistically unreliable and should be used with caution.

Morbidity and Mortality Weekly Report
4 MMWR / January 13, 2012 / Vol. 61 / No. 1
Editorial Note
Postneonatal mortality often is related to exposure to envi-ronmental risks and family socioeconomic characteristics, and thus, in theory, should be preventable (3). Although mortality rates declined among the non-AN population, AN postneonatal mortality rates did not show a significant trend. Postneonatal mortality for the United States declined from 3.2 deaths per 1,000 live births in 1990 to 2.3 in 2000; how-ever, as in Alaska, no improvements have occurred since, either overall or specifically for AI/AN children (1,5).
The decrease in mortality caused by SIDS and SUID is encouraging because both account for a large proportion of postneonatal deaths among the overall population (1). Some of this decrease might be attributable to the Back to Sleep* public education campaign, which was initiated in Alaska in 1996. However, this result might have resulted, in part, from a diagnostic shift whereby deaths during later years were assigned to different causes (6). The greater number of deaths attributed to preterm birth and perinatal events during the later years might have resulted from a greater likelihood of survival outside the neonatal period, combined with a small increase in the prevalence of preterm births at <37 weeks among non-AN (mostly for births at 34–36 weeks). A lack of decline in the overall U.S. infant mortality rate during 2000–2005 has been attributed to increases in preterm births and preterm-related mortality (7).
Prior research identified three independent factors that are associated with increased postneonatal mortality among AN compared with non-AN infants in Alaska: low maternal education, any prenatal substance use, and unmarried marital status combined with the lack of a father’s name on the birth certificate (3). The prevalence of the latter among AN births increased during 2000–2009, and these infants were three times more likely to die in the postneonatal period than infants with a father listed or a married mother. Maternal substance use, particularly tobacco and alcohol, has been associated with SIDS and SUID, and the high prevalence of these factors combined with the lack of decline among AN births might be one factor in the lack of decline of SIDS and SUID mortality among AN infants. AN infants also might have additional risk factors that were not measured. For example, preliminary evidence suggests that carnitine palmitoyltransferase type 1A deficiency, a fatty acid disorder highly prevalent in AN and other indigenous circumpolar populations, might contribute to infant mortality (8).
The findings in this report are subject to at least three limita-tions. First, the small annual number of postneonatal deaths in Alaska complicates interpretation and identification of factors influencing yearly changes in rates. Annual rates are presented here to increase the information available for examining trends; however, rates based on fewer than 20 occurrences are statis-tically unreliable and should be used with caution. Second, information on risk factors and cause of death might be biased and incomplete. Birth certificates might provide unreliable data on prenatal substance use (9). Prenatal care was not included as a risk factor because of suspected misclassification and reporting issues, particularly for rural Alaska. The significance of marital status and presence of a father’s name on the birth certificate has limitations related to interpretability and mis-classification, and the meaning might vary by cultural group (3). Finally, MIMR data are subject to potential bias resulting from changes in committee membership and the knowledge and expertise of individual members. However, the informa-tion available from MIMR on each case was comprehensive and might more accurately indicate cause of death than death certificate data (6,10).
To address Alaska’s high overall postneonatal mortality and infant deaths related to SIDS and SUID or unintentional suffo-cation, the Alaska Division of Public Health launched an Infant Safe Sleep Initiative in 2009, and research is ongoing to support an associated statewide social marketing campaign to begin in 2012. This initiative builds on SIDS and SUID prevention work already begun by the national Healthy Native Babies Project,† and ongoing work by tribal health organizations and
What is already known on this topic?
Compared with postneonatal mortality rates for the United States overall, Alaska has higher rates. Within the state, rates are higher for Alaska Native (AN) infants than non-Alaska Native (non-AN) infants.
What is added by this report?
During 1989–2009, postneonatal mortality rates declined for non-AN infants in Alaska, but rates varied greatly and no sustained period of decrease was experienced by AN infants during the period. The disparity between AN and non-AN rates persisted and did not decrease.
What are the implications for public health practice?
Although Alaska’s postneonatal mortality rates have declined overall during the past 20 years, renewed efforts are needed to reduce rates among the AN population, which continues to experience high rates. To address infant health outcomes among the overall population, including mortality and safe sleep, the Alaska Division of Public Health launched an Infant Safe Sleep Initiative in 2009 and is awarding contracts in early 2012 for the Healthy Start and Maternal, Infant, and Early Childhood Home Visiting programs to Alaskan agencies.
* Additional information is available at http://www.nichd.nih.gov/sids. † Additional information is available at http://www.nichd.nih.gov/news/resources/spotlight/110811-hnbp-workbook-packet.cfm.

Morbidity and Mortality Weekly Report
MMWR / January 13, 2012 / Vol. 61 / No. 1 5
others in Alaska. The Division also is awarding contracts for the Healthy Start and Maternal, Infant, and Early Childhood Home Visiting programs to Alaskan agencies that will start activities in early 2012 to address infant health outcomes, including mortality and safe sleep. Healthy Start also targets factors that contribute to preterm birth, such as tobacco use. Studies are underway to explore the effect on mortality of modifiable conditions, such as carnitine palmitoyltransferase type 1A deficiency, which might assist in targeting interven-tions. Future evaluations of these projects, especially in AN communities, could provide further evidence to understand the underlying causes of the persistent disparity between AN and non-AN in postneonatal mortality rates, and reasons for the lack of progress in reducing AN mortality.
References 1. Mathews TJ, MacDorman MF. Infant mortality statistics from the 2007
period linked birth/infant death data set. Natl Vital Stat Rep 2011;59(6). 2. Alaska Bureau of Vital Statistics. 2008 annual report. Juneau, AK: Alaska
Department of Health and Social Services, Division of Public Health, Bureau of Vital Statistics; 2009. Available at http://www.hss.state.ak.us/dph/bvs/data/2008ar.htm. Accessed January 5, 2012.
3. Blabey MH, Gessner BD. Three maternal risk factors associated with elevated risk of postneonatal mortality among Alaska Native population. Matern Child Health J 2009;13:222–30.
4. Clegg LX, Hankey BF, Tiwari R, Feuer EJ, Edwards BK. Estimating average annual per cent change in trend analysis. Stat Med 2009;28:3670–82.
5. National Center for Health Statistics. Health, United States, 2010: with special feature on death and dying. Hyattsville, MD: US Department of Health and Human Services, CDC, National Center for Health Statistics; 2011. Available at http://www.cdc.gov/nchs/hus.htm. Accessed January 6, 2012.
6. Shapiro-Mendoza CK, Tomashek KM, Anderson RN, Wingo J. Recent national trends in sudden, unexpected infant deaths: more evidence supporting a change in classification or reporting. Am J Epidemiol 2006;163:762–9.
7. MacDorman MF, Mathews TJ. Recent trends in infant mortality in the United States. NCHS Data Brief No 9. Hyattsville, MD: US Department of Health and Human Services, CDC, National Center for Health Statistics; 2008. Available at http://www.cdc.gov/nchs/data/databriefs/db09.htm. Accessed January 6, 2012.
8. Gessner BD, Gillingham MB, Birch S, Wood T, Koeller DM. Evidence for an association between infant mortality and a carnitine palmitoyltransferase 1A genetic variant. Pediatrics 2010;126:945–51.
9. Northam S, Knapp TR. The reliability and validity of birth certificates. J Obstet Gynecol Neonatal Nurs 2006;35:3–12.
10. CDC. Misclassification of infant deaths—Alaska, 1990–1991. MMWR 1992;41:584–5,591.

Morbidity and Mortality Weekly Report
6 MMWR / January 13, 2012 / Vol. 61 / No. 1
Chronic hepatitis B virus (HBV) infection is a leading cause of cirrhosis and liver cancer worldwide (1); the estimated prevalence in the United States is 0.3%–0.5% (2). Each year, approximately 11,500–13,000 persons are newly reported with a positive HBV test to the New York City (NYC) Department of Health and Mental Hygiene (DOHMH) (3). To characterize chronic HBV patients, DOHMH began ongoing enhanced chronic HBV surveillance, selecting a random sample of newly reported cases and collecting more detailed information from the patients’ clinicians. This report summarizes investiga-tions of 180 randomly selected HBV cases reported during June 2008–November 2009. Approximately two thirds (67%) of patients were Asian, and the most commonly reported reason for HBV testing was the patient’s birth country or race/ethnic-ity (27%). In 70% of cases, the clinician did not know of any patient risk factors. Sixty-nine percent of clinicians stated that they counseled their patients about notifying close contacts about their infection, and 75% counseled about transmission and prevention. Sixty-two percent did not know their patient’s hepatitis A vaccination status despite recommendations. This surveillance effort provided quantitative data on health disparities useful for identifying opportunities for outreach and education, and it showed that not all patients received recommended prevention and treatment services. In response to these findings, DOHMH now routinely distributes HBV patient education materials to populations in need.
DOHMH requires clinicians and laboratories to report posi-tive results of tests for hepatitis B surface antigen (HBsAg), e antigen (HBeAg), and HBV DNA for all NYC residents. The CDC and Council of State and Territorial Epidemiologists (CSTE) case definition for confirmed chronic HBV infec-tion requires two positive tests at least 6 months apart or one positive test and a negative test for immunoglobulin M (IgM) antibodies to HBV core antigen.* This project included all patients with a positive HBsAg, HBeAg, or HBV DNA as long as there was no evidence of acute infection (IgM or case reported as acute by clinician). All data from reports were either directly entered into a DOHMH database or imported from DOHMH’s electronic laboratory reporting system and deduplicated automatically. In 2009, a total of 84,659 reports were received; for the same year, 11,589 persons were newly reported with chronic HBV infection. As a result of the large volume of reports, investigation of each patient was not feasible.
To learn more about HBV patients in NYC, every 2 months persons newly reported to DOHMH 2–3 months earlier with a positive HBV test were selected from the HBV surveil-lance database. Patients without a recorded date of birth were excluded (<3% of reports). From this dataset, a simple random sample of 20 patients was created using a SAS survey selec-tion procedure.† Investigators telephoned the clinician who ordered the HBV test, then faxed a standard questionnaire, and followed-up by telephone as needed. If the clinician mentioned another clinician who knew the patient better, staff members contacted this clinician as well. In cases in which clinicians were unable or unwilling to provide information by telephone or fax, DOHMH staff members reviewed medical charts. Data collected included demographics, reasons for HBV testing, hepatitis A vaccination status, and HBV-related risk factors, care, and patient counseling (e.g., modes of transmission and contact notification). Patients’ most recent positive HBV test results were obtained to confirm HBV infection status. When clinicians did not report the patient’s country of birth, staff members contacted patients directly for that information. Frequency tables were generated using statistical software. Fisher’s exact test was used to assess relationships between variables. Statistical significance was defined as p<0.05.
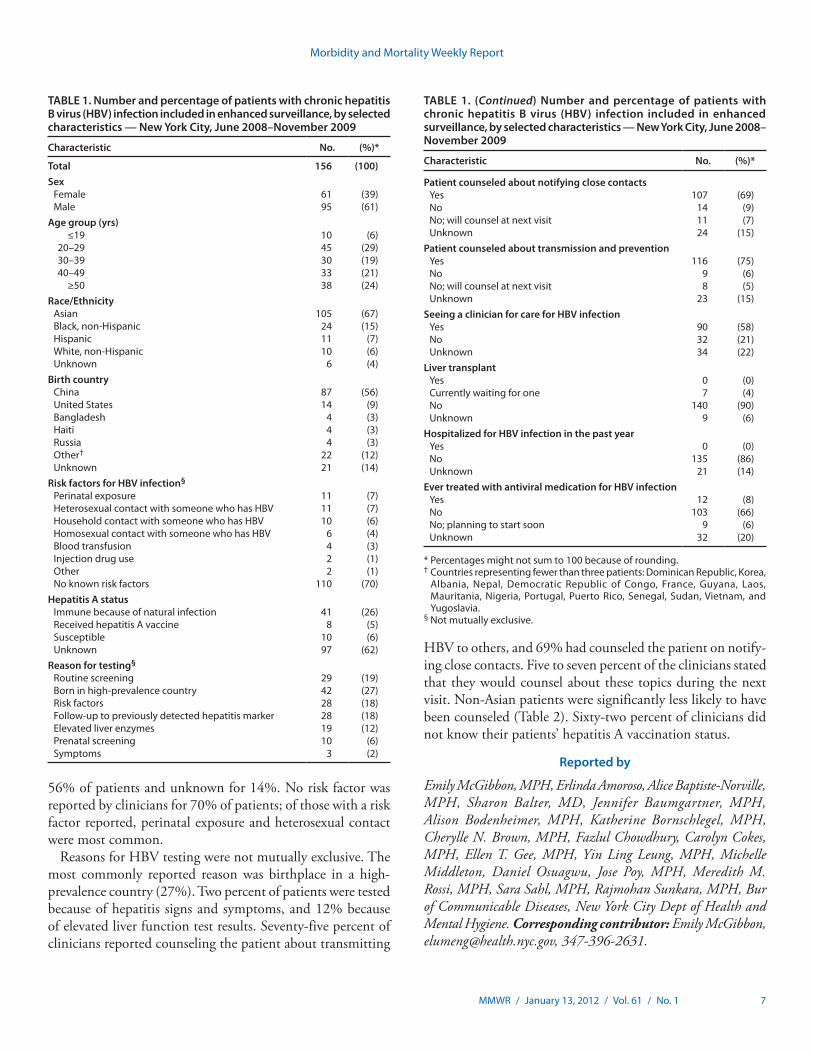
From September 2008 to January 2010, a total of 180 patients were selected and investigated for enhanced surveil-lance; their report dates ranged from June 2008 to November 2009. From these 180 patients selected, completed ques-tionnaires were obtained for 156 (87%) and these 156 were included in this analysis. Among the 24 patients excluded, five questionnaires could not be completed, five were laboratory reporting errors, two had acute HBV, four were not NYC residents, and eight did not have HBV infection confirmed by additional laboratory results. For the 156 included patients, 135 (86%) questionnaires were completed by fax, 15 (10%) by chart review, five (3%) by telephone, and one (1%) by both fax and telephone. Also, 12 patients were contacted by DOHMH staff members to ascertain birth country. Chi-square analysis showed that sampled patients were not statistically significantly different from all patients in the HBV surveillance database for the same surveillance period in terms of age, sex, and borough of residence (3). Sixty-one percent of patients were male, 67% were Asian, and the median age was 38 years (range: 2–91 years) (Table 1). Birth country was China for
Surveillance for Chronic Hepatitis B Virus Infection — New York City, June 2008–November 2009
* Additional information available at http://www.cdc.gov/osels/ph_surveillance/nndss/casedef/hepatitisbcurrent.htm.
† Additional information available at http://support.sas.com/documentation/cdl/en/statug/63033/HTML/default/viewer.htm#statug_surveyselect_sect001.htm.
Morbidity and Mortality Weekly Report
MMWR / January 13, 2012 / Vol. 61 / No. 1 7
56% of patients and unknown for 14%. No risk factor was reported by clinicians for 70% of patients; of those with a risk factor reported, perinatal exposure and heterosexual contact were most common.
Reasons for HBV testing were not mutually exclusive. The most commonly reported reason was birthplace in a high-prevalence country (27%). Two percent of patients were tested because of hepatitis signs and symptoms, and 12% because of elevated liver function test results. Seventy-five percent of clinicians reported counseling the patient about transmitting
HBV to others, and 69% had counseled the patient on notify-ing close contacts. Five to seven percent of the clinicians stated that they would counsel about these topics during the next visit. Non-Asian patients were significantly less likely to have been counseled (Table 2). Sixty-two percent of clinicians did not know their patients’ hepatitis A vaccination status.
Reported by
Emily McGibbon, MPH, Erlinda Amoroso, Alice Baptiste-Norville, MPH, Sharon Balter, MD, Jennifer Baumgartner, MPH, Alison Bodenheimer, MPH, Katherine Bornschlegel, MPH, Cherylle N. Brown, MPH, Fazlul Chowdhury, Carolyn Cokes, MPH, Ellen T. Gee, MPH, Yin Ling Leung, MPH, Michelle Middleton, Daniel Osuagwu, Jose Poy, MPH, Meredith M. Rossi, MPH, Sara Sahl, MPH, Rajmohan Sunkara, MPH, Bur of Communicable Diseases, New York City Dept of Health and Mental Hygiene. Corresponding contributor: Emily McGibbon, [email protected], 347-396-2631.
TABLE 1. Number and percentage of patients with chronic hepatitis B virus (HBV) infection included in enhanced surveillance, by selected characteristics — New York City, June 2008–November 2009
Characteristic No. (%)*
Total 156 (100)Sex
Female 61 (39)Male 95 (61)
Age group (yrs) ≤19 10 (6)
20–29 45 (29)30–39 30 (19)40–49 33 (21)
≥50 38 (24)Race/Ethnicity
Asian 105 (67)Black, non-Hispanic 24 (15)Hispanic 11 (7)White, non-Hispanic 10 (6)Unknown 6 (4)
Birth country China 87 (56)United States 14 (9)Bangladesh 4 (3)Haiti 4 (3)Russia 4 (3)Other† 22 (12)Unknown 21 (14)
Risk factors for HBV infection§
Perinatal exposure 11 (7)Heterosexual contact with someone who has HBV 11 (7)Household contact with someone who has HBV 10 (6)Homosexual contact with someone who has HBV 6 (4)Blood transfusion 4 (3)Injection drug use 2 (1)Other 2 (1)No known risk factors 110 (70)
Hepatitis A statusImmune because of natural infection 41 (26)Received hepatitis A vaccine 8 (5)Susceptible 10 (6)Unknown 97 (62)
Reason for testing§
Routine screening 29 (19)Born in high-prevalence country 42 (27)Risk factors 28 (18)Follow-up to previously detected hepatitis marker 28 (18)Elevated liver enzymes 19 (12)Prenatal screening 10 (6)Symptoms 3 (2)
TABLE 1. (Continued) Number and percentage of patients with chronic hepatitis B virus (HBV) infection included in enhanced surveillance, by selected characteristics — New York City, June 2008–November 2009
Characteristic No. (%)*
Patient counseled about notifying close contactsYes 107 (69)No 14 (9)No; will counsel at next visit 11 (7)Unknown 24 (15)
Patient counseled about transmission and preventionYes 116 (75)No 9 (6)No; will counsel at next visit 8 (5)Unknown 23 (15)
Seeing a clinician for care for HBV infectionYes 90 (58)No 32 (21)Unknown 34 (22)
Liver transplantYes 0 (0)Currently waiting for one 7 (4)No 140 (90)Unknown 9 (6)
Hospitalized for HBV infection in the past yearYes 0 (0)No 135 (86)Unknown 21 (14)
Ever treated with antiviral medication for HBV infectionYes 12 (8)No 103 (66)No; planning to start soon 9 (6)Unknown 32 (20)
* Percentages might not sum to 100 because of rounding.† Countries representing fewer than three patients: Dominican Republic, Korea,
Albania, Nepal, Democratic Republic of Congo, France, Guyana, Laos, Mauritania, Nigeria, Portugal, Puerto Rico, Senegal, Sudan, Vietnam, and Yugoslavia.
§ Not mutually exclusive.

Morbidity and Mortality Weekly Report
8 MMWR / January 13, 2012 / Vol. 61 / No. 1
Editorial Note
This investigation showed that the majority of persons reported with chronic HBV in NYC from June 2008 to November 2009 were Asian and male, which is consistent with previous findings (4–6). In 2006, the San Francisco Health Department found that 84% of patients reported with confirmed chronic HBV infection were Asian/Pacific Islanders (5); chart reviews conducted in Olmsted County, Minnesota, indicated that approximately half of chronic HBV patients in that locality were Asian (6). These findings validate the need for continued efforts to educate clinicians and patients in Asian-American communities about HBV screening recom-mendations (2,7). High-prevalence birth country was the most common reason for HBV testing; 119 (76%) patients were born in countries where HBV prevalence exceeds 2%. CDC recommends HBV screening for persons born in countries with HBV prevalence ≥2% (2). Despite the emphasis on birth coun-try as a screening criterion, 14% of clinicians in this analysis did not know where their patients were born, suggesting that clinicians do not consistently ask patients about birth country.
The small proportion of patients tested because of hepatitis signs and symptoms or elevated liver function test results suggests that most clinicians are considering the screening recommendations and diagnosing HBV before symptoms of chronic infection develop. Consistent with this observation, none of these newly reported patients were hospitalized for HBV during the preceding year, and only 4% were waiting for a liver transplant.
Seventy percent of clinicians did not know their patients’ risk factors for HBV infection. Interviewing patients instead of clinicians might have provided more complete information.
Nearly two thirds of clinicians did not know their patient’s hepatitis A vaccination status, despite recommendations to vaccinate HBV patients against hepatitis A (infection with hepatitis A can be severe in those with chronic HBV infection) (2). This finding suggests that educational efforts directed to clinicians are warranted.
Most clinicians reported appropriately counseling patients about key issues for patients with HBV infection: transmission and contact notification. Five to seven percent of clinicians indicated that they intended to provide counseling during the patient’s next visit, suggesting that the questionnaire might have served to remind clinicians about the importance of such counseling. In a 1997 telephone survey in San Diego, California, only 43% of clinicians reported counseling their HBV-infected patients about transmission, suggesting that many clinicians might be unaware of the need for such coun-seling (8). The analysis described in this report indicated that Asians were more likely than non-Asians to have been counseled. Asians in NYC might more often be cared for by clinicians who are more familiar with HBV.
The findings in this report are subject to at least two limitations. First, information was collected from clinicians only (with the exception of birth country information for 12 patients). Although more accurate clinical information might be supplied by clinicians, patient interviews might have added information about risk factors and receipt of counseling messages (8). Second, despite efforts to interview all relevant clinicians, investigators might not have identified the clinician most familiar with certain aspects of each patient’s care.
These data show the utility of a chronic HBV infection surveillance system. When caseloads are high and staffing is
TABLE 2. Number and percentage of patients with chronic hepatitis B virus (HBV) infection included in enhanced surveillance who received counseling, by race/ethnicity and type of counseling — New York City, June 2008–November 2009
Characteristic
Race/Ethnicity
AsianBlack,
non-Hispanic HispanicWhite,
non-Hispanic Unknown Total
No. (%)* No. (%) No. (%) No. (%) No. (%) No.
Patient counseled about avoiding transmitting HBV to others†
Yes 93 (89) 9 (38) 5 (45) 6 (60) 3 (50) 116No 2 (2) 4 (17) 3 (27) 0 — 0 — 9No; will counsel at next visit 4 (4) 1 (4) 1 (9) 2 (20) 0 — 8Unknown 6 (6) 10 (42) 2 (18) 2 (20) 3 (50) 23
Patient counseled about notifying close contacts about HBV screening and vaccination†
Yes 89 (85) 7 (29) 4 (36) 4 (40) 3 (50) 107No 4 (4) 5 (21) 5 (45) 0 — 0 — 14No; will counsel at next visit 6 (6) 2 (8) 0 — 3 (30) 0 — 11Unknown 6 (6) 10 (42) 2 (18) 3 (30) 3 (50) 24
* Percentages might not sum to 100 because of rounding.† Asian versus non-Asian chi-square analysis, p<0.05 (combined “No” and “No; will counsel at next visit” and omitted “Unknown” answers).

Morbidity and Mortality Weekly Report
MMWR / January 13, 2012 / Vol. 61 / No. 1 9
limited, investigating all reports of HBV infection might not be possible. In such situations, investigating a representative sample provides useful data to describe the affected population and identify unmet needs. By investigating only a sample of patients, DOHMH was able to achieve a high response rate (97%). This project was conducted, in part, with CDC grant funds for hepatitis surveillance. Some health departments conduct limited hepatitis surveillance or none at all because of limited funding.
This enhanced surveillance effort described NYC’s newly reported chronic HBV population, determined whether patients received recommended prevention and treatment services, and identified potential areas for clinician education. Health departments can use these findings to develop educa-tional materials for clinicians on HBV screening guidelines, vaccination recommendations, and counseling. These data also can guide efforts to prevent HBV transmission and prevent disease progression in persons living with chronic HBV infec-tion. Health departments, community-based organizations,
clinicians, and patient educators can consider these find-ings when developing outreach, advocacy, and educational initiatives.
DOHMH developed multiple initiatives as a result of this sur-veillance project. Clinicians who had indicated that their patients were not immune to hepatitis A were mailed a reminder that hepatitis A vaccination is recommended, along with information about locations where vaccination is available free of charge. DOHMH developed a booklet for patients called How to Tell Others You Have Chronic Hepatitis B (9) for distribution through clinicians and community groups. In addition, DOHMH sends patient health education booklets called Hepatitis B: the Facts (10) to all clinicians who participate in enhanced HBV sur-veillance and to newly-reported HBV patients. These booklets (available in five languages) can be ordered in bulk and free of charge within NYC by calling 311 and also are available online at http://www.nyc.gov/html/doh/downloads/pdf/cd/cd-hepB-chronic-telling-others.pdf and http://www.nyc.gov/html/doh/downloads/pdf/cd/cd-hepb-bro.pdf.
References 1. Custer B, Sullivan SD, Hazlet TK, Iloeje U, Veenstra DL, Kowdley KV.
Global epidemiology of hepatitis B virus. J Clin Gastroenterol 2004;38(10 Suppl):S158–68.
2. CDC. Recommendations for identification and public health management of persons with chronic hepatitis B virus infection. MMWR 2008;57(No. RR-8).
3. New York City Department of Health and Mental Hygiene. Hepatitis A, B, and C surveillance reports. New York, NY: New York City Department of Health and Mental Hygiene; 2012. Available at http://home2.nyc.gov/html/doh/html/cd/cd-hepabc-reports.shtml. Accessed January 5, 2012.
4. Ioannou G. Hepatitis B virus in the United States: infection, exposure, and immunity rates in a nationally representative survey. Ann Intern Med 2011;154:319–28.
5. CDC. Characteristics of persons with chronic hepatitis B—San Francisco, California, 2006. MMWR 2007;56:446–8.
6. Kim WR, Benson JT, Therneau TM, Torgerson HA, Yawn BP, Melton LJ 3rd. Changing epidemiology of hepatitis B in a U.S. community. Hepatology 2004;39:811–6.
7. Chao SD, Chang ET, So SK. Eliminating the threat of chronic hepatitis B in the Asian and Pacific Islander community: a call to action. Asian Pac J Cancer Prev 2009;10:1–6.
8. Weinberg MS, Gunn RA, Mast EE, Gresham L, Ginsberg M. Preventing transmission of hepatitis B virus from people with chronic infection. Am J Prev Med 2001;20:272–6.
9. New York City Department of Health and Mental Hygiene. How to tell others you have chronic hepatitis B. New York, NY: New York City Department of Health and Mental Hygiene; 2011. Available at http://www.nyc.gov/html/doh/downloads/pdf/cd/cd-hepB-chronic-telling-others.pdf. Accessed January 5, 2012.
10. New York City Department of Health and Mental Hygiene. Hepatitis B: the facts. New York, NY: New York City Department of Health and Mental Hygiene; 2007. Available at http://www.nyc.gov/html/doh/downloads/pdf/cd/cd-hepb-bro.pdf. Accessed January 5, 2012.
What is already known on this topic?
Chronic hepatitis B virus (HBV) infection, a leading cause of cirrhosis and liver cancer nationwide, is highly prevalent in Asian-American communities; however, information from routine surveillance activities about the population affected by HBV is limited.
What is added by this report?
Approximately two thirds (67%) of a random sample of HBV patients reported via enhanced surveillance in New York City (NYC) during June 2008–November 2009 were Asian. Clinicians commonly tested patients for HBV because those patients were born in countries with high HBV prevalence, whereas very few tested because of symptoms and elevated liver enzymes, suggesting that a majority of patients have HBV infection diagnosed before the disease progresses. Clinicians commonly counseled their patients about preventing transmission of HBV to others and notifying close contacts, but many were unaware of their patients’ hepatitis A vaccination status.
What are the implications for public health practice?
By investigating a sample of newly reported chronic HBV patients, health departments can identify unmet needs among their populations. Such findings can be used to develop educational materials for clinicians on topics such as HBV screening guidelines, vaccination recommendations, and counseling. In response to limited knowledge among NYC clinicians regarding their patients’ hepatitis A vaccination status, NYC public health officials provided clinicians with a reminder that hepatitis A vaccination is recommended, along with information about locations where hepatitis A vaccination is available free of charge.

Morbidity and Mortality Weekly Report
10 MMWR / January 13, 2012 / Vol. 61 / No. 1
In 2007, approximately 27,000 unintentional drug over-dose deaths occurred in the United States, one death every 19 minutes. Prescription drug abuse is the fastest growing drug problem in the United States. The increase in unintentional drug overdose death rates in recent years (Figure 1) has been driven by increased use of a class of prescription drugs called opioid analgesics (1). Since 2003, more overdose deaths have involved opioid analgesics than heroin and cocaine combined (Figure 2) (1). In addition, for every unintentional overdose death related to an opioid analgesic, nine persons are admitted for substance abuse treatment (2), 35 visit emergency depart-ments (3), 161 report drug abuse or dependence, and 461 report nonmedical uses of opioid analgesics (4). Implementing strategies that target those persons at greatest risk will require strong coordination and collaboration at the federal, state, local, and tribal levels, as well as engagement of parents, youth influencers, health-care professionals, and policy-makers.
Overall, rates of opioid analgesic misuse and overdose death are highest among men, persons aged 20–64 years, non-His-panic whites, and poor and rural populations. Persons who have mental illness are overrepresented among both those who are prescribed opioids and those who overdose on them. Further defining populations at greater risk is critical for development and implementation of effective interventions. The two main populations in the United States at risk for prescription drug overdose are the approximately 9 million persons who report long-term medical use of opioids (5), and the roughly 5 mil-lion persons who report nonmedical use (i.e., use without a prescription or medical need), in the past month (4). In an attempt to treat patient pain better, practitioners have greatly increased their rate of opioid prescribing over the past decade. Drug distribution through the pharmaceutical supply chain was the equivalent of 96 mg of morphine per person in 1997 and approximately 700 mg per person in 2007, an increase of >600% (6). That 700 mg of morphine per person is enough for everyone in the United States to take a typical 5 mg dose of Vicodin (hydrocodone and acetaminophen) every 4 hours for 3 weeks. Persons who abuse opioids have learned to exploit this new practitioner sensitivity to patient pain, and clinicians struggle to treat patients without overprescribing these drugs.
Among patients who are prescribed opioids, an estimated 80% are prescribed low doses (<100 mg morphine equivalent dose per day) by a single practitioner (7,8), and these patients account for an estimated 20% of all prescription drug over-doses (Figure 3). Another 10% of patients are prescribed high doses (≥100 mg morphine equivalent dose per day) of opioids by single prescribers and account for an estimated 40% of prescription opioid overdoses (9,10). The remaining 10% of patients are of greatest concern. These are patients who seek care from multiple doctors and are prescribed high daily doses, and account for another 40% of opioid overdoses (11). Persons in this third group not only are at high risk for overdose themselves but are likely diverting or providing drugs to oth-ers who are using them without prescriptions. In fact, 76% of nonmedical users report getting drugs that had been prescribed to someone else, and only 20% report that they acquired the drug from their own doctor (4). Furthermore, among persons who died of opioid overdoses, a significant proportion did not have a prescription in their records for the opioid that killed them; in West Virginia, Utah, and Ohio, 25%–66% of those who died of pharmaceutical overdoses used opioids originally prescribed to someone else (11–13). These data suggest that prevention of opioid overdose deaths should focus on strategies that target 1) high-dosage medical users and 2) persons who seek care from multiple doctors, receive high doses, and likely are involved in drug diversion.
Prevention Strategies Some promising strategies exist for addressing these two
high-risk groups. The first is use of prescription data combined with insurance restrictions to prevent “doctor shopping” and reduce inappropriate use of opioids. Users of multiple provid-ers for the same drug, people routinely obtaining early refills, and persons engaged in other inappropriate behaviors can be tracked with state prescription drug monitoring programs or insurance claim information. Public and private insurers can limit the reimbursement of claims for opioid prescriptions to a designated doctor and a designated pharmacy. This action is especially important for public insurers because Medicaid recipients and other low-income populations are at high risk for prescription drug overdose. Insurers also can identify inap-propriate use of certain opioids for certain diagnoses (e.g., the use of extended-release or long-acting opioids like transdermal fentanyl or methadone for short-term pain).
A second strategy is improving legislation and enforcement of existing laws. Most states now have laws against doctor shopping, but they are not enforced uniformly. In contrast, only a few states
CDC Grand Rounds: Prescription Drug Overdoses — a U.S. Epidemic
This is another in a series of occasional MMWR reports titled CDC Grand Rounds. These reports are based on grand rounds presentations at CDC on high-profile issues in public health sci-ence, practice, and policy. Information about CDC Grand Rounds is available at http://www.cdc.gov/about/grand-rounds.

Morbidity and Mortality Weekly Report
MMWR / January 13, 2012 / Vol. 61 / No. 1 11
have laws regulating for-profit clinics that distribute controlled prescription drugs with minimal medical evaluation. Laws against such “pill mills” as well as laws that require physical examinations before prescribing might help reduce the diversion of these drugs for nonmedical use. In addition, a variety of other state controls on prescription fraud are being employed. For example, according to the National Alliance for Model State Drug Laws, 15 states required or permitted pharmacists to request identification from persons obtaining controlled substances as of March 2009.*
A third strategy is to improve medical practice in prescribing opioids. Care for patients with complex chronic pain problems is challenging, and many prescribers receive little education on this topic. As a result, prescribers too often start patients on opioids and expect unreasonable benefits from the treatment. In a prospective, population-based study of injured workers with compensable low back pain, 38% of the workers received an opioid early in their care, most at the first doctor visit (14). Among the 6% who went on to receive opioids for chronic pain for 1 year, most did not report clinically meaningful improve-ment in pain and function, even though their opioid dose rose significantly over the year.
Evidence-based guidelines can educate prescribers regarding the under-appreciated risks and frequently exaggerated benefits of high-dose opioid therapy. Such guidelines especially are needed for emergency departments because persons at greater risk for overdose frequently visit emergency departments seek-ing drugs. Guidelines will be more effective if health system or payer reviews hold prescribers accountable for their behaviors.
A public health approach to the problem of prescription drug overdose also should include secondary and tertiary prevention measures to improve emergency and long-term treatment. Overdose “harm reduction” programs emphasize broader distri-bution (to nonmedical users) of an opioid antidote, naloxone, that can be used in an emergency by anyone witnessing an overdose. Efforts also are under way to increase the ability of professionals responding to emergencies to administer optimum treatment for overdoses. Substance abuse treatment programs also reduce the risk for overdose death (15). Continued efforts are needed to remove barriers to shifting such programs from methadone clinics to office-based care using buprenorphine. Office-based care can be less stigmatizing and more accessible to all patients, especially those residing in rural areas.
Washington is an example of a state that has moved aggres-sively to improve medical practice in opioid prescribing by developing interagency opioid-dosing guidelines.† The guidelines emphasize a dosing “yellow flag” at 120 mg/day morphine equivalent dose for new patients with chronic pain. The guidelines were introduced in April 2007 as a web-based tool, including 2 hours of free continuing medical education and specific “best practice” guidance, use of a patient-prescriber agreement, and judicious use of random urine drug screen-ing. Eighteen months after introduction of the guidelines, a survey was conducted of primary-care physicians to assess overall concerns and acceptance of dosing guidance and to identify gaps in knowledge that might be addressed by new guideline tools. A majority of prescribers surveyed were not using all the best practices, likely because they did not have
0
2
4
6
8
10
Year
Rate
1970 1975 1980 1985 1990 1995 2000 2005
Source: National Vital Statistics System. Available at http://www.cdc.gov/nchs/nvss.htm. * Per 100,000 population.
FIGURE 1. Rate* of unintentional drug overdose deaths — United States, 1970–2007
Source: National Vital Statistics System. Multiple cause of death dataset. Available at http://www.cdc.gov/nchs/nvss.htm.
FIGURE 2. Number of unintentional drug overdose deaths involving opioid analgesics, cocaine, and heroin — United States, 1999–2007
02,000
4,000
6,000
8,000
10,000
12,000
14,000
1999 2000 2001 2002 2003 2004 2005 2006 2007
Dea
ths
Year
Opioid analgesicCocaineHeroin
† Additional information available at http://www.agencymeddirectors.wa.gov. * Additional information available at http://www.namsdl.org/presdrug.htm.

Morbidity and Mortality Weekly Report
12 MMWR / January 13, 2012 / Vol. 61 / No. 1
brief, usable tools. For example, only 38% were using random urine screens often or always, and 69% never or almost never tracked physical function. As a result, brief, open source tools such as patient questionnaires were added for ease of incor-poration into routine practice. Additionally, Washington has focused on improving practitioner access to pain specialists. Specific methods are under development to offer “pain pro-ficiency” training to primary-care prescribers, who can then become mentors/consultants to their colleagues, particularly in rural areas. In addition, the University of Washington has made twice-weekly pain consultations with a panel of special-ists available. In March 2010, the Washington state legislature passed legislation that repealed permissive prescribing rules for opioids and instituted new rules largely reflective of the dosing guidance and other best practices emphasized in the guidelines.
The National Response At the national level, the White House Office of National
Drug Control Policy establishes policies, priorities, and objec-tives for the nation’s drug control program to reduce illicit drug use, manufacturing, and trafficking; drug-related crime and violence; and drug-related health consequences. In May 2010, President Obama released the National Drug Control Strategy, which outlined the Administration’s science-based public health approach to drug policy. In 2011, the strategy was expanded to place special focus on certain populations, such as service members and their families, college students, women and children, and persons in the criminal justice system.§
When developing a national approach to address prescrip-tion drug overdose, any policy must balance the desire to minimize abuse with the need to ensure legitimate access to these medications, and its implementation must bring together a variety of federal, state, local, and tribal groups. The Administration’s plan for addressing prescription drug abuse, Epidemic: Responding to America’s Prescription Drug Abuse Crisis, which was released in April 2011, includes four components: education, tracking and monitoring, proper medication dis-posal, and enforcement.¶
The majority of health-care providers receive minimal education regarding addiction and might be at risk for pre-scribing an addictive medication without fully appreciating the potential risks. Therefore, the first component of the plan calls for mandatory prescriber education. This would require prescribers to be trained on appropriate prescribing of opioids before obtaining their controlled substance registration from the Drug Enforcement Administration (DEA). Parents and patients also must be educated about the dangers and preva-lence of prescription drug abuse and how to use prescription drugs safely. To achieve this, the plan calls for a public/private partnership to develop an educational campaign directed at parents and patients.
The second component of the plan calls for prescription drug monitoring programs to be operational in all states and mechanisms to be in place for data sharing. As of May 2011, 35 states had operational monitoring programs, and 13 addi-tional states had passed enacting legislation.
The third component, proper medication disposal, is essen-tial because the public lacks a safe, convenient, and environ-mentally responsible way to dispose of medications that are no longer needed. DEA is drafting rules to provide easier access to drug disposal. In support of medication disposal efforts, DEA held National Prescription Drug Take-Back Events in 2010 and 2011. During the first two such events, approximately 309 tons of drugs were collected at over 5,000 sites across the country.**
The fourth component calls on law enforcement agencies to help decrease prescription drug diversion and abuse. The majority of prescribers are responsible, but unscrupulous persons continue to operate outside of legitimate medical practice. These persons must be held accountable, and the plan outlines specific actions the federal government can take to help law enforcement agencies effectively address pill mills and doctor shopping.
¶ Additional information available at http://www.whitehouse.gov/sites/default/files/ondcp/issues-content/prescription-drugs/rx_abuse_plan.pdf.
** Additional information available at http://www.deadiversion.usdoj.gov/drug_disposal/takeback/index.html.
FIGURE 3. Percentage of patients and prescription drug overdoses, by risk group — United States
0
20
40
60
80
100
Patients seeing multiple doctors and typically involved in drug diversionPatients seeing one doctor, high dosePatients seeing one doctor, low dose
Perc
enta
ge
Patients Overdoses
§ Additional information available at http://www.whitehouse.gov/ondcp/2011-national-drug-control-strategy.

Morbidity and Mortality Weekly Report
MMWR / January 13, 2012 / Vol. 61 / No. 1 13
Reported by
Leonard Paulozzi, MD, Grant Baldwin, PhD, Div of Unintentional Injury Prevention, National Center for Injury Prevention and Control, CDC. Gary Franklin, MD, Washington State Agency Medical Directors’ Group, Olympia, Washington. R. Gil Kerlikowske, MA, Christopher M. Jones, Pharm D, Office of National Drug Control Policy, Washington, DC. Neelam Ghiya, MPH, Tanja Popovic, MD, PhD, Office of the Director, CDC. Corresponding contributor: Leonard Paulozzi, [email protected].
References 1. CDC. Policy impact: prescription painkiller overdoses. Atlanta, GA: US
Department of Health and Human Services, CDC; 2011. Available at http://www.cdc.gov/homeandrecreationalsafety/rxbrief/index.html. Accessed January 9, 2012.
2. Substance Abuse and Mental Health Services Administration, Office of Applied Studies. National admissions to substance abuse treatment services. Rockville, MD: Substance Abuse and Mental Health Services Administration; 2009.
3. Substance Abuse and Mental Health Services Administration. The DAWN report: highlights of the 2009 Drug Abuse Warning Network (DAWN) findings on drug-related emergency department visits. Rockville, MD: Substance Abuse and Mental Health Services Administration; 2010. Available at http://www.samhsa.gov/data/2k10/dawnsr034edhighlights/edhighlights.htm. Accessed January 9, 2012.
4. Substance Abuse and Mental Health Services Administration. Results from the 2009 National Survey on Drug Use and Health: volume 1: summary of national findings. Rockville, MD: Substance Abuse and Mental Health Services Administration; 2010.
5. Boudreau D, Von Korff M, Rutter CM, et al. Trends in long-term opioid therapy for chronic non-cancer pain. Pharmacoepidemiol Drug Saf 2009; 18:1166–75.
6. US Department of Justice, Drug Enforcement Administration. Automation of Reports and Consolidated Orders System (ARCOS). Available at http://www.deadiversion.usdoj.gov/arcos/index.html. Accessed January 9, 2012.
7. Edlund MJ, Martin BC, Fan MY, Braden JB, Devries A, Sullivan MD. An analysis of heavy utilizers of opioids for chronic noncancer pain in the TROUP Study. J Pain Symptom Manage 2010;40:279–89.
8. Katz N, Panas L, Kim M, et al., Usefulness of prescription monitoring programs for surveillance—analysis of Schedule II opioid prescription data in Massachusetts, 1996–2006. Pharmacoepidemiol Drug Safety 2010;19:115–23.
9. Dunn KM, Saunders KW, Rutter CM, et al. Opioid prescriptions for chronic pain and overdose. Ann Intern Med 2010;152:85–92.
10. Bohnert AS, Valenstein M, Bair MJ, et al. Association between opioid prescribing patterns and opioid overdose-related deaths. JAMA 2011; 305:1315–21.
11. Hall AJ, Logan JE, Toblin RL, et al. Patterns of abuse among unintentional pharmaceutical overdose fatalities. JAMA 2008;300:2613–20.
12. Ohio Department of Health. Ohio drug poisoning fact sheet: epidemic of prescription drug overdoses in Ohio. Available at http://www.healthyohioprogram.org/diseaseprevention/dpoison/drugdata.aspx. Accessed January 9, 2012.
13. Lanier WA. Prescription opioid overdose deaths—Utah, 2008–2009. Presented at the 59th Annual Epidemic Intelligence Service Conference. Atlanta, GA, April 19–23, 2010.
14. Franklin GM, Rahman EA, Turner JA, Daniell WE, Fulton-Kehoe D. Opioid use for chronic low back pain: a prospective, population-based study among injured workers in Washington State, 2002–2005. Clin J Pain 2009;25:743–51.
15. Yoast R, Williams MA, Deitchman SD, Champion HC. Report of the Council on Scientific Affairs: methadone maintenance and needle-exchange programs to reduce the medical and public health consequences of drug abuse. J Addict Dis 2001;20:15–40.

Morbidity and Mortality Weekly Report
14 MMWR / January 13, 2012 / Vol. 61 / No. 1
Vital Signs: Binge Drinking Prevalence, Frequency, and Intensity Among Adults — United States, 2010
Abstract
Background: Binge drinking accounts for more than half of the estimated 80,000 average annual deaths and three quarters of $223.5 billion in economic costs resulting from excessive alcohol consumption in the United States. Methods: CDC analyzed data collected in 2010 on the prevalence of binge drinking (defined as four or more drinks for women and five or more drinks for men on an occasion during the past 30 days) among U.S. adults aged ≥18 years in 48 states and the District of Columbia; and on the frequency (average number of episodes per month) and intensity (average largest number of drinks consumed on occasion) among binge drinkers. Results: The overall prevalence of binge drinking was 17.1%. Among binge drinkers, the frequency of binge drinking was 4.4 episodes per month, and the intensity was 7.9 drinks on occasion. Binge drinking prevalence (28.2%) and intensity (9.3 drinks) were highest among persons aged 18–24 years. Frequency was highest among binge drinkers aged ≥65 years (5.5 episodes per month). Respondents with household incomes ≥$75,000 had the highest binge drinking prevalence (20.2%), but those with household incomes <$25,000 had the highest frequency (5.0 episodes per month) and intensity (8.5 drinks on occasion). The age-adjusted prevalence of binge drinking in states ranged from 10.9% to 25.6%, and the age-adjusted intensity ranged from 6.0 to 9.0 drinks on occasion.Conclusions: Binge drinking is reported by one in six U.S. adults, and those who binge drink tend to do so frequently and with high intensity.Implications for Public Health Practice: More widespread implementation of Community Guide–recommended interventions (e.g., measures controlling access to alcohol and increasing prices) could reduce the frequency, intensity, and ultimately the prevalence of binge drinking, as well as the health and social costs related to it.
IntroductionExcessive alcohol use* accounted for an estimated average
of 80,000 deaths and 2.3 million years of potential life lost (YPLL)† in the United States each year during 2001–2005, and an estimated $223.5 billion in economic costs in 2006 (1). Binge drinking accounted for more than half of those deaths, two thirds of the YPLL (2), and three quarters of the economic costs (1). Binge drinking also is a risk factor for many health and social problems, including motor-vehicle crashes, violence, suicide, hypertension, acute myocardial infarction,
sexually transmitted diseases, unintended pregnancy, fetal alcohol syndrome, and sudden infant death syndrome (3). In 2010, 85% of all alcohol-impaired driving episodes were reported by persons who also reported binge drinking (4). In the United States, binge drinking accounts for more than half of the alcohol consumed by adults (5) and 90% of the alcohol consumed by youths (6). However, most binge drinkers are not alcohol dependent (7).
Reducing the prevalence of binge drinking among adults is a leading health indicator in Healthy People 2020 (objective SA-14.3) (8). To assess measures of binge drinking nationwide and by state, CDC analyzed developmental data§ from the 2010 Behavioral Risk Factor Surveillance System (BRFSS) on the prevalence of binge drinking among adults, and on the frequency and intensity of drinking among respondents who reported binge drinking.
* Excessive alcohol use includes binge drinking (defined by CDC as consuming four or more drinks per occasion for women or five or more drinks per occasion for men), heavy drinking (defined as consuming more than one drink per day on average for women or more than two drinks per day on average for men), any alcohol consumption by pregnant women, and any alcohol consumption by youths aged <21 years.
† YPLL for 2001–2005 were estimated using the Alcohol-Related Disease Impact (ARDI) application using death and life expectancy data from the National Vital Statistics System. Additional information is available at http://apps.nccd.cdc.gov/dach_ardi/default/default.aspx.
On January 10, 2012, this report was posted as an MMWR Early Release on the MMWR website (http://www.cdc.gov/mmwr).
§ The 2010 BRFSS developmental dataset included combined landline and cellular telephone–only adults and used the raking method for weighting.

Morbidity and Mortality Weekly Report
MMWR / January 13, 2012 / Vol. 61 / No. 1 15
MethodsBRFSS is a state-based, random-digit–dialed telephone survey of
noninstitutionalized, civilian U.S. adults that collects information on many health conditions and risk behaviors, including binge drinking. BRFSS surveys are administered to households with landlines in all states and the District of Columbia (DC).
In September 2011, BRFSS released a developmental dataset for 2010¶ that included combined landline and cellular tele-phone–only adults and used the raking method** for weight-ing, known also as iterative proportional fitting (9). A total of 48 states (all except South Dakota and Tennessee) and DC administered the survey to landline and cellular telephone-only adults, and a median of 7.2% of the total surveys in these states were completed by cellular telephone-only adults (range: 2.0% in New Jersey to 32.0% in Minnesota).
Annually, respondents who report consuming any alcoholic beverages are asked how many times they engaged in binge drinking, defined as consuming four or more alcoholic drinks per occasion for women and five or more drinks per occasion for men during the preceding 30 days.†† In addition, respondents who report alcohol consumption are asked about the largest number of drinks they had on any occasion in the preceding 30 days. The average prevalence of binge drinking was calculated by dividing the total number of respondents who reported at least one binge drinking episode during the preceding 30 days by the total number of BRFSS respondents in the 48 participating states and DC. The average frequency of binge drinking was calculated by dividing the total number of binge drinking episodes by the total number of respondents who reported any binge drinking during the preceding 30 days. The average intensity of binge drinking was calculated by averaging the largest number of drinks reported on an occasion by binge drinkers. Respondents who refused to answer, had a missing answer, or who answered “don’t know/not sure” were excluded from the analysis.
In 2010, the median Council of American Survey and Research Organizations (CASRO) response rate for the landline BRFSS was 54.6% (range: 39.1% to 68.8%), and the median CASRO cooperation rate was 76.9% (range: 56.8%–86.1%).§§ A response rate for the 2010 BRFSS developmental dataset was
not available. A total of 457,677 respondents (422,039 landline respondents and 35,638 cellular telephone respondents) were included in the analysis. Two-tailed t-tests were used to assess statistical significance (p<0.05). Only statistically significant subgroup differences are reported. State estimates were age-adjusted to the 2000 U.S. Census standard population.
ResultsIn 2010, the overall prevalence of binge drinking among
adults in the 48 states and DC was 17.1% (Table 1). Binge drinking prevalence among men (23.2%) was twice that of women (11.4%). Men who reported binge drinking reported a higher frequency and intensity (5.0 episodes per month and 9.0 drinks on occasion) than women (3.2 episodes per month and 5.9 drinks on occasion). Binge drinking also was most common among persons aged 18–24 years (28.2%) and 25–34 years (27.9%), and decreased with increasing age. However, the highest frequency of binge drinking by age was reported by persons aged ≥65 years (5.5 episodes per month). The intensity of binge drinking was highest among persons aged 18–24 years (9.3 drinks on occasion) and 25–34 years (8.4 drinks on occasion) and decreased with age. The preva-lence of binge drinking among non-Hispanic whites (18.0%) was similar to the prevalence among Hispanics (17.9%), but significantly higher than the prevalence for non-Hispanic blacks (12.7%) and non-Hispanics from other racial and eth-nic groups (including American Indians/Alaska Natives and Asians/Native Hawaiians or other Pacific Islanders) (15.3%). The frequency of binge drinking was similar across racial and ethnic groups, but the highest intensity was reported by binge drinkers who were non-Hispanics from other racial and ethnic groups (8.7 drinks) and by Hispanics (8.4 drinks on occasion). Respondents who did not graduate from high school had the lowest prevalence of binge drinking (13.7%), but those who binge drank had the highest frequency (5.5 episodes per month) and intensity (9.3 drinks on occasion) compared with respondents with higher educational levels. Binge drinking prevalence increased with household income, and was high-est among those with annual household incomes ≥$75,000 (20.2%). However, the highest frequency and intensity of binge drinking by household income was reported by those with incomes <$25,000 (5.0 episodes per month and 8.5 drinks on occasion, respectively).
The age-adjusted prevalence of binge drinking by state ranged from 10.9% (Utah) to 25.6% (Wisconsin) (Table 2). The age-adjusted frequency of binge drinking ranged from 3.6 episodes per month (New Jersey) to 5.9 episodes per month (Kentucky). The age-adjusted intensity of binge drinking ranged from 6.0 drinks on occasion (DC) to 9.0 drinks on occasion (Wisconsin). Overall, states with the highest age-adjusted prevalence of adult binge
¶ In 2012, BRFSS will release its 2011 BRFSS dataset including larger number of cellular telephone respondents and will be changing its procedures for data weighting.
** With the raking process, BRFSS data are weighted to the age, sex, race, educational, and marital status of each state’s adult population and to the respondent’s probability of selection. Raking also includes adjustment for cellular telephone only, landline only, and both cellular telephone and landline use based on respondents’ telephone ownership.
†† The BRFSS 2010 questionnaire, which includes five questions about alcohol consumption, is available at http://www.cdc.gov/brfss/questionnaires/pdf-ques/2010brfss.pdf.
§§ The response rate is the percentage of persons who completed interviews among all eligible persons, including those who were not contacted successfully. The cooperation rate is the percentage of persons who completed interviews among all eligible persons who were contacted.

Morbidity and Mortality Weekly Report
16 MMWR / January 13, 2012 / Vol. 61 / No. 1
drinking were in the Midwest and New England, and included DC, Alaska, and Hawaii (Figure 1). States with the highest inten-sity of adult binge drinking were generally located in the southern Mountain states and Midwest, and included some states (e.g., Louisiana, Mississippi, New Mexico, South Carolina, and Utah) that had a lower prevalence of binge drinking (Figure 2).
Conclusions and CommentThe results in this report indicate that in 2010, binge drinking
was common among U.S. adults, and persons who binge drank tended to do so frequently (average of four times per month) and with high intensity (average of eight drinks on occasion), placing themselves and others at a significantly greater risk for alcohol-attributable harms (2,3). Binge drinking prevalence and intensity were highest among persons aged 18–24 years and 25–34 years, but frequency was highest among binge drinkers aged ≥65 years. Those with household incomes ≥$75,000 had the highest binge drinking prevalence, but binge drinkers with household incomes <$25,000 reported the highest frequency and intensity of binge drinking. In a number of states with a lower prevalence of binge drinking, those who binge drank did so with high intensity.
The higher prevalence of binge drinking in 2010 (17.1%), compared with 2009 (15.2%) (10), likely resulted from inclusion of cellular telephone respondents in the 2010 developmental BRFSS dataset. Cellular telephone–only users typically are young (aged 18–34 years) and male (11); both groups tend to report a higher prevalence of binge drinking. Even after adjusting for age, cellular telephone respondents have a higher prevalence of binge drinking than landline respondents (10,12). These find-ings confirm the importance of increasing the number of cellular telephone respondents in the BRFSS to assess binge drinking and related harms more accurately.
The higher prevalence of binge drinking among males, whites, young adults, and persons with higher household incomes has been reported previously (10), and probably reflects differences in state and local laws that affect the price, availability, and marketing of alcoholic beverages (13), as well as other cultural and religious factors (14). Estimates of the frequency and intensity of binge drinking also reveal important disparities in this behavior, including a significantly higher frequency among older adults and a higher intensity among persons with lower household incomes. These differences are
TABLE 1. Binge drinking prevalence, frequency, and intensity among adults, by sociodemographic characteristics — Behavioral Risk Factor Surveillance System combined landline and cellular telephone developmental dataset, United States,* 2010
Characteristic
Prevalence Frequency† Intensity§
No. Weighted % (95% CI¶) No.No. of
episodes (95% CI) No.No. of drinks (95% CI)
Total 457,677 17.1 (16.8–17.4) 52,329 4.4 (4.3– 4.5) 48,683 7.9 (7.8– 8.1)Sex
Male 176,911 23.2 (22.6–23.7) 30,511 5.0 (4.8– 5.1) 28,192 9.0 (8.8– 9.2)Female 280,766 11.4 (11.1–11.8) 21,818 3.2 (3.1– 3.4) 20,491 5.9 (5.8– 6.0)
Age group (yrs)18–24 18,087 28.2 (26.9–29.5) 4,688 4.2 (4.0– 4.5) 4,358 9.3 (8.9– 9.7)25–34 42,767 27.9 (26.9–29.0) 9,900 4.2 (3.9– 4.4) 9,290 8.4 (8.1– 8.6)35–44 61,216 19.2 (18.4–19.9) 10,902 4.1 (3.9– 4.4) 10,259 7.6 (7.3– 8.0)45–64 187,127 13.3 (12.9–13.6) 21,720 4.7 (4.5– 4.9) 20,219 6.8 (6.7– 7.0)
≥65 144,645 3.8 (3.5– 4.0) 4,925 5.5 (4.8– 6.2) 4,403 5.7 (5.5– 6.0)Race/Ethnicity
White, non-Hispanic 359,123 18.0 (17.7–18.4) 42,258 4.4 (4.3– 4.5) 39,514 7.9 (7.7– 8.0)Black, non-Hispanic 36,275 12.7 (11.7–13.6) 2,920 4.7 (4.1– 5.3) 2,595 6.8 (6.3– 7.4)Hispanic 31,061 17.9 (16.6–19.1) 3,826 3.8 (3.4– 4.2) 3,525 8.4 (7.8– 9.0)Other, non-Hispanic 25,137 15.3 (13.8–16.8) 2,881 4.7 (4.2– 5.3) 2,671 8.7 (8.0– 9.4)
Education levelLess than high school diploma 42,359 13.7 (12.8–14.6) 3,574 5.5 (5.0– 6.0) 3,177 9.3 (8.7– 9.9)High school diploma 135,634 17.6 (17.0–18.1) 15,111 4.7 (4.5– 4.9) 13,864 8.2 (8.0– 8.4)Some college 123,093 19.0 (18.4–19.6) 14,795 4.1 (4.0– 4.3) 13,767 7.6 (7.5– 7.8)College graduate 155,652 18.2 (17.7–18.7) 18,805 3.4 (3.3– 3.5) 17,843 6.9 (6.7– 7.0)
Income<$25,000 119,988 16.2 (15.5–16.9) 10,795 5.0 (4.7– 5.3) 9,880 8.5 (8.2– 8.9)
$25,000–$49,999 108,542 17.9 (17.2–18.5) 12,316 4.2 (4.0– 4.4) 11,446 7.9 (7.6– 8.1)$50,000–$74,999 62,539 18.9 (18.1–19.7) 8,484 4.4 (4.1– 4.7) 8,058 7.9 (7.6– 8.2)
≥$75,000 105,280 20.2 (19.7–20.8) 16,665 3.7 (3.6– 3.9) 15,849 7.2 (7.0– 7.3)
* Respondents were from 48 states (excluding South Dakota and Tennessee) and the District of Columbia.† Binge drinkers only; average number of binge-drinking episodes per month.§ Average largest number of drinks consumed by binge drinkers on any occasion in the past month. ¶ CI = confidence interval.

Morbidity and Mortality Weekly Report
MMWR / January 13, 2012 / Vol. 61 / No. 1 17
reflected in state measures of the prevalence and intensity of binge drinking, and emphasize that states with a lower preva-lence of binge drinking might still include subgroups that binge drink frequently and with high intensity. Binge drinking places
those exposed and others at substantially increased risk for alcohol-attributable harms, and contributes disproportionately to productivity losses, health-care expenses, and excess burden on the criminal justice system (1).
TABLE 2. Age-adjusted* binge drinking prevalence, frequency, and intensity among adults, by state — Behavioral Risk Factor Surveillance System combined landline and cellular telephone developmental dataset, United States,† 2010
State/Area
Prevalence Frequency§ Intensity¶
No.Weighted
% (95% CI**) No.No. of
episodes (95% CI) No.No. of drinks (95% CI)
Alabama 7,848 13.3 (11.7–15.0) 537 4.9 (3.7– 6.1) 480 6.9 (6.4– 7.5)Alaska 2,009 21.2 (18.1–24.4) 335 4.0 (3.2– 4.8) 304 6.8 (6.1– 7.5)Arizona 6,240 18.6 (16.0–21.1) 681 4.2 (3.6– 4.8) 640 7.8 (7.0– 8.5)Arkansas 4,201 11.8 (9.7–13.9) 297 5.2 (4.0– 6.3) 267 7.7 (6.8– 8.5)California 17,233 16.5 (15.1–17.8) 2,044 4.2 (3.5– 4.8) 1,997 7.0 (6.5– 7.5)Colorado 11,417 17.9 (16.2–19.6) 1,311 4.5 (3.7– 5.2) 1,229 7.0 (6.5– 7.4)Connecticut 7,608 18.1 (16.5–19.7) 962 3.9 (3.3– 4.6) 899 7.1 (6.6– 7.5)Delaware 4,555 19.5 (17.5–21.5) 606 4.4 (3.8– 5.1) 569 7.4 (6.8– 8.0)District of Columbia 3,997 21.9 (18.7–25.1) 548 4.1 (3.0– 5.3) 517 6.0 (5.6– 6.5)Florida 37,610 16.7 (15.7–17.6) 4,002 4.6 (4.2– 4.9) 3,717 7.3 (7.0– 7.6)Georgia 5,840 15.4 (13.4–17.4) 510 4.7 (3.8– 5.5) 465 7.3 (6.8– 7.9)Hawaii 7,280 19.1 (17.4–20.9) 1,066 5.3 (4.6– 6.0) 1,033 8.7 (7.8– 9.6)Idaho 7,239 15.2 (13.2–17.2) 701 5.2 (4.3– 6.2) 645 7.6 (7.0– 8.2)Illinois 5,558 21.4 (19.4–23.4) 856 4.5 (3.9– 5.1) 843 6.9 (6.6– 7.3)Indiana 10,452 16.5 (14.9–18.1) 1,081 4.6 (4.0– 5.2) 994 8.1 (7.3– 8.9)Iowa 6,562 21.5 (19.7–23.3) 900 5.3 (4.1– 6.6) 826 8.0 (7.6– 8.4)Kansas 9,357 17.6 (16.2–19.0) 1,027 4.6 (3.8– 5.4) 934 7.0 (6.7– 7.4)Kentucky 8,387 15.0 (13.4–16.7) 684 5.9 (4.8– 7.0) 638 8.4 (7.7– 9.0)Louisiana 7,173 16.4 (14.6–18.2) 782 4.6 (4.0– 5.3) 719 8.5 (7.2– 9.8)Maine 8,346 19.7 (18.1–21.3) 983 5.4 (4.6– 6.1) 935 7.9 (7.4– 8.4)Maryland 9,152 17.1 (15.3–18.9) 1,020 4.7 (3.6– 5.9) 945 6.8 (6.4– 7.2)Massachusetts 15,690 21.7 (20.1–23.2) 2,153 5.0 (4.2– 5.7) 1,965 7.6 (7.0– 8.1)Michigan 9,361 17.7 (16.3–19.2) 1,128 4.4 (3.8– 5.0) 1,082 7.0 (6.7– 7.4)Minnesota 12,649 20.1 (18.8–21.3) 2,135 3.7 (3.3– 4.1) 1,973 7.4 (7.1– 7.7)Mississippi 8,850 12.1 (10.8–13.5) 583 4.9 (4.0– 5.9) 521 8.1 (7.5– 8.7)Missouri 5,837 17.4 (15.5–19.3) 693 5.2 (4.4– 6.0) 650 8.1 (7.5– 8.7)Montana 8,007 21.5 (19.9–23.1) 1,194 3.9 (3.4– 4.4) 1,127 7.7 (7.3– 8.1)Nebraska 17,389 22.3 (20.8–23.9) 2,394 4.2 (3.8– 4.6) 2,264 7.8 (7.4– 8.1)Nevada 4,274 17.4 (15.0–19.8) 619 4.6 (3.6– 5.6) 564 7.8 (7.1– 8.6)New Hampshire 6,195 18.2 (16.4–20.0) 701 5.7 (4.8– 6.5) 675 7.4 (6.7– 8.1)New Jersey 11,855 15.7 (14.1–17.2) 1,414 3.6 (3.2– 4.1) 1,244 6.8 (6.5– 7.2)New Mexico 7,352 14.2 (12.7–15.8) 627 4.6 (3.8– 5.4) 587 7.9 (7.0– 8.7)New York 8,948 18.3 (16.8–19.7) 1,088 4.1 (3.5– 4.6) 1,016 7.0 (6.6– 7.3)North Carolina 12,218 14.7 (12.8–16.5) 1,026 4.4 (3.7– 5.1) 943 7.4 (6.7– 8.0)North Dakota 4,872 21.9 (19.3–24.4) 713 4.2 (3.5– 4.9) 670 8.3 (7.6– 9.1)Ohio 10,705 19.8 (18.4–21.2) 1,359 5.4 (4.3– 6.6) 1,244 7.8 (7.4– 8.2)Oklahoma 8,256 14.9 (13.3–16.5) 738 5.6 (4.4– 6.9) 676 7.8 (7.2– 8.4)Oregon 5,343 17.9 (16.0–19.8) 606 4.5 (3.8– 5.3) 579 6.8 (6.3– 7.4)Pennsylvania 11,768 19.3 (18.0–20.6) 1,467 4.4 (4.0– 4.9) 1,346 7.4 (7.1– 7.8)Rhode Island 7,160 18.2 (16.8–19.7) 923 4.9 (4.3– 5.6) 878 7.2 (6.6– 7.7)South Carolina 9,818 15.7 (14.1–17.3) 880 5.1 (4.3– 6.0) 804 7.9 (7.3– 8.4)Texas 18,257 17.3 (15.6–19.0) 1,859 4.9 (4.3– 5.5) 1,706 7.7 (7.2– 8.3)Utah 11,986 10.9 (9.8–12.0) 1,030 4.9 (4.2– 5.5) 934 7.9 (7.4– 8.4)Vermont 7,046 20.2 (18.5–21.8) 908 4.7 (4.0– 5.4) 854 7.1 (6.7– 7.4)Virginia 5,855 17.7 (16.0–19.4) 702 5.1 (4.1– 6.0) 633 7.2 (6.6– 7.8)Washington 19,974 18.2 (17.1–19.3) 2,352 4.1 (3.7– 4.6) 2,202 6.9 (6.7– 7.2)West Virginia 4,883 10.9 (9.4–12.5) 327 4.9 (4.0– 5.8) 313 8.7 (7.8– 9.5)Wisconsin 4,965 25.6 (22.8–28.4) 882 4.8 (3.8– 5.7) 849 9.0 (7.6–10.5)Wyoming 6,265 16.9 (15.3–18.5) 701 4.4 (3.7– 5.0) 634 7.7 (6.8– 8.5)
* Age-adjusted to the 2000 U.S. Census standard population. † Respondents were from 48 states (excluding South Dakota and Tennessee) and the District of Columbia. § Binge drinkers only; average number of binge-drinking episodes per month. ¶ Average largest number of drinks consumed by binge drinkers on any occasion in the past month. ** CI = confidence interval.

Morbidity and Mortality Weekly Report
18 MMWR / January 13, 2012 / Vol. 61 / No. 1
The findings in this report are subject to at least three limitations. First, BRFSS data are self-reported. Alcohol consumption generally, and excessive drinking in particular, are underreported in surveys because of recall bias and social desirability bias (15). A recent study using BRFSS data found that self-reports identify only 22%–32% of presumed alcohol consumption in states, based on alcohol sales (16). Second, the dataset used for this analysis is developmental. The data collection and weighting methods used for the dataset are subject to change. In the developmental dataset, cellular telephone surveys accounted for less than 10% of the final BRFSS sample, these surveys were not conducted at all in two states (South Dakota and Tennessee), and the response rate for the developmental dataset was not available. However, the inclusion of cellular telephone respondents in this study substantially increased BRFSS participa-tion among younger age groups (e.g., persons aged 18–24 years) who are known to be at higher risk for binge drinking (10,12). Finally, BRFSS does not collect information from persons living in institutional settings (e.g., on college campuses or in the military), so BRFSS data might not be representative of these populations.
The Community Preventive Services Task Force has recom-mended several population-level, evidence-based strategies to reduce binge drinking and related harms (17). These include 1) limiting alcohol outlet density, 2) holding alcohol retail-ers liable for harms related to the sale of alcoholic beverages to minors and intoxicated patrons (dram shop liability), 3) maintaining existing limits on the days and hours when alcohol is sold, 4) measures increasing the price of alcohol, and 5) avoiding further privatization of alcohol sales in states with government-operated or contracted liquor stores. Alcohol
consumption is particularly sensitive to the price of alcoholic beverages. Across alcohol beverage types (i.e., beer, wine, and liquor), the median price elasticity (a measure of the relation-ship between price and consumption) ranges from -0.50 for beer to -0.79 for spirits, and the overall price elasticity for ethanol is -0.77 (18). Thus, a 10% increase in the price of alcoholic beverages likely would reduce overall consumption by more than 7%. Recent analyses also note a substantial gap between the societal and governmental cost of excessive alcohol consumption (approximately $1.90 and $0.80 per drink, respectively) (1) and the total federal and state taxes on alcoholic beverages (approximately $0.12 per drink) (1). The societal or the governmental costs of excessive drinking include lost productivity, health-care costs, and criminal justice expenses. The findings of this report also support the need to monitor and reduce the prevalence, frequency, and intensity of binge drinking (19), and to evaluate the impact of evidence-based strategies to prevent it.
Reported by
Dafna Kanny, PhD, Yong Liu, MS, Robert D. Brewer, MD, Div of Adult and Community Health, National Center for Chronic Disease Prevention and Health Promotion; William S. Garvin, Lina Balluz, ScD, Div of Behavioral Surveillance, Office of Surveillance, Epidemiology, and Laboratory Svcs, CDC. Corresponding contributor: Dafna Kanny, [email protected], 770-488-5411.
FIGURE 1. Prevalence* of binge drinking among adults — Behavioral Risk Factor Surveillance System combined landline and cellular telephone developmental dataset, United States, 2010
* Age-adjusted to the 2000 U.S. Census standard population.
DC
18.7–25.616.8–18.610.9–16.7 Data unavailable
Prevalence (%)
FIGURE 2. Intensity* of binge drinking among adults† — Behavioral Risk Factor Surveillance System combined landline and cellular telephone developmental dataset, United States, 2010
DC
7.8–9.07.2–7.76.0–7.1 Data unavailable
Most drinks consumed on any occasion
* Average largest number of drinks consumed by binge drinkers on any occasion in the past month.
† Age-adjusted to the 2000 U.S. Census standard population.

Morbidity and Mortality Weekly Report
MMWR / January 13, 2012 / Vol. 61 / No. 1 19
Acknowledgment
James B. Holt, PhD, Div of Adult and Community Health, National Center for Chronic Disease Prevention and Health Promotion, CDC.
References 1. Bouchery EE, Harwood HJ, Sacks JJ, Simon CJ, Brewer RD. Economic
costs of excessive alcohol consumption in the United States, 2006. Am J Prev Med 2011;41:516–24.
2. CDC. Alcohol-attributable deaths and years of potential life lost, United States, 2001. MMWR 2004;53:866–70.
3. National Institute of Alcohol Abuse and Alcoholism. Tenth special report to the U.S. Congress on alcohol and health. Bethesda, MD: National Institute of Health; 2000.
4. CDC. Alcohol-impaired driving among adults—United States, 2010. MMWR 2011;60:1351–6.
5. Naimi TS, Brewer RD, Mokdad A, Denny C, Serdula MK, Marks JS. Binge drinking among US adults. JAMA 2003;289:70–5.
6. Office of Juvenile Justice and Delinquency Prevention. Drinking in America: myths, realities, and prevention policy. Washington, DC: US Department of Justice, Office of Justice Programs, Office of Juvenile Justice and Delinquency Prevention; 2005. Available at http://www.udetc.org/documents/drinking_in_america.pdf. Accessed November 17, 2011.
7. Woerle S, Roeber J, Landen MG. Prevalence of alcohol dependence among excessive drinkers in New Mexico. Alcohol Clin Exp Res 2007; 31:293–98.
8. US Department of Health and Human Services. SA–14.3 Reduce the proportion of persons engaging in binge drinking during the past 30 days—adults aged 18 years and older. Healthy People 2020. Washington, DC: US Department of Health and Human Services; 2011. Available at http://healthypeople.gov/2020/lhi/substanceabuse.aspx. Accessed November 17, 2011.
9. Battaglia MP, Frankel MR, Link MW. Improving standard poststratification techniques for random-digit-dialing telephone surveys. Survey Res Methods 2008;2:11–9.
10. CDC. Vital signs: binge drinking among high school students and adults—United States, 2009. MMWR 2010;59:1274–9.
11. Blumberg SJ, Luke JV. Wireless substitution: early release of estimates from the National Health Interview Survey, July–December 2010. Hyattsville, MD: US Department of Health and Human Services, CDC, National Center for Health Statistics; 2011. Available at http://www.cdc.gov/nchs/data/nhis/earlyrelease/wireless201106.pdf. Accessed November 17, 2011.
12. Hu SS, Balluz L, Battaglia MP, Frankel MR. Improving public health surveillance using a dual-frame survey of landline and cellular telephone numbers. Am J Epidemiol. 2011;173:703–11.
13. National Institute on Alcohol Abuse and Alcoholism. Alcohol Policy Information System. Rockville, MD: US Department of Health and Human Services, National Institutes of Health; 2011. Available at http://www.alcoholpolicy.niaaa.nih.gov. Accessed November 17, 2011.
14. Holt JB, Miller JW, Naimi TS, Sui DZ. Religious affiliation and alcohol consumption in the United States. Geographical Review 2006;96:523–42.
15. Stockwell T, Donath S, Cooper-Stanbury M, Chikritzhs T, Catalano P, Mateo C. Under-reporting of alcohol consumption in household surveys: a comparison of quantity-frequency, graduated-frequency and recent recall. Addiction 2004;99:1024–33.
16. Nelson DE, Naimi TS, Brewer RD, Roeber J. U.S. state alcohol sales compared to survey data, 1993–2006. Addiction 2010;105:1589–96.
17. Task Force on Community Prevention Services. Preventing excessive alcohol consumption. In: The guide to community preventive services. New York, NY: Oxford University Press; 2005. Available at http://www.thecommunityguide.org/alcohol/index.html. Accessed November 22, 2011.
18. Elder RW, Lawrence B, Ferguson A, et al.; Task Force on Community Preventive Services. The effectiveness of tax policy interventions for reducing excessive alcohol consumption and related harms. Am J Prev Med 2010;38:217–29.
19. Naimi TS, Nelson DE, Brewer RD. The intensity of binge alcohol consumption among U.S. adults. Am J Prev Med 2010;38:201–7.
Key Points
• Bingedrinkingcausesmorethanhalfof the80,000deaths and three quarters of the $223.5 billion in economic costs caused by excessive drinking.
• Approximatelyoneinsix(38million)U.S.adultsbingedrink, and do so approximately four times a month. On average, the largest number of drinks consumed by binge drinkers is eight drinks per occasion.
• Prevalenceandintensityofbingedrinkingwashighestamong persons aged 18–34 years, but the frequency of binge drinking was highest among binge drinkers aged ≥65 years. Binge drinkers with annual household incomes ≥$75,000 had the highest binge drinking prevalence, but binge drinkers with household incomes <$25,000 had the highest frequency and intensity of binge drinking.
• TheTaskForceonCommunityPreventiveServiceshasrecommended interventions that could reduce binge drinking in states and the health and social costs related to it. These recommended measures include the following:o Limit the number of retail alcohol outlets that sell
alcoholic beverages in a given area.o Hold alcohol retailers liable for harms related to the
sale of alcoholic beverages to minors and intoxicated patrons (dram shop liability).
o Maintain existing limits on the days and hours when alcohol is sold.
o Increase the price of alcohol.o Avoid further privatization of alcohol sales in states
with government operated or contracted liquor stores.• Additionalinformationisavailableathttp://www.cdc.
gov/vitalsigns.

Morbidity and Mortality Weekly Report
20 MMWR / January 13, 2012 / Vol. 61 / No. 1
Notice to Readers
Discontinuation of Inclusion of Notifiable Diseases and Mortality Tables in Print Copies of the MMWR Weekly Publication
Effective with this issue, the weekly Notifiable Diseases and Mortality Tables (i.e., Figure I and Tables I, II, and III) no longer will be included in print copies of the MMWR weekly publication. The tables will continue to be included in the online version of the weekly publication.
All MMWR publications remain available at no charge online at http://www.cdc.gov/mmwr. Readers who wish to have MMWR publications e-mailed to them automatically at no charge can subscribe online at http://www.cdc.gov/mmwr/mmwrsubscribe.html. Print copies of MMWR’s weekly and serial publications (i.e., Recommendations and Reports, Surveillance Summaries, Supplements, and Summaries of Notifiable Diseases) are available for a subscription fee from Massachusetts Medical Society, and the MMWR weekly publication also is available for a subscription fee from the U.S. Government Printing Office at http://www.cdc.gov/mmwr/order.html.
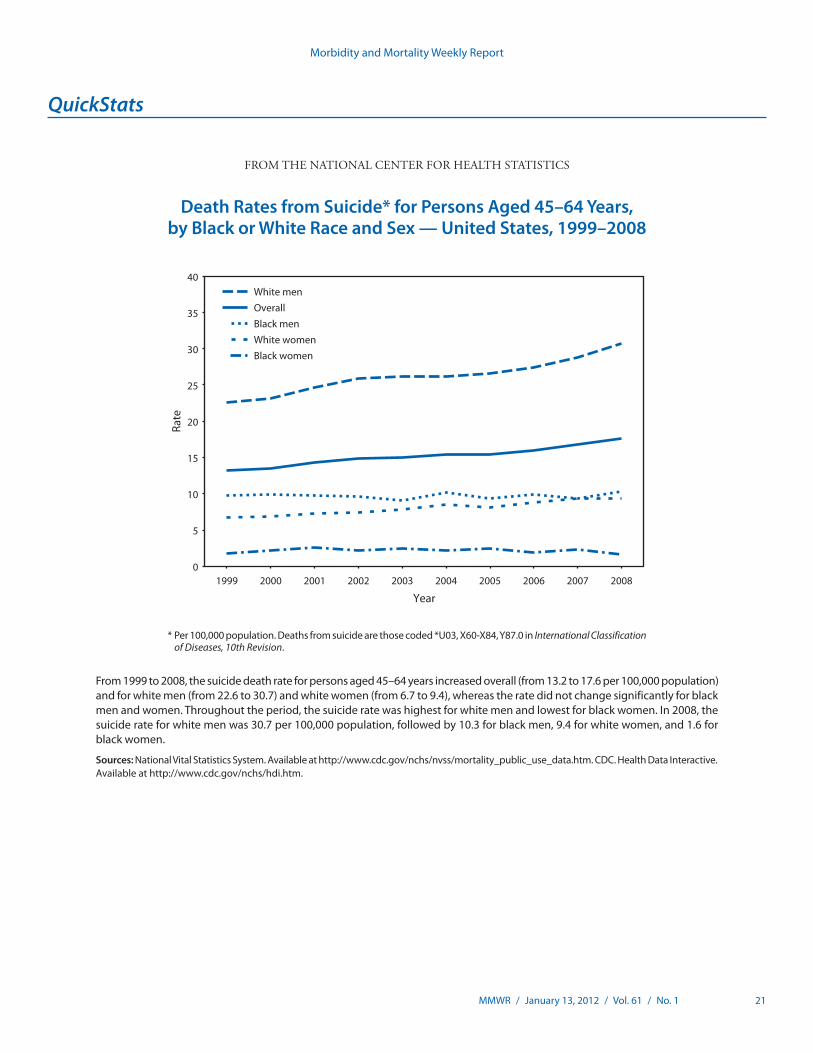
Morbidity and Mortality Weekly Report
MMWR / January 13, 2012 / Vol. 61 / No. 1 21
* Per 100,000 population. Deaths from suicide are those coded *U03, X60-X84, Y87.0 in International Classification of Diseases, 10th Revision.
From 1999 to 2008, the suicide death rate for persons aged 45–64 years increased overall (from 13.2 to 17.6 per 100,000 population) and for white men (from 22.6 to 30.7) and white women (from 6.7 to 9.4), whereas the rate did not change significantly for black men and women. Throughout the period, the suicide rate was highest for white men and lowest for black women. In 2008, the suicide rate for white men was 30.7 per 100,000 population, followed by 10.3 for black men, 9.4 for white women, and 1.6 for black women.
Sources: National Vital Statistics System. Available at http://www.cdc.gov/nchs/nvss/mortality_public_use_data.htm. CDC. Health Data Interactive. Available at http://www.cdc.gov/nchs/hdi.htm.
0
5
10
15
20
25
30
35
40
1999 2000 2001 2002 2003 2004 2005 2006 2007 2008
Rate
Year
White menOverallBlack menWhite womenBlack women
QuickStats
FROM THE NATIONAL CENTER FOR HEALTH STATISTICS
Death Rates from Suicide* for Persons Aged 45–64 Years, by Black or White Race and Sex — United States, 1999–2008

Morbidity and Mortality Weekly Report
MMWR / January 13, 2012 / Vol. 61 / No. 1 ND-1
TABLE I. Provisional cases of infrequently reported notifiable diseases (<1,000 cases reported during the preceding year) — United States, week ending January 7, 2012 (1st week)*
DiseaseCurrent
weekCum 2012
5-year weekly
average†
Total cases reported for previous yearsStates reporting cases
during current week (No.)2011 2010 2009 2008 2007
Anthrax — — — 1 — 1 — 1Arboviral diseases§, ¶:
California serogroup virus disease — — — 125 75 55 62 55Eastern equine encephalitis virus disease — — — 4 10 4 4 4Powassan virus disease — — 0 16 8 6 2 7St. Louis encephalitis virus disease — — — 5 10 12 13 9Western equine encephalitis virus disease — — — — — — — —
Babesiosis — — 1 632 NN NN NN NNBotulism, total — — 3 114 112 118 145 144
foodborne — — 0 10 7 10 17 32infant — — 2 74 80 83 109 85other (wound and unspecified) — — 1 30 25 25 19 27
Brucellosis — — 2 75 115 115 80 131Chancroid — — 0 29 24 28 25 23Cholera — — 0 30 13 10 5 7Cyclosporiasis§ — — 3 145 179 141 139 93Diphtheria — — — — — — — —Haemophilus influenzae,** invasive disease (age <5 yrs):
serotype b — — 1 8 23 35 30 22nonserotype b — — 5 108 200 236 244 199unknown serotype 2 2 6 240 223 178 163 180 NYC (1), OH (1)
Hansen disease§ 1 1 2 50 98 103 80 101 NYC (1)Hantavirus pulmonary syndrome§ — — 0 20 20 20 18 32Hemolytic uremic syndrome, postdiarrheal§ — — 5 210 266 242 330 292Influenza-associated pediatric mortality§,†† — — 2 118 61 358 90 77Listeriosis 1 1 16 767 821 851 759 808 NE (1)Measles§§ — — 1 213 63 71 140 43Meningococcal disease, invasive¶¶:
A, C, Y, and W-135 — — 6 180 280 301 330 325serogroup B — — 3 107 135 174 188 167other serogroup — — 0 14 12 23 38 35unknown serogroup 3 3 12 380 406 482 616 550 OH (1), MD (2)
Novel influenza A virus infections*** — — 0 8 4 43,774 2 4Plague — — 0 3 2 8 3 7Poliomyelitis, paralytic — — 0 — — 1 — —Polio virus Infection, nonparalytic§ — — — — — — — —Psittacosis§ — — 0 2 4 9 8 12Q fever, total§ — — 3 115 131 113 120 171
acute — — 2 86 106 93 106 —chronic — — 0 29 25 20 14 —
Rabies, human — — 0 2 2 4 2 1Rubella††† — — 0 4 5 3 16 12Rubella, congenital syndrome — — — — — 2 — —SARS-CoV§ — — — — — — — —Smallpox§ — — — — — — — —Streptococcal toxic-shock syndrome§ — — 4 117 142 161 157 132Syphilis, congenital (age <1 yr)§§§ — — 7 243 377 423 431 430Tetanus — — 0 9 26 18 19 28Toxic-shock syndrome (staphylococcal)§ — — 2 73 82 74 71 92Trichinellosis — — 0 10 7 13 39 5Tularemia — — 1 137 124 93 123 137Typhoid fever 1 1 9 320 467 397 449 434 OH (1)Vancomycin-intermediate Staphylococcus aureus§ — — 1 66 91 78 63 37Vancomycin-resistant Staphylococcus aureus§ — — 0 — 2 1 — 2Vibriosis (noncholera Vibrio species infections)§ 1 1 10 729 846 789 588 549 FL (1)Viral hemorrhagic fever¶¶¶ — — 0 — 1 NN NN NNYellow fever — — — — — — — —
See Table 1 footnotes on next page.
Notifiable Diseases and Mortality Tables

Morbidity and Mortality Weekly Report
ND-2 MMWR / January 13, 2012 / Vol. 61 / No. 1
Notifiable Disease Data Team and 122 Cities Mortality Data Team
Jennifer Ward Deborah A. AdamsWillie J. Anderson Lenee BlantonRosaline Dhara Diana Harris OnwehPearl C. Sharp Michael S. Wodajo
* No measles cases were reported for the current 4-week period yielding a ratio for week 1 of zero (0).† Ratio of current 4-week total to mean of 15 4-week totals (from previous, comparable, and subsequent 4-week
periods for the past 5 years). The point where the hatched area begins is based on the mean and two standard deviations of these 4-week totals.
FIGURE I. Selected notifiable disease reports, United States, comparison of provisional 4-week totals January 7, 2012, with historical data
420.06250.03125 1
Beyond historical limits
DISEASE
Ratio (Log scale)*
DECREASE INCREASECASES CURRENT
4 WEEKS
Hepatitis A, acute
Hepatitis B, acute
Hepatitis C, acute
Legionellosis
Measles
Mumps
Pertussis
Giardiasis
Meningococcal disease
500
36
80
45
115
0
20
8
652
0.25 0.50.125
TABLE I. (Continued) Provisional cases of infrequently reported notifiable diseases (<1,000 cases reported during the preceding year) — United States, week ending January 7, 2012 (1st week)*
—: No reported cases. N: Not reportable. NN: Not Nationally Notifiable. Cum: Cumulative year-to-date counts. * Case counts for reporting year 2011 and 2012 are provisional and subject to change. For further information on interpretation of these data, see http://www.cdc.gov/osels/ph_surveillance/
nndss/phs/files/ProvisionalNationa%20NotifiableDiseasesSurveillanceData20100927.pdf. † Calculated by summing the incidence counts for the current week, the 2 weeks preceding the current week, and the 2 weeks following the current week, for a total of 5 preceding years.
Additional information is available at http://www.cdc.gov/osels/ph_surveillance/nndss/phs/files/5yearweeklyaverage.pdf. § Not reportable in all states. Data from states where the condition is not reportable are excluded from this table except starting in 2007 for the arboviral diseases, STD data, TB data, and
influenza-associated pediatric mortality, and in 2003 for SARS-CoV. Reporting exceptions are available at http://www.cdc.gov/osels/ph_surveillance/nndss/phs/infdis.htm. ¶ Includes both neuroinvasive and nonneuroinvasive. Updated weekly from reports to the Division of Vector-Borne Infectious Diseases, National Center for Zoonotic, Vector-Borne, and
Enteric Diseases (ArboNET Surveillance). Data for West Nile virus are available in Table II. ** Data for H. influenzae (all ages, all serotypes) are available in Table II. †† Updated weekly from reports to the Influenza Division, National Center for Immunization and Respiratory Diseases. Since October 2, 2011, no influenza-associated pediatric deaths
occurring during the 2011-12 influenza season have been reported. §§ No measles cases were reported for the current week. ¶¶ Data for meningococcal disease (all serogroups) are available in Table II. *** CDC discontinued reporting of individual confirmed and probable cases of 2009 pandemic influenza A (H1N1) virus infections on July 24, 2009. During 2009, four cases of human infection
with novel influenza A viruses, different from the 2009 pandemic influenza A (H1N1) strain, were reported to CDC. The four cases of novel influenza A virus infection reported to CDC during 2010, and the eight cases reported during 2011, were identified as swine influenza A (H3N2) virus and are unrelated to the 2009 pandemic influenza A (H1N1) virus. Total case counts are provided by the Influenza Division, National Center for Immunization and Respiratory Diseases (NCIRD).
††† No rubella cases were reported for the current week. §§§ Updated weekly from reports to the Division of STD Prevention, National Center for HIV/AIDS, Viral Hepatitis, STD, and TB Prevention. ¶¶¶ There were no cases of viral hemorrhagic fever reported during the current week. See Table II for dengue hemorrhagic fever.

Morbidity and Mortality Weekly Report
MMWR / January 13, 2012 / Vol. 61 / No. 1 ND-3
TABLE II. Provisional cases of selected notifiable diseases, United States, weeks ending January 7, 2012, and January 8, 2011 (1st week)*
Reporting area
Chlamydia trachomatis infection Coccidioidomycosis Cryptosporidiosis
Current week
Previous 52 weeks Cum 2012
Cum 2011
Current week
Previous 52 weeks Cum 2012
Cum 2011
Current week
Previous 52 weeks Cum 2012
Cum 2011Med Max Med Max Med Max
United States 6,839 26,636 30,779 6,839 24,829 73 385 585 73 439 35 129 394 35 99New England — 868 1,594 — 591 — 0 1 — — — 7 22 — 9
Connecticut — 227 474 — 10 — 0 0 — — — 1 9 — 3Maine — 59 99 — 62 — 0 0 — — — 1 4 — —Massachusetts — 427 860 — 409 — 0 0 — — — 3 8 — 5New Hampshire — 56 90 — 33 — 0 1 — — — 1 5 — 1Rhode Island — 79 170 — 48 — 0 0 — — — 0 1 — —Vermont — 27 84 — 29 — 0 0 — — — 1 5 — —
Mid. Atlantic 681 3,216 3,954 681 2,575 — 0 1 — — 2 15 42 2 6New Jersey 93 540 1,004 93 351 — 0 0 — — — 0 0 — —New York (Upstate) 171 715 1,058 171 278 — 0 0 — — — 4 16 — —New York City — 1,094 1,315 — 1,190 — 0 0 — — — 1 6 — 1Pennsylvania 417 984 1,236 417 756 — 0 1 — — 2 9 26 2 5
E.N. Central 712 4,093 5,187 712 5,187 — 1 5 — — 15 32 146 15 36Illinois 19 1,129 1,343 19 1,237 — 0 0 — — — 3 26 — 6Indiana 147 543 1,405 147 1,405 — 0 0 — — — 3 14 — 6Michigan 300 956 1,429 300 1,048 — 0 3 — — 1 6 14 1 6Ohio 127 1,009 1,124 127 1,062 — 0 3 — — 12 11 95 12 12Wisconsin 119 468 553 119 435 — 0 0 — — 2 8 64 2 6
W.N. Central 20 1,494 1,808 20 1,547 — 0 2 — — 2 16 87 2 10Iowa 10 212 253 10 238 — 0 0 — — — 6 19 — 2Kansas — 210 288 — 228 — 0 0 — — — 0 11 — —Minnesota — 312 396 — 373 — 0 0 — — — 0 0 — —Missouri — 539 759 — 501 — 0 0 — — 1 5 63 1 2Nebraska — 119 215 — 92 — 0 2 — — 1 2 12 1 4North Dakota — 39 64 — 22 — 0 0 — — — 0 12 — —South Dakota 10 63 93 10 93 — 0 0 — — — 2 13 — 2
S. Atlantic 3,688 5,381 7,387 3,688 5,251 — 0 2 — — 11 21 41 11 22Delaware 28 86 182 28 83 — 0 0 — — — 0 1 — —District of Columbia 130 109 190 130 119 — 0 0 — — — 0 1 — —Florida 618 1,500 1,697 618 1,399 — 0 0 — — 4 8 17 4 7Georgia 543 1,013 1,569 543 718 — 0 0 — — — 5 11 — 2Maryland — 468 790 — 254 — 0 2 — — 6 1 6 6 —North Carolina 1,509 997 1,688 1,509 1,369 — 0 0 — — — 0 25 — —South Carolina — 530 1,337 — 328 — 0 0 — — 1 2 8 1 8Virginia 813 662 1,575 813 860 — 0 1 — — — 2 8 — 5West Virginia 47 82 121 47 121 — 0 0 — — — 0 5 — —
E.S. Central 292 1,881 2,804 292 1,387 — 0 0 — — 2 7 25 2 2Alabama — 549 1,566 — 552 — 0 0 — — — 2 7 — 1Kentucky 98 299 557 98 — — 0 0 — — — 1 17 — 1Mississippi — 398 696 — 227 — 0 0 — — — 1 4 — —Tennessee 194 600 751 194 608 — 0 0 — — 2 2 6 2 —
W.S. Central 131 3,372 4,327 131 2,812 — 0 1 — — — 8 43 — —Arkansas — 309 440 — 335 — 0 0 — — — 0 2 — —Louisiana 113 377 1,071 113 262 — 0 1 — — — 0 9 — —Oklahoma 18 153 676 18 29 — 0 0 — — — 2 6 — —Texas — 2,419 3,129 — 2,186 — 0 0 — — — 5 39 — —
Mountain 432 1,753 2,344 432 1,347 39 305 459 39 321 1 10 30 1 8Arizona 409 548 782 409 464 39 300 456 39 315 — 1 4 — —Colorado — 421 847 — 275 — 0 0 — — — 3 12 — 1Idaho — 82 235 — 53 — 0 0 — — — 1 9 — 3Montana — 66 88 — 67 — 0 2 — — — 1 6 — 1Nevada — 205 380 — 203 — 2 5 — 4 1 0 2 1 1New Mexico — 199 481 — 141 — 0 4 — — — 3 9 — 1Utah 23 132 190 23 114 — 0 4 — 2 — 1 5 — 1Wyoming — 34 67 — 30 — 0 2 — — — 0 5 — —
Pacific 883 3,957 5,412 883 4,132 34 90 145 34 118 2 10 21 2 6Alaska 71 110 157 71 129 — 0 0 — — — 0 3 — —California 283 2,983 4,482 283 3,217 34 89 145 34 118 2 6 15 2 2Hawaii — 114 141 — 102 — 0 0 — — — 0 1 — —Oregon 246 273 412 246 268 — 0 1 — — — 2 8 — 4Washington 283 431 672 283 416 — 0 0 — — — 1 6 — —
TerritoriesAmerican Samoa — 0 0 — — — 0 0 — — N 0 0 N NC.N.M.I. — — — — — — — — — — — — — — —Guam — 14 44 — — — 0 0 — — — 0 0 — —Puerto Rico — 108 349 — 113 — 0 0 — — N 0 0 N NU.S. Virgin Islands — 17 27 — — — 0 0 — — — 0 0 — —
C.N.M.I.: Commonwealth of Northern Mariana Islands.U: Unavailable. —: No reported cases. N: Not reportable. NN: Not Nationally Notifiable. Cum: Cumulative year-to-date counts. Med: Median. Max: Maximum.* Case counts for reporting year 2011 and 2012 are provisional and subject to change. For further information on interpretation of these data, see http://www.cdc.gov/osels/ph_surveillance/
nndss/phs/files/ProvisionalNationa%20NotifiableDiseasesSurveillanceData20100927.pdf. Data for TB are displayed in Table IV, which appears quarterly.

Morbidity and Mortality Weekly Report
ND-4 MMWR / January 13, 2012 / Vol. 61 / No. 1
TABLE II. (Continued) Provisional cases of selected notifiable diseases, United States, weeks ending January 7, 2012, and January 8, 2011 (1st week)*
Reporting area
Dengue Virus Infection
Dengue Fever† Dengue Hemorrhagic Fever§
Current week
Previous 52 weeks Cum 2012
Cum 2011
Current week
Previous 52 weeks Cum 2012
Cum 2011Med Max Med Max
United States — 2 16 — 7 — 0 1 — —New England — 0 1 — — — 0 0 — —
Connecticut — 0 0 — — — 0 0 — —Maine — 0 0 — — — 0 0 — —Massachusetts — 0 0 — — — 0 0 — —New Hampshire — 0 0 — — — 0 0 — —Rhode Island — 0 0 — — — 0 0 — —Vermont — 0 1 — — — 0 0 — —
Mid. Atlantic — 1 6 — 2 — 0 0 — —New Jersey — 0 0 — — — 0 0 — —New York (Upstate) — 0 0 — — — 0 0 — —New York City — 0 4 — 1 — 0 0 — —Pennsylvania — 0 2 — 1 — 0 0 — —
E.N. Central — 0 2 — 1 — 0 1 — —Illinois — 0 1 — — — 0 1 — —Indiana — 0 1 — 1 — 0 0 — —Michigan — 0 1 — — — 0 0 — —Ohio — 0 1 — — — 0 0 — —Wisconsin — 0 2 — — — 0 0 — —
W.N. Central — 0 2 — — — 0 0 — —Iowa — 0 1 — — — 0 0 — —Kansas — 0 1 — — — 0 0 — —Minnesota — 0 1 — — — 0 0 — —Missouri — 0 1 — — — 0 0 — —Nebraska — 0 0 — — — 0 0 — —North Dakota — 0 1 — — — 0 0 — —South Dakota — 0 0 — — — 0 0 — —
S. Atlantic — 1 8 — 2 — 0 1 — —Delaware — 0 2 — — — 0 0 — —District of Columbia — 0 0 — — — 0 0 — —Florida — 1 7 — 1 — 0 0 — —Georgia — 0 1 — — — 0 0 — —Maryland — 0 2 — — — 0 0 — —North Carolina — 0 1 — — — 0 0 — —South Carolina — 0 1 — — — 0 0 — —Virginia — 0 1 — 1 — 0 1 — —West Virginia — 0 0 — — — 0 0 — —
E.S. Central — 0 3 — — — 0 0 — —Alabama — 0 1 — — — 0 0 — —Kentucky — 0 1 — — — 0 0 — —Mississippi — 0 0 — — — 0 0 — —Tennessee — 0 2 — — — 0 0 — —
W.S. Central — 0 2 — — — 0 0 — —Arkansas — 0 0 — — — 0 0 — —Louisiana — 0 1 — — — 0 0 — —Oklahoma — 0 0 — — — 0 0 — —Texas — 0 1 — — — 0 0 — —
Mountain — 0 1 — 1 — 0 0 — —Arizona — 0 1 — 1 — 0 0 — —Colorado — 0 0 — — — 0 0 — —Idaho — 0 0 — — — 0 0 — —Montana — 0 0 — — — 0 0 — —Nevada — 0 1 — — — 0 0 — —New Mexico — 0 0 — — — 0 0 — —Utah — 0 1 — — — 0 0 — —Wyoming — 0 0 — — — 0 0 — —
Pacific — 0 4 — 1 — 0 0 — —Alaska — 0 0 — — — 0 0 — —California — 0 2 — — — 0 0 — —Hawaii — 0 4 — — — 0 0 — —Oregon — 0 0 — — — 0 0 — —Washington — 0 1 — 1 — 0 0 — —
TerritoriesAmerican Samoa — 0 0 — — — 0 0 — —C.N.M.I. — — — — — — — — — —Guam — 0 0 — — — 0 0 — —Puerto Rico — 18 82 — 16 — 0 3 — 1U.S. Virgin Islands — 0 0 — — — 0 0 — —
C.N.M.I.: Commonwealth of Northern Mariana Islands.U: Unavailable. —: No reported cases. N: Not reportable. NN: Not Nationally Notifiable. Cum: Cumulative year-to-date counts. Med: Median. Max: Maximum. * Case counts for reporting year 2011 and 2012 are provisional and subject to change. For further information on interpretation of these data, see http://www.cdc.gov/osels/ph_surveillance/
nndss/phs/files/ProvisionalNationa%20NotifiableDiseasesSurveillanceData20100927.pdf. Data for TB are displayed in Table IV, which appears quarterly. † Dengue Fever includes cases that meet criteria for Dengue Fever with hemorrhage, other clinical and unknown case classifications. § DHF includes cases that meet criteria for dengue shock syndrome (DSS), a more severe form of DHF.

Morbidity and Mortality Weekly Report
MMWR / January 13, 2012 / Vol. 61 / No. 1 ND-5
TABLE II. (Continued) Provisional cases of selected notifiable diseases, United States, weeks ending January 7, 2012, and January 8, 2011 (1st week)*
Reporting area
Ehrlichiosis/Anaplasmosis†
Ehrlichia chaffeensis Anaplasma phagocytophilum Undetermined
Current week
Previous 52 weeks Cum 2012
Cum 2011
Current week
Previous 52 weeks Cum 2012
Cum 2011
Current week
Previous 52 weeks Cum 2012
Cum 2011Med Max Med Max Med Max
United States 1 7 93 1 2 — 17 57 — 3 — 2 9 — 1New England — 0 1 — — — 3 28 — 1 — 0 1 — —
Connecticut — 0 0 — — — 0 0 — — — 0 0 — —Maine — 0 1 — — — 0 3 — — — 0 0 — —Massachusetts — 0 0 — — — 1 18 — — — 0 0 — —New Hampshire — 0 1 — — — 0 4 — — — 0 1 — —Rhode Island — 0 1 — — — 0 15 — 1 — 0 1 — —Vermont — 0 0 — — — 0 1 — — — 0 0 — —
Mid. Atlantic — 1 5 — — — 6 31 — 1 — 0 2 — —New Jersey — 0 0 — — — 0 0 — — — 0 0 — —New York (Upstate) — 0 4 — — — 3 27 — — — 0 2 — —New York City — 0 2 — — — 1 5 — 1 — 0 0 — —Pennsylvania — 0 0 — — — 0 1 — — — 0 0 — —
E.N. Central — 0 5 — — — 0 2 — — — 1 6 — 1Illinois — 0 4 — — — 0 2 — — — 0 1 — —Indiana — 0 0 — — — 0 0 — — — 0 4 — 1Michigan — 0 2 — — — 0 0 — — — 0 2 — —Ohio — 0 1 — — — 0 1 — — — 0 1 — —Wisconsin — 0 0 — — — 0 1 — — — 0 1 — —
W.N. Central 1 1 19 1 — — 0 8 — — — 0 7 — —Iowa N 0 0 N N N 0 0 N N N 0 0 N NKansas — 0 2 — — — 0 1 — — — 0 1 — —Minnesota — 0 0 — — — 0 1 — — — 0 0 — —Missouri 1 1 19 1 — — 0 7 — — — 0 7 — —Nebraska — 0 1 — — — 0 1 — — — 0 0 — —North Dakota N 0 0 N N N 0 0 N N N 0 0 N NSouth Dakota — 0 1 — — — 0 1 — — — 0 0 — —
S. Atlantic — 2 33 — 2 — 1 8 — 1 — 0 2 — —Delaware — 0 2 — — — 0 1 — — — 0 0 — —District of Columbia N 0 0 N N N 0 0 N N N 0 0 N NFlorida — 0 3 — — — 0 3 — — — 0 0 — —Georgia — 0 3 — 1 — 0 2 — — — 0 1 — —Maryland — 0 3 — — — 0 2 — — — 0 1 — —North Carolina — 0 17 — 1 — 0 6 — 1 — 0 0 — —South Carolina — 0 1 — — — 0 0 — — — 0 1 — —Virginia — 1 13 — — — 0 3 — — — 0 1 — —West Virginia — 0 0 — — — 0 0 — — — 0 1 — —
E.S. Central — 0 8 — — — 0 2 — — — 0 3 — —Alabama — 0 2 — — — 0 1 — — N 0 0 N NKentucky — 0 3 — — — 0 0 — — — 0 0 — —Mississippi — 0 1 — — — 0 1 — — — 0 0 — —Tennessee — 0 5 — — — 0 2 — — — 0 3 — —
W.S. Central — 0 30 — — — 0 3 — — — 0 0 — —Arkansas — 0 13 — — — 0 3 — — — 0 0 — —Louisiana — 0 0 — — — 0 0 — — — 0 0 — —Oklahoma — 0 25 — — — 0 1 — — — 0 0 — —Texas — 0 1 — — — 0 0 — — — 0 0 — —
Mountain — 0 0 — — — 0 0 — — — 0 1 — —Arizona — 0 0 — — — 0 0 — — — 0 1 — —Colorado N 0 0 N N N 0 0 N N N 0 0 N NIdaho N 0 0 N N N 0 0 N N N 0 0 N NMontana N 0 0 N N N 0 0 N N N 0 0 N NNevada N 0 0 N N N 0 0 N N N 0 0 N NNew Mexico N 0 0 N N N 0 0 N N N 0 0 N NUtah — 0 0 — — — 0 0 — — — 0 1 — —Wyoming — 0 0 — — — 0 0 — — — 0 0 — —
Pacific — 0 0 — — — 0 1 — — — 0 1 — —Alaska N 0 0 N N N 0 0 N N N 0 0 N NCalifornia — 0 0 — — — 0 0 — — — 0 1 — —Hawaii N 0 0 N N N 0 0 N N N 0 0 N NOregon — 0 0 — — — 0 1 — — — 0 0 — —Washington — 0 0 — — — 0 0 — — — 0 0 — —
TerritoriesAmerican Samoa N 0 0 N N N 0 0 N N N 0 0 N NC.N.M.I. — — — — — — — — — — — — — — —Guam N 0 0 N N N 0 0 N N N 0 0 N NPuerto Rico N 0 0 N N N 0 0 N N N 0 0 N NU.S. Virgin Islands — 0 0 — — — 0 0 — — — 0 0 — —
C.N.M.I.: Commonwealth of Northern Mariana Islands.U: Unavailable. —: No reported cases. N: Not reportable. NN: Not Nationally Notifiable. Cum: Cumulative year-to-date counts. Med: Median. Max: Maximum.* Case counts for reporting year 2011 and 2012 are provisional and subject to change. For further information on interpretation of these data, see http://www.cdc.gov/osels/ph_surveillance/
nndss/phs/files/ProvisionalNationa%20NotifiableDiseasesSurveillanceData20100927.pdf. Data for TB are displayed in Table IV, which appears quarterly.† Cumulative total E. ewingii cases reported for year 2011 = 13 and 0 case reports for 2012.

Morbidity and Mortality Weekly Report
ND-6 MMWR / January 13, 2012 / Vol. 61 / No. 1
TABLE II. (Continued) Provisional cases of selected notifiable diseases, United States, weeks ending January 7, 2012, and January 8, 2011 (1st week)*
Reporting area
Giardiasis GonorrheaHaemophilus influenzae, invasive†
All ages, all serotypes
Current week
Previous 52 weeks Cum 2012
Cum 2011
Current week
Previous 52 weeks Cum 2012
Cum 2011
Current week
Previous 52 weeks Cum 2012
Cum 2011Med Max Med Max Med Max
United States 67 279 436 67 244 1,792 5,990 6,704 1,792 6,137 32 64 89 32 89New England 1 27 64 1 21 — 107 178 — 57 — 4 12 — 5
Connecticut — 4 10 — 4 — 45 101 — 7 — 1 4 — 1Maine — 3 10 — 3 — 5 18 — 2 — 0 2 — 1Massachusetts — 12 29 — 11 — 47 80 — 42 — 2 6 — 2New Hampshire — 2 8 — 3 — 2 7 — 2 — 0 2 — —Rhode Island — 0 10 — — — 6 35 — 2 — 0 1 — —Vermont 1 3 19 1 — — 0 6 — 2 — 0 2 — 1
Mid. Atlantic 4 54 92 4 38 175 744 916 175 541 12 15 25 12 18New Jersey — 0 0 — — 28 150 232 28 91 — 2 6 — 4New York (Upstate) 1 22 51 1 2 41 115 175 41 36 — 3 11 — —New York City 1 16 29 1 20 — 242 315 — 237 2 3 10 2 3Pennsylvania 2 16 29 2 16 106 255 361 106 177 10 5 11 10 11
E.N. Central 16 48 82 16 54 215 1,061 1,483 215 1,483 6 11 22 6 19Illinois — 10 19 — 13 9 290 381 9 344 — 3 11 — 4Indiana — 6 12 — 5 41 133 419 41 419 — 2 6 — 2Michigan — 10 21 — 8 88 237 499 88 276 — 1 4 — 2Ohio 12 16 31 12 22 36 314 398 36 350 6 4 7 6 6Wisconsin 4 8 18 4 6 41 90 118 41 94 — 1 5 — 5
W.N. Central 7 20 52 7 22 2 311 375 2 344 1 2 10 1 1Iowa 2 4 15 2 5 2 37 55 2 48 — 0 1 — —Kansas — 2 9 — 2 — 43 65 — 53 — 0 2 — —Minnesota — 0 0 — — — 44 61 — 49 — 0 0 — —Missouri 3 8 23 3 10 — 150 204 — 152 — 1 5 — 1Nebraska 2 3 11 2 5 — 27 51 — 23 1 0 2 1 —North Dakota — 0 12 — — — 4 8 — 1 — 0 6 — —South Dakota — 1 8 — — — 11 20 — 18 — 0 1 — —
S. Atlantic 15 50 95 15 47 1,083 1,489 1,936 1,083 1,508 9 14 31 9 14Delaware — 0 3 — — 7 15 35 7 23 — 0 2 — —District of Columbia — 1 5 — — 68 38 98 68 43 — 0 0 — —Florida 7 23 69 7 26 181 377 472 181 420 6 5 12 6 5Georgia — 9 51 — 5 210 312 461 210 249 — 2 7 — 7Maryland 3 6 13 3 4 — 117 176 — 83 2 1 5 2 —North Carolina N 0 0 N N 438 331 548 438 427 — 1 7 — 1South Carolina 2 2 8 2 2 — 162 418 — 82 1 1 5 1 —Virginia 3 5 12 3 10 175 116 352 175 160 — 2 8 — 1West Virginia — 0 8 — — 4 16 29 4 21 — 0 5 — —
E.S. Central 1 3 9 1 3 92 514 789 92 416 1 3 12 1 11Alabama 1 3 9 1 3 — 164 408 — 202 — 1 4 — 4Kentucky N 0 0 N N 38 76 151 38 — — 1 4 — 2Mississippi N 0 0 N N — 103 191 — 78 — 0 3 — 1Tennessee N 0 0 N N 54 148 222 54 136 1 2 6 1 4
W.S. Central — 5 15 — 2 26 881 1,177 26 804 — 2 10 — 4Arkansas — 2 8 — — — 87 138 — 105 — 0 3 — —Louisiana — 2 10 — 2 23 120 255 23 95 — 0 4 — 4Oklahoma — 0 0 — — 3 36 196 3 17 — 1 9 — —Texas N 0 0 N N — 592 837 — 587 — 0 1 — —
Mountain 1 25 45 1 21 84 204 314 84 219 — 5 10 — 10Arizona — 2 6 — 3 84 81 130 84 61 — 1 6 — 3Colorado — 11 25 — 8 — 41 89 — 63 — 1 5 — 2Idaho 1 3 9 1 3 — 3 13 — 2 — 0 2 — —Montana — 2 5 — 2 — 1 4 — 2 — 0 1 — —Nevada — 1 7 — 2 — 39 103 — 54 — 0 2 — 1New Mexico — 1 6 — 1 — 33 73 — 34 — 1 4 — 4Utah — 2 9 — 1 — 5 10 — 3 — 0 2 — —Wyoming — 0 5 — 1 — 0 3 — — — 0 1 — —
Pacific 22 47 84 22 36 115 631 765 115 765 3 3 9 3 7Alaska 2 2 7 2 2 15 20 31 15 21 — 0 3 — 1California 17 31 51 17 21 43 524 658 43 658 — 1 5 — —Hawaii — 0 3 — — — 13 24 — 13 — 0 3 — 1Oregon 3 7 20 3 13 13 27 60 13 30 3 1 6 3 5Washington — 6 27 — — 44 49 79 44 43 — 0 1 — —
TerritoriesAmerican Samoa — 0 0 — — — 0 0 — — — 0 0 — —C.N.M.I. — — — — — — — — — — — — — — —Guam — 0 0 — — — 0 5 — — — 0 0 — —Puerto Rico — 0 4 — — — 6 14 — 4 — 0 0 — —U.S. Virgin Islands — 0 0 — — — 3 10 — — — 0 0 — —
C.N.M.I.: Commonwealth of Northern Mariana Islands.U: Unavailable. —: No reported cases. N: Not reportable. NN: Not Nationally Notifiable. Cum: Cumulative year-to-date counts. Med: Median. Max: Maximum.* Case counts for reporting year 2011 and 2012 are provisional and subject to change. For further information on interpretation of these data, see http://www.cdc.gov/osels/ph_surveillance/
nndss/phs/files/ProvisionalNationa%20NotifiableDiseasesSurveillanceData20100927.pdf. Data for TB are displayed in Table IV, which appears quarterly.† Data for H. influenzae (age <5 yrs for serotype b, nonserotype b, and unknown serotype) are available in Table I.

Morbidity and Mortality Weekly Report
MMWR / January 13, 2012 / Vol. 61 / No. 1 ND-7
TABLE II. (Continued) Provisional cases of selected notifiable diseases, United States, weeks ending January 7, 2012, and January 8, 2011 (1st week)*
Reporting area
Hepatitis (viral, acute), by type
A B C
Current week
Previous 52 weeks Cum 2012
Cum 2011
Current week
Previous 52 weeks Cum 2012
Cum 2011
Current week
Previous 52 weeks Cum 2012
Cum 2011Med Max Med Max Med Max
United States 2 21 40 2 20 7 46 95 7 43 6 19 35 6 16New England — 1 5 — 4 — 1 8 — 2 — 1 5 — —
Connecticut — 0 3 — 2 — 0 4 — — — 0 5 — —Maine — 0 2 — — — 0 2 — — — 0 2 — —Massachusetts — 0 3 — 1 — 1 6 — 1 — 0 2 — —New Hampshire — 0 0 — — — 0 1 — 1 N 0 0 N NRhode Island — 0 1 — — U 0 0 U U U 0 0 U UVermont — 0 2 — 1 — 0 0 — — — 0 1 — —
Mid. Atlantic — 3 7 — 3 1 5 8 1 4 — 1 5 — 1New Jersey — 0 0 — — — 0 1 — — — 0 1 — —New York (Upstate) — 1 4 — — — 1 4 — 1 — 1 4 — 1New York City — 1 5 — 2 — 1 5 — 1 — 0 1 — —Pennsylvania — 1 3 — 1 1 2 4 1 2 — 0 4 — —
E.N. Central — 4 8 — 1 1 6 37 1 5 1 2 8 1 5Illinois — 1 4 — — — 1 6 — 1 — 0 2 — 1Indiana — 0 3 — — — 1 4 — — — 1 5 — 2Michigan — 1 6 — — — 1 6 — 3 1 1 4 1 2Ohio — 1 3 — 1 1 1 30 1 — — 0 1 — —Wisconsin — 0 1 — — — 0 3 — 1 — 0 1 — —
W.N. Central — 1 7 — 1 1 2 9 1 6 — 0 4 — —Iowa — 0 1 — 1 — 0 1 — — — 0 0 — —Kansas — 0 1 — — — 0 2 — 1 — 0 1 — —Minnesota — 0 7 — — — 0 7 — — — 0 2 — —Missouri — 0 1 — — — 2 5 — 1 — 0 0 — —Nebraska — 0 1 — — 1 0 3 1 3 — 0 1 — —North Dakota — 0 0 — — — 0 0 — — — 0 0 — —South Dakota — 0 2 — — — 0 1 — 1 — 0 0 — —
S. Atlantic 1 4 11 1 5 3 12 57 3 8 3 5 12 3 4Delaware — 0 1 — 1 — 0 2 — — U 0 0 U UDistrict of Columbia — 0 0 — — — 0 0 — — — 0 0 — —Florida 1 1 8 1 1 2 4 7 2 4 1 1 3 1 —Georgia — 1 5 — 2 — 2 7 — — — 0 3 — 1Maryland — 0 4 — — 1 1 4 1 1 — 0 3 — 2North Carolina — 0 3 — — — 2 9 — — 2 1 7 2 1South Carolina — 0 2 — — — 1 3 — 1 — 0 1 — —Virginia — 0 3 — 1 — 1 4 — 2 — 0 3 — —West Virginia — 0 2 — — — 0 43 — — — 0 7 — —
E.S. Central — 1 6 — 1 — 10 15 — 10 2 4 10 2 2Alabama — 0 2 — — — 2 6 — 3 — 0 3 — —Kentucky — 0 2 — 1 — 3 7 — 2 — 2 8 — 1Mississippi — 0 1 — — — 1 4 — — U 0 0 U UTennessee — 0 5 — — — 4 8 — 5 2 1 5 2 1
W.S. Central — 3 7 — — 1 5 15 1 — — 2 5 — 2Arkansas — 0 2 — — — 1 4 — — — 0 0 — —Louisiana — 0 2 — — — 1 4 — — — 0 2 — 2Oklahoma — 0 2 — — — 1 9 — — — 1 4 — —Texas — 2 7 — — 1 3 7 1 — — 0 3 — —
Mountain — 1 5 — 2 — 1 4 — 3 — 1 5 — 2Arizona — 0 2 — 1 — 0 3 — — U 0 0 U UColorado — 0 2 — — — 0 2 — — — 0 2 — 1Idaho — 0 1 — — — 0 1 — — — 0 2 — 1Montana — 0 1 — — — 0 0 — — — 0 1 — —Nevada — 0 3 — — — 0 3 — 3 — 0 2 — —New Mexico — 0 1 — 1 — 0 2 — — — 0 2 — —Utah — 0 1 — — — 0 1 — — — 0 2 — —Wyoming — 0 1 — — — 0 0 — — — 0 1 — —
Pacific 1 3 11 1 3 — 3 8 — 5 — 1 8 — —Alaska — 0 1 — — — 0 1 — — U 0 0 U UCalifornia 1 3 7 1 2 — 2 7 — 4 — 1 4 — —Hawaii — 0 2 — — — 0 1 — — U 0 0 U UOregon — 0 2 — 1 — 0 4 — 1 — 0 2 — —Washington — 0 4 — — — 0 3 — — — 0 4 — —
TerritoriesAmerican Samoa — 0 0 — — — 0 0 — — — 0 0 — —C.N.M.I. — — — — — — — — — — — — — — —Guam — 0 5 — — — 2 8 — — — 0 3 — —Puerto Rico — 0 1 — — — 0 2 — — N 0 0 N NU.S. Virgin Islands — 0 0 — — — 0 0 — — — 0 0 — —
C.N.M.I.: Commonwealth of Northern Mariana Islands.U: Unavailable. —: No reported cases. N: Not reportable. NN: Not Nationally Notifiable. Cum: Cumulative year-to-date counts. Med: Median. Max: Maximum.* Case counts for reporting year 2011 and 2012 are provisional and subject to change. For further information on interpretation of these data, see http://www.cdc.gov/osels/ph_surveillance/
nndss/phs/files/ProvisionalNationa%20NotifiableDiseasesSurveillanceData20100927.pdf. Data for TB are displayed in Table IV, which appears quarterly.

Morbidity and Mortality Weekly Report
ND-8 MMWR / January 13, 2012 / Vol. 61 / No. 1
TABLE II. (Continued) Provisional cases of selected notifiable diseases, United States, weeks ending January 7, 2012, and January 8, 2011 (1st week)*
Reporting area
Legionellosis Lyme disease Malaria
Current week
Previous 52 weeks Cum 2012
Cum 2011
Current week
Previous 52 weeks Cum 2012
Cum 2011
Current week
Previous 52 weeks Cum 2012
Cum 2011Med Max Med Max Med Max
United States 21 59 161 21 34 70 338 1,513 70 176 4 25 49 4 22New England — 4 39 — 2 — 78 500 — 49 — 1 7 — 3
Connecticut — 1 10 — — — 33 232 — 18 — 0 2 — 1Maine — 0 3 — — — 12 67 — — — 0 2 — —Massachusetts — 3 24 — 1 — 19 106 — 20 — 1 6 — 2New Hampshire — 0 3 — — — 10 90 — 9 — 0 1 — —Rhode Island — 0 9 — — — 1 31 — — — 0 2 — —Vermont — 0 2 — 1 — 6 67 — 2 — 0 1 — —
Mid. Atlantic 1 15 72 1 7 52 172 746 52 75 — 6 13 — 4New Jersey — 0 0 — — 37 1 107 37 — — 0 0 — —New York (Upstate) 1 6 27 1 — — 56 213 — 3 — 1 4 — 1New York City — 3 14 — 5 — 1 13 — 1 — 4 11 — 2Pennsylvania — 5 37 — 2 15 102 520 15 71 — 1 5 — 1
E.N. Central 8 11 51 8 6 2 15 211 2 15 1 3 10 1 3Illinois — 1 11 — — — 1 18 — 2 — 1 5 — 1Indiana 1 2 7 1 — — 1 12 — — — 0 2 — —Michigan — 3 15 — 3 — 1 12 — — 1 0 4 1 —Ohio 7 6 34 7 3 2 0 6 2 — — 1 4 — 1Wisconsin — 0 1 — — — 12 172 — 13 — 0 2 — 1
W.N. Central — 1 8 — 1 — 1 16 — 1 — 1 5 — —Iowa — 0 2 — — — 0 13 — — — 0 3 — —Kansas — 0 2 — — — 0 2 — — — 0 2 — —Minnesota — 0 0 — — — 0 0 — — — 0 0 — —Missouri — 1 5 — 1 — 0 2 — 1 — 0 2 — —Nebraska — 0 2 — — — 0 2 — — — 0 1 — —North Dakota — 0 1 — — — 0 9 — — — 0 0 — —South Dakota — 0 1 — — — 0 2 — — — 0 1 — —
S. Atlantic 7 10 29 7 5 15 58 177 15 35 3 8 24 3 11Delaware — 0 4 — — 1 12 48 1 13 — 0 3 — —District of Columbia — 0 3 — — 1 0 3 1 1 — 0 1 — 1Florida 3 3 13 3 2 3 2 8 3 1 1 2 6 1 2Georgia 3 1 3 3 1 — 0 5 — — — 1 6 — 3Maryland — 1 14 — 2 8 20 114 8 12 — 2 14 — —North Carolina — 1 7 — — — 0 12 — 1 — 0 6 — 3South Carolina — 0 5 — — — 0 6 — — — 0 1 — —Virginia 1 1 7 1 — 2 14 74 2 7 2 1 8 2 2West Virginia — 0 5 — — — 0 13 — — — 0 0 — —
E.S. Central — 2 11 — 3 — 1 5 — — — 1 4 — —Alabama — 0 2 — 1 — 0 2 — — — 0 3 — —Kentucky — 1 4 — 1 — 0 1 — — — 0 2 — —Mississippi — 0 3 — — — 0 1 — — — 0 1 — —Tennessee — 1 8 — 1 — 0 4 — — — 0 3 — —
W.S. Central 1 2 8 1 2 — 1 3 — — — 1 4 — —Arkansas — 0 2 — — — 0 0 — — — 0 1 — —Louisiana — 0 3 — 1 — 0 1 — — — 0 1 — —Oklahoma — 0 3 — — — 0 0 — — — 0 1 — —Texas 1 2 7 1 1 — 1 3 — — — 0 4 — —
Mountain — 2 8 — 1 1 0 5 1 1 — 1 5 — 1Arizona — 1 4 — — — 0 4 — — — 0 4 — —Colorado — 0 1 — — — 0 1 — — — 0 3 — —Idaho — 0 1 — — 1 0 2 1 — — 0 1 — —Montana — 0 1 — — — 0 3 — — — 0 1 — —Nevada — 0 2 — 1 — 0 1 — — — 0 2 — —New Mexico — 0 2 — — — 0 2 — 1 — 0 1 — 1Utah — 0 2 — — — 0 1 — — — 0 1 — —Wyoming — 0 2 — — — 0 1 — — — 0 0 — —
Pacific 4 5 14 4 7 — 2 8 — — — 3 12 — —Alaska — 0 0 — — — 0 3 — — — 0 2 — —California 3 4 13 3 7 — 1 5 — — — 2 7 — —Hawaii — 0 2 — — N 0 0 N N — 0 1 — —Oregon 1 0 3 1 — — 0 2 — — — 0 4 — —Washington — 0 3 — — — 0 6 — — — 0 2 — —
TerritoriesAmerican Samoa N 0 0 N N N 0 0 N N — 0 1 — —C.N.M.I. — — — — — — — — — — — — — — —Guam — 0 0 — — — 0 0 — — — 0 0 — —Puerto Rico — 0 0 — — N 0 0 N N — 0 0 — —U.S. Virgin Islands — 0 0 — — — 0 0 — — — 0 0 — —
C.N.M.I.: Commonwealth of Northern Mariana Islands.U: Unavailable. —: No reported cases. N: Not reportable. NN: Not Nationally Notifiable. Cum: Cumulative year-to-date counts. Med: Median. Max: Maximum.* Case counts for reporting year 2011 and 2012 are provisional and subject to change. For further information on interpretation of these data, see http://www.cdc.gov/osels/ph_surveillance/
nndss/phs/files/ProvisionalNationa%20NotifiableDiseasesSurveillanceData20100927.pdf. Data for TB are displayed in Table IV, which appears quarterly.

Morbidity and Mortality Weekly Report
MMWR / January 13, 2012 / Vol. 61 / No. 1 ND-9
TABLE II. (Continued) Provisional cases of selected notifiable diseases, United States, weeks ending January 7, 2012, and January 8, 2011 (1st week)*
Reporting area
Meningococcal disease, invasive† All serogroups Mumps Pertussis
Current week
Previous 52 weeks Cum 2012
Cum 2011
Current week
Previous 52 weeks Cum 2012
Cum 2011
Current week
Previous 52 weeks Cum 2012
Cum 2011Med Max Med Max Med Max
United States 3 12 30 3 20 — 7 19 — 7 66 308 489 66 340New England — 0 3 — 1 — 0 2 — — 1 14 32 1 6
Connecticut — 0 1 — 1 — 0 0 — — — 1 5 — —Maine — 0 1 — — — 0 2 — — 1 3 19 1 1Massachusetts — 0 2 — — — 0 1 — — — 4 10 — 3New Hampshire — 0 1 — — — 0 0 — — — 2 13 — 1Rhode Island — 0 1 — — — 0 2 — — — 0 4 — 1Vermont — 0 3 — — — 0 1 — — — 0 16 — —
Mid. Atlantic — 1 5 — 5 — 1 6 — 1 21 31 84 21 16New Jersey — 0 0 — — — 0 2 — 1 — 4 10 — 2New York (Upstate) — 0 4 — — — 0 3 — — 1 12 63 1 3New York City — 0 3 — 3 — 0 6 — — — 1 41 — —Pennsylvania — 0 2 — 2 — 0 1 — — 20 12 40 20 11
E.N. Central 1 2 6 1 2 — 2 12 — 2 18 66 197 18 113Illinois — 0 3 — — — 1 10 — — — 18 120 — 24Indiana — 0 2 — — — 0 2 — — — 4 21 — 11Michigan — 0 1 — — — 0 2 — — 3 10 38 3 34Ohio 1 0 2 1 2 — 0 2 — 2 14 13 37 14 37Wisconsin — 0 2 — — — 0 1 — — 1 12 44 1 7
W.N. Central — 1 3 — 1 — 0 3 — 2 11 21 119 11 28Iowa — 0 1 — — — 0 2 — — — 4 9 — 4Kansas — 0 1 — — — 0 1 — 1 — 2 10 — 1Minnesota — 0 0 — — — 0 1 — — — 0 110 — —Missouri — 0 3 — 1 — 0 3 — — 11 7 27 11 17Nebraska — 0 2 — — — 0 1 — 1 — 1 5 — 5North Dakota — 0 1 — — — 0 3 — — — 0 10 — —South Dakota — 0 1 — — — 0 0 — — — 0 7 — 1
S. Atlantic 2 2 8 2 2 — 0 4 — — 11 25 67 11 31Delaware — 0 1 — — — 0 0 — — — 0 5 — —District of Columbia — 0 1 — — — 0 1 — — — 0 2 — 1Florida — 1 5 — 1 — 0 2 — — 5 6 17 5 3Georgia — 0 1 — — — 0 2 — — — 3 8 — 6Maryland 2 0 1 2 — — 0 1 — — 3 1 8 3 1North Carolina — 0 3 — — — 0 2 — — 3 2 35 3 —South Carolina — 0 1 — 1 — 0 1 — — — 2 11 — 11Virginia — 0 2 — — — 0 4 — — — 6 25 — 9West Virginia — 0 3 — — — 0 1 — — — 0 15 — —
E.S. Central — 0 3 — — — 0 1 — — 1 9 25 1 8Alabama — 0 2 — — — 0 1 — — — 2 11 — 1Kentucky — 0 2 — — — 0 0 — — — 3 16 — 4Mississippi — 0 1 — — — 0 1 — — — 0 4 — —Tennessee — 0 2 — — — 0 1 — — 1 2 7 1 3
W.S. Central — 1 5 — 1 — 1 12 — — 1 19 38 1 4Arkansas — 0 2 — — — 0 2 — — — 1 5 — —Louisiana — 0 2 — 1 — 0 0 — — — 0 3 — 1Oklahoma — 0 2 — — — 0 2 — — — 0 11 — —Texas — 0 2 — — — 1 12 — — 1 17 38 1 3
Mountain — 1 4 — 3 — 0 2 — 1 1 38 79 1 31Arizona — 0 1 — 1 — 0 0 — — 1 12 28 1 8Colorado — 0 1 — 1 — 0 1 — — — 8 25 — 15Idaho — 0 1 — 1 — 0 2 — — — 3 12 — —Montana — 0 2 — — — 0 0 — — — 1 32 — 1Nevada — 0 1 — — — 0 0 — — — 0 4 — 1New Mexico — 0 1 — — — 0 1 — 1 — 3 23 — —Utah — 0 2 — — — 0 0 — — — 6 16 — 6Wyoming — 0 0 — — — 0 1 — — — 0 1 — —
Pacific — 2 10 — 5 — 0 11 — 1 1 62 126 1 103Alaska — 0 1 — — — 0 1 — — — 0 4 — 1California — 2 9 — 4 — 0 11 — — 1 37 102 1 98Hawaii — 0 1 — — — 0 1 — — — 1 9 — —Oregon — 0 3 — 1 — 0 1 — 1 — 5 23 — 4Washington — 0 2 — — — 0 1 — — — 11 72 — —
TerritoriesAmerican Samoa — 0 0 — — — 0 0 — — — 0 0 — —C.N.M.I. — — — — — — — — — — — — — — —Guam — 0 0 — — — 1 3 — — — 2 14 — —Puerto Rico — 0 0 — — — 0 1 — — — 0 1 — —U.S. Virgin Islands — 0 0 — — — 0 0 — — — 0 0 — —
C.N.M.I.: Commonwealth of Northern Mariana Islands.U: Unavailable. —: No reported cases. N: Not reportable. NN: Not Nationally Notifiable. Cum: Cumulative year-to-date counts. Med: Median. Max: Maximum.* Case counts for reporting year 2011 and 2012 are provisional and subject to change. For further information on interpretation of these data, see http://www.cdc.gov/osels/ph_surveillance/
nndss/phs/files/ProvisionalNationa%20NotifiableDiseasesSurveillanceData20100927.pdf. Data for TB are displayed in Table IV, which appears quarterly.† Data for meningococcal disease, invasive caused by serogroups A, C, Y, and W-135; serogroup B; other serogroup; and unknown serogroup are available in Table I.

Morbidity and Mortality Weekly Report
ND-10 MMWR / January 13, 2012 / Vol. 61 / No. 1
TABLE II. (Continued) Provisional cases of selected notifiable diseases, United States, weeks ending January 7, 2012, and January 8, 2011 (1st week)*
Reporting area
Rabies, animal Salmonellosis Shiga toxin-producing E. coli (STEC)†
Current week
Previous 52 weeks Cum 2012
Cum 2011
Current week
Previous 52 weeks Cum 2012
Cum 2011
Current week
Previous 52 weeks Cum 2012
Cum 2011Med Max Med Max Med Max
United States 6 58 113 6 24 156 835 1,824 156 455 10 84 203 10 52New England 3 4 16 3 2 3 37 107 3 22 — 3 13 — 1
Connecticut — 2 10 — 1 — 8 30 — 3 — 1 4 — 1Maine 3 1 6 3 1 2 2 8 2 — — 0 3 — —Massachusetts — 0 0 — — — 19 44 — 12 — 1 9 — —New Hampshire — 0 3 — — — 3 8 — 3 — 0 3 — —Rhode Island — 0 6 — — — 1 62 — 1 — 0 2 — —Vermont — 0 2 — — 1 1 8 1 3 — 0 3 — —
Mid. Atlantic 1 15 35 1 13 10 71 171 10 35 — 8 30 — 3New Jersey — 0 0 — — — 0 3 — — — 0 0 — —New York (Upstate) 1 7 20 1 8 2 26 67 2 3 — 3 13 — —New York City — 0 3 — — 1 19 42 1 10 — 1 6 — —Pennsylvania — 8 21 — 5 7 31 112 7 22 — 3 18 — 3
E.N. Central — 2 17 — 1 9 84 162 9 67 — 14 51 — 9Illinois — 0 6 — 1 — 27 80 — 32 — 3 14 — 2Indiana — 0 7 — — — 7 24 — — — 1 10 — 4Michigan — 1 6 — — 1 14 42 1 12 — 3 19 — 1Ohio — 1 5 — — 8 21 46 8 18 — 3 10 — 1Wisconsin N 0 0 N N — 6 45 — 5 — 2 21 — 1
W.N. Central — 1 7 — — 6 40 103 6 27 2 11 40 2 3Iowa — 0 0 — — — 9 19 — 9 — 2 15 — —Kansas — 0 4 — — — 8 27 — 3 — 2 8 — —Minnesota — 0 0 — — — 0 0 — — — 0 0 — —Missouri — 0 1 — — 4 16 46 4 11 2 5 32 2 —Nebraska — 0 3 — — 2 4 13 2 4 — 1 7 — 3North Dakota — 0 3 — — — 0 15 — — — 0 4 — —South Dakota — 0 0 — — — 3 10 — — — 1 4 — —
S. Atlantic 2 19 93 2 8 72 252 724 72 132 6 12 28 6 10Delaware — 0 0 — — 2 3 11 2 2 — 0 2 — —District of Columbia — 0 0 — — — 1 6 — — — 0 1 — —Florida 2 0 84 2 — 46 107 203 46 48 — 3 9 — 2Georgia — 0 0 — — 8 40 128 8 27 — 2 8 — 3Maryland — 6 13 — — 8 18 42 8 8 1 1 3 1 2North Carolina — 0 0 — — — 30 251 — 22 — 2 11 — —South Carolina N 0 0 N N 2 26 70 2 7 — 0 4 — —Virginia — 11 27 — 8 6 20 52 6 18 5 3 9 5 3West Virginia — 0 30 — — — 0 18 — — — 0 1 — —
E.S. Central — 3 11 — — 14 64 190 14 45 1 5 18 1 5Alabama — 2 7 — — 7 20 70 7 20 1 0 15 1 2Kentucky — 0 2 — — — 11 30 — 5 — 1 5 — —Mississippi — 0 1 — — 6 22 66 6 8 — 0 4 — —Tennessee — 1 6 — — 1 16 52 1 12 — 1 11 — 3
W.S. Central — 0 21 — — 6 120 250 6 23 — 9 33 — —Arkansas — 0 10 — — 2 13 52 2 2 — 1 6 — —Louisiana — 0 0 — — 1 14 44 1 13 — 0 1 — —Oklahoma — 0 21 — — 1 12 31 1 1 — 1 10 — —Texas — 0 0 — — 2 81 156 2 7 — 6 33 — —
Mountain — 0 4 — — 10 46 93 10 42 1 10 26 1 6Arizona N 0 0 N N 5 15 34 5 11 — 1 7 — 1Colorado — 0 0 — — — 10 24 — 14 — 2 7 — 3Idaho — 0 1 — — — 3 8 — 3 1 2 8 1 2Montana N 0 0 N N 3 2 10 3 — — 0 5 — —Nevada — 0 2 — — — 3 7 — 5 — 0 7 — —New Mexico — 0 2 — — 1 6 22 1 5 — 1 3 — —Utah — 0 2 — — 1 6 15 1 4 — 1 7 — —Wyoming — 0 0 — — — 1 9 — — — 0 7 — —
Pacific — 4 13 — — 26 91 175 26 62 — 15 34 — 15Alaska — 0 2 — — — 1 6 — 1 — 0 1 — —California — 3 12 — — 22 73 142 22 46 — 9 19 — 13Hawaii — 0 0 — — 2 7 14 2 9 — 0 2 — —Oregon — 0 1 — — 2 5 12 2 6 — 1 11 — 2Washington — 0 0 — — — 9 30 — — — 2 13 — —
TerritoriesAmerican Samoa N 0 0 N N — 0 0 — — — 0 0 — —C.N.M.I. — — — — — — — — — — — — — — —Guam — 0 0 — — — 0 3 — — — 0 0 — —Puerto Rico — 0 6 — — — 3 12 — 1 — 0 0 — —U.S. Virgin Islands — 0 0 — — — 0 0 — — — 0 0 — —
C.N.M.I.: Commonwealth of Northern Mariana Islands.U: Unavailable. —: No reported cases. N: Not reportable. NN: Not Nationally Notifiable. Cum: Cumulative year-to-date counts. Med: Median. Max: Maximum.* Case counts for reporting year 2011 and 2012 are provisional and subject to change. For further information on interpretation of these data, see http://www.cdc.gov/osels/ph_surveillance/
nndss/phs/files/ProvisionalNationa%20NotifiableDiseasesSurveillanceData20100927.pdf. Data for TB are displayed in Table IV, which appears quarterly.† Includes E. coli O157:H7; Shiga toxin-positive, serogroup non-O157; and Shiga toxin-positive, not serogrouped.

Morbidity and Mortality Weekly Report
MMWR / January 13, 2012 / Vol. 61 / No. 1 ND-11
TABLE II. (Continued) Provisional cases of selected notifiable diseases, United States, weeks ending January 7, 2012, and January 8, 2011 (1st week)*
Spotted Fever Rickettsiosis (including RMSF)†
Reporting area
Shigellosis Confirmed Probable
Current week
Previous 52 weeks Cum 2012
Cum 2011
Current week
Previous 52 weeks Cum 2012
Cum 2011
Current week
Previous 52 weeks Cum 2012
Cum 2011Med Max Med Max Med Max
United States 81 230 342 81 146 1 3 15 1 1 5 26 140 5 7New England — 5 21 — 2 — 0 1 — — — 0 1 — —
Connecticut — 0 4 — 1 — 0 0 — — — 0 0 — —Maine — 0 8 — — — 0 0 — — — 0 1 — —Massachusetts — 3 20 — 1 — 0 0 — — — 0 1 — —New Hampshire — 0 1 — — — 0 1 — — — 0 1 — —Rhode Island — 0 3 — — — 0 0 — — — 0 1 — —Vermont — 0 1 — — — 0 0 — — — 0 0 — —
Mid. Atlantic 4 14 48 4 11 — 0 2 — — 1 1 4 1 1New Jersey — 0 4 — — — 0 0 — — — 0 0 — —New York (Upstate) 2 5 28 2 — — 0 1 — — — 0 2 — —New York City 1 7 28 1 7 — 0 0 — — — 0 3 — 1Pennsylvania 1 2 6 1 4 — 0 2 — — 1 0 3 1 —
E.N. Central 25 12 40 25 12 1 0 2 1 — — 2 10 — 1Illinois — 4 16 — 4 — 0 1 — — — 1 4 — 1Indiana — 1 4 — 1 1 0 1 1 — — 0 4 — —Michigan — 3 11 — 3 — 0 1 — — — 0 1 — —Ohio 25 5 27 25 4 — 0 2 — — — 0 2 — —Wisconsin — 0 0 — — — 0 0 — — — 0 0 — —
W.N. Central 4 5 18 4 14 — 0 4 — — 1 4 29 1 —Iowa — 0 3 — — — 0 0 — — — 0 2 — —Kansas — 1 5 — 3 — 0 0 — — — 0 0 — —Minnesota — 0 0 — — — 0 0 — — — 0 0 — —Missouri 4 3 14 4 11 — 0 3 — — 1 4 29 1 —Nebraska — 0 2 — — — 0 3 — — — 0 1 — —North Dakota — 0 0 — — — 0 1 — — — 0 0 — —South Dakota — 0 2 — — — 0 1 — — — 0 0 — —
S. Atlantic 19 73 134 19 44 — 1 8 — — 3 6 56 3 1Delaware — 0 2 — — — 0 1 — — — 0 4 — —District of Columbia — 0 5 — — — 0 1 — — — 0 1 — —Florida 18 50 98 18 31 — 0 1 — — 2 0 2 2 —Georgia 1 10 24 1 8 — 1 6 — — — 0 0 — —Maryland — 1 7 — 1 — 0 1 — — — 0 2 — —North Carolina — 3 19 — 1 — 0 4 — — — 0 49 — 1South Carolina — 1 54 — 1 — 0 2 — — — 0 2 — —Virginia — 2 7 — 2 — 0 1 — — 1 3 14 1 —West Virginia — 0 2 — — — 0 0 — — — 0 1 — —
E.S. Central 18 17 47 18 16 — 0 2 — — — 4 25 — 1Alabama 9 5 21 9 10 — 0 1 — — — 1 8 — —Kentucky 9 3 22 9 1 — 0 1 — — — 0 2 — —Mississippi — 4 24 — 1 — 0 0 — — — 0 2 — —Tennessee — 4 11 — 4 — 0 2 — — — 3 20 — 1
W.S. Central — 54 103 — 13 — 0 3 — — — 2 51 — —Arkansas — 2 7 — — — 0 3 — — — 1 51 — —Louisiana — 4 21 — 5 — 0 0 — — — 0 2 — —Oklahoma — 2 28 — — — 0 1 — — — 0 25 — —Texas — 41 98 — 8 — 0 1 — — — 0 4 — —
Mountain 1 14 42 1 17 — 0 2 — 1 — 1 7 — 3Arizona 1 5 27 1 8 — 0 2 — 1 — 0 6 — 3Colorado — 1 8 — 7 — 0 0 — — — 0 1 — —Idaho — 0 3 — 1 — 0 0 — — — 0 1 — —Montana — 1 15 — — — 0 0 — — — 0 1 — —Nevada — 0 4 — — — 0 0 — — — 0 1 — —New Mexico — 2 7 — 1 — 0 0 — — — 0 0 — —Utah — 1 4 — — — 0 0 — — — 0 1 — —Wyoming — 0 1 — — — 0 0 — — — 0 2 — —
Pacific 10 20 44 10 17 — 0 2 — — — 0 1 — —Alaska 1 0 2 1 — N 0 0 N N N 0 0 N NCalifornia 9 16 41 9 15 — 0 2 — — — 0 1 — —Hawaii — 1 3 — — N 0 0 N N N 0 0 N NOregon — 1 4 — 2 — 0 0 — — — 0 0 — —Washington — 1 9 — — — 0 0 — — — 0 0 — —
TerritoriesAmerican Samoa — 0 1 — — N 0 0 N N N 0 0 N NC.N.M.I. — — — — — — — — — — — — — — —Guam — 0 1 — — N 0 0 N N N 0 0 N NPuerto Rico — 0 0 — — N 0 0 N N N 0 0 N NU.S. Virgin Islands — 0 0 — — — 0 0 — — — 0 0 — —
C.N.M.I.: Commonwealth of Northern Mariana Islands.U: Unavailable. —: No reported cases. N: Not reportable. NN: Not Nationally Notifiable. Cum: Cumulative year-to-date counts. Med: Median. Max: Maximum.* Case counts for reporting year 2011 and 2012 are provisional and subject to change. For further information on interpretation of these data, see http://www.cdc.gov/osels/ph_surveillance/
nndss/phs/files/ProvisionalNationa%20NotifiableDiseasesSurveillanceData20100927.pdf. Data for TB are displayed in Table IV, which appears quarterly.† Illnesses with similar clinical presentation that result from Spotted fever group rickettsia infections are reported as Spotted fever rickettsioses. Rocky Mountain spotted fever (RMSF) caused
by Rickettsia rickettsii, is the most common and well-known spotted fever.

Morbidity and Mortality Weekly Report
ND-12 MMWR / January 13, 2012 / Vol. 61 / No. 1
TABLE II. (Continued) Provisional cases of selected notifiable diseases, United States, weeks ending January 7, 2012, and January 8, 2011 (1st week)*
Reporting area
Streptococcus pneumoniae,† invasive disease
Syphilis, primary and secondaryAll ages Age <5
Current week
Previous 52 weeks Cum 2012
Cum 2011
Current week
Previous 52 weeks Cum 2012
Cum 2011
Current week
Previous 52 weeks Cum 2012
Cum 2011Med Max Med Max Med Max
United States 161 247 464 161 437 11 20 41 11 21 25 263 316 25 240New England 6 12 31 6 25 — 1 4 — — — 7 21 — 13
Connecticut — 5 20 — 15 — 0 2 — — — 0 12 — —Maine 4 2 8 4 1 — 0 1 — — — 0 2 — 1Massachusetts — 0 3 — 1 — 0 2 — — — 5 10 — 9New Hampshire — 1 8 — 4 — 0 1 — — — 0 3 — —Rhode Island — 1 6 — 4 — 0 1 — — — 0 7 — 3Vermont 2 1 6 2 — — 0 2 — — — 0 2 — —
Mid. Atlantic 14 15 47 14 34 — 1 9 — — 3 30 53 3 41New Jersey 2 0 6 2 — — 0 0 — — — 4 13 — 3New York (Upstate) 5 1 30 5 1 — 1 6 — — 1 4 9 1 3New York City 7 12 33 7 33 — 0 9 — — — 14 30 — 30Pennsylvania N 0 0 N N N 0 0 N N 2 6 16 2 5
E.N. Central 53 61 123 53 100 3 3 10 3 3 — 30 47 — 27Illinois N 0 0 N N — 0 0 — — — 11 24 — 14Indiana — 14 36 — 23 — 1 4 — 1 — 3 8 — 3Michigan 6 13 26 6 22 — 0 3 — 1 — 5 12 — 7Ohio 41 27 44 41 44 3 2 7 3 1 — 8 17 — 3Wisconsin 6 8 24 6 11 — 0 3 — — — 1 5 — —
W.N. Central 5 2 28 5 4 — 0 2 — 1 — 6 13 — 9Iowa N 0 0 N N N 0 0 N N — 0 3 — —Kansas N 0 0 N N N 0 0 N N — 0 4 — —Minnesota — 0 0 — — — 0 0 — — — 2 8 — 6Missouri N 0 0 N N — 0 0 — — — 2 6 — 3Nebraska 5 2 9 5 4 — 0 2 — 1 — 0 2 — —North Dakota — 0 25 — — — 0 1 — — — 0 1 — —South Dakota N 0 0 N N — 0 0 — — — 0 0 — —
S. Atlantic 58 65 157 58 145 4 6 15 4 8 18 68 100 18 55Delaware 1 1 5 1 3 — 0 0 — — — 0 4 — —District of Columbia — 1 5 — — — 0 1 — — 2 3 8 2 3Florida 24 21 64 24 64 2 3 8 2 3 1 23 36 1 28Georgia 14 19 44 14 44 2 2 5 2 3 4 14 31 4 4Maryland 9 9 33 9 25 — 1 3 — 2 — 8 20 — 3North Carolina N 0 0 N N N 0 0 N N 9 8 21 9 9South Carolina 10 8 25 10 9 — 0 3 — — — 4 11 — 4Virginia N 0 0 N N — 0 0 — — 2 4 12 2 4West Virginia — 0 48 — — — 0 4 — — — 0 1 — —
E.S. Central 10 22 45 10 44 2 2 6 2 6 1 13 29 1 10Alabama N 0 0 N N N 0 0 N N — 4 11 — 4Kentucky — 4 12 — 11 — 0 3 — 3 — 2 8 — —Mississippi N 0 0 N N — 0 0 — — — 3 14 — —Tennessee 10 18 37 10 33 2 1 4 2 3 1 5 11 1 6
W.S. Central 3 31 79 3 14 — 3 10 — — 2 36 50 2 31Arkansas 1 4 14 1 1 — 0 4 — — — 4 10 — 2Louisiana 1 2 11 1 8 — 0 2 — — 2 7 25 2 —Oklahoma N 0 0 N N — 0 0 — — — 1 6 — —Texas 1 24 75 1 5 — 2 9 — — — 23 37 — 29
Mountain 11 26 72 11 67 1 2 8 1 3 — 12 20 — 10Arizona 10 11 45 10 33 — 1 5 — 1 — 4 10 — 4Colorado — 8 23 — 21 — 0 4 — — — 2 6 — 1Idaho N 0 0 N N — 0 0 — — — 0 4 — —Montana N 0 0 N N N 0 0 N N — 0 1 — 1Nevada N 0 0 N N N 0 0 N N — 2 9 — 4New Mexico 1 4 12 1 6 1 0 2 1 — — 1 4 — —Utah — 1 8 — 6 — 0 3 — 2 — 0 2 — —Wyoming — 0 3 — 1 — 0 0 — — — 0 0 — —
Pacific 1 3 11 1 4 1 0 2 1 — 1 53 74 1 44Alaska 1 2 11 1 4 1 0 1 1 — — 0 2 — —California N 0 0 N N N 0 0 N N — 42 62 — 39Hawaii — 0 1 — — — 0 1 — — — 0 3 — —Oregon N 0 0 N N N 0 0 N N — 4 14 — 1Washington N 0 0 N N N 0 0 N N 1 5 11 1 4
TerritoriesAmerican Samoa N 0 0 N N — 0 0 — — — 0 0 — —C.N.M.I. — — — — — — — — — — — — — — —Guam — 0 0 — — — 0 0 — — — 0 0 — —Puerto Rico — 0 0 — — — 0 0 — — — 4 14 — 2U.S. Virgin Islands — 0 0 — — — 0 0 — — — 0 0 — —
C.N.M.I.: Commonwealth of Northern Mariana Islands.U: Unavailable. —: No reported cases. N: Not reportable. NN: Not Nationally Notifiable. Cum: Cumulative year-to-date counts. Med: Median. Max: Maximum.* Case counts for reporting year 2011 and 2012 are provisional and subject to change. For further information on interpretation of these data, see http://www.cdc.gov/osels/ph_surveillance/
nndss/phs/files/ProvisionalNationa%20NotifiableDiseasesSurveillanceData20100927.pdf. Data for TB are displayed in Table IV, which appears quarterly.† Includes drug resistant and susceptible cases of invasive Streptococcus pneumoniae disease among children <5 years and among all ages. Case definition: Isolation of S. pneumoniae from
a normally sterile body site (e.g., blood or cerebrospinal fluid).

Morbidity and Mortality Weekly Report
MMWR / January 13, 2012 / Vol. 61 / No. 1 ND-13
TABLE II. (Continued) Provisional cases of selected notifiable diseases, United States, weeks ending January 7, 2012, and January 8, 2011 (1st week)*
Reporting area
Varicella (chickenpox)
West Nile virus disease†
Neuroinvasive Nonneuroinvasive§
Current week
Previous 52 weeks Cum 2012
Cum 2011
Current week
Previous 52 weeks Cum 2012
Cum 2011
Current week
Previous 52 weeks Cum 2012
Cum 2011Med Max Med Max Med Max
United States 77 253 330 77 258 — 0 59 — — — 0 31 — —New England 4 23 50 4 39 — 0 3 — — — 0 1 — —
Connecticut — 5 16 — 7 — 0 2 — — — 0 1 — —Maine — 4 11 — 9 — 0 0 — — — 0 0 — —Massachusetts — 9 18 — 11 — 0 2 — — — 0 1 — —New Hampshire — 1 7 — 4 — 0 0 — — — 0 0 — —Rhode Island — 0 6 — 1 — 0 1 — — — 0 0 — —Vermont 4 1 9 4 7 — 0 1 — — — 0 0 — —
Mid. Atlantic 21 19 42 21 22 — 0 11 — — — 0 6 — —New Jersey 6 0 22 6 — — 0 1 — — — 0 2 — —New York (Upstate) N 0 0 N N — 0 5 — — — 0 4 — —New York City — 0 0 — — — 0 4 — — — 0 1 — —Pennsylvania 15 19 39 15 22 — 0 2 — — — 0 1 — —
E.N. Central 34 66 110 34 68 — 0 13 — — — 0 6 — —Illinois 4 17 33 4 14 — 0 6 — — — 0 5 — —Indiana 9 5 20 9 6 — 0 2 — — — 0 1 — —Michigan 2 19 44 2 23 — 0 7 — — — 0 1 — —Ohio 19 21 58 19 25 — 0 3 — — — 0 3 — —Wisconsin — 0 1 — — — 0 1 — — — 0 1 — —
W.N. Central 1 12 34 1 34 — 0 9 — — — 0 7 — —Iowa N 0 0 N N — 0 2 — — — 0 2 — —Kansas — 7 21 — 11 — 0 1 — — — 0 0 — —Minnesota — 0 1 — — — 0 1 — — — 0 1 — —Missouri — 3 23 — 23 — 0 2 — — — 0 2 — —Nebraska — 0 2 — — — 0 4 — — — 0 3 — —North Dakota — 0 7 — — — 0 1 — — — 0 1 — —South Dakota 1 1 6 1 — — 0 0 — — — 0 1 — —
S. Atlantic 8 32 66 8 16 — 0 10 — — — 0 5 — —Delaware — 0 2 — — — 0 1 — — — 0 0 — —District of Columbia — 0 2 — — — 0 3 — — — 0 3 — —Florida 8 17 42 8 4 — 0 5 — — — 0 2 — —Georgia N 0 0 N N — 0 2 — — — 0 1 — —Maryland N 0 0 N N — 0 5 — — — 0 3 — —North Carolina N 0 0 N N — 0 1 — — — 0 0 — —South Carolina — 0 9 — — — 0 0 — — — 0 0 — —Virginia — 8 26 — 5 — 0 2 — — — 0 0 — —West Virginia — 6 32 — 7 — 0 1 — — — 0 0 — —
E.S. Central 2 5 15 2 10 — 0 11 — — — 0 5 — —Alabama 2 5 14 2 9 — 0 2 — — — 0 0 — —Kentucky N 0 0 N N — 0 2 — — — 0 1 — —Mississippi — 0 2 — 1 — 0 5 — — — 0 4 — —Tennessee N 0 0 N N — 0 3 — — — 0 1 — —
W.S. Central — 50 136 — 12 — 0 4 — — — 0 3 — —Arkansas — 5 20 — 1 — 0 1 — — — 0 0 — —Louisiana — 1 6 — 2 — 0 1 — — — 0 2 — —Oklahoma N 0 0 N N — 0 1 — — — 0 0 — —Texas — 43 131 — 9 — 0 3 — — — 0 3 — —
Mountain 7 18 65 7 52 — 0 10 — — — 0 5 — —Arizona — 4 50 — 13 — 0 6 — — — 0 4 — —Colorado 7 4 31 7 6 — 0 2 — — — 0 2 — —Idaho N 0 0 N N — 0 1 — — — 0 1 — —Montana — 2 28 — 28 — 0 1 — — — 0 0 — —Nevada N 0 0 N N — 0 4 — — — 0 2 — —New Mexico — 1 4 — 2 — 0 1 — — — 0 0 — —Utah — 3 26 — 3 — 0 1 — — — 0 1 — —Wyoming — 0 1 — — — 0 1 — — — 0 1 — —
Pacific — 3 9 — 5 — 0 18 — — — 0 7 — —Alaska — 1 4 — 3 — 0 0 — — — 0 0 — —California — 0 4 — 1 — 0 18 — — — 0 7 — —Hawaii — 1 4 — 1 — 0 0 — — — 0 0 — —Oregon N 0 0 N N — 0 0 — — — 0 0 — —Washington N 0 0 N N — 0 0 — — — 0 0 — —
TerritoriesAmerican Samoa N 0 0 N N — 0 0 — — — 0 0 — —C.N.M.I. — — — — — — — — — — — — — — —Guam — 2 4 — — — 0 0 — — — 0 0 — —Puerto Rico — 3 10 — — — 0 0 — — — 0 0 — —U.S. Virgin Islands — 0 0 — — — 0 0 — — — 0 0 — —
C.N.M.I.: Commonwealth of Northern Mariana Islands.U: Unavailable. —: No reported cases. N: Not reportable. NN: Not Nationally Notifiable. Cum: Cumulative year-to-date counts. Med: Median. Max: Maximum.* Case counts for reporting year 2011 and 2012 are provisional and subject to change. For further information on interpretation of these data, see http://www.cdc.gov/osels/ph_surveillance/
nndss/phs/files/ProvisionalNationa%20NotifiableDiseasesSurveillanceData20100927.pdf. Data for TB are displayed in Table IV, which appears quarterly.† Updated weekly from reports to the Division of Vector-Borne Infectious Diseases, National Center for Zoonotic, Vector-Borne, and Enteric Diseases (ArboNET Surveillance). Data for California
serogroup, eastern equine, Powassan, St. Louis, and western equine diseases are available in Table I.§ Not reportable in all states. Data from states where the condition is not reportable are excluded from this table, except starting in 2007 for the domestic arboviral diseases and influenza-
associated pediatric mortality, and in 2003 for SARS-CoV. Reporting exceptions are available at http://www.cdc.gov/ncphi/disss/nndss/phs/infdis.htm.
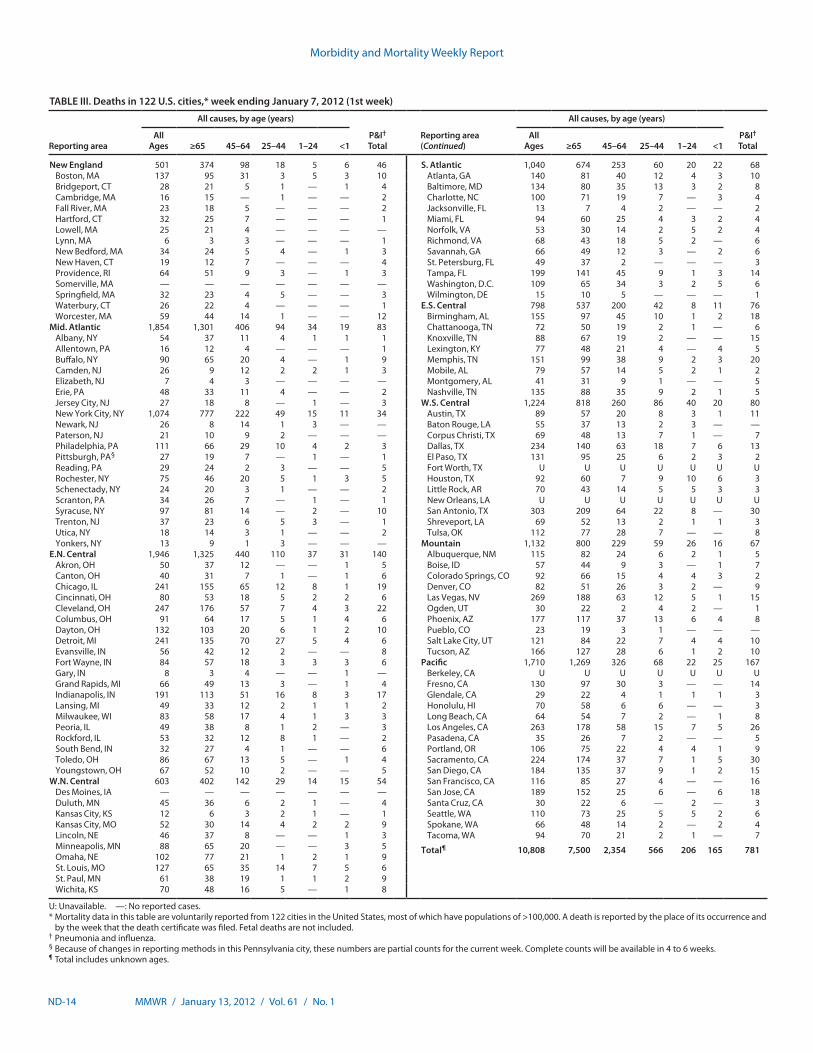
Morbidity and Mortality Weekly Report
ND-14 MMWR / January 13, 2012 / Vol. 61 / No. 1
TABLE III. Deaths in 122 U.S. cities,* week ending January 7, 2012 (1st week)
Reporting area
All causes, by age (years)
P&I† Total
Reporting area (Continued)
All causes, by age (years)
P&I† Total
All Ages ≥65 45–64 25–44 1–24 <1
All Ages ≥65 45–64 25–44 1–24 <1
New England 501 374 98 18 5 6 46 S. Atlantic 1,040 674 253 60 20 22 68Boston, MA 137 95 31 3 5 3 10 Atlanta, GA 140 81 40 12 4 3 10Bridgeport, CT 28 21 5 1 — 1 4 Baltimore, MD 134 80 35 13 3 2 8Cambridge, MA 16 15 — 1 — — 2 Charlotte, NC 100 71 19 7 — 3 4Fall River, MA 23 18 5 — — — 2 Jacksonville, FL 13 7 4 2 — — 2Hartford, CT 32 25 7 — — — 1 Miami, FL 94 60 25 4 3 2 4Lowell, MA 25 21 4 — — — — Norfolk, VA 53 30 14 2 5 2 4Lynn, MA 6 3 3 — — — 1 Richmond, VA 68 43 18 5 2 — 6New Bedford, MA 34 24 5 4 — 1 3 Savannah, GA 66 49 12 3 — 2 6New Haven, CT 19 12 7 — — — 4 St. Petersburg, FL 49 37 2 — — — 3Providence, RI 64 51 9 3 — 1 3 Tampa, FL 199 141 45 9 1 3 14Somerville, MA — — — — — — — Washington, D.C. 109 65 34 3 2 5 6Springfield, MA 32 23 4 5 — — 3 Wilmington, DE 15 10 5 — — — 1Waterbury, CT 26 22 4 — — — 1 E.S. Central 798 537 200 42 8 11 76Worcester, MA 59 44 14 1 — — 12 Birmingham, AL 155 97 45 10 1 2 18
Mid. Atlantic 1,854 1,301 406 94 34 19 83 Chattanooga, TN 72 50 19 2 1 — 6Albany, NY 54 37 11 4 1 1 1 Knoxville, TN 88 67 19 2 — — 15Allentown, PA 16 12 4 — — — 1 Lexington, KY 77 48 21 4 — 4 5Buffalo, NY 90 65 20 4 — 1 9 Memphis, TN 151 99 38 9 2 3 20Camden, NJ 26 9 12 2 2 1 3 Mobile, AL 79 57 14 5 2 1 2Elizabeth, NJ 7 4 3 — — — — Montgomery, AL 41 31 9 1 — — 5Erie, PA 48 33 11 4 — — 2 Nashville, TN 135 88 35 9 2 1 5Jersey City, NJ 27 18 8 — 1 — 3 W.S. Central 1,224 818 260 86 40 20 80New York City, NY 1,074 777 222 49 15 11 34 Austin, TX 89 57 20 8 3 1 11Newark, NJ 26 8 14 1 3 — — Baton Rouge, LA 55 37 13 2 3 — —Paterson, NJ 21 10 9 2 — — — Corpus Christi, TX 69 48 13 7 1 — 7Philadelphia, PA 111 66 29 10 4 2 3 Dallas, TX 234 140 63 18 7 6 13Pittsburgh, PA§ 27 19 7 — 1 — 1 El Paso, TX 131 95 25 6 2 3 2Reading, PA 29 24 2 3 — — 5 Fort Worth, TX U U U U U U URochester, NY 75 46 20 5 1 3 5 Houston, TX 92 60 7 9 10 6 3Schenectady, NY 24 20 3 1 — — 2 Little Rock, AR 70 43 14 5 5 3 3Scranton, PA 34 26 7 — 1 — 1 New Orleans, LA U U U U U U USyracuse, NY 97 81 14 — 2 — 10 San Antonio, TX 303 209 64 22 8 — 30Trenton, NJ 37 23 6 5 3 — 1 Shreveport, LA 69 52 13 2 1 1 3Utica, NY 18 14 3 1 — — 2 Tulsa, OK 112 77 28 7 — — 8Yonkers, NY 13 9 1 3 — — — Mountain 1,132 800 229 59 26 16 67
E.N. Central 1,946 1,325 440 110 37 31 140 Albuquerque, NM 115 82 24 6 2 1 5Akron, OH 50 37 12 — — 1 5 Boise, ID 57 44 9 3 — 1 7Canton, OH 40 31 7 1 — 1 6 Colorado Springs, CO 92 66 15 4 4 3 2Chicago, IL 241 155 65 12 8 1 19 Denver, CO 82 51 26 3 2 — 9Cincinnati, OH 80 53 18 5 2 2 6 Las Vegas, NV 269 188 63 12 5 1 15Cleveland, OH 247 176 57 7 4 3 22 Ogden, UT 30 22 2 4 2 — 1Columbus, OH 91 64 17 5 1 4 6 Phoenix, AZ 177 117 37 13 6 4 8Dayton, OH 132 103 20 6 1 2 10 Pueblo, CO 23 19 3 1 — — —Detroit, MI 241 135 70 27 5 4 6 Salt Lake City, UT 121 84 22 7 4 4 10Evansville, IN 56 42 12 2 — — 8 Tucson, AZ 166 127 28 6 1 2 10Fort Wayne, IN 84 57 18 3 3 3 6 Pacific 1,710 1,269 326 68 22 25 167Gary, IN 8 3 4 — — 1 — Berkeley, CA U U U U U U UGrand Rapids, MI 66 49 13 3 — 1 4 Fresno, CA 130 97 30 3 — — 14Indianapolis, IN 191 113 51 16 8 3 17 Glendale, CA 29 22 4 1 1 1 3Lansing, MI 49 33 12 2 1 1 2 Honolulu, HI 70 58 6 6 — — 3Milwaukee, WI 83 58 17 4 1 3 3 Long Beach, CA 64 54 7 2 — 1 8Peoria, IL 49 38 8 1 2 — 3 Los Angeles, CA 263 178 58 15 7 5 26Rockford, IL 53 32 12 8 1 — 2 Pasadena, CA 35 26 7 2 — — 5South Bend, IN 32 27 4 1 — — 6 Portland, OR 106 75 22 4 4 1 9Toledo, OH 86 67 13 5 — 1 4 Sacramento, CA 224 174 37 7 1 5 30Youngstown, OH 67 52 10 2 — — 5 San Diego, CA 184 135 37 9 1 2 15
W.N. Central 603 402 142 29 14 15 54 San Francisco, CA 116 85 27 4 — — 16Des Moines, IA — — — — — — — San Jose, CA 189 152 25 6 — 6 18Duluth, MN 45 36 6 2 1 — 4 Santa Cruz, CA 30 22 6 — 2 — 3Kansas City, KS 12 6 3 2 1 — 1 Seattle, WA 110 73 25 5 5 2 6Kansas City, MO 52 30 14 4 2 2 9 Spokane, WA 66 48 14 2 — 2 4Lincoln, NE 46 37 8 — — 1 3 Tacoma, WA 94 70 21 2 1 — 7Minneapolis, MN 88 65 20 — — 3 5 Total¶ 10,808 7,500 2,354 566 206 165 781Omaha, NE 102 77 21 1 2 1 9St. Louis, MO 127 65 35 14 7 5 6St. Paul, MN 61 38 19 1 1 2 9Wichita, KS 70 48 16 5 — 1 8
U: Unavailable. —: No reported cases.* Mortality data in this table are voluntarily reported from 122 cities in the United States, most of which have populations of >100,000. A death is reported by the place of its occurrence and
by the week that the death certificate was filed. Fetal deaths are not included.† Pneumonia and influenza.§ Because of changes in reporting methods in this Pennsylvania city, these numbers are partial counts for the current week. Complete counts will be available in 4 to 6 weeks.¶ Total includes unknown ages.

Morbidity and Mortality Weekly Report
MMWR / January 13, 2012 / Vol. 61 / No. 1 ND-15
TABLE IV. Provisional cases of selected notifiable disease, United States, 4th quarter ending December 31, 2011 (52nd week)
Reporting area
Tuberculosis*
Current quarter
Previous 4 quarters
Cum 2012 Cum 2011Min Max
United States 1,973 1,973 2,571 8,860 11,025New England 64 60 81 281 352
Connecticut — 0 24 40 80Maine 1 1 3 8 8Massachusetts 52 41 52 191 223New Hampshire 1 1 5 10 10Rhode Island 5 5 8 24 26Vermont 5 0 5 8 5
Mid. Atlantic 333 305 370 1,357 1,536New Jersey 89 47 94 320 405New York (Upstate) 63 43 63 200 243New York City 154 151 168 625 647Pennsylvania 27 27 63 212 241
E.N. Central 138 138 205 726 873Illinois 52 52 97 324 367Indiana 28 17 28 100 90Michigan 15 15 39 113 171Ohio 26 26 35 120 190Wisconsin 17 10 23 69 55
W.N. Central 44 44 68 215 320Iowa — 0 9 21 47Kansas — 0 12 19 46Minnesota 42 19 42 129 135Missouri 2 2 7 21 38Nebraska — 0 6 15 27North Dakota — 0 0 — 12South Dakota — 0 5 10 15
S. Atlantic 405 405 522 1,828 2,261Delaware 6 4 6 20 21District of Columbia 13 11 17 53 43Florida 126 126 191 663 834Georgia 77 77 95 338 412Maryland 62 49 62 230 220North Carolina 10 10 76 180 295South Carolina 44 16 44 124 153Virginia 64 21 66 208 268West Virginia 3 2 4 12 15
E.S. Central 89 89 135 434 545Alabama 41 30 46 161 146Kentucky 11 4 28 48 90Mississippi 5 5 23 70 116Tennessee 32 32 44 155 193
W.S. Central 166 166 347 1,083 1,747Arkansas 29 11 29 82 78Louisiana 71 13 71 157 200Oklahoma 10 10 27 74 84Texas 56 56 269 770 1,385
Mountain 97 54 174 433 565Arizona 52 6 88 194 282Colorado 20 10 20 68 71Idaho 5 1 5 11 15Montana — 0 4 6 6Nevada 4 4 39 75 114New Mexico 13 9 13 45 50Utah 3 3 12 31 20Wyoming — 0 2 3 7
Pacific 637 553 679 2,503 2,826Alaska 16 11 16 55 56California 528 446 553 2,065 2,327Hawaii 34 25 34 117 115Oregon 14 13 25 69 87Washington 45 45 59 197 241
TerritoriesAmerican Samoa — 0 1 1 3C.N.M.I. — 0 10 17 32Guam — 0 0 — 101Puerto Rico 8 8 13 44 80U.S. Virgin Islands — 0 0 — —
C.N.M.I.: Commonwealth of Northern Mariana Islands.U: Unavailable. —: No reported cases. N: Not reportable. NN: Not Nationally Notifiable. Cum: Cumulative year-to-date counts. Med: Median. Max: Maximum.* Case counts for reporting year 2011 and 2012 are provisional and subject to change. For further information on interpretation of these data, see http://www.cdc.gov/osels/ph_surveillance/
nndss/phs/files/ProvisionalNationa%20NotifiableDiseasesSurveillanceData20100927.pdf. Data for TB are displayed quarterly.

U.S. Government Printing Office: 2012-523-043/21099 Region IV ISSN: 0149-2195
The Morbidity and Mortality Weekly Report (MMWR) Series is prepared by the Centers for Disease Control and Prevention (CDC) and is available free of charge in electronic format. To receive an electronic copy each week, visit MMWR’s free subscription page at http://www.cdc.gov/mmwr/mmwrsubscribe.html. Paper copy subscriptions are available through the Superintendent of Documents, U.S. Government Printing Office, Washington, DC 20402; telephone 202-512-1800.
Data presented by the Notifiable Disease Data Team and 122 Cities Mortality Data Team in the weekly MMWR are provisional, based on weekly reports to CDC by state health departments. Address all inquiries about the MMWR Series, including material to be considered for publication, to Editor, MMWR Series, Mailstop E-90, CDC, 1600 Clifton Rd., N.E., Atlanta, GA 30333 or to [email protected].
All material in the MMWR Series is in the public domain and may be used and reprinted without permission; citation as to source, however, is appreciated.
Use of trade names and commercial sources is for identification only and does not imply endorsement by the U.S. Department of Health and Human Services.
References to non-CDC sites on the Internet are provided as a service to MMWR readers and do not constitute or imply endorsement of these organizations or their programs by CDC or the U.S. Department of Health and Human Services. CDC is not responsible for the content of these sites. URL addresses listed in MMWR were current as of the date of publication.
Morbidity and Mortality Weekly Report