postgresql performance - theory and practice - pgconf philadelphia 2017
TRANSCRIPT

PostgreSQL PerformanceBaron Schwartz • July 2017

Introduction
Email me at [email protected] me @xaprbLinkedIn me while you still canI’ll post the slides later

What You’ll Learn From This Talk
• A clear definition of performance• How to measure and analyze performance with profiles• Types of performance problems and their solutions• Key Postgres performance instrumentation
What is Performance?

What is Performance?
There are two perspectives on performance.
• Users care about request performance.• Service owners care about serving the load with minimal
resources.
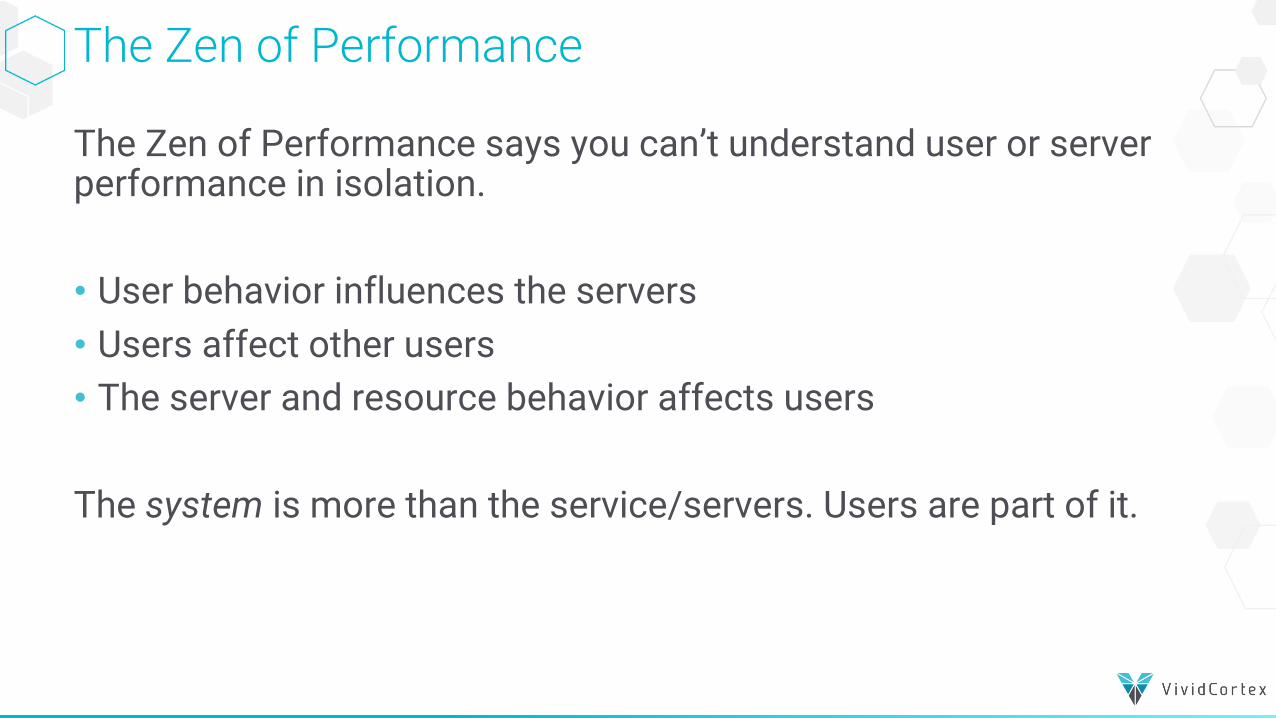
The Zen of Performance
The Zen of Performance says you can’t understand user or server performance in isolation.
• User behavior influences the servers• Users affect other users• The server and resource behavior affects users
The system is more than the service/servers. Users are part of it.

Learning By Testing Assumptions
• From a partial view of the system, you can often calculate the rest.• When you measure it instead, you find reconciliation errors.• You can learn a lot from this.

The User’s Perspective

What Do Users Want?
• Users care about request performance.• “I want my answer, and I want it fast.”
•How to measure it: latency• Also called response time and residence time• Users care about each individual request’s latency.• They care if latency is consistent.
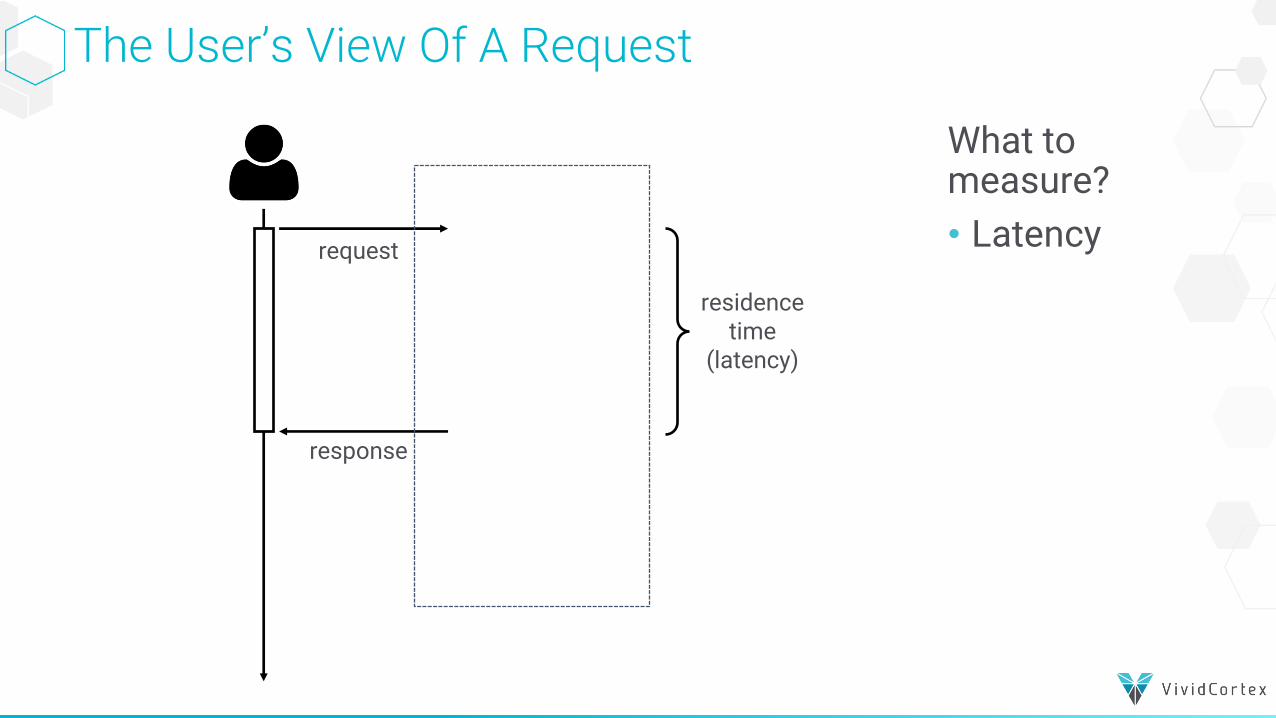
The User’s View Of A Request
request
response
residence time
(latency)
What to measure?• Latency

Users Care About Their Own Performance
• Performance, from the user’s point of view, is singular.• Users make one request at a time.
• Users don’t care about other users.• They don’t know about other users!• They don’t care about other users’ performance!
• They don’t care about the server!• To the user, the server/service is a black box that’s supposed to just work.

The Service Owner’s Perspective

What Does the Service Owner Want?
• Understanding server performance is harder than understanding request performance.•We can’t think about performance of requests in isolation.• We have to consider a system of requests and resources,
and how they interact.• Requests influence each other through contention for
shared resources.• The resulting behavior is complex, not simple.

The Secret Life Of A Request
request
queue server
response
queue time
service time
residence time
(latency)
What to measure?• Latency• Queue time• Service time

The Secret Life Of Many Requests
queue server

The Secret Life Of Many Requests
queue server

How To Think About Performance

What is Performance? (Cont’d)
• Performance is the interaction of two parts of an intricate system.
• User’s perspective: request-focused.• Requests are the unit of work.• Definition: request latency, with units of seconds/request.
• Service owner’s perspective: resource-focused.• Resources are what does the work.• Definition: system throughput, with units of requests/second.
• Performance is both, simultaneously.• Notice that the definitions are inverses.

Many Things Aren’t Really Performance
• Performance is NOT what you’ve probably been told!• It isn’t CPU utilization. CPU is a resource, meant to be utilized!• It isn’t cache hit ratio.• It isn’t seq_scans or temp_files• It isn’t load average.• It isn’t the number of backends connected or deadlocks or...• It isn’t anything else, other than request latency or throughput.

A Clear Performance Definition Solves Problem #1
• The first challenge in solving performance problems is clearly identifying the problem.
• By understanding performance in terms of latency and throughput, you are already winning.
• Cache ratios, utilization, etc are all causes or effects of performance/behavior.• They might be a symptoms of a
performance problem.• But the symptom isn’t the problem itself.• Treating it as such causes false
correlations and other mistakes.

What’s a Performance Problem?
A performance problem is when...
a) A request has high latencyb) A service/server uses too many resources to produce throughput
That is literally it. Everything is one of these two.

How Can You Measure Performance?
• You cannot improve what you cannot measure.• As engineers, we must measure all requests, so every user has a
good experience.• The challenge is that we cannot inspect every request individually, so we
need to examine them in aggregates.• We can find poor performance by looking at these aggregates in
the right ways.

Aggregating Requests
queue server At request completion, record every fact we know about the request: timestamp T, count 1, latency N, queue time N, service time N, and other information (user, type, host...).
log
log
How To Analyze Performance With Profiles

Use Profiles To Analyze Requests
• Profiling is the most important performance analysis tool.• Profiling enables slice-and-dice drilldown into system behavior.• Profiling is ideally interactive and multi-dimensional.• As we’ll see later, I advocate profiling the server by queries.• Then, after identifying a query, profiling that query to figure out where it
spends its time.

A Profile Subdivides And Sorts The Whole
Name Rank Aggregate Time Aggregate CountSub-Item 1 1 932.1 401Sub-Item 2 2 67.8 892Sub-Item 3 3 32.0 11<The Rest> 612.9 1837

A Profile Subdivides And Sorts The Whole
Name Rank Aggregate Time Aggregate CountSub-Item 1 1 932.1 401Sub-Item 2 2 67.8 892Sub-Item 3 3 32.0 11<The Rest> 612.9 1837
Queries,Stages of Execution

How To Detect And Diagnose Performance Problems

Common Causes of Performance Problems
Performance problems happen because:
1. A request executes slowly2. A system receives too many requests3. An app/user makes useless requests
Each of these is easy to see if you’re measuring requests (queries).

Performance Troubleshooting FlowchartProfile
SUM(latency), sort
SUM(count)
Time-consuming, frequent?
Profile SUM(count),
sort SUM(latency)
No
Check for simple speedups (e.g.
indexes)
Yes
Frequent, slow?
Check for needless queries (e.g. N+1)
Yes
Profile SUM(count),
sort SUM(count)
Frequent, useless?
Check for “driver junk” (e.g. ping)
Yes
No
Done
No

Problem #1: Request Too Slow
• Requests that are too slow are spending too much time.• The solution is to measure where they spend their time.• It could be working (service time). What are the stages and timings?• Or it could be waiting (queue time)• You need to sub-profile the query to find out!
• This sounds too simple and obvious, but it’s rarely done.• Instead, people often jump to Google and “tuning the config...”
• If you know a request is slow but don’t have deep profiling?• You’ll have to use profiling tools that show a deeper level of visibility• Or you can guess, and either be lucky or wrong—which do you prefer?

Solution #1: Profile By Sum of Latency
• Profile requests to find the most time-consuming ones.• Rank by sum of latency.• This finds very fast but frequent ones, not just slow ones!
• Then sort by average latency.• This finds the slowest time-consuming queries• These are often the easiest to fix! (it’s harder to optimize fast ones)
• You’ll usually find queries with obvious problems:• queries that are missing indexes• queries that are spending time locked• queries that are doing complex computation

Problem #2: Too Many Requests
• A frequent anti-pattern is shipping lots of data over the network.• The N+1 pattern is an example:• Do 1 query to find something out• Do N queries to fetch N tuples matching the 1• Do the calculations in the app• It’s better to do a query in the DB instead!
• Another example is cacheable queries (repetitive, redundant)• Another is check, recheck, recheck...• “Running queries in the app” is usually better left to the DB.
Solution #2: Profile by Sum of Count
• This will rank the most frequent queries to the top.• As a second step, sort within these, by sum of latency.• This will rank the slowest ones (the worst frequent queries) first.
• The problem and solution are usually app-dependent and obvious.

Problem #3: Useless Requests
• Lots of useless requests happen in database drivers and ORMs• Examples:• Prepare a statement, but never execute it• Ping before every query (look-before-you-leap pattern)• Update data that might not exist, “just in case”• Reset connection settings constantly, or set to defaults
• These are obvious if you sort and rank by SUM(count).

Learning The Postgres Performance Instrumentation

PostgreSQL’s Performance Instrumentation
• The PostgreSQL slow query log• pg_stat_database and pg_stat_all_tables• pg_stat_activity• pg_stat_statements• Externally captured performance measurements
PostgreSQL’s Slow Query Log
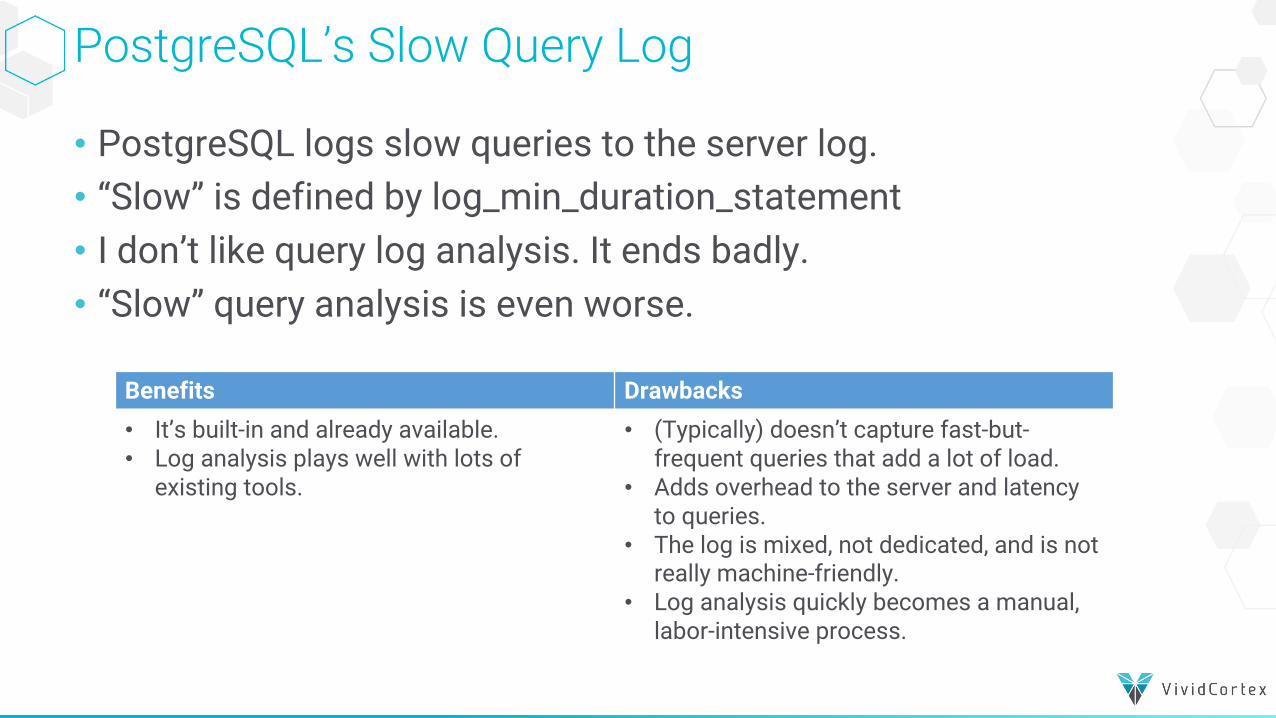
• PostgreSQL logs slow queries to the server log.• “Slow” is defined by log_min_duration_statement• I don’t like query log analysis. It ends badly.• “Slow” query analysis is even worse.
Benefits Drawbacks• It’s built-in and already available.• Log analysis plays well with lots of
existing tools.
• (Typically) doesn’t capture fast-but-frequent queries that add a lot of load.
• Adds overhead to the server and latency to queries.
• The log is mixed, not dedicated, and is not really machine-friendly.
• Log analysis quickly becomes a manual, labor-intensive process.

Enabling PostgreSQL’s Query Log
• Logging slow queries is off by default, so you have to enable it.• log_min_duration_statement = 0• log_duration = true• log_statement = all
• Whether to leave it enabled all the time is up for debate.• Enabling the log turns reads into writes.• Not enabling it allows you to develop performance problems you have no
capacity to diagnose.

Analyzing The Query Log
• The “standard” solution today is pgBadger.• Aggregates a log, produces a report on lots of stuff.• See a sample report at http://dalibo.github.io/pgbadger/samplev7.html
• Older tools include:• pgFouine: slow, messy to install, clunky to use• mk-query-digest: specifically focused on query profiling, fast, lean, no
dependencies

Cultural Considerations of Query Logging
• Modern teams are rapidly abandoning the old-skool DBA culture.• If you’re turning on logging, SCP’ing logs somewhere, analyzing
them, and emailing out the report... you’re probably going to be replaced by RDS.• Treat servers like cattle, not pets.• How can you run a platform, as an internal service, not babysit a
bunch of servers?• How can you enable developers to be more productive themselves?• If you can do this, and transition from “DBA” to “data engineer” you
will have a great career forever.

PostgreSQL’s pg_stat_activity
• This is a built-in, enabled-by-default aggregate of current connections and their activity.• It really has no “performance” data per se, other than current state
and how long since the last state change (state_change, wait_event_type, wait_event, state).
Benefits Drawbacks• It’s built-in.• Given enough “samples” from it,
you can guess at what statements spend some of their time doing
• Instantaneous, not cumulative• Like slow logs, this ends badly.• Doesn’t give accurate profiles.• Misses fast operations.

The pg_stat_bgwriter and pg_stat_database views
• Built-in, enabled-by-default aggregates, similar to pg_stat_activity• Similarly, very little performance data.• checkpoint_write/sync_time – but that’s for background activity• blk_read_time and blk_write_time – good, but what statements/queries
cause those activities?
Benefits Drawbacks• They’re built-in.• There’s timing and count data.
• Coarse granularity doesn’t lead you to a diagnosis of workload from user requests.

The pg_stat_all_tables and pg_statio_all_tablesviews• Built-in, enabled-by-default aggregate• No real performance data.• seq_scan – but ”seq_scan is bad” is superstition and only sometimes
leads to an accurate diagnosis, like “temp files are bad.”• idx_blks_read, ditto. “find indexes with most blocks read” isn’t the same as
“find out where all the time is being spent and what’s causing the load.”• False correlations are dangerous!
Benefits Drawbacks• It’s built-in. • No timing (performance) data.

Most PostgreSQL stats views are vanity metrics
• There is a lot of valuable information in the pg_stat_XXX views, but most of it is not performance data.• I cannot tell you how many times I’ve seen months wasted looking
at the wrong data just because “it’s the data I have available.”• It’s easy to measure the right data instead.

The pg_stat_statements extension
• An optional extension you have to install and enable.• To install & enable:• requires superuser or rds_superuser for Amazon RDS• shared_preload_libraries = pg_stat_statements• track_activity_query_size = 2048• pg_stat_statements.track = ALL
Benefits Drawbacks• It’s built-in.• Has timing data!• Is query/statement scoped!
• Only aggregate data• Statement “digest” is not ideal
(queryid)• Adds some overhead• Limited size, can ignore statements

Enable track_io_timing
• pg_stat_statements doesn’t track IO timing by default• To get some level of sub-profiling detail, enable track_io_timing• You’ll then get coarse-grained detail: where did the statement
spend its time? (reading/writing)• See blk_read_time and blk_write_time in pg_stat_statements

Warnings
• Ignore Fast Queries At Your Own Risk• The default behavior of only measuring slow queries is risky.• It ignores early warning signs of soon-to-be-serious problems.• By the time a frequent, bad query exceeds 100ms you’re in trouble.
• Fall In Love With Vanity Metrics At Your Own Risk• “This counter is large, what does it mean, could it be a problem?”• <Googles>• “Hmm, maybe I need to increase the widget cache size”• <Weeks Pass>• Remember the finger pointing at the moon!

Summary of Profiling in PostgreSQL

Remember: Ideally Profile By Task, Then Drill Down
• The ideal top-level method of profiling is a query profile• Aggregates per-queryid and ranks ”hot spot” at top
• Once you’ve identified queries of interest, then drill in• Use track_io_timing to get finer detail in pg_stat_statements• As a fall-back, look for operations that are typically expensive (i.e. blks_hit,
etc). But be very careful of false correlations and guesses.

PostgreSQL Has Limited Support For Profiling
• The server’s job is to serve requests, so ideally we measure them and profile them.• Happily, query profiling is possible in PostgreSQL via
pg_stat_statements.• You’ll have to install and enable the extension, and you should.

A Sample Query-Level Profile

External Profiling Options
• In addition to getting performance data from inside the server, you can measure it externally.• TCP packet capture and inspection is best. Two options:• VividCortex’s free sniffer tool
https://www.vividcortex.com/resources/topic/free-tools• VividCortex’s commercial product https://vividcortex.com
• Disadvantages:• Lacks some visibility into server internals that you get with
pg_stat_statements.• The corresponding advantage is that you can see individual statement
performance data, not just aggregate.

What About Application or Cluster Profiling?
• In real applications, you need to understand the entire data tier• This is infeasible with manual, server-by-server inspection• One option is APM tools, or application-level instrumentation• The problem is you get a visibility gap.• What the app thinks the database is doing is usually badly wrong.• ”Out-of-band” traffic to the database is vital to measure.• (Think Tableau, manual/adhoc queries, backups, cron jobs...)
• Most databases add more instrumentation as they mature; PostgreSQL is no exception. This is getting easier over time.

Conclusions

Conclusions
• Your servers are for doing useful work (requests), so measure it!• Performance is best defined in terms of requests and resources• Performance is about latency and throughput• Utilization, backlog, etc are second-order, derived metrics• Other things may be “vanity metrics” unless there’s a specific use.
• Get the full picture, but start with throughput and latency• Measure every single request, if you can; sampling = bias = trouble• Measure every one, but analyze aggregates / populations
• Profiling (aggregating, ranking, drilling down) is essential• Profiling by time is 90% of what’s needed 90% of the time• There’s some support for this in PostgreSQL, but not complete• Don’t fall in love with the data you have; get the data you need.

Thanks!
Email me anytime [email protected] me up @xaprb or linkedin.com/in/xaprb
My ebooks ^^^^ on performance theory:vividcortex.com/resources