postconsumer pet container recycling activity in...
TRANSCRIPT

1
Reporton
PostconsumerPETContainer
RecyclingActivity
in2015
October13,2016
www.plasticsrecycling.orgwww.napcor.com

Report on Postconsumer PET Container Recycling Activity in 2015
2
ACKNOWLEDGEMENTS
2015 marks the twenty first year that the National Association for PET Container Resources (NAPCOR) has issued this report, and the eleventh year that NAPCOR and The Association of Plastic Recyclers (APR) have worked together to produce it. This report would not be possible without the APR’s support and the cooperation of its members and NAPCOR’s. Information contained in this report was obtained through surveys conducted by HDR, Inc. and Moore Recycling Associates, and from data generated internally by NAPCOR. In order to present as accurate a picture of these activities as possible, additional data and information were obtained through discussions with individual collectors, intermediate processors, reclaimers, converters, brokers, exporters, importers, resin producers, bottle manufacturers, public recycling officials, consultants, and other key industry members. ABOUTTHESPONSORS
Founded in 1987, the National Association for PET Container Resources (NAPCOR) is the trade association for the PET plastic packaging industry in the United States, Canada and Mexico. NAPCOR is dedicated to promoting the PET package; to overcoming hurdles to the successful recycling of PET; and to communicating the attributes of the PET container as a sustainable package. More at www.napcor.com
The Association of Plastic Recyclers (APR) is the “Voice of Plastics RecyclingTM.” As the international trade association representing the plastics recycling industry, membership includes independent recycling companies of all sizes, processing numerous resins, as well as consumer product companies, equipment manufacturers, testing laboratories, organizations, and others committed to the success of plastics recycling. APR advocates the recycling of all plastics. Visit www.PlasticsRecycling.org for more information.

Report on Postconsumer PET Container Recycling Activity in 2015
3
SUMMARY
This report is intended to provide the reader with a detailed overview of the recycling of injection stretch blow molded polyethylene terephthalate (PET) bottles and jars in the United States (US) during 2015, and a general summary of the recycling of PET thermoforms.
In 2015, approximately 5,971 million pounds of PET bottles were sold into the
marketplace in the US. About 30.1 percent of those—1,797 million pounds—were collected through recycling programs and sold, either to domestic or foreign markets. PET reclaimers in the US supplemented those bottles collected in the US with imported materials and alternative feedstocks to process a total 1,548 million pounds of material. A variety of end users in the US, led by producers of fiber, consumed the clean RPET flake produced by US reclaimers, as well as imported RPET from Canada and other countries.
PET material flows in the US are depicted in Figure 1. This report uses color coding
to aid readers in following material flows throughout the report; a color reference guide is provided in Appendix A. Comparative historical data is provided in Appendix B. PETBOTTLESAVAILABLEFORCOLLECTION
The total weight of PET bottles and jars available in the United States for recycling in 2015 was 5,971 million pounds, a two percent increase over 2014. This number reflects the total amount of PET resin used by US bottle manufacturers from US, foreign, and recycled sources, with adjustments for scrap generated and not reused in bottles, exported bottles and pre-forms, and bottles less than eight ounces in size. This 5,971 million pounds serves as the denominator in this report to determine both the recycling and material utilization rates; it includes 379 million pounds of postconsumer PET recyclate.
Several market factors and trends affected the volume of PET bottles available for recycling collection in the US in 2015. Negative factors included continued weakness in carbonated soft drink sales, combined with some reductions in single-serving bottle sizes to provide market differentiation and meet consumer demands. Light-weighting of bottles continued to have an impact on some specialty beverage categories, but to a lesser extent than in previous years. On the positive growth side, there was some conversion into PET from other package types—both in food and beverage and non-food market segments—and bottled water sales continued to increase, as did specialty beverage categories such as energy and sports drinks, teas, and ready-to-drink coffees.

4
FIGURE1:PETMaterialFlowsintheUS(MMlbs)
USPETBottlesAvailable(5,971)
TotalUSBottlesRecycled(1,797)
PostconsumerBottleImports(82)(4,037)
Non-BottlePET(93)(4,037)
Export(424)(4,037)
US
ReclaimerPurchases(1,548)
CleanFlake*(1,044) RPETUsein
DomesticMarkets(1,421)
Disposal
CleanFlakeEquivalent(296)(4,037)
Fiber(535)(4,037)
Sheet&Film(347)(4,037)Strapping(106)(4,037)Food&BeverageBottles(350)(4,037)Non-FoodBottles(60)(4,037)Other(23)(4,037)
CanadianRPET(202)(4,037)
OtherImportedRPET(175)(4,037)
*ThistotalrepresentsallcleanflakesoldintoendmarketsbyUSreclaimers.Seefigure7fordetailontotalflakeproducedbyUSreclaimersfrombottles.

Report on Postconsumer PET Container Recycling Activity in 2015
5
POSTCONSUMERPETBOTTLEPURCHASES
The total amount, by weight, of
postconsumer PET bottles collected for recycling in the United States and sold to recycling markets in 2015 was 1,797 million pounds. The breakdown of this total, by purchaser, is as follows: TABLE1:RecyclingRateNumerator
This represents a 15 million pound, or one
percent, decrease in total volume of bottles collected as compared to 2014. Because the amount of bottles available for recycling increased in 2015, and the bottles collected decreased, the recycling rate dropped nearly one percent to 30.1.
The decrease in collection volumes in 2015
appears to be the result of a drop in PET collected at curbside. The amount of material collected through the California CRV (CA CRV) program increased, while PET collected in other state deposit programs decreased only slightly. The drop in deposit redemption (outside of California) probably results from the declining market share for carbonated soft drinks (CSD)—the predominant category in most state programs.
The slight decline in PET bottle recovery was
likely attributable to a number of factors. First, poor market conditions may have caused certain commercial collectors to reduce or eliminate recycling collections. Second, the continued
1,373 PurchasedbyUSReclaimers410 PurchasedbyExportMarkets14PETbottlecomponentofmixedbalesexported
1,797 TotalPostconsumerBottles(MMlbs)
PETThermoformRecycling
In2015,PETthermoformscollectedforrecyclingintheUSandCanadadroppedto88.5millionpounds,fromapeakofmorethan100millionin2014.Thedeclinewasprimarilyinexportedthermoforms.AslightdecreaseinUSreclaimerrecoveryofthermoformswasmorethanoffsetbyanincreaseinCanadianusage.
PETthermoformcollectionvolumesarenotincludedintherecyclingratepresentedinthisreport,orinthebottlevolumespurchased,butareincludedintotalreclaimerPETpurchases(page6)and“flakeproducedfromallsources”totalscitedonpage13.
ThedeclineinPETthermoformscollectedforrecyclingisattributabletopoorexportmarketsin2015.TheslightincreaseinuseofthesematerialsbyNorthAmericanreclaimersillustratesthattheworkofNAPCORanditspartnerstoworkthroughtechnicalconcernstodevelopthispromisingnewsourceofsupplycontinuestoreapbenefits.
Inlightofthisdata,NAPCORcontinuestoworktowarditsgoalofmakingPETthermoformsaseasytorecycleasbottles.WhilesomePETreclaimersareenthusiasticaboutincorporatingthisnewsourceofsupply,otherswillonlyacceptPETthermoformsfromhighqualitysupplierswhoutilizeauto-sortequipment,whilestillothersexcludePETthermoformsfromtheirincomingmaterialspecificationsaltogether.
Clearly,PETthermoformsaretechnicallyrecyclablewithPETbottles,however,notallthermoformsarePET.Giventhedifficultiesreclaimersfacewithrecentincreasesincontamination,thepotentialforincreasesin“look-alike”packages(e.g.,OPS,PVC,PETG,PLA),andnon-recyclablelabels,inksandadhesives,canputadamperonreclaimers’enthusiasmforincorporatingthisgrowingstream.In2016,NAPCORcontinuestoworktoaddresstheseconcernsandovercometheobstaclestobroad-scalePETthermoformrecycling.
RecyclingprogramsandMRFsinterestedinmarketingPETthermoformsshouldtalktotheirbuyersaboutmarketopportunities.Astheymovetoimplementprograms,itiscriticalthatcollectorsandprocessorsimplementbestpracticestominimizecontaminationandmaximizequality.

Report on Postconsumer PET Container Recycling Activity in 2015
6
impact of lightweighting, downsizing of single-serve beverage containers, and reductions in sales of CSD all could have impacted collection, as fewer CSD containers were available, and the bottles that were available were of lighter weight. Given the light weight of water bottles, the increase in their sales does not compensate for the loss of soft drink containers in the PET collection stream. Third, industry data suggests that light weight PET bottles are more likely to be lost or misdirected in a materials recovery facility (MRF), meaning that a portion of bottles that were separated for recycling may not have made it to the PET bale for sale to reclaimers.
United States reclaimers decreased their purchases of US bottles by 25 million
pounds, or 1.8 percent, as compared to 2014. Total US purchases accounted for 76 percent of all US bottles collected, just below the 77 percent reported in 2014. United States reclaimers also reported supplementing their domestic purchases by importing 82 million pounds of postconsumer bottles or dirty flake, predominantly from Canada, Mexico and Central and South America, a significant decrease as compared to the 177 million pounds imported in 2014. In addition to the bottle volumes as presented in Figure 2, domestic reclaimers reported buying 93 million pounds of alternative feedstock, which included postconsumer thermoforms, pre-consumer bottles, postconsumer strapping, and other unprocessed industrial scrap, a slight increase over the 85 million pounds purchased in 2014. In total, US reclaimers purchased 1,548 million pounds of PET scrap material.
FIGURE2:PostconsumerBottlesRecycled&UsedbyReclaimers
PostconsumerBottleImports
82
TotalUSPostconsumerBottlesRecycled
1,797
USPostconsumer
BottlesPurchasedbyExporters
424
TotalPostconsumerBottlesusedbyUSReclaimers
1,455
USPostconsumer
BottlesPurchasedbyUS
Reclaimers1,373
Report on Postconsumer PET Container Recycling Activity in 2015
7
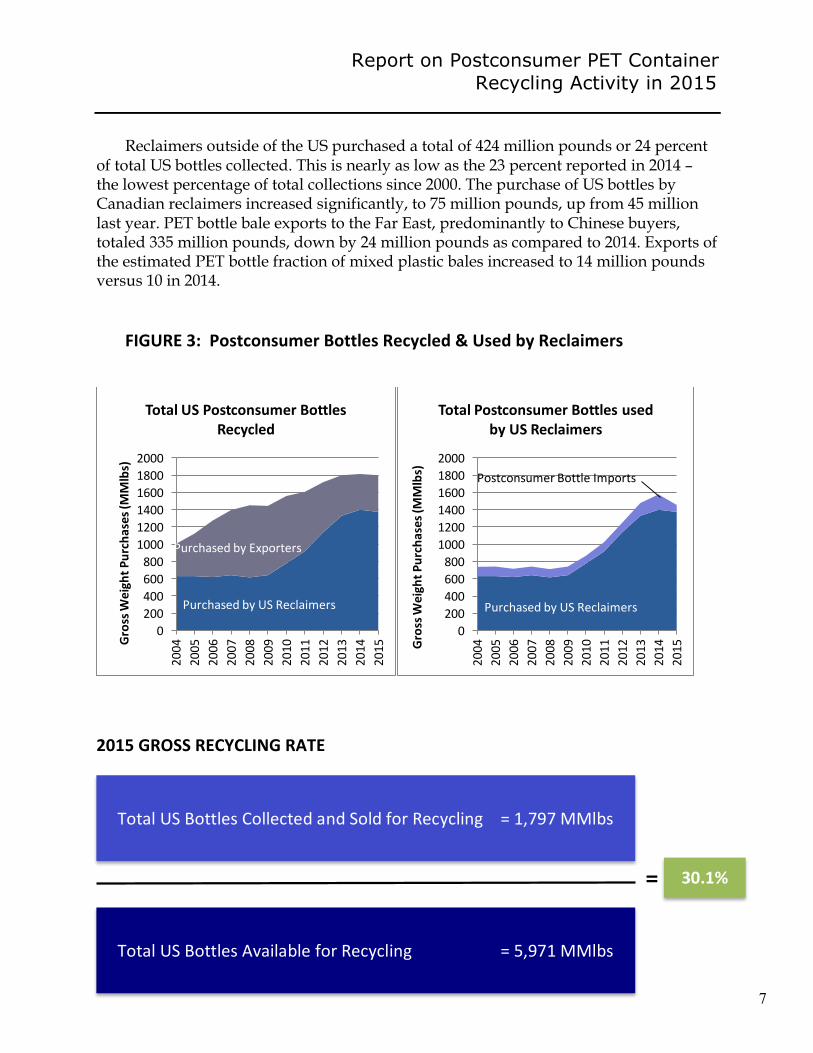
Reclaimers outside of the US purchased a total of 424 million pounds or 24 percent of total US bottles collected. This is nearly as low as the 23 percent reported in 2014 – the lowest percentage of total collections since 2000. The purchase of US bottles by Canadian reclaimers increased significantly, to 75 million pounds, up from 45 million last year. PET bottle bale exports to the Far East, predominantly to Chinese buyers, totaled 335 million pounds, down by 24 million pounds as compared to 2014. Exports of the estimated PET bottle fraction of mixed plastic bales increased to 14 million pounds versus 10 in 2014.
FIGURE3:PostconsumerBottlesRecycled&UsedbyReclaimers
2015GROSSRECYCLINGRATE
0200400600800100012001400160018002000
2004
2005
2006
2007
2008
2009
2010
2011
2012
2013
2014
2015G
rossW
eigh
tPurchases(M
Mlbs)
TotalUSPostconsumerBottlesRecycled
PurchasedbyExporters
PurchasedbyUSReclaimers
0200400600800100012001400160018002000
2004
2005
2006
2007
2008
2009
2010
2011
2012
2013
2014
2015GrossW
eigh
tPurchases(M
Mlbs)
TotalPostconsumerBottlesusedbyUSReclaimers
PurchasedbyUSReclaimers
PostconsumerBottleImports
= 31.0% 30.1%
TotalUSBottlesAvailableforRecycling =5,971MMlbs
TotalUSBottlesCollectedandSoldforRecycling =1,797MMlbs
Report on Postconsumer PET Container Recycling Activity in 2015
8
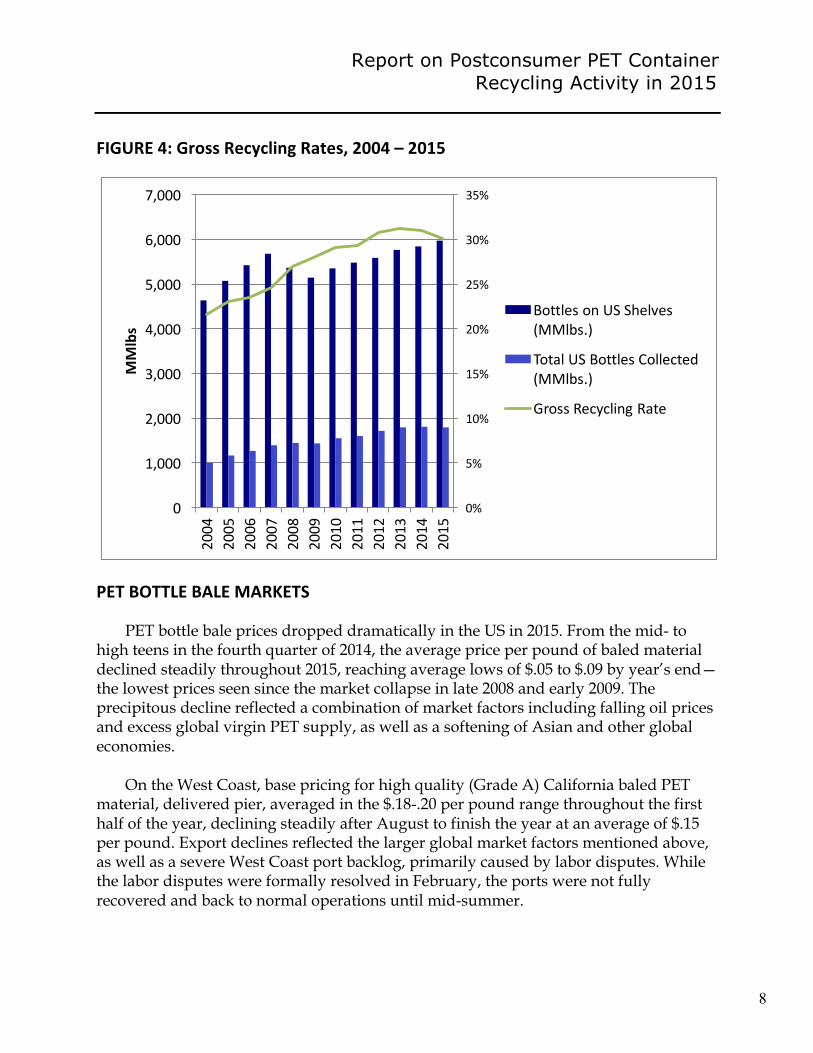
FIGURE4:GrossRecyclingRates,2004–2015
PETBOTTLEBALEMARKETS
PET bottle bale prices dropped dramatically in the US in 2015. From the mid- to high teens in the fourth quarter of 2014, the average price per pound of baled material declined steadily throughout 2015, reaching average lows of $.05 to $.09 by year’s end—the lowest prices seen since the market collapse in late 2008 and early 2009. The precipitous decline reflected a combination of market factors including falling oil prices and excess global virgin PET supply, as well as a softening of Asian and other global economies.
On the West Coast, base pricing for high quality (Grade A) California baled PET
material, delivered pier, averaged in the $.18-.20 per pound range throughout the first half of the year, declining steadily after August to finish the year at an average of $.15 per pound. Export declines reflected the larger global market factors mentioned above, as well as a severe West Coast port backlog, primarily caused by labor disputes. While the labor disputes were formally resolved in February, the ports were not fully recovered and back to normal operations until mid-summer.
0%
5%
10%
15%
20%
25%
30%
35%
0
1,000
2,000
3,000
4,000
5,000
6,000
7,0002004
2005
2006
2007
2008
2009
2010
2011
2012
2013
2014
2015
MMlbs
BottlesonUSShelves(MMlbs.)
TotalUSBottlesCollected(MMlbs.)
GrossRecyclingRate

Report on Postconsumer PET Container Recycling Activity in 2015
9
FIGURE5:EastCoast,Non-DepositPETBottleBalePrices(MonthlyAverageLow/HighRange-PickedUp,TruckloadQuantities,Seller’sDock)
RECLAMATIONCAPACITY A reclamation plant is defined as an operation that can take dirty postconsumer
plastic packaging and process it into a clean flake suitable for remanufacture; all known US operations are included in NAPCOR’s inventory regardless of size. At the beginning of 2015, there were 27 US PET reclamation plants in operation, with a combined annual capacity of 2,385 million pounds, gross weight input. By year’s end, there were 28 plants operating in the US with total annual nameplate capacity of up to 2,495 million pounds. These plants employ a wide range of technologies, with 14 of the 28 able to produce Food and Drug Administration (FDA) Letter of No Objection (LNO) direct-contact recyclate suitable for food and beverage packaging use.
The 2015 US reclaimer plant utilization rate—total throughput, based on the use of all PET feedstock, expressed as a percentage of total plant capacity—was approximately 62 percent in 2015, down from 2014’s 70 percent. This reflects plants that were semi-operational, shut down for retrofits or upgrades; and new plants or those that operated for only a portion of the year.
0.000.020.040.060.080.100.120.140.160.18
$/P
ound

Report on Postconsumer PET Container Recycling Activity in 2015
10
FIGURE6:ProductionofPETFlakefromBottles
FIGURE7:PRODUCTIONOFPETFLAKEFROMBOTTLES
0
200
400
600
800
1000
1200
1400
2004
2005
2006
2007
2008
2009
2010
2011
2012
2013
2014
2015
MMlbs
TotalCleanFlakeProducedfromUSBottles
CleanFlakeEquivalentfromUSBottlesExported
RPETProducedbyUSReclaimersfromUSBottles
0
200
400
600
800
1000
1200
1400
2004
2005
2006
2007
2008
2009
2010
2011
2012
2013
2014
2015
MMlbs
TotalRPETProductionfromUSReclaimers
TotalCleanFlakeProducedfromUSBottles
1,297
TotalUSReclaimerRPETProductionfrom
Bottles
1,070
CleanFlakeEquivalentfrom
USBottlesExported
296
RPETProducedbyUS
ReclaimersfromUSBottles
1,001
RPETProducedbyUSReclaimersfromImported
Bottles
69
RPETProducedbyUSReclaimersfromImportedBottles
RPETProducedbyUSReclaimersfromUSBottles

Report on Postconsumer PET Container Recycling Activity in 2015
11
PETUTILIZATIONRATE The PET utilization rate is determined by adding the amount of clean flake
produced by US reclaimers from US bottle material to the amount of clean flake expected to be produced from exported bottles; the sum is expressed as a percentage of total US bottles available for recycling. The PET utilization rate is an expression of system efficiency—how much usable end product (clean flake) reclaimers were able to produce from incoming material purchased. It is presented alongside the recycling rate, and accounts for processing waste and other yield loss (Figure 8).
It is important to note that material utilization rates are not a direct reflection of bale yields for a given calendar year for the following reasons. The report methodology uses survey-derived data of the aggregated amounts of recycled PET container material inputs, including both whole bottles and dirty flake, at the point of reclaimer purchase. Clean flake production is reported on the basis of flake produced in the calendar year. As a result, the utilization rate could reflect production from materials that were already in inventory as the year began. This appears to be a more significant factor in 2015 than it has been in the past. Alternatively, higher use of dirty flake, which contains fewer contaminants than bottle bales, can increase the utilization rate.
PETBottleMaterialUtilizationRate
NAPCOR also calculates United States reclaimers’ average production rates by
collection source—taking reported clean flake produced from US bottle material in three major collection categories as a percentage of reported incoming material purchased in that category. These rates were generally up in 2015, rising to 80 percent for deposit bottles and 70 percent for curbside material, with California CRV remaining at 2014’s 74 percent. However, the curbside utilization rate is likely overstated, due to certain reclaimers, for a variety of reasons, consuming bale inventory purchased in 2014 to produce flake in 2015 and not restocking with 2015 bales. Precisely for this sort of reason, collection method production rates are not true measures of bale yield.
As diagramed above, after applying estimated production rates to the export
fractions purchased, NAPCOR determined that the clean flake equivalent of the 424 million pounds of postconsumer PET bottles exported to all locations was 296 million
+CleanFlakeProducedbyUSReclaimersfrom=1,001MMlbsUSBottles
CleanFlakeEquivalentofUSBottlesExported, =296MMlbsCanadaandallother
÷+
TotalUSBottlesAvailablefor=5,971MMlbsRecycling
21.7% 1818.
1,297MMlbs= =

Report on Postconsumer PET Container Recycling Activity in 2015
12
pounds. Adding this to the total flake produced in the US from US bottles from all collection sources, the resulting PET utilization rate was 21.7 percent, roughly equivalent to the 21.6 percent reported in 2014, taking into account the elevated curbside flake production volumes previously mentioned. This year’s utilization rate marks no change to the trend observed over the last few years, and illustrated in Figure 8, in which we see a significant gap between the amount of PET postconsumer bottle material purchased by reclaimers (the recycling rate) and the amount of clean flake produced (the utilization rate). This continues to reflect multiple factors: non-PET contamination in curbside bales; the prevalence of smaller, lighter containers, requiring more processing per pound of material; and ongoing design for recyclability issues. Design for recyclability concerns include labels that are difficult-to-remove or separate from PET or block autosort function; barrier layers added to PET to preserve product integrity and extend shelf-life; and metal integrated into PET packages, whether in closures, closure rings, can tops, or pump springs. FIGURE8:PETRecycling&PETMaterialUtilizationRates
Poor PET bale quality, and the growing prevalence of hard-to-recycle packages,
particularly in curbside sources, continues to plague the reclaiming industry with high costs and operational challenges. In 2015, these pressures were exacerbated by challenging market conditions due to low virgin resin prices that put pressure on RPET markets and narrowed reclaimer margins.
0.0%
5.0%
10.0%
15.0%
20.0%
25.0%
30.0%
35.0%
2001
2002
2003
2004
2005
2006
2007
2008
2009
2010
2011
2012
2013
2014
2015
RecyclingRate
UtilizationRate

Report on Postconsumer PET Container Recycling Activity in 2015
13
2015RPETMARKET
Recycled PET use in domestic end markets remained robust, although combined end market totals reflected a nine percent decrease in 2015 as compared to 2014, with total converter consumption at 1,421 million pounds across all product categories (see Figure 9).1 This figure includes all material sources, with US and Canadian reclaimers and “upgraders” (companies that purchase dirty flake, have it toll washed, then pelletize or solid-state it for re-sale) supplying about 1,247 million pounds of flake and pellet produced from all sources of feedstock. The remaining 174 million pounds of recycled PET was imported from reclaimers in countries including Indonesia, Dominican Republic, Mexico, Peru, Ecuador and others in Central and South America. Not counted in these totals, United States and Canadian reclaimers also sold 50 million pounds of PET byproducts to secondary markets.
Looking at specific market segments, domestic Food & Beverage Bottle RPET usage held steady, with Non-Food Bottle usage up more than five percent, for a combined bottle total of 411 million pounds. Total recycled PET material used in all packaging applications—including both bottle and sheet—totaled 758 million pounds, down two percent as compared to 2014. While the domestic fiber industry is still vibrant, 2015’s low virgin resin prices and broad availability of low-cost, alternative streams such as post-industrial and off spec materials drove the more price sensitive RPET consumers in fiber markets to other feedstocks. Canadian recycled PET end-use markets are included in end use categories totals below. In Canada, RPET usage was up overall, with growth in Fiber, Bottle and Sheet categories.
1 Sincethe2009report,theRPETend-usedatareflectedinFigure9hasreflectedRPETconsumptionbyconvertersinboththeUSandCanada.

Report on Postconsumer PET Container Recycling Activity in 2015
14
FIGURE9:RPETusedbyProductCategory(MMlbs)
FIGURE10:RPETusedbyProductCategoryin2015(MMlbs)
0
200
400
600
800
1000
1200
1400
1600
2004
2005
2006
2007
2008
2009
2010
2011
2012
2013
2014
2015
Other
Non-FoodBottles
Food&BeverageBottles
Strapping
Sheet&Film
Fiber
38%
24%
7%
25%
4% 2%
Fiber
Sheet&Film
Strapping
Food&BeverageBottles
Non-FoodBottles
Other

Report on Postconsumer PET Container Recycling Activity in 2015
15
2015YEAR-ENDSUMMARY
The following summary highlights the key trends related to postconsumer PET recycling in 2015:
Demand for recycled PET was mixed: most end-use markets, including Sheet & Film, and Bottles, held their own, or saw slight decreases in 2015, while the fiber market—the largest end use of RPET—experienced a substantial decrease. Despite the fact that low virgin PET prices drove price sensitive consumers away from RPET, demand was still sufficient to support the domestic reclamation of most of the material collected in the US. This illustrates the resilience of the PET reclamation industry, as it was able to adapt to what some would describe as abysmal market conditions and continue to absorb the domestic supply of postconsumer bottles.
Supply quality and quantity remain major concerns: the high contamination levels and low bale yield rates reported by reclaimers in prior years persisted in 2015, particularly in curbside PET bales. With regard to quantity, 2015 saw a minor decrease in collection, resulting in a small reduction in the recycling rate. Following on the slight decrease in 2014, this appears to be a trend and one NAPCOR hopes to reverse. While some softness in end market demand may persist, domestic PET reclaimers can still absorb additional materials since they continue to meet a portion of their needs through imports and alternative feedstocks.
Thermoform packaging recycling domestically is stable: the decrease in the amount of thermoforms collected for recycling in 2015, as compared to 2014, corresponds to a reduction in exported thermoforms. Although the overall collection rate went down, the domestic utilization increased slightly, demonstrating that NAPCOR’s efforts, and those of its members and partners, to open recycled PET markets to thermoforms is bearing fruit. While including thermoforms in PET bottle bales is not yet acceptable to all reclaimers, an increasing number are adjusting their specifications to allow for a set percentage of PET thermoforms in bottle bales, or accepting thermoforms in bottle bales from good quality suppliers with auto-sort capabilities.

AppendixtoReportonPostconsumerPETContainerRecyclingActivityin2015
AppendixA–ColorReference
UsedinMaterialFlowDiagram
EndMarkets
USBottlesAvailableforRecycling(Denominator)
TotalUSBottlesRecycled(Numerator)
PostconsumerBottleImports
Non-BottlePETImports
USPostconsumerBottlesPurchasedbyExporters
TotalPostconsumerBottlesusedbyUSReclaimers
CleanFlakeEquivalentfromExports
CleanFlake*
CanadianRPET
OtherImportedRPET
RPETUseinDomesticMarkets
Disposal
Other
Fiber
Sheet&Film
Strapping
Food&BeverageBottles
Non-FoodBottles
Other
RPETProducedbyUSReclaimersfromUSBottles
TotalUSReclaimerRPETProductionfromBottles
USPostconsumerBottlesPurchasedbyUSReclaimers
TotalCleanFlakeProducedfromUSBottles
RPETProducedbyUSReclaimersfromImportedBottles
*ThistotalrepresentsallcleanflakesoldintoendmarketsbyUSreclaimers.Seefigure7fordetailontotalflakeproducedbyUSreclaimersfrombottles.

AppendixtoReportonPostconsumerPETContainerRecyclingActivityin2015
AppendixB–DataTables
TABLE2:PostconsumerBottlesRecycled/UsedbyReclaimersGrossWeightPurchases(MMlbs)
A. PurchasedbyUSReclaimers
B. PurchasedbyExporters*
C. TotalUSMaterialRecycled(A+B)
D. PostconsumerBottleImports
E. TotalPostconsumerBottlesusedbyUSReclaimers(A+D)
1995 1996 1997 1998 1999 2000 2001 2002 2003 2004 2005 2006 2007 2008 2009 2010 2011 2012 2013 2014 2015A. 605 549 580 656 588 599 600 522 520 631 681 619 641 615 642 776 916 1,135 1,329 1,398 1,373B. 170 148 111 89 183 170 234 275 321 372 489 653 755 836 802 781 688 582 469 414 424C. 775 697 691 745 771 769 834 797 841 1,003 1,170 1,272 1,396 1,451 1,444 1,557 1,604 1,718 1,798 1,812 1,797D. 46 87 66 101 60 69 70 57 62 106 109 97 100 98 98 89 106 114 149 177 82
E. 651 636 646 757 648 668 670 579 582 737 790 716 741 713 740 865 1,022 1,249 1,478 1,575 1,455
*Asof2005,thisnumberincludestheamountofPETsoldinmixedbottlebaleshipments.

AppendixtoReportonPostconsumerPETContainerRecyclingActivityin2015
TABLE3:GrossRecyclingRates,1995–2015
YearTotalUS
BottlesCollected(MMlbs)
BottlesonUSShelves(MMlbs)
GrossRecyclingRate
1995 775 1,950 39.7%1996 697 2,198 31.7%1997 691 2,551 27.1%1998 745 3,006 24.8%1999 771 3,250 23,7%2000 769 3,445 22.3%2001 834 3,768 22.1%2002 797 4,007 19.9%2003 841 4,292 19.6%2004 1,003 4,637 21.6%2005 1,170 5,075 23.1%2006 1,272 5,424 23.5%2007 1,396 5,683 24.6%2008 1,451 5,366 27.0%2009 1,444 5,149 28.0%2010 1,557 5,350 29.1%2011 1,604 5,478 29.3%2012 1,718 5,586 30.8%2013 1,798 5,764 31.2%2014 1,812 5,849 31.0%2015 1,797 5,971 30.1%

AppendixtoReportonPostconsumerPETContainerRecyclingActivityin2015
TABLE4:EastCoast,Non-DepositPETBottleBalePrices–AverageHigh/Low(PickedUp,TruckloadQuantities,Seller’sDock)
2015 LOW HIGH
JANUARY $0.13/pound $0.16/poundFEBRUARY 0.115 0.150MARCH 0.105 0.135APRIL 0.105 0.135MAY 0.105 0.135JUNE 0.110 0.140JULY 0.115 0.145AUGUST 0.110 0.135SEPTEMBER 0.090 0.120OCTOBER 0.050 0.090NOVEMBER 0.055 0.090DECEMBER 0.065 0.090DECEMBER 0.12 0.17

AppendixtoReportonPostconsumerPETContainerRecyclingActivityin2015
TABLE5:ProductionofPETFlakefromBottlesin2015RecycledPET(RPET)ProductionSummary(MMlbs)
A. RPETProducedbyUSReclaimersfromUSBottlesB. RPETProducedbyUSReclaimersfromImportedBottlesC. TotalRPETProductionUSReclaimers(A+B)D. CleanFlakeEquivalentfromUSBottlesExportedE. TotalCleanFlakeProducedfromBottlesinUS(A+D)
1995 1996 1997 1998 1999 2000 2001 2002 2003 2004 2005 2006 2007 2008 2009 2010 2011 2012 2013 2014 2015
A. 496 438 486 513 457 476 476 401 412 505 558 523 496 477 477 558 590 785 974 971 1,001B. 38 70 55 75 47 51 44 46 49 83 85 69 82 87 84 71 77 84 107 139 69
C. 534 508 541 588 504 527 520 447 461 588 643 592 578 564 561 629 667 869 1,081 1,110 1,070D. 153 134 92 75 154 143 184 212 255 298 401 529 583 647 601 557 462 396 327 291 296
E. 622 572 578 588 611 619 660 613 667 803 959 1,052 1,079 1,124 1,078 1,115 1,052 1,181 1,301 1,262 1,297
AppendixtoReportonPostconsumerPETContainerRecyclingActivityin2015
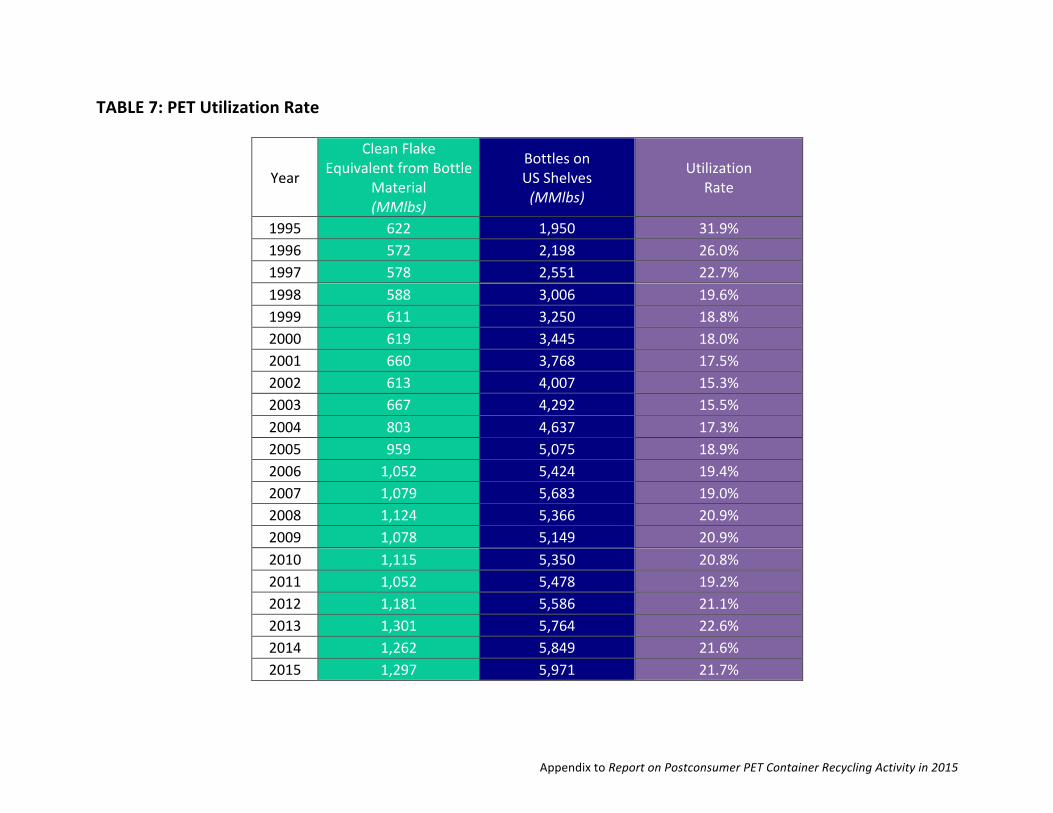
TABLE7:PETUtilizationRate
Year
CleanFlakeEquivalentfromBottle
Material(MMlbs)
BottlesonUSShelves(MMlbs)
UtilizationRate
1995 622 1,950 31.9%1996 572 2,198 26.0%1997 578 2,551 22.7%1998 588 3,006 19.6%1999 611 3,250 18.8%2000 619 3,445 18.0%2001 660 3,768 17.5%2002 613 4,007 15.3%2003 667 4,292 15.5%2004 803 4,637 17.3%2005 959 5,075 18.9%2006 1,052 5,424 19.4%2007 1,079 5,683 19.0%2008 1,124 5,366 20.9%2009 1,078 5,149 20.9%2010 1,115 5,350 20.8%2011 1,052 5,478 19.2%2012 1,181 5,586 21.1%2013 1,301 5,764 22.6%2014 1,262 5,849 21.6%2015 1,297 5,971 21.7%

AppendixtoReportonPostconsumerPETContainerRecyclingActivityin2015
TABLE8:RPETusedbyProductCategory(MMlbs)
ProductCategory 1996 1997 1998 1999 2000 2001 2002 2003 2004 2005 2006 2007 2008 2009 2010 20111 2012 20132 2014 2015
Fiber 292 320 415 417 452 435 344 296 479 463 422 383 391 344 381 398 512 558 638 535Sheet&Film 69 71 89 68 65 37 18 32 58 71 74 128 153 159 195 202 307 315 365 347Strapping 66 58 67 80 101 82 83 77 116 131 132 144 137 114 127 120 136 140 126 106
EngineeredResin 24 26 30 26 27 24 10 10 12 8 9 11 7 10 9 SeeOther
SeeOther
SeeOther
SeeOther
SeeOther
Food&BeverageBottles 24 41 52 68 54 77 86 106 126 115 139 136 141 203 216 242 276 425 351 350
Non-FoodBottles 71 53 47 50 40 44 43 24 63 63 49 60 55 65 58 57 50 50 57 60Other 1 1 7 9 5 2 4 7 24 13 30 38 31 42 16 21 31 25 27 23
TOTALCONVERTERCONSUMPTION
547
570
707
718
744
701
588
552
878
864
855
900
915
937
1,002
1,040
1,312
1,513
1,564
1,421
1 TheEngineeredResinscategorywasfoldedinto“Other”astherewasinsufficientsurveyresponseinthiscategorytomeetstandardconfidentialityguidelines. 2 TheFood&BeverageandNon-FoodBottlesconverterconsumptionvolumesplitsfor2013havebeencorrectedtoreflectadataerrordiscoveredin2014.Totalconverterconsumptionvolumefor2013wasnotaffected.