postal regulatory commission submitted 12/5/2019 11:38:16
TRANSCRIPT

Report 1
Adequacy of the Postal Service’s TFP Model
Final Report
March 27, 2017
Measuring Postal Service Efficiency
PRC Contract 109909-17-Q-0014
Northwest Postal Consulting for the
Postal Regulatory Commission
Postal Regulatory CommissionSubmitted 12/5/2019 11:38:16 AMFiling ID: 111262Accepted 12/5/2019
Measuring Postal Service Efficiency Final Report
Northwest Postal Consulting
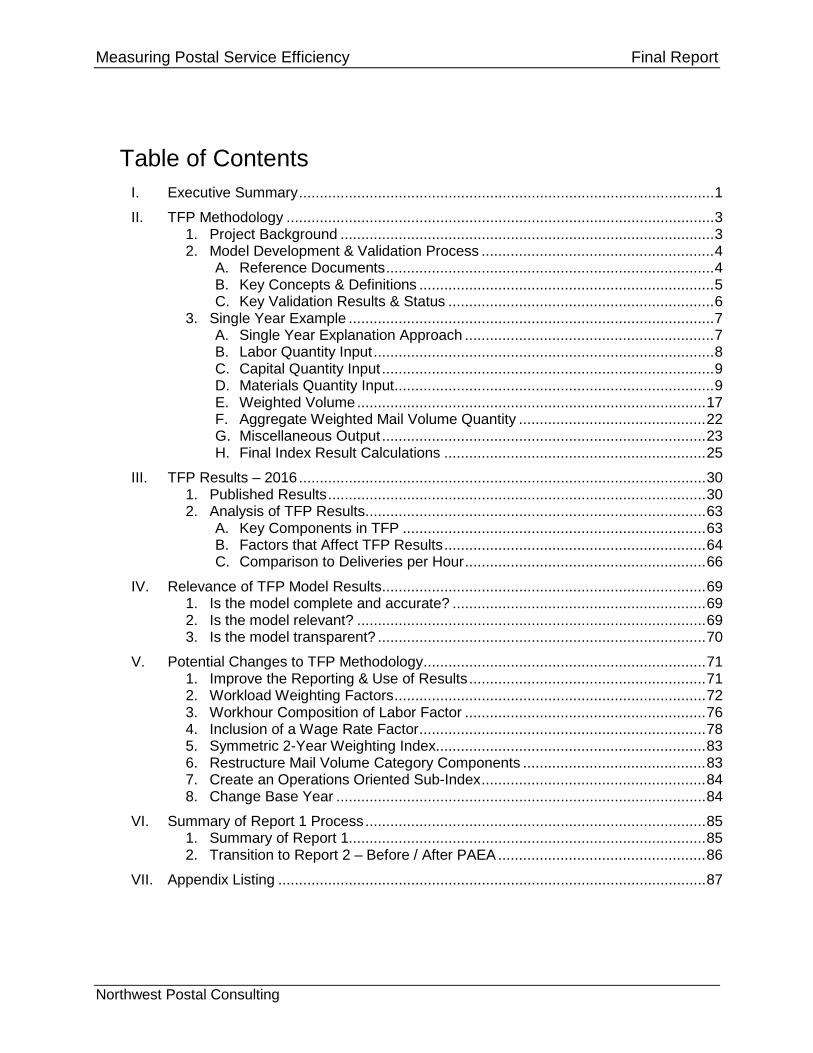
Table of Contents I. Executive Summary .................................................................................................... 1
II. TFP Methodology ....................................................................................................... 3 1. Project Background .......................................................................................... 3 2. Model Development & Validation Process ........................................................ 4
A. Reference Documents ............................................................................... 4 B. Key Concepts & Definitions ....................................................................... 5 C. Key Validation Results & Status ................................................................ 6
3. Single Year Example ........................................................................................ 7 A. Single Year Explanation Approach ............................................................ 7 B. Labor Quantity Input .................................................................................. 8 C. Capital Quantity Input ................................................................................ 9 D. Materials Quantity Input ............................................................................. 9 E. Weighted Volume .................................................................................... 17 F. Aggregate Weighted Mail Volume Quantity ............................................. 22 G. Miscellaneous Output .............................................................................. 23 H. Final Index Result Calculations ............................................................... 25
III. TFP Results – 2016 .................................................................................................. 30 1. Published Results ........................................................................................... 30 2. Analysis of TFP Results .................................................................................. 63
A. Key Components in TFP ......................................................................... 63 B. Factors that Affect TFP Results ............................................................... 64 C. Comparison to Deliveries per Hour .......................................................... 66
IV. Relevance of TFP Model Results .............................................................................. 69 1. Is the model complete and accurate? ............................................................. 69 2. Is the model relevant? .................................................................................... 69 3. Is the model transparent? ............................................................................... 70
V. Potential Changes to TFP Methodology .................................................................... 71 1. Improve the Reporting & Use of Results ......................................................... 71 2. Workload Weighting Factors ........................................................................... 72 3. Workhour Composition of Labor Factor .......................................................... 76 4. Inclusion of a Wage Rate Factor ..................................................................... 78 5. Symmetric 2-Year Weighting Index................................................................. 83 6. Restructure Mail Volume Category Components ............................................ 83 7. Create an Operations Oriented Sub-Index ...................................................... 84 8. Change Base Year ......................................................................................... 84
VI. Summary of Report 1 Process .................................................................................. 85 1. Summary of Report 1...................................................................................... 85 2. Transition to Report 2 – Before / After PAEA .................................................. 86
VII. Appendix Listing ....................................................................................................... 87

Measuring Postal Service Efficiency Final Report
Northwest Postal Consulting Page 1
I. Executive Summary
Northwest Postal Consulting (NWPC) is tasked with performing a two-part review of the U.S. Postal Service’s Total Factor Productivity (TFP) measurement. The first part is a review of how accurately TFP measures productivity in today’s environment. This includes an examination of any additional factors or methodology adjustments that might make TFP a more effective measurement. The second part of the review is to assess Postal Service efficiency over two distinct timelines, for the periods before PAEA and after PAEA. It will include an assessment of how well the Postal Service responded to revenue restrictions imposed by price caps as well as the impact of exogenous events.
Report 1 provides a detailed review of the methodology used to calculate TFP. TFP results have been calculated for the Postal Service by Christensen Associates since inception in the late 1980’s. There is very limited documentation explaining TFP in practical terms. The reports published by the Postal Service are a values-only Excel file. Individual tables in the report cover different time periods using TFP specific terminology that is not defined or explained. As a result, TFP is not understood beyond a general conceptual level. Yet, it is widely accepted as an overall measure of productivity for the Postal Service and reviewed in Annual Reports and special studies.
NWPC created an Excel-based TFP model to duplicate the methodology used by Christensen Associates to generate TFP. Over the years, the methodology has remained constant, while changes in mail classification, reporting systems, employee categories, transportation, and other factors required adjustments to the default formulas. NWPC determined that the methodology is accurate in calculations, adjustments were appropriate, and the results are valid. The only aspect to the methodology that introduces further discussion is the weighting value used to balance the workload between mail volume with possible deliveries.
NWPC restructured the published TFP reports to provide a functional format for analysis and modeling. These reports cover a period of 54 years of postal history, starting in 1963. These are presented in Appendix 1. These results are presented in graph form in this report. It is important to understand how TFP is structured to fully appreciate the wealth of information contained in the data and results. The first part of this report explains the methodology using a single year as an example. A detailed explanation of this single year example is included in Appendix 2.
TFP is a productivity measure, calculated by dividing the output, or Workload, by the input, or resources used. TFP Workload is comprised of Weighted Mail Volume, Miscellaneous Output, and Possible Deliveries. Input is comprised of Labor, Materials, and Capital. Each of these are combined into a single index value. Econometric principles are used to create these indexes. TFP results are shown in Figure 1.

Measuring Postal Service Efficiency Final Report
Northwest Postal Consulting Page 2
Figure 1: U.S. Postal Service Total Factor Productivity – 1963 to 2016
The results of the detailed review of the methodology led to three basic questions. These are discussed in detail in Section IV.
• Is the model complete and accurate? At this point, the answer is yes. It includes all aspects of inputs and outputs using an effective methodology.
• Is the model relevant? In short, the answer is yes. There is a surprising level of detail regarding different aspects of Labor, Capital, Materials, Mail Volume, and Possible Deliveries. TFP could provide much more value than the single number that is reported in a couple of paragraphs in an annual report.
• Is the Model transparent? The answer is no. TFP is generally accepted yet how it is calculated or what it really means is not widely understood.
In summary, the TFP methodology is relevant and valid. The current presentation is not relevant or transparent. The results are generally not used. The model results could be used to analyze the impact of strategic programs, management initiatives, and operational processes on productivity performance. A review of the weighting factor for mail volume and possible deliveries would be appropriate, leading to a better understanding of the impact of the delivery network growth.
This report is intended to set up the assessment of the Before and After PAEA periods. As such, the report reviews a number of methodology adjustments that might make TFP a more effective measurement. These are applied in Report 2 in parts of the productivity analysis in the Before and After PAEA periods.

Measuring Postal Service Efficiency Final Report
Northwest Postal Consulting Page 3
II. TFP Methodology Total Factor Productivity (TFP) is a widely accepted methodology for measuring broad productivity. The TFP methodology for the Postal Service was developed by Christensen Associates in the late 1980’s. It has been maintained by them over the years. The basic methodology has not changed since the original design. There have been appropriate adjustments to the methodology over the years as postal products and reporting methods have evolved.
The methodology used to calculate TFP involves a complex series of calculations. The published data and results are organized based on the evolving nature of mail classification, organizational structure, and data reporting systems. The data and results were reorganized to support this project. The result of this reorganization is presented as Appendix 1 - Published TFP Data & Results. Some additional results are added in these reports. For example, a historical wage rate report was added.
NWPC has developed an Excel based model to calculate TFP. The methodology used to calculate TFP is explained through a single year example using this model. This NWPC TFP Model validates the published result and makes it easier to understand the detailed methodology. This NWPC TFP Model also evaluates different methodology alternatives in a later section.
1. Project Background The PRC provides the best descriptions to set the background for the project in their Request for Proposal1 document:
• In the face of growing technological and other changes, the PRC believes that it is important to review the Postal Service’s TFP model and productivity measurements to ensure that they are reliable and accurate.
• The TFP model is an index of outputs (workload) to inputs (resource usage). The Postal Service’s main outputs are mail volumes handled and servicing the delivery network. Inputs include labor, capital and materials. Resources are weighted for each mail type according to its workload content which includes factors such as size, weight, mailer preparation, and modes of transportation used.
• In Report 1, the PRC seeks a thorough review of how accurately TFP measures changes in productivity in a network industry that has undergone significant technological changes and outsourcing (in the form of work- sharing).
• This review will include an examination of what, if any, additional factors should be included to improve the productivity measure.
1 Request for Proposal for Measuring Postal Service Productivity, November 15, 2016, pages 4-5.

Measuring Postal Service Efficiency Final Report
Northwest Postal Consulting Page 4
• The goal of Report 2 is to assess Postal Service efficiency improvements over two distinct timelines, prior to and after passage of the PAEA. The first timeline will be from FY 1991 through FY 2006. The second timeline will be from FY 2007 through FY 2016. The examination will decompose the TFP results to isolate how well the Postal Service responded to revenue restrictions imposed by the price caps as well as the exogenous events that occurred since the PAEA was passed.
2. Model Development & Validation Process A. Reference Documents NWPC has been using the following documents as source material on the TFP methodology. These are provided as Appendix 3.
1. The document “Electronic Attachment to Postal Service Response to MPA/USPS-T2-3.b, Formulas for Total Factor Productivity, Labor Productivity, Postal Inflation, and the Aggregate Labor Price Index” (PRC Filing ID: 68582, Accepted 6/23/2010) is in the PRC Library. This document provides a basis for understanding the TFP calculation methodology.
2. Memorandum from Christensen Associates, Introduction and Elimination of Inputs, January 30, 2017. This document explains the methodology used to adjust the default formulas when an input is added or removed to one of the components.
3. Memorandum from Christensen Associates, Further Explanation of Capital Input Calculations, January 30, 2017. This document explains the process used to calculate the Capital components of TFP.
4. Memorandum from Christensen Associates, Econometric Estimation of Network and Output Cost Elasticities, February 2, 2017. This document explains the methodology and history of the weighting used for creating the final Workload from Weighted Mail Volume, Miscellaneous Output, and Network (Possible Deliveries).
5. Memorandum from Christensen Associates, Impact of 2004 Accounting Change on TFP Tables, February 2, 2017. This document explains changes due to the switch from 4-week Accounting Periods to monthly reporting.
6. NWPC documented the TFP Validation process through a set of written questions that were answered by Christensen Associates. These are provided along with the supporting Excel reports.
A further reference, but not provided in Appendix 3, is an explanation of TFP as originally designed, but at a more conceptual level. It is the paper U.S. Postal Service Productivity: Measurement and Performance, Christensen, Christensen, Guy, and O’Hara, M.A. Crew and P.R. Kleindorfer, eds., Regulation and the Nature of Postal and Delivery Service, (Springer, 1993), pp. 237-259.
These documents were used to validate the TFP methodology through the development of an Excel model.

Measuring Postal Service Efficiency Final Report
Northwest Postal Consulting Page 5
B. Key Concepts & Definitions The following definitions are used in the TFP methodology.
1. Quantity: This is the result of the calculation of the chained value calculation process. It starts out with a seed or starting value in the base year. In general it is set to the pieces or cost for that base year. Typically, 1972 is used as the base year.
2. Value: This is used for the value of the component. It is usually dollar based, either in current dollars or indexed dollars to a base year.
3. Composition of Labor Factor: A component is used in the Labor quantity calculation to reflect the experience level of employees. In general, this becomes a proxy for the changes in wage rate based on the current mix of employees within a category.
4. Composition Hours: This is the actual workhours multiplied by the Composition Index. It is used in the Quantity calculation process instead of actual workhours.
5. Chained Value Index: This is the process using the Tornqvist Index methodology to calculate Quantity for labor occupation categories that have different types of employees. The value is based, in part, on the previous year’s quantity.
6. Base Year Index: This is the process that calculates Quantity based on a fixed base year, usually 1972. It is used for occupation categories that have a single type of employee.
7. Growth Rates: Growth rates are shown in the published reports. The Growth Rate is calculated using the natural logarithm formula rather the traditional percentage change over the previous year. The use of a logarithm formula allows the values for individual years to be added together directly to get the cumulative growth over multiple years.
8. Weighted Mail Volume: The result of the index calculation to combine the change in pieces with the share of the attributable cost for Mail Products and Classes.
9. Miscellaneous Output: The component of output from Ancillary Services, Special Services, Competitive Services, and Other Services.
10. Total Output: Total Output is the combination of the Weighted Mail Volume and the Miscellaneous Output.
11. Network: Network is the component of workload that represents the delivery network. It is the Possible Deliveries for the Postal Service.
12. Workload: Workload is the combination of the Total Output (weighted mail volume and Miscellaneous Output) and the Network (Possible Deliveries). It is the numerator in the general productivity equation.
13. Input: Input is the composite index of the Labor, Materials, and Capital components. It is the denominator in the productivity equation.
14. Total Factor Productivity (TFP): It is the Workload divided by the Input.
15. Labor Productivity Index: It is the Workload divided by the Aggregate Labor Index (instead of Input).
16. Postal Inflation Index: The index of the Resources Value (current dollars of Labor and materials, and value of Capital) divided by the Workload.

Measuring Postal Service Efficiency Final Report
Northwest Postal Consulting Page 6
C. Key Validation Results & Status The validation process has not identified any significant methodology or calculation concerns with the TFP results. Christensen Associates has made appropriate methodology changes and calculations adjustments over the approximately 27 years of TFP use. The following are the key results from the validation process:
1. The Labor Input model was almost identical to the published results.
2. In 2004, a change from 4-week Accounting Periods to Monthly accounting results in minor differences to published results. This change results in an ongoing minor adjustment of results in some categories.
3. In the published reports, a “Price” is calculated using the Value and the Quantity results. This is not used directly in the methodology and is provided to show the relationship between the two measures. In some cases, the calculated value differs from the published value for Price. This is related to the 2004 accounting method change. This does not impact model results.
4. The process for Capital involves a detailed methodology that is done on a quarterly basis. Our validation process did not involve a review of the capital methodology calculations. There is no reason to suspect any issues exist with the results from capital process.
5. For Mail Volume, in 2008, there were major changes in mail classification categories due to PAEA. The TFP model used this change to reset the Quantity baseline to 2008 pieces. Over the years, the quantity result for weighted mail volume diverges from the actual number of pieces. This can introduce distortion in results, as for some Mail Products, the Quantity equals the number of pieces. This results in a factor to make an adjustment to the final Workload. This appears to be an appropriate adjustment methodology. The actual calculation of the adjustment factor could not be verified.
6. The methodology for creating the International Quantity and the category “International and Other Mail” Quantity has a definition that changes several times since 2008. For example, Express Mail and Priority Mail were moved into the Other category in 2013 in the TFP tables. This is on example of the transparency issue discussed in the findings.
7. The weighting factor used to combine Weighted Mail Volume and Network (Possible Deliveries) changed in 2016. This is explained in the memorandum from Christensen Associates. This weighting factor has a major influence on the final TFP result. It is discussed in detail in the assessment of productivity in the Before and After PAEA periods.
The details of the validation process are documented in Appendix 3 through the written questions and responses from Christensen Associates.

Measuring Postal Service Efficiency Final Report
Northwest Postal Consulting Page 7
3. Single Year Example A detailed example is used to demonstrate the calculation of TFP for the year 2010. This year was picked to be representative of the process and issues in the TFP methodology. This example is provided as a separate Excel model that has formulas showing the actual calculation steps. A detailed explanation is provided to accompany the Excel model. The explanation document is summarized in this section. Appendix 2 provides the full detailed document.
A. Single Year Explanation Approach
This document uses the following approach to explaining the TFP methodology:
1. Source data is shown in the Excel file in a blue font.
2. Quantity is calculated as a chained value. Quantity is the term used for the result of the productivity calculation for a TFP component. The current year’s quantity is calculated based on the previous year’s quantity value. Accordingly, the example uses the 2009 quantity value as a given in showing the calculation methodology.
3. The chained calculation requires a starting, or seed, value to start the Quantity calculation. These seed values are shown in a blue highlight in the Excel file.
4. The structure shows all categories used throughout the 54 years of TFP data history (1963 through 2016). If a category is not used in 2009 or 2010, it is shaded. These are included to show the history of the categories used through the years.
5. In some cases, the calculation formulas result is different than the published TFP value. Generally, these are the result of an appropriate adjustment by Christensen Associates. These are shown in a pink highlight.
6. In some cases, an adjustment is made using a defined change to the default formula calculation. These adjustments are shown in an orange highlight.
7. Christensen Associates provided additional explanation of the adjustment process used where categories changed from one year to the next. This is provided in Appendix 3.
8. Some of the data used in TFP is Non-Public. This data is shown in green highlight. For the purposes of this document, these values are masked to allow this document to be shared beyond the Non-Public data restrictions.
9. There are changes in the categories and data structure over the 63 years of TFP historical data. This example shows all categories used over this period. Where a category was not active in 2009 or 2010, it is shown in the listing with the cells shaded out in the data section. This was done to provide a full listing of the categories used over the years.

Measuring Postal Service Efficiency Final Report
Northwest Postal Consulting Page 8
B. Labor Quantity Input The Labor Input uses both the Chained Value and the Base Year methodologies. These are combined to create an Aggregate Labor Quantity. It is a two-step process. The detailed steps are shown using the following figures of the Excel model example and calculation flow charts.
In general, a two-step process is used. The first step is to calculate the Quantity for each Occupation category. The following Occupation categories are used in TFP:
1. Postmasters 2. Supervisors 3. Clerks / Mail Handlers 4. City Carriers & Vehicle Service Drivers 5. Special Delivery 6. Rural Carriers 7. Maintenance Service 8. Vehicle Service 9. Professional, Technical & Administration 10. Other Personnel
Employee categories of full-time, part-time, and non-career are used for those occupations where the distinction is valid for productivity measurement purposes.
There are three data elements used in the Labor Quantity calculation:
1. Total Dollars: This is the total Salary & Benefits dollars.
2. Composition of Labor factor: This is a factor that is calculated in a separate process to represent employee experience. It is discussed in detail in a later section.
3. Hours: Workhours by employee category.
The Composition of Labor factor is multiplied by the Hours to get “Composition Hours”. This result is used in the Quantity result. The Tornqvist Index process is used to calculate the Quantity where there are multiple employee types within the occupation category. The following formula is used to calculate the quantity:
Π ( 𝐶𝐶𝐶𝐶𝐶𝐶𝐶 𝑌𝐶𝑌𝐶 𝐶𝐶𝐶𝐶𝐶𝐶𝐶𝐶𝐶𝐶𝐶 𝐻𝐶𝐶𝐶𝐶𝑃𝐶𝐶𝑃𝐶𝐶𝐶𝐶 𝑌𝐶𝑌𝐶 𝐶𝐶𝐶𝐶𝐶𝐶𝐶𝐶𝐶𝐶𝐶 𝐻𝐶𝐶𝐶𝐶
)(% 𝐶𝑌 𝐷𝐶𝐷𝐷𝑌𝐶𝐶+% 𝑃𝑌 𝐷𝐶𝐷𝐷𝑌𝐶𝐶)/2 X Previous Year Quantity
The formula calculates the ratio of composition hours of the current year to the previous year, raised to the power of the average percentage dollars for the category. This result is multiplied together for each of the employee categories, and then multiplied by the previous year’s quantity value. In the first year, generally 1972, the actual dollars for the year is used to start the chained calculation process. Where the Occupation category has only a single employee type, a base year methodology is used. It calculates the quantity by indexing the composition hours to the 1972 base year value.

Measuring Postal Service Efficiency Final Report
Northwest Postal Consulting Page 9
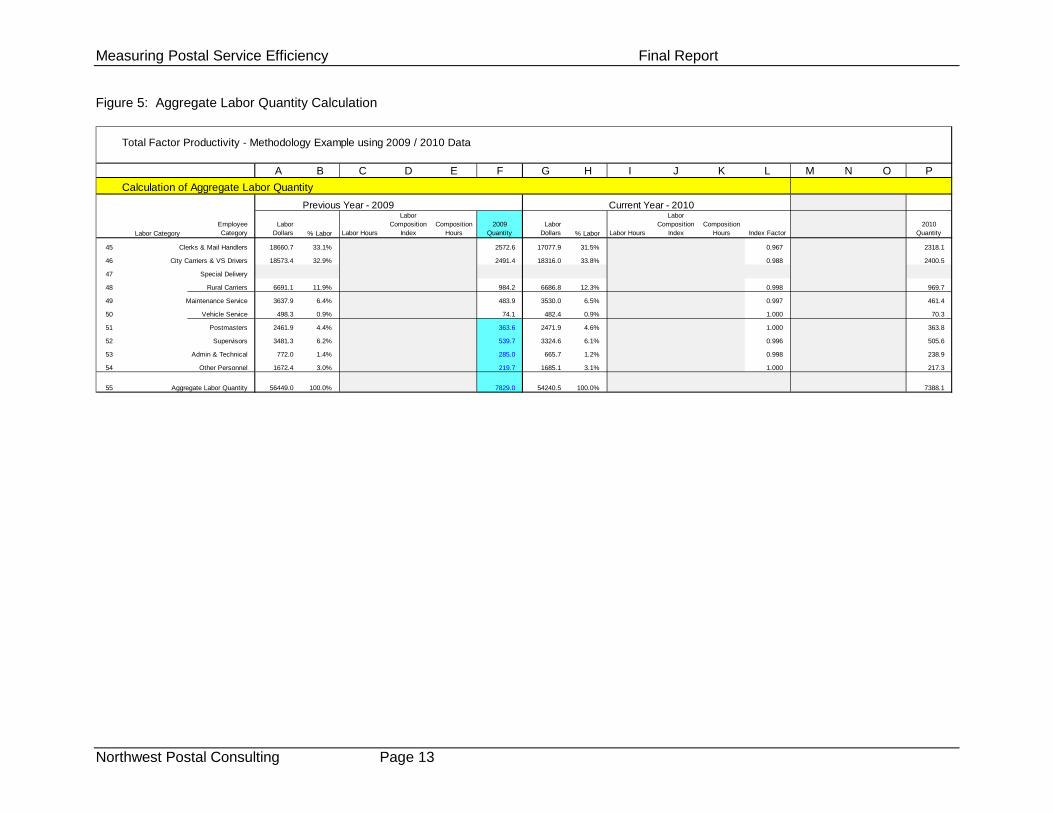
The second step is to aggregate the Quantity results from the first step into a single Labor Quantity result. It uses the same Tornqvist Index process to calculate the index value for each, then multiplies them together, and then multiplies that result by the previous year’s Aggregate Labor Quantity.
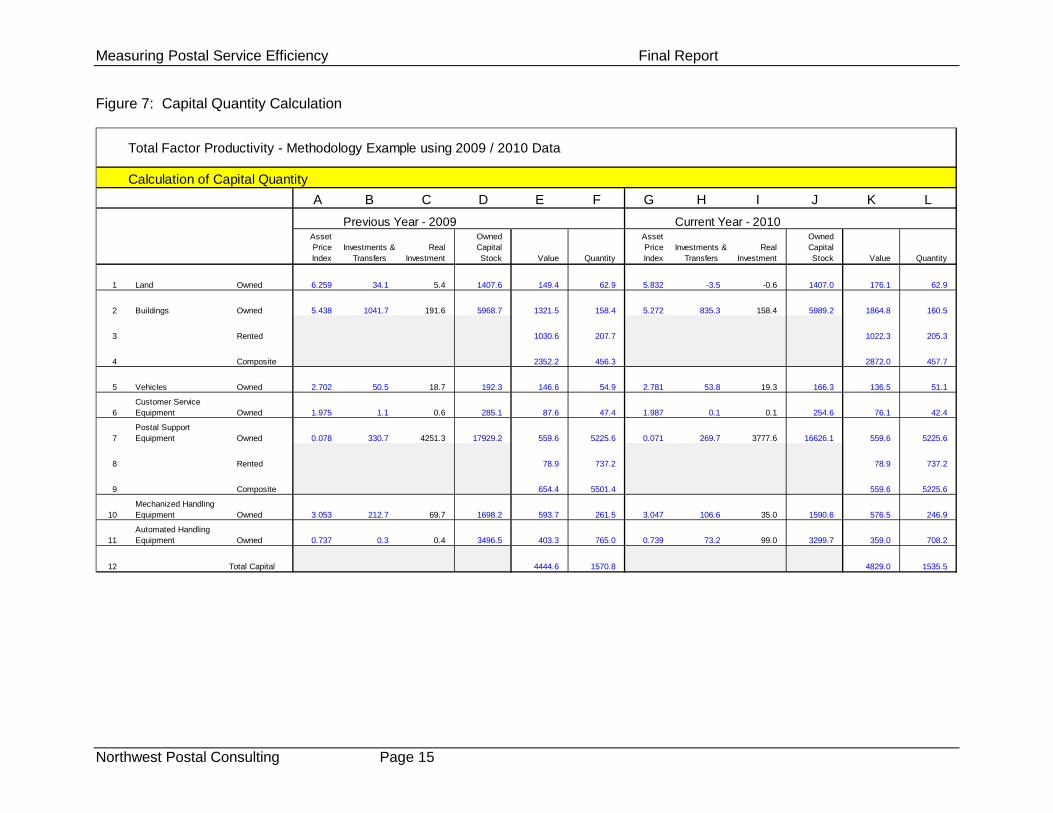
C. Capital Quantity Input
The data provided for the Capital Value and Quantity are provided in this section. The methodology for Capital is almost entirely done in a separate process. Capital is calculated on a quarterly basis using a perpetual inventory process. It is explained in detail in the 2010 PRC TFP Methodology paper. Christensen Associates provided additional explanation for this project. Their memorandum is provided in Appendix 3.
D. Materials Quantity Input
The Materials Quantity is calculated from cost data for 30 categories comprising Materials resources used for the year. In 2016, the number of categories was reduced to 28. The methodology is explained in detail in the Appendix 3 documents.
The general process is to convert the current year dollars into an indexed value using a Bureau of Labor Statistics (BLS) index specific to the category. However, where the category is USPS specific, such as the Air Contracts, a methodology was developed by Christensen to fit the specific characteristics of the category.
In validating the methodology, an adjustment factor was identified that is applied starting in 2004. This factor is different for each category.
Once the Quantity is calculated for each category, these are combined into a single Aggregate Material Quantity using the Tornqvist Index methodology.

Measuring Postal Service Efficiency Final Report
Northwest Postal Consulting Page 10
Figure 2: Labor Quantity Calculation - Labor Categories
Total Factor Productivity - Methodology Example using 2009 / 2010 Data
A B C D E F G H I J K L M N O PCalculation of Labor Category Quantity
Previous Year - 2009 Current Year - 2010 Base Year 1972 (1985 for Admin)
Labor CategoryEmployee Category
Value:Labor
Dollars% Labor
Value Labor Hours
Labor Composition
IndexComposition
Hours2009
Quantity
Value:Labor
Dollars% Labor
Value Labor Hours
Labor Composition
IndexComposition
Hours Index Factor
Value: Labor
DollarsLabor Hours
Labor Comp Index
2010 Quantity
1 Clerks & Full-time2 Mail Handlers Part-time3 Full-time 12369.5 66.3% 263.5 1.002 264.0 11080.1 64.9% 232.2 1.004 233.0 0.9214 Clerks Part-time 1871.2 10.0% 43.3 1.011 43.8 1792.1 10.5% 40.5 1.020 41.3 0.9945 Non-Career 232.7 1.2% 14.4 1.000 14.4 174.1 1.0% 11.4 1.000 11.4 0.9976 Full-time 3905.4 20.9% 85.0 0.998 84.9 3775.4 22.1% 80.3 1.001 80.4 0.9887 Mail Handler Part-time 214.3 1.1% 5.7 0.999 5.7 208.3 1.2% 5.1 1.020 5.2 0.9998 Career9 Non-Career 67.7 0.4% 4.4 1.000 4.4 47.9 0.3% 3.4 1.000 3.4 0.999 Mainten
10 Clerks & Mail Handlers 18660.7 416.3 417.2 2572.6 17077.9 372.9 374.7 2318.1
11 Carriers & Full-time12 VS Drivers Part-time13 Full-time 15396.1 82.9% 326.9 0.989 323.2 15156.7 82.8% 313.9 0.992 311.5 0.97014 City Carriers Part-time 1677.7 9.0% 40.8 0.977 39.8 1685.7 9.2% 38.8 0.987 38.3 0.99615 Career16 Non-Career 768.8 4.1% 27.9 1.000 27.9 781.6 4.3% 27.8 1.000 27.8 1.00017 Full-time 658.5 3.5% 13.5 0.983 13.3 628.6 3.4% 12.7 0.986 12.5 0.99818 Vehicle Services Part-time 65.5 0.4% 1.6 0.971 1.6 56.3 0.3% 1.3 0.979 1.3 0.99919 Drivers Career20 Non-Career 6.9 0.0% 0.3 1.000 0.3 7.1 0.0% 0.3 1.000 0.3 1.000
21 City Carriers & Vehicle Service Drivers 18573.4 411.0 406.1 2491.4 18316.0 394.8 391.6 2400.5
22 Full-time23 Special Delivery Part-time24 Non-Career
25 Special Delivery
26 Full-time 5369.7 80.3% 122.9 0.931 114.4 5395.0 80.7% 121.0 0.936 113.2 0.99227 Rural Carriers Part-time 318.1 4.8% 12.8 0.931 12.0 328.5 4.9% 13.1 0.936 12.3 1.00128 Career29 Non-Career 1003.4 15.0% 45.8 1.000 45.8 963.3 14.4% 43.5 1.000 43.5 0.993
30 Rural Carriers 6691.1 181.5 172.2 984.2 6686.8 177.6 169.0 969.7
31 Full-time 3592.2 98.7% 73.7 1.024 75.5 3484.8 98.7% 70.1 1.027 72.0 0.95332 Maintenance Part-time 35.6 1.0% 0.9 1.039 0.9 32.7 0.9% 0.8 1.047 0.8 0.99933 Service Career34 Non-Career 10.2 0.3% 0.7 1.000 0.7 12.6 0.4% 0.9 1.000 0.9 1.001
35 Maintenance Service 3637.9 75.3 77.1 483.9 3530.0 71.8 73.7 461.4
36 Full-time 496.6 99.7% 10.3 0.996 10.3 481.0 99.7% 9.8 0.998 9.8 0.94937 Vehicle Part-time 1.6 0.3% 0.0 1.014 0.0 1.4 0.3% 0.0 1.014 0.0 0.99938 Service Career39 Non-Career 0.1 0.0% 0.0 1.000 0.0 0.1 0.0% 0.0 1.000 0.0 1.000
40 Vehicle Service 498.3 10.4 10.3 74.1 482.4 9.8 9.8 70.3
41 Postmasters 2461.9 2471.9 54.7 1.022 55.9 428.2 67.2 0.980 363.8
42 Supervisors 3481.3 3324.6 62.7 0.995 62.4 641.9 78.7 1.007 505.6
43 Admin & Technical 772.0 665.7 12.3 1.055 13.0 247.2 13.5 1.000 238.9
44 Other Personnel 1672.4 1685.1 26.3 1.029 27.1 171.6 21.5 0.994 217.3

Measuring Postal Service Efficiency Final Report
Northwest Postal Consulting Page 11
Figure 3: Flow Chart - Calculation of Labor Category Quantity
Mail HandlerNon-Career
Index FactorMail Handler
Part-Time
Index FactorMail Handler
Full-Time
Index FactorClerks
Non-Career
Index FactorClerks
Part-Time
Index Factor
Current Year Quantity
Current Year Quantity by Labor
Category
ClerksFull-Time
Index Factor
=X
Previous Year Quantity
Product of the Index Factors
(𝐶𝐶𝐶𝐶 𝐶𝐶𝐿𝐿𝐶𝐶𝐶𝐶𝐿𝐿𝐻𝐻𝑃𝑄𝑃𝐿𝐿𝐼𝐼 𝐻𝐻𝐿𝐿𝐻𝐻𝐿𝐿𝐻𝐻)/(𝑃𝐶𝐶 𝐶𝐶𝐿𝐿𝐶𝐶𝐶𝐶𝐿𝐿𝐻𝐻𝑃𝑄𝑃𝐿𝐿𝐼𝐼 𝐻𝐻𝐿𝐿𝐻𝐻𝐿𝐿𝐻𝐻) (𝑃𝑌 %𝑉𝑌𝐷𝐶𝐶+𝐶𝑌 %𝑉𝑌𝐷𝐶𝐶)/2
Index Factor calculated for the composite quantity component for each Category
Composition Hours for CY
and PY
=X
Labor Composition
Index
Mail HandlerNon-Career
Index FactorMail Handler
Part-Time
Index FactorMail Handler
Full-Time
Index FactorClerks
Non-Career
Index FactorClerks
Part-Time
Index FactorClerks
Full-Time
Labor Hours
Labor Hours by Category
% LaborValue by Category
=Sum of Value Labor Dollars for Category
sub-total
Sub-Total Sum of Category
Labor Dollars Mail HandlerNon-Career
Index FactorMail Handler
Part-Time
Index FactorMail Handler
Full-Time
Index FactorClerks
Non-Career
Index FactorClerks
Part-Time
Index FactorClerks
Full-Time
Value Labor Dollars
Labor Dollars by Category
Calculation of Labor Category Quantity
Mail HandlerNon-Career
Index FactorMail Handler
Part-Time
Index FactorMail Handler
Full-Time
Index FactorClerks
Non-Career
Index FactorClerks
Part-Time
Index FactorClerks
Full-Time
% Value Labor
= X =
X =
Previous Year Quantity for the Labor Category
Mail HandlerNon-Career
Index FactorMail Handler
Part-Time
Index FactorMail Handler
Full-Time
Index FactorClerks
Non-Career
Index FactorClerks
Part-Time
Index FactorClerks
Full-Time
Composition Index
Mail HandlerNon-Career
Index FactorMail Handler
Part-Time
Index FactorMail Handler
Full-Time
Index FactorClerks
Non-Career
Index FactorClerks
Part-Time
Index FactorClerks
Full-Time
Composition Hours
Labor Quantity Calculated for Sub-Categories:• Clerks & Mail Handlers• City Carriers & Vehicle Service Drivers• Rural Carriers• Maintenance Service• Vehicle Service
Note: Current Year (CY) Previous Year (PY)
÷
÷

Measuring Postal Service Efficiency Final Report
Northwest Postal Consulting Page 12
Figure 4: Flow Chart – Calculation of Aggregate Labor Quantity
Current Year Quantity
=
Current Quantity Calculation for each Admin Category
Composition Hours for
Current Year by Category
=X
Labor Composition
Index Category Current Year
Labor Hours by Category
Current Year
Other Personnel
Index FactorAdmin & Technical
Index FactorSupervisors
Index FactorPostmaster
Value Labor Current Dollars
Labor Dollars by Category
Current Year (CY)
Calculation of Labor Category Quantity that use Base Year Methodology
Other Personnel
Index FactorAdmin & Technical
Index FactorSupervisors
Index FactorPostmaster
Current Year Labor Hours
Other Personnel
Index FactorAdmin & Technical
Index FactorSupervisors
Index FactorPostmaster
Current Year Quantity
Other Personnel
Index FactorAdmin & Technical*
Index FactorSupervisors
Index FactorPostmaster
Value Labor Base Dollars
Labor Dollars by Category Base
Year (1972)(BY)
Other Personnel
Index FactorAdmin & Technical*
Index FactorSupervisors
Index FactorPostmaster
Labor Base Hours
Labor Hours by Category Base
Year (1972)
Other Personnel
Index FactorAdmin & Technical*
Index FactorSupervisors
Index FactorPostmaster
Labor Composition Index
Labor Comp Index by
Category Base Year
*Note: Admin & Technical Base Year is 1985
𝐶𝐶𝐶𝐶 𝐿𝐿𝐿𝐿𝐿𝐿𝐿𝐿𝐿𝐿 $/(𝐶𝐶𝐶𝐶 𝐿𝐿𝐿𝐿𝐿𝐿𝐿𝐿𝐿𝐿 $
𝐶𝐶𝐶𝐶 𝐶𝐶𝐿𝐿𝐶𝐶𝐶𝐶 𝐻𝐻𝐿𝐿𝐻𝐻𝐿𝐿𝐻𝐻)/(
𝐵𝐵𝐶𝐶 𝐿𝐿𝐿𝐿𝐿𝐿𝐿𝐿𝐿𝐿 $(𝐵𝐵𝐶𝐶 𝐿𝐿𝐿𝐿𝐿𝐿𝐿𝐿𝐿𝐿 𝐻𝐻𝐿𝐿𝐻𝐻𝐿𝐿𝐻𝐻)×(𝐵𝐵𝐶𝐶 𝐶𝐶𝐿𝐿𝐶𝐶𝐶𝐶 𝐼𝐼𝐼𝐼𝐼𝐼𝐼𝐼𝐼𝐼))
Other Personnel
Index FactorAdmin & Technical
Index FactorSupervisors
Index FactorPostmaster
Composition Index
Other Personnel
Index FactorAdmin & Technical
Index FactorSupervisors
Index FactorPostmaster
Composition Hours
X =
Measuring Postal Service Efficiency Final Report
Northwest Postal Consulting Page 13
Figure 5: Aggregate Labor Quantity Calculation
Total Factor Productivity - Methodology Example using 2009 / 2010 Data
A B C D E F G H I J K L M N O PCalculation of Aggregate Labor Quantity
Previous Year - 2009 Current Year - 2010
Labor CategoryEmployee Category
Labor Dollars % Labor Labor Hours
Labor Composition
IndexComposition
Hours2009
QuantityLabor
Dollars % Labor Labor Hours
Labor Composition
IndexComposition
Hours Index Factor2010
Quantity
45 Clerks & Mail Handlers 18660.7 33.1% 2572.6 17077.9 31.5% 0.967 2318.1
46 City Carriers & VS Drivers 18573.4 32.9% 2491.4 18316.0 33.8% 0.988 2400.5
47 Special Delivery
48 Rural Carriers 6691.1 11.9% 984.2 6686.8 12.3% 0.998 969.7
49 Maintenance Service 3637.9 6.4% 483.9 3530.0 6.5% 0.997 461.4
50 Vehicle Service 498.3 0.9% 74.1 482.4 0.9% 1.000 70.3
51 Postmasters 2461.9 4.4% 363.6 2471.9 4.6% 1.000 363.8
52 Supervisors 3481.3 6.2% 539.7 3324.6 6.1% 0.996 505.6
53 Admin & Technical 772.0 1.4% 285.0 665.7 1.2% 0.998 238.9
54 Other Personnel 1672.4 3.0% 219.7 1685.1 3.1% 1.000 217.3
55 Aggregate Labor Quantity 56449.0 100.0% 7829.0 54240.5 100.0% 7388.1

Measuring Postal Service Efficiency Final Report
Northwest Postal Consulting Page 14
Figure 6: Calculation of Aggregate Labor Quantity
Measuring Postal Service Efficiency Final Report
Northwest Postal Consulting Page 15
Figure 7: Capital Quantity Calculation
Total Factor Productivity - Methodology Example using 2009 / 2010 Data
Calculation of Capital QuantityA B C D E F G H I J K L
Previous Year - 2009 Current Year - 2010Asset Price Index
Investments & Transfers
Real Investment
Owned Capital Stock Value Quantity
Asset Price Index
Investments & Transfers
Real Investment
Owned Capital Stock Value Quantity
1 Land Owned 6.259 34.1 5.4 1407.6 149.4 62.9 5.832 -3.5 -0.6 1407.0 176.1 62.9
2 Buildings Owned 5.438 1041.7 191.6 5968.7 1321.5 158.4 5.272 835.3 158.4 5989.2 1864.8 160.5
3 Rented 1030.6 207.7 1022.3 205.3
4 Composite 2352.2 456.3 2872.0 457.7
5 Vehicles Owned 2.702 50.5 18.7 192.3 146.6 54.9 2.781 53.8 19.3 166.3 136.5 51.1
6Customer Service Equipment Owned 1.975 1.1 0.6 285.1 87.6 47.4 1.987 0.1 0.1 254.6 76.1 42.4
7Postal Support Equipment Owned 0.078 330.7 4251.3 17929.2 559.6 5225.6 0.071 269.7 3777.6 16626.1 559.6 5225.6
8 Rented 78.9 737.2 78.9 737.2
9 Composite 654.4 5501.4 559.6 5225.6
10Mechanized Handling Equipment Owned 3.053 212.7 69.7 1698.2 593.7 261.5 3.047 106.6 35.0 1590.6 576.5 246.9
11Automated Handling Equipment Owned 0.737 0.3 0.4 3496.5 403.3 765.0 0.739 73.2 99.0 3299.7 359.0 708.2
12 Total Capital 4444.6 1570.8 4829.0 1535.5

Measuring Postal Service Efficiency Final Report
Northwest Postal Consulting Page 16
Figure 8: Materials Quantity Calculation
Total Factor Productivity - Methodology Example using 2009 / 2010 Data
Calculation of Materials QuantityA B C D E F G H I J K L M N O
Current Year - 2010 Calculation of Quantity - 2010
Actual Dollars
% Cost (Dollars)
1972 Price Index
2004 Adjustment
Factor2009
QuantityActual Dollars
% Cost (Dollars)
1972 Price Index
2004 Adjustment
Factor2010
Quantity Index Factor
Calculated Aggregate Quantity
Published Aggregate Quantity
% Published
+/- Published
1 Air Domestic Network 1554.0 12.6% 2.650 -1.37% 594.7 1538.2 12.8% 2.832 -1.37% 550.7 0.990
2 Air Domestic Contract 459.8 3.7% 3.712 -0.27% 124.2 438.3 3.7% 3.730 -0.27% 117.8 0.998
3 Air International Line Haul 793.0 6.4% 2.066 0.20% 383.1 682.1 5.7% 2.004 0.20% 339.7 0.993
4 Highway Transport 3013.3 24.4% 3.347 0.04% 899.8 3176.6 26.5% 3.327 0.04% 954.3 1.015
5 Rail Transport 84.6 0.7% 2.489 -0.29% 34.1 25.0 0.2% 2.561 -0.29% 9.8 0.994
6 Water & Other Transport 28.9 0.2% 4.985 -3.29% 6.0 30.4 0.3% 5.119 -3.29% 6.1 1.000
7 International Terminal Settlements 422.4 3.5% 0.733 0.00% 576.0
8 Misc Trans & Intl Terminal Dues 373.7 3.0% 12.747 3.09% 28.4
9 International Terminal Charges 201.5 1.6% 3.852 2.25% 51.2
10 Relocation Costs 6.2 0.0% 9.058 5.46% 0.6 4.9 0.0% 9.251 5.46% 0.5 1.000
11 Transport of Household Effects 6.8 0.1% 3.347 -4.22% 2.1 7.5 0.1% 3.327 -4.22% 2.4 1.000
12 Uniforms & Work Clothes 81.9 0.7% 2.145 1.15% 37.8 77.6 0.6% 2.148 1.15% 35.7 1.000
13 Travel 134.0 1.1% 9.058 -0.02% 14.8 107.5 0.9% 9.251 -0.02% 11.6 0.998
14 Supplies 895.7 7.3% 4.456 0.05% 200.9 866.0 7.2% 4.490 0.05% 192.7 0.997
15 Contract Building Services 322.7 2.6% 6.345 0.04% 50.8 312.8 2.6% 6.392 0.04% 48.9 0.999
16 Professional Services 851.1 6.9% 5.279 0.37% 160.6 841.6 7.0% 5.299 0.37% 158.2 0.999
17 Contract Computer Services 374.6 3.0% 5.828 0.59% 63.9 360.6 3.0% 5.805 0.59% 61.8 0.999
18 Heating Fuels 88.2 0.7% 11.248 0.27% 7.8 77.4 0.6% 10.814 0.27% 7.1 0.999
19 Utilities 604.6 4.9% 5.634 -0.04% 107.4 560.6 4.7% 5.779 -0.04% 97.0 0.995
20 Telephone 189.3 1.5% 1.049 4.12% 173.4 148.6 1.2% 0.982 4.12% 145.4 0.998
21 Telegraph
22 Vehicle Supplies 533.0 4.3% 7.099 -0.78% 75.7 579.1 4.8% 7.898 -0.78% 73.9 0.999
23 Vehicle Maintenance 681.7 5.5% 7.099 -0.45% 96.5 716.3 6.0% 7.898 -0.45% 91.1 0.997
24 Vehicle Rents 42.2 0.3% 2.678 -2.15% 16.1 33.2 0.3% 2.674 -2.15% 12.7 0.999
25 Research and Development 15.5 0.1% 8.430 -11.55% 2.1 12.4 0.1% 8.478 -11.55% 1.7 1.000
26 Expensed Building Improvements 219.5 1.8% 5.483 3.75% 38.6 192.1 1.6% 5.684 3.75% 32.6 0.997
27 Maintenance 184.4 1.5% 6.345 0.51% 28.9 152.1 1.3% 6.392 0.51% 23.7 0.997
28 Miscellaneous Services 504.6 4.1% 5.886 -13.84% 99.5 508.8 4.2% 6.011 -13.84% 98.2 0.999
29 Miscellaneous Judgments 88.9 0.7% 4.224 0.20% 21.0 86.9 0.7% 4.260 0.20% 20.3 1.000
30 Miscellaneous 20.7 0.2% 3.263 -49.60% 12.6 25.0 0.2% 3.342 -49.60% 14.8 1.000
31 Total Miscellaneous
32 Total Materials - Aggregate Quantity 12354.2 100.0% 2868.4 11984.1 100.0% 2762.1 2742.5 0.72% 19.6
Previous Year - 2009
Materials Category

Measuring Postal Service Efficiency Final Report
Northwest Postal Consulting Page 17
E. Weighted Volume
General Information
1. The underlying data comes from the Revenue, Pieces and Weight (RPW) and Cost and Revenue Analysis (CRA) Reports.
2. There have been many changes in mail classification over the years. These classifications are shown to provide a full listing of the categories used in TFP.
3. Attributable Cost is used to weight the changes in piece volumes using the index process to calculate the quantity where there are multiple Mail Products within the Mail Class category.
4. Generally, In Mail Class categories where there is a single Mail Product, the Quantity equals the pieces.
5. Once a Quantity is calculated for each Mail Product, these are aggregated to create the Weighted Mail Volume Quantity. This is the final result for the mail volume component. It is based on the pieces and weighed using the Attributable Cost.
First Class Mail
The following process is used to calculate the Quantity for First Class Mail.
1. Columns A, E show the Pieces by Mail Product.
2. Columns B, C show the Attributable Cost by Mail Product.
3. Columns C, G show the calculated percentage of the Attributable Cost. This is used in calculating the factor index for each Mail Product.
4. Column H calculates the factor index for each Mail Product. It uses the ratio of the pieces, weighted by the average of the percentage of the Attributable Cost over the two years. This is expressed by the following formula:
( 𝐶𝐶𝐶𝐶𝐶𝐶𝐶 𝑌𝐶𝑌𝐶 𝑃𝐶𝐶𝑃𝐶𝐶𝑃𝐶𝐶𝑃𝐶𝐶𝐶𝐶 𝑌𝐶𝑌𝐶 𝑃𝐶𝐶𝑃𝐶𝐶
)(% 𝐶𝑌 𝐶𝐶𝐶𝐶+% 𝑃𝑌 𝐶𝐶𝐶𝐶)/2 × 𝑃𝐿𝐿𝐼𝐼𝑃𝑃𝐿𝐿𝐻𝐻𝐻𝐻 𝐶𝐶𝐼𝐼𝐿𝐿𝐿𝐿 𝑄𝐻𝐻𝐿𝐿𝐼𝐼𝑄𝑃𝑄𝑄
5. Column D, Line 12 shows the Prior Years published Quantity value.
6. Column I, Line 12, calculated the Current Year quantity using the Product of the index values multiplied by the previous year’s Quantity.
This process is used for the other Mail Products that have individual Mail Class categories.

Measuring Postal Service Efficiency Final Report
Northwest Postal Consulting Page 18
Figure 9: Quantity Calculation - First Class, Priority, Express Mail, Standard, & Periodicals
Weighted Mail Volume
A B C D E F G H I J K LPrevious Year - 2009 Current Year - 2010
Mail Class Mail Product PiecesAttributable
Cost% Cost
(Dollars)Published Quantity Pieces
Attributable Cost
% Cost (Dollars) Catetory Index
Calculated Quantity
Published Quantity % Published +/- Published
1 Single Piece Letters, Flats, Parcels2 Airmail3 Single-Piece Letters 30016.5 7902.0 44.5% 27195.7 7376.8 43.6% 0.9574 First Class Flats 2864.5 2157.5 12.1% 2487.3 2148.0 12.7% 0.9835 Parcels 580.8 1095.2 6.2% 575.3 1132.4 6.7% 0.9996 Single-Piece Cards 1616.8 440.0 2.5% 1439.5 398.6 2.4% 0.9977 Government Cards8 Presort Letters, Flats, Parcels9 Presort Letters 45109.2 5401.6 30.4% 43293.8 5161.8 30.5% 0.988
10 Presort Cards 3126.0 241.0 1.4% 2931.6 237.0 1.4% 0.99911 Outbound Intl FC Letters, Flats, Packages 456.4 529.0 3.0% 323.6 476.1 2.8% 0.990
12 Total First Class 83770.2 17766.3 83262.2 78246.7 16930.7 76267.5 76220.0 0.06% 47.5
13 Priority Mail 790.1 810.8 810.8 810.8 0.00% 0.0
14 Express Mail 47.0 42.6 42.6 42.6 0.00% 0.015 Single Piece16 Standard Commercial Regular17 Commercial ECR18 Nonprofit Regular19 Nonprofit ECR20 Nonprofit Books21 Regular22 ECR23 HD & Saturation Letters 5085.4 347.1 2.9% 5428.0 378.0 3.2% 1.00224 HD & Saturation Flats & Par 12356.8 796.7 6.5% 11363.4 796.3 6.7% 0.99425 Carrier Route 9902.0 1585.6 13.0% 9473.6 1567.2 13.3% 0.99426 Letters 46867.8 5101.9 41.9% 48508.6 5127.4 43.4% 1.01527 Flats 7814.5 3497.1 28.7% 7067.7 3169.2 26.8% 0.97228 Not Flat-Mach & Parcels 679.0 840.0 6.9% 682.4 780.2 6.6% 1.000
29 Total Standard 82705.6 12168.4 81538.4 82523.7 11818.4 79740.3 79578.1 0.20% 162.230 Within County 859.3 105.1 3.9% 695.5 98.5 4.0% 0.99231 Periodicals Outside County 7094.4 2574.9 96.1% 6574.0 2391.3 96.0% 0.92932 Nonprofit33 Classroom34 Regular35 Controlled Circulation36 Transient
37 Total Periodicals 7953.7 2680.0 7889.0 7269.5 2489.8 7271.4 7237.3 0.47% 34.1

Measuring Postal Service Efficiency Final Report
Northwest Postal Consulting Page 19
Figure 10: Quantity Calculation – Packages, International & Other Mail Classes
Weighted Mail Volume
A B C D E F G H I J K LPrevious Year - 2009 Current Year - 2010
Mail Class Mail Product PiecesAttributable
Cost% Cost
(Dollars)Published Quantity Pieces
Attributable Cost
% Cost (Dollars) Catetory Index
Calculated Quantity
Published Quantity % Published +/- Published
38 Parcel Post39 Single-Piece Parcel Post 80.7 761.3 44.2% 61.5 748.9 44.4% 0.88740 Bound Printed Matter41 BPM Flats 238.8 118.8 6.9% 229.8 129.4 7.7% 0.99742 Packages BPM Parcels 270.6 371.2 21.5% 244.7 349.2 20.7% 0.97943 Special Mail44 Library Mail45 Media Mail (Incl Library)46 Media & Library Mail 140.1 472.4 27.4% 122.5 458.6 27.2% 0.964
47 Package Services 730.3 1723.7 749.2 658.5 1686.0 625.1 624.6 0.07% 0.548 Surface Letters & Cards49 Airmail Letters & Cards50 Airmail Other (incl Express)51 Economy Letter-Post52 Airmail Letter-Post (w/ Expr)53 Economy Periodicals54 Economy Parcel-Post55 Airmail Parcel-Post56 ISAL and Other Mail57 IPA Methodology up to 200758 International Mail First Class Mail59 Priority Mail60 Express Mail61 Total International62 USPS Mail63 Other Mail Free Mail64 Mailgrams65 Agency Penalty66 Franked67 Total International & Other Mail68 Expedited Services 5.5 186.3 20.3% 5.8 182.1 20.0% 1.00869 Outbound Priority Mail 23.6 537.5 58.4% 23.7 549.9 60.5% 1.00170 International Priority Airmail (IPA) 7.6 5.2 0.6% 5.1 2.3 0.2% 0.99871 Surface Airlift (ISAL) 3.5 2.3 0.2% 2.4 1.8 0.2% 0.99972 Direct Sacks M-Bags 0.1 4.4 0.5% 0.1 2.6 0.3% 0.99873 NSA Mail 261.2 184.1 20.0% 233.0 169.7 18.7% 0.97874 Letter Post75 Inbound Surface & Air PP76 International Market Dominent NSA 77 Competitive NSA Mail
78 Total International 301.5 919.8 361.8 270.0 908.3 355.7 355.7 0.00% 0.079 USPS Mail 454.9 543.0 454.9 432.0 462.3 432.0 432.0 0.00% 0.080 Other Mail Free Mail 62.0 54.2 62.0 67.3 66.3 67.3 67.3 0.00% 0.081 First-Class Package Service82 Parcel Select 222.9 370.9 222.9 268.4 346.1 268.4 268.4 0.00% 0.083 Parcel Return Service 18.3 25.7 18.3 28.5 35.6 28.5 28.5 0.00% 0.0

Measuring Postal Service Efficiency Final Report
Northwest Postal Consulting Page 20
Figure 11: Flow Chart - Quantity Calculation for First Class Mail

Measuring Postal Service Efficiency Final Report
Northwest Postal Consulting Page 21
Figure 12: Calculation of Aggregate Weighted Mail Volume Quantity
Weighted Mail Volume
A B C D E F G H I J K LPrevious Year - 2009 Current Year - 2010
Mail Class Mail Product PiecesAttributable
Cost% Cost
(Dollars)Published Quantity Pieces
Attributable Cost
% Cost (Dollars) Catetory Index
Calculated Quantity
Published Quantity % Published +/- Published
Calculation of Output - Weighted Mail Volume Using Published Quantity 84 First Class 17766.3 43.5% 83262.2 16930.7 42.9% 0.963 76220.0
85 Priority Mail 4078.9 10.0% 790.1 4203.4 10.7% 1.003 810.8
86 Express Mail 553.3 1.4% 47.0 495.6 1.3% 0.999 42.6
87 Standard Mail 12168.4 29.8% 81538.4 11818.4 30.0% 0.993 79578.1
88 Periodicals 2680.0 6.6% 7889.0 2489.8 6.3% 0.994 7237.3
89 Package Services 1723.7 4.2% 749.2 1686.0 4.3% 0.992 624.6
90 International 919.8 2.2% 361.8 908.3 2.3% 1.000 355.7
91 USPS Mail 543.0 1.3% 454.9 462.3 1.2% 0.999 432.0
92 Free Mail 54.2 0.1% 62.0 66.3 0.2% 1.000 67.3
93 First-Class Package Service 0.0% 0.0%
94 Parcel Select 370.9 0.9% 222.9 346.1 0.9% 1.002 268.4
95 Parcel Return Service 25.7 0.1% 18.3 35.6 0.1% 1.000 28.5
96 Total Labor 40884.1 100.0% 177797.6 39442.7 100.0% 168073.4 168052.3 0.01% 21.0

Measuring Postal Service Efficiency Final Report
Northwest Postal Consulting Page 22
Priority Mail
1. Columns A and E show the Pieces for Priority Mail.
2. The Quantity for Priority Mail equals the number of pieces. This is reflected in Column I.
3. The Attributable Cost data and the Previous Year Quantity are not shown here as they are not used in calculating the Current Year Quantity.
Express Mail Express Mail follows the same methodology as Priority Mail.
Standard Mail, Periodicals, & Package Services
Standard Mail, Periodicals, and Package Services follow the methodology as explained for First Class Mail.
International Mail International Mail follows the methodology as explained for First Class Mail. The categories for International Mail have shown a significant number of changes over the years. A major restructuring was done in 2008.
Other Mail Quantity results are calculated for USPS Mail, Free Mail, First Class Package Services, Parcel Select, and Parcel Return Service. In 2010, these were calculated and published in the TFP reports. These were aggregated in the published reports starting in 2013.
F. Aggregate Weighted Mail Volume Quantity
The Aggregate Weighted Mail Volume Quantity is calculated using the quantities calculated for each of the Mail Class components. It is weighted using the Attributable Cost in the Tornqvist Index methodology.
Measuring Postal Service Efficiency Final Report
Northwest Postal Consulting Page 23
G. Miscellaneous Output Miscellaneous Output is comprised of all the non-mail volume components of Workload that should be included in a comprehensive productivity measurement. It has the following categories:
1. Market Dominant Ancillary Services
This category is predominately Certified Mail and USPS Tracking. Other services such as Registered Mail and Return Receipts are also included here.
2. Market Dominant Special Services
Post Office Boxes are included here. The workload of Post Office Boxes is accounted for in this category. (The TFP tables do not reflect category changes after PAEA.)
3. Competitive Services
These are Competitive International Ancillary Services, Premium Forwarding Service, and International Money Transfer Service.
4. Other Services
This represents Military Reimbursements and Other Miscellaneous services.
These categories are combined into an Aggregate Miscellaneous Output Quantity.

Measuring Postal Service Efficiency Final Report
Northwest Postal Consulting Page 24
Figure 13: Calculation of Miscellaneous Output
Calculation of Miscellaneous Output
A B C D E F G H I J K L M NPrevious Year - 2009 Current Year - 2010
PiecesApportioned
Cost% Cost
(Dollars) Unit CostPublished
Quantity PiecesApportioned
Cost% Cost
(Dollars) Unit CostPublished
QuantityCatetory
IndexCalculated Quantity
% Published
+/- Published
Marked Dominant Ancillary Services1 Certified Mail 266.5 659.5 45.7% 2.47 269.3 634.7 46.3% 2.362 COD 1.0 6.6 0.5% 6.50 0.8 8.2 0.6% 9.893 USPS Tracking 1062.9 488.6 33.9% 0.46 1371.1 491.5 35.9% 0.364 Insurance 43.8 116.9 8.1% 2.67 39.1 98.6 7.2% 2.525 Registered Mail 3.2 50.6 3.5% 15.90 3.0 42.6 3.1% 14.356 Return Receipts 220.3 101.2 7.0% 0.46 215.6 77.3 5.6% 0.367 Other Domestic Ancillary Services 18.5 8.5 0.6% 0.46 19.2 6.9 0.5% 0.368 MD International Ancillary Services 1.7 3.8 0.3% 2.20 2.0 7.2 0.5% 3.599 Stamped Envelopes 6.0 0.4% 2.8 0.2%
10 Special Delivery
11 Sub-Total Ancillary Services 1617.9 1441.7 1920.2 1369.8
Market Dominant Special Services12 Money Orders 135.0 146.1 18.8% 1.08 123.4 126.3 15.8% 1.0213 Post Office Boxes 632.3 81.2% 675.5 84.2%
Competitive Services14 Competitive International Ancillary Services 1.6 7.5 35.1% 1.2 10.2 37.6%15 Premium Forwarding Service 1.2 7.0 32.4% 1.2 8.5 31.2%16 Intl Money Transfer Service 0.3 7.0 32.4% 0.2 8.5 31.2%
Market Dominant & Competitive Services
17 Market Dominant & Competititve Sub-Total 1756.0 2241.6 62.9% 1.074 2087.5 2046.2 2198.7 62.6% 1.013 2168.5 1.024Other Services
18 Military Reimbursements 513.4 14.4% 1.000 513.4 463.7 13.2% 0.970 478.2 0.99019 Other Miscellaneous 811.1 22.7% 1.015 799.2 852.3 24.2% 1.037 822.2 1.007
Total Miscellaneous Output
20 Total Miscellaneous Output 3566.1 100.0% 1.049 3400.0 3514.7 100.0% 1.012 3470.8 3471.3 0.01% 0.4

Measuring Postal Service Efficiency Final Report
Northwest Postal Consulting Page 25
H. Final Index Result Calculations The process used to calculate the final TFP result is shown in the following Excel tables and process flow charts.
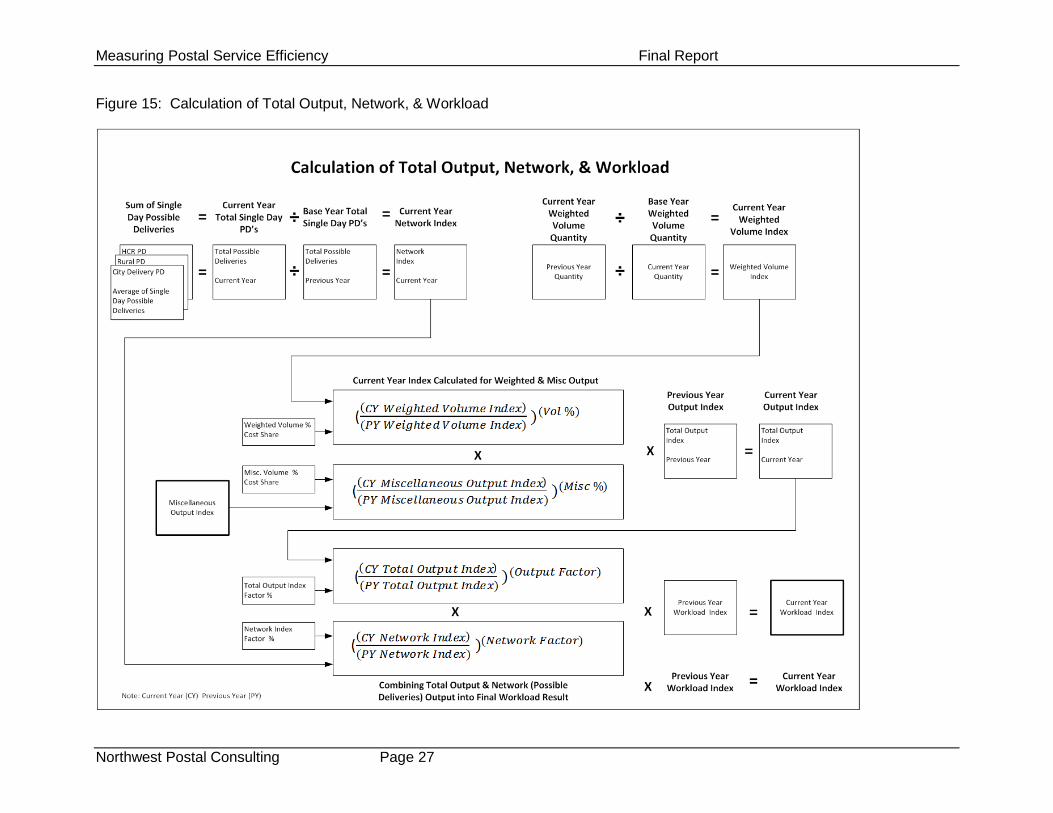
Total Output, Network, and Workload Total Output is the result of combining Weighted Mail Volume and Miscellaneous Output. Network is the output represented by Possible Deliveries. Workload is the result of combining Total Output and Network into a final output result. Workload is the final output result used in the numerator of the TFP calculation.
Total Factor Productivity Index Calculation The Labor, Capital, and Material Quantities are combined into a single Input result using the current year Value weighting. TFP is calculated by dividing the Workload by the Input.
Labor Productivity Index Calculation The Labor Productivity Index is calculated by dividing the Workload by the Labor Input.
Postal Inflation Index The Postal Inflation Index is the Value of the Resource Usage divided by the Workload. The Value of the Resource Usage is the sum of the Labor, Capital, and Materials Value result.

Measuring Postal Service Efficiency Final Report
Northwest Postal Consulting Page 26
Figure 14: Calculation of Final Workload
Calculation of Final Workload Index Value
A B C D E FCombining Weighted Mail Volume & Miscellaneous Output into Total Output Index
Total Output Index1963 1972 2008 2009 2010 Index Factor
1 Total Pieces 67852.7 87156.1 177056.4 170618.0
2 2008 Adjustment Factor 1.711
3 Quantity Weighted Volume 67852.7 82606.9 141299.9 177797.6 168052.3
4 Miscellaneous Output 3400.0 3470.8
5 Index Weighted Volume 1.258 1.189 0.950
6 Miscellaneous Output 1.296 1.323 1.002
7 Cost Share Weighted Volume 92.2% 91.9%
8 Miscellaneous Output 7.8% 8.1%
9 Total Output Index Published Value 1.270 1.208
10 Calculated Index 1.208
Calculating Network (Possible Deliveries) Index
Network Index1963 1972
Adjustment Factors 2009 2010
11 City 46.7 57.4 87.5 87.8
12 Possible Deliveries Rural 9.0 11.3 39.4 39.9
13 HCR 2.6 2.7
14 Total PD 55.7 68.7 129.5 130.4
15 2004 Adjusted Base 69.9
16 Network Index Published Value 1.853 1.866
17 Calculated Index 1.853 1.866
Combining Total Output & Network (Possible Deliveries) Output into Final Workload Result
Workload Index2009 2010 Index Factor
18 Total Ouput Index 1.270 1.208 70.00%
19 Network Index 1.853 1.866 30.00%
19 Workload Index Published 1.412 1.366
20 Calculated 1.366
Measuring Postal Service Efficiency Final Report
Northwest Postal Consulting Page 27
Figure 15: Calculation of Total Output, Network, & Workload

Measuring Postal Service Efficiency Final Report
Northwest Postal Consulting Page 28
Figure 16: Calculation of Results Indexes – Total Factor Productivity, Labor Productivity, & Postal Inflation Indexes
Calculation of Postal Inflation, Labor Productivity, and Total Factor Productivity
A B C D E F G H I J1972 2009 2010
Quantity(Cost)Value % Cost Quantity TFP Input
(Cost)Value
% Cost (Dollars) Quantity Index TFP Input
Calculation of Input Index1 Labor 8041.4 56449.0 77.1% 7829.0 54240.5 76.3% 7388.1 0.957
2 Input Index Captial 4444.6 6.1% 1570.8 4829.0 6.8% 1535.5 0.999
3 Materials 12354.2 16.9% 2868.4 11984.1 16.9% 2742.5 0.992
4 Total 9681.4 73247.8 11550.7 71053.5 10949.1
5 Input Index 1.000 1.193 1.131
Calculation of Postal Inflation Index1972 2009 2010 Growth Rate % SPLY
6 Value of Resource Usage 9681.4 73247.8 71053.5 -3.04 -3.00
7 Quantity of Workload 9681.4 13669.5 13224.7 -3.31 -3.25
8 Postal Inflation Index Calculated 1.000 5.358 5.373
9 Published 5.361 5.375 0.27 0.27
10 % Published -0.040% -0.040%
Calculation of Labor Productivity Index1972 2009 2010 Growth Rate % SPLY
11 Workload Index 1.000 1.412 1.366 -3.31 -3.25
12 Labor Quantity 8041.4 7829.0 7388.1
13 Labor Index 1.000 0.974 0.919 -5.80 -5.63
14 Labor Productivity Index 1.000 1.450 1.487 2.49 2.52
Calculation of Total Factor Productivity1972 2009 2010 Growth Rate % SPLY
15 Workload Index 1.000 1.412 1.366 -3.31 -3.25
16 Input Index 1.000 1.193 1.131 -5.35 -5.21
17 Total Factor Productivity 1.000 1.183 1.208 2.04 2.06

Measuring Postal Service Efficiency Final Report
Northwest Postal Consulting Page 29
Figure 17: Calculation of TFP
Measuring Postal Service Efficiency Final Report
Northwest Postal Consulting Page 30
III. TFP Results – 2016
1. Published Results
TFP is published each year through the PRC. It is published as an Excel file that contains a series of report tables showing the data used and the results of the TFP model. The Excel file does not contain any formulas, only the values. This report is generated by Christensen Associates.
TFP is first provided at the end of December as a preliminary result for the year. The result is preliminary because the Attributable Costs are estimated using the cost per piece from the previous year, multiplied by the current year’s pieces. The final report is published later in the year when the final Attributable Costs are available. The data in this section are the final 2016 Results.
The report tables are organized in different periods of years, usually grouped around major restructuring or reporting changes. NWPC reorganized the data and results in these reports to create a usable data set for analysis and model development.
These reports are presented as Appendix 1 – Published TFP Data and Results. This is the source of the graphs and reports provided in this section.
The graphs and specific data used in them are provided in Appendix 6 – Graphs Used in the Reports.
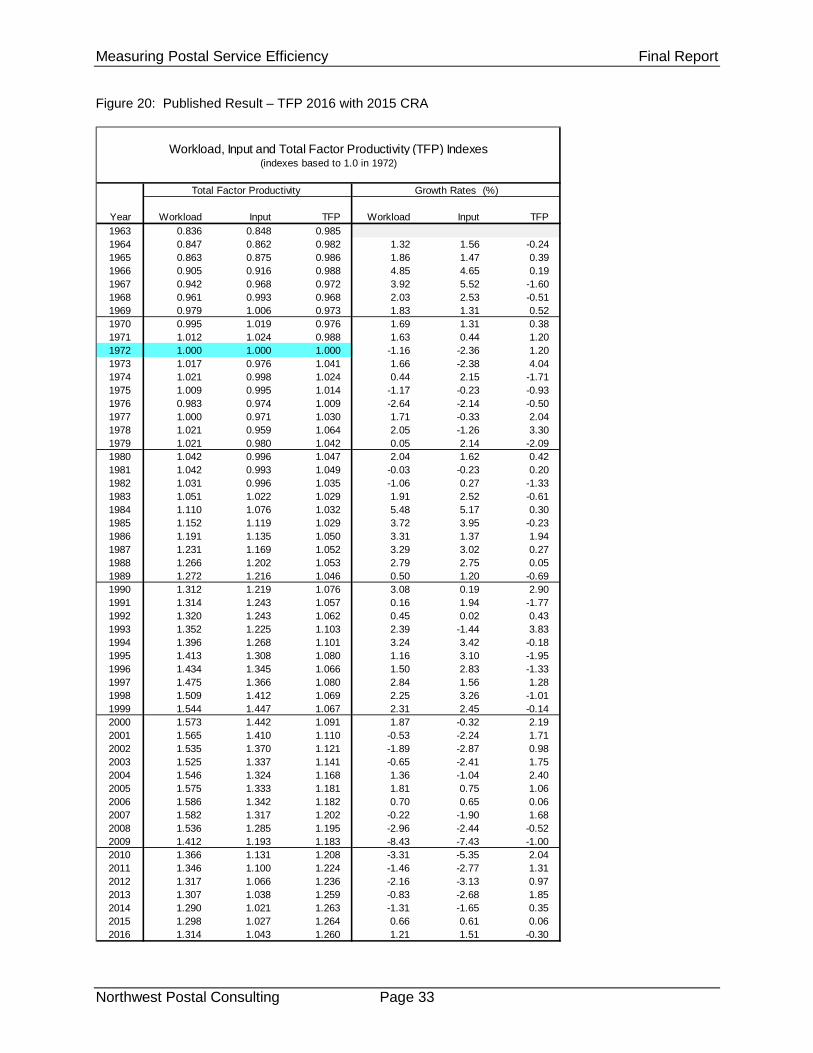
The TFP results are shown in Figure 18: Total Factor Productivity.
• TPF is the Workload divided by the Input.
• Input is based on the Labor, Capital, and Materials categories.
• The Workload is based on the Weighted Mail Volume, Miscellaneous Output, and Possible Deliveries (Network).
• The resulting TFP is shown as an Index value with 1972 as the base year equal to one (1.00).
• Workload reflects the impacts of volume reductions, worksharing, electronic diversion, possible deliveries and ecommerce growth.
• This reflects the end result of the TFP methodology.

Measuring Postal Service Efficiency Final Report
Northwest Postal Consulting Page 31
Figure 18: Total Factor Productivity

Measuring Postal Service Efficiency Final Report
Northwest Postal Consulting Page 32
Figure 19: Total Factor Productivity – Growth Rates for TFP, Workload, & Input
• Figure 19 shows the Growth Rate for TFP, Workload, and Input.
• The Growth Rate is calculated using a logarithm formula.
• The table of actual values follows as Figure 20.
• While the TFP in the top chart reflects the differences in the change in inputs and workload, it is worth noting how closely the input growth trends track the workload growth trends.
Measuring Postal Service Efficiency Final Report
Northwest Postal Consulting Page 33
Figure 20: Published Result – TFP 2016 with 2015 CRA
Total Factor Productivity
Year Workload Input TFP Workload Input TFP1963 0.836 0.848 0.9851964 0.847 0.862 0.982 1.32 1.56 -0.241965 0.863 0.875 0.986 1.86 1.47 0.391966 0.905 0.916 0.988 4.85 4.65 0.191967 0.942 0.968 0.972 3.92 5.52 -1.601968 0.961 0.993 0.968 2.03 2.53 -0.511969 0.979 1.006 0.973 1.83 1.31 0.521970 0.995 1.019 0.976 1.69 1.31 0.381971 1.012 1.024 0.988 1.63 0.44 1.201972 1.000 1.000 1.000 -1.16 -2.36 1.201973 1.017 0.976 1.041 1.66 -2.38 4.041974 1.021 0.998 1.024 0.44 2.15 -1.711975 1.009 0.995 1.014 -1.17 -0.23 -0.931976 0.983 0.974 1.009 -2.64 -2.14 -0.501977 1.000 0.971 1.030 1.71 -0.33 2.041978 1.021 0.959 1.064 2.05 -1.26 3.301979 1.021 0.980 1.042 0.05 2.14 -2.091980 1.042 0.996 1.047 2.04 1.62 0.421981 1.042 0.993 1.049 -0.03 -0.23 0.201982 1.031 0.996 1.035 -1.06 0.27 -1.331983 1.051 1.022 1.029 1.91 2.52 -0.611984 1.110 1.076 1.032 5.48 5.17 0.301985 1.152 1.119 1.029 3.72 3.95 -0.231986 1.191 1.135 1.050 3.31 1.37 1.941987 1.231 1.169 1.052 3.29 3.02 0.271988 1.266 1.202 1.053 2.79 2.75 0.051989 1.272 1.216 1.046 0.50 1.20 -0.691990 1.312 1.219 1.076 3.08 0.19 2.901991 1.314 1.243 1.057 0.16 1.94 -1.771992 1.320 1.243 1.062 0.45 0.02 0.431993 1.352 1.225 1.103 2.39 -1.44 3.831994 1.396 1.268 1.101 3.24 3.42 -0.181995 1.413 1.308 1.080 1.16 3.10 -1.951996 1.434 1.345 1.066 1.50 2.83 -1.331997 1.475 1.366 1.080 2.84 1.56 1.281998 1.509 1.412 1.069 2.25 3.26 -1.011999 1.544 1.447 1.067 2.31 2.45 -0.142000 1.573 1.442 1.091 1.87 -0.32 2.192001 1.565 1.410 1.110 -0.53 -2.24 1.712002 1.535 1.370 1.121 -1.89 -2.87 0.982003 1.525 1.337 1.141 -0.65 -2.41 1.752004 1.546 1.324 1.168 1.36 -1.04 2.402005 1.575 1.333 1.181 1.81 0.75 1.062006 1.586 1.342 1.182 0.70 0.65 0.062007 1.582 1.317 1.202 -0.22 -1.90 1.682008 1.536 1.285 1.195 -2.96 -2.44 -0.522009 1.412 1.193 1.183 -8.43 -7.43 -1.002010 1.366 1.131 1.208 -3.31 -5.35 2.042011 1.346 1.100 1.224 -1.46 -2.77 1.312012 1.317 1.066 1.236 -2.16 -3.13 0.972013 1.307 1.038 1.259 -0.83 -2.68 1.852014 1.290 1.021 1.263 -1.31 -1.65 0.352015 1.298 1.027 1.264 0.66 0.61 0.062016 1.314 1.043 1.260 1.21 1.51 -0.30
Workload, Input and Total Factor Productivity (TFP) Indexes(indexes based to 1.0 in 1972)
Growth Rates (%)

Measuring Postal Service Efficiency Final Report
Northwest Postal Consulting Page 34
Figure 21: Labor Productivity
Figure 21 shows the Labor Productivity Index results.
• Though it does not account for all of the inputs, labor productivity is a classic measure of productivity.
• The beginning of the measure in 1963 through 2000 saw continuous but, for the most part, relatively modest gains in labor productivity.
• Workload began to flatten then subsequently drop around 2001.
• Mail volume growth was slowing.
• Increased workshare in the form of more presort, automation compatible mail, dropship and incentives to drive mail to lower-cost shapes reduced the workload content of the mail.
• The same 2001 period began an even sharper decline in the Labor Input.
• Coupled with a variety of cost saving programs focusing on automation and operations efficiency, the end result is that labor productivity saw much more rapid gains starting in that same 2001 time period.
Measuring Postal Service Efficiency Final Report
Northwest Postal Consulting Page 35
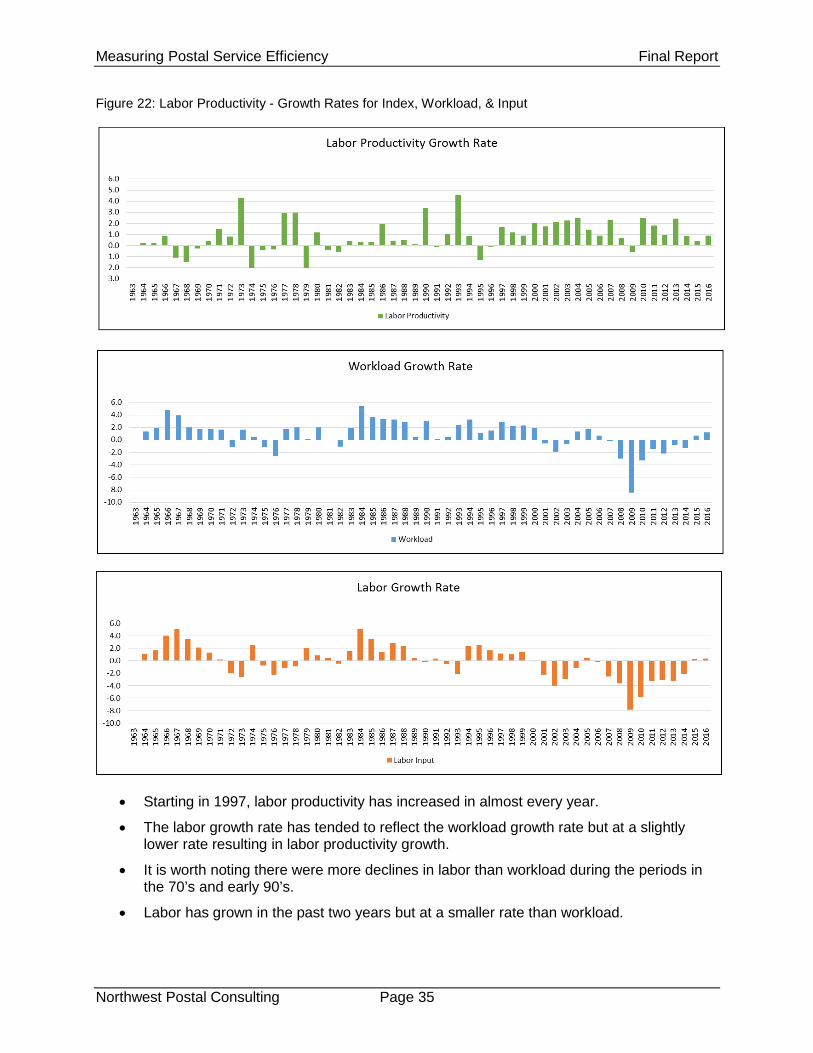
Figure 22: Labor Productivity - Growth Rates for Index, Workload, & Input
• Starting in 1997, labor productivity has increased in almost every year.
• The labor growth rate has tended to reflect the workload growth rate but at a slightly lower rate resulting in labor productivity growth.
• It is worth noting there were more declines in labor than workload during the periods in the 70’s and early 90’s.
• Labor has grown in the past two years but at a smaller rate than workload.

Measuring Postal Service Efficiency Final Report
Northwest Postal Consulting Page 36
Figure 23: Labor Productivity Index
Labor LaborYear Workload Labor Input Productivity Workload Labor Input Productivity1963 0.836 0.846 0.9881964 0.847 0.855 0.990 1.32 1.08 0.241965 0.863 0.869 0.993 1.86 1.63 0.231966 0.905 0.904 1.001 4.85 3.98 0.871967 0.942 0.951 0.991 3.92 5.00 -1.071968 0.961 0.984 0.976 2.03 3.50 -1.481969 0.979 1.005 0.973 1.83 2.10 -0.271970 0.995 1.018 0.977 1.69 1.28 0.411971 1.012 1.020 0.992 1.63 0.17 1.461972 1.000 1.000 1.000 -1.16 -1.98 0.821973 1.017 0.974 1.044 1.66 -2.65 4.311974 1.021 0.998 1.023 0.44 2.48 -2.041975 1.009 0.991 1.019 -1.17 -0.76 -0.411976 0.983 0.968 1.015 -2.64 -2.28 -0.361977 1.000 0.957 1.045 1.71 -1.21 2.921978 1.021 0.948 1.077 2.05 -0.94 2.991979 1.021 0.967 1.056 0.05 2.05 -2.001980 1.042 0.976 1.068 2.04 0.85 1.191981 1.042 0.979 1.064 -0.03 0.37 -0.401982 1.031 0.974 1.058 -1.06 -0.50 -0.561983 1.051 0.989 1.062 1.91 1.51 0.401984 1.110 1.041 1.066 5.48 5.14 0.341985 1.152 1.078 1.069 3.72 3.42 0.301986 1.191 1.093 1.090 3.31 1.38 1.931987 1.231 1.124 1.095 3.29 2.83 0.461988 1.266 1.150 1.101 2.79 2.28 0.511989 1.272 1.155 1.102 0.50 0.41 0.101990 1.312 1.151 1.139 3.08 -0.29 3.371991 1.314 1.155 1.138 0.16 0.30 -0.141992 1.320 1.148 1.150 0.45 -0.59 1.041993 1.352 1.123 1.203 2.39 -2.18 4.571994 1.396 1.151 1.214 3.24 2.40 0.841995 1.413 1.179 1.198 1.16 2.44 -1.281996 1.434 1.198 1.197 1.50 1.61 -0.111997 1.475 1.212 1.217 2.84 1.16 1.691998 1.509 1.225 1.232 2.25 1.05 1.201999 1.544 1.242 1.243 2.31 1.42 0.892000 1.573 1.240 1.268 1.87 -0.15 2.022001 1.565 1.213 1.290 -0.53 -2.27 1.732002 1.535 1.165 1.319 -1.89 -4.05 2.162003 1.525 1.131 1.349 -0.65 -2.92 2.272004 1.546 1.118 1.383 1.36 -1.14 2.502005 1.575 1.122 1.403 1.81 0.38 1.442006 1.586 1.120 1.416 0.70 -0.20 0.902007 1.582 1.092 1.449 -0.22 -2.53 2.312008 1.536 1.053 1.459 -2.96 -3.64 0.672009 1.412 0.974 1.450 -8.43 -7.86 -0.582010 1.366 0.919 1.487 -3.31 -5.80 2.492011 1.346 0.889 1.514 -1.46 -3.29 1.832012 1.317 0.862 1.529 -2.16 -3.11 0.952013 1.307 0.834 1.566 -0.83 -3.26 2.432014 1.290 0.816 1.579 -1.31 -2.14 0.842015 1.298 0.819 1.586 0.66 0.26 0.412016 1.314 0.821 1.600 1.21 0.34 0.88
Workload, Labor Input and Labor Productivity Indexes(indexes based to 1.0 in 1972)
Growth Rates (%)

Measuring Postal Service Efficiency Final Report
Northwest Postal Consulting Page 37
Figure 24: Postal Inflation Index
Figure 24 shows the Postal Inflation Index.
• The Postal Inflation Index is the Value of the Resource Usage divided by the Workload. The Value of the Resource Usage is the sum of the Labor, Capital, and Materials Value result.
• Effectively, it is the cost change that cannot be explained by the change in workload.
• Postal inflation increased relatively consistently from 1963 until 2008 when resource usage stabilized and postal inflation abated.
• Postal inflation has tended to reflect the growth in resource usage but in a more moderate manner reflecting the improvements in productivity.

Measuring Postal Service Efficiency Final Report
Northwest Postal Consulting Page 38
Figure 25: Growth Rates for Postal Inflation Index
• Again, as shown in the top two charts, the growth in postal inflation has reflected the resource usage growth rate.
• Resource usage tends to track workload growth rates.
• However, the workload growth rate has shown smaller increases and larger declines than resource usage leading to generally positive postal inflation numbers until all but 2 of the past 8 years.
-4.0-2.00.02.04.06.08.0
10.012.014.0
1963
1964
1965
1966
1967
1968
1969
1970
1971
1972
1973
1974
1975
1976
1977
1978
1979
1980
1981
1982
1983
1984
1985
1986
1987
1988
1989
1990
1991
1992
1993
1994
1995
1996
1997
1998
1999
2000
2001
2002
2003
2004
2005
2006
2007
2008
2009
2010
2011
2012
2013
2014
2015
2016
Postal Inflation Growth Rate
Postal Inflation
-4.0-2.00.02.04.06.08.0
10.012.014.0
1963
1964
1965
1966
1967
1968
1969
1970
1971
1972
1973
1974
1975
1976
1977
1978
1979
1980
1981
1982
1983
1984
1985
1986
1987
1988
1989
1990
1991
1992
1993
1994
1995
1996
1997
1998
1999
2000
2001
2002
2003
2004
2005
2006
2007
2008
2009
2010
2011
2012
2013
2014
2015
2016
Resource Usage Growth Rate
Resource Usage
-10.0-8.0-6.0-4.0-2.00.02.04.06.0
1963
1964
1965
1966
1967
1968
1969
1970
1971
1972
1973
1974
1975
1976
1977
1978
1979
1980
1981
1982
1983
1984
1985
1986
1987
1988
1989
1990
1991
1992
1993
1994
1995
1996
1997
1998
1999
2000
2001
2002
2003
2004
2005
2006
2007
2008
2009
2010
2011
2012
2013
2014
2015
2016
Workload Growth Rate
Workload
Measuring Postal Service Efficiency Final Report
Northwest Postal Consulting Page 39
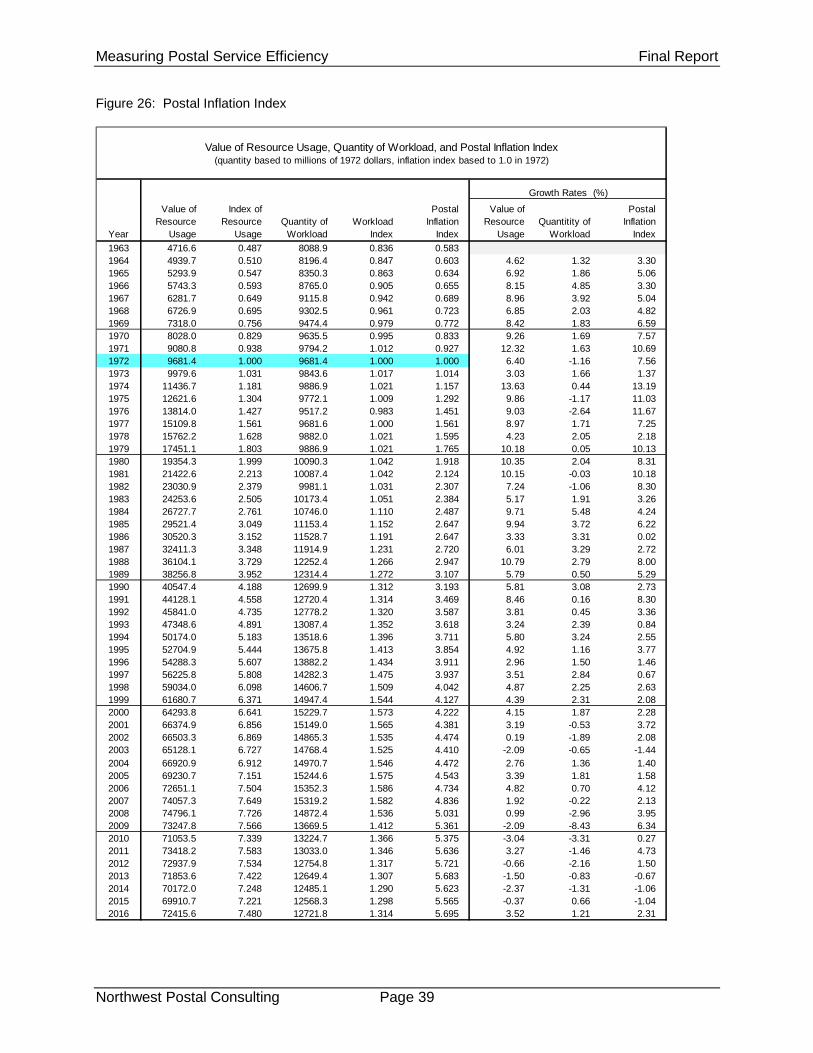
Figure 26: Postal Inflation Index
Year
Value of Resource
Usage
Index of Resource
UsageQuantity of
WorkloadWorkload
Index
Postal Inflation
Index
Value of Resource
UsageQuantitity of
Workload
Postal Inflation
Index1963 4716.6 0.487 8088.9 0.836 0.5831964 4939.7 0.510 8196.4 0.847 0.603 4.62 1.32 3.301965 5293.9 0.547 8350.3 0.863 0.634 6.92 1.86 5.061966 5743.3 0.593 8765.0 0.905 0.655 8.15 4.85 3.301967 6281.7 0.649 9115.8 0.942 0.689 8.96 3.92 5.041968 6726.9 0.695 9302.5 0.961 0.723 6.85 2.03 4.821969 7318.0 0.756 9474.4 0.979 0.772 8.42 1.83 6.591970 8028.0 0.829 9635.5 0.995 0.833 9.26 1.69 7.571971 9080.8 0.938 9794.2 1.012 0.927 12.32 1.63 10.691972 9681.4 1.000 9681.4 1.000 1.000 6.40 -1.16 7.561973 9979.6 1.031 9843.6 1.017 1.014 3.03 1.66 1.371974 11436.7 1.181 9886.9 1.021 1.157 13.63 0.44 13.191975 12621.6 1.304 9772.1 1.009 1.292 9.86 -1.17 11.031976 13814.0 1.427 9517.2 0.983 1.451 9.03 -2.64 11.671977 15109.8 1.561 9681.6 1.000 1.561 8.97 1.71 7.251978 15762.2 1.628 9882.0 1.021 1.595 4.23 2.05 2.181979 17451.1 1.803 9886.9 1.021 1.765 10.18 0.05 10.131980 19354.3 1.999 10090.3 1.042 1.918 10.35 2.04 8.311981 21422.6 2.213 10087.4 1.042 2.124 10.15 -0.03 10.181982 23030.9 2.379 9981.1 1.031 2.307 7.24 -1.06 8.301983 24253.6 2.505 10173.4 1.051 2.384 5.17 1.91 3.261984 26727.7 2.761 10746.0 1.110 2.487 9.71 5.48 4.241985 29521.4 3.049 11153.4 1.152 2.647 9.94 3.72 6.221986 30520.3 3.152 11528.7 1.191 2.647 3.33 3.31 0.021987 32411.3 3.348 11914.9 1.231 2.720 6.01 3.29 2.721988 36104.1 3.729 12252.4 1.266 2.947 10.79 2.79 8.001989 38256.8 3.952 12314.4 1.272 3.107 5.79 0.50 5.291990 40547.4 4.188 12699.9 1.312 3.193 5.81 3.08 2.731991 44128.1 4.558 12720.4 1.314 3.469 8.46 0.16 8.301992 45841.0 4.735 12778.2 1.320 3.587 3.81 0.45 3.361993 47348.6 4.891 13087.4 1.352 3.618 3.24 2.39 0.841994 50174.0 5.183 13518.6 1.396 3.711 5.80 3.24 2.551995 52704.9 5.444 13675.8 1.413 3.854 4.92 1.16 3.771996 54288.3 5.607 13882.2 1.434 3.911 2.96 1.50 1.461997 56225.8 5.808 14282.3 1.475 3.937 3.51 2.84 0.671998 59034.0 6.098 14606.7 1.509 4.042 4.87 2.25 2.631999 61680.7 6.371 14947.4 1.544 4.127 4.39 2.31 2.082000 64293.8 6.641 15229.7 1.573 4.222 4.15 1.87 2.282001 66374.9 6.856 15149.0 1.565 4.381 3.19 -0.53 3.722002 66503.3 6.869 14865.3 1.535 4.474 0.19 -1.89 2.082003 65128.1 6.727 14768.4 1.525 4.410 -2.09 -0.65 -1.442004 66920.9 6.912 14970.7 1.546 4.472 2.76 1.36 1.402005 69230.7 7.151 15244.6 1.575 4.543 3.39 1.81 1.582006 72651.1 7.504 15352.3 1.586 4.734 4.82 0.70 4.122007 74057.3 7.649 15319.2 1.582 4.836 1.92 -0.22 2.132008 74796.1 7.726 14872.4 1.536 5.031 0.99 -2.96 3.952009 73247.8 7.566 13669.5 1.412 5.361 -2.09 -8.43 6.342010 71053.5 7.339 13224.7 1.366 5.375 -3.04 -3.31 0.272011 73418.2 7.583 13033.0 1.346 5.636 3.27 -1.46 4.732012 72937.9 7.534 12754.8 1.317 5.721 -0.66 -2.16 1.502013 71853.6 7.422 12649.4 1.307 5.683 -1.50 -0.83 -0.672014 70172.0 7.248 12485.1 1.290 5.623 -2.37 -1.31 -1.062015 69910.7 7.221 12568.3 1.298 5.565 -0.37 0.66 -1.042016 72415.6 7.480 12721.8 1.314 5.695 3.52 1.21 2.31
Growth Rates (%)
Value of Resource Usage, Quantity of Workload, and Postal Inflation Index(quantity based to millions of 1972 dollars, inflation index based to 1.0 in 1972)
Measuring Postal Service Efficiency Final Report
Northwest Postal Consulting Page 40
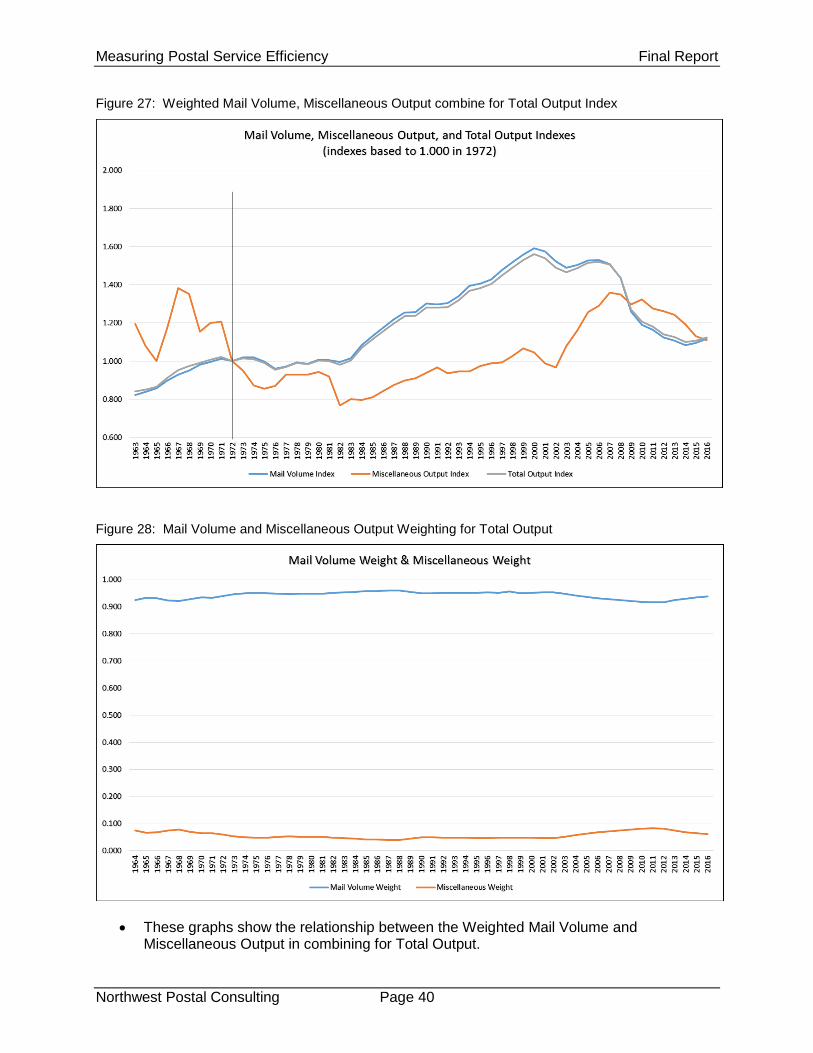
Figure 27: Weighted Mail Volume, Miscellaneous Output combine for Total Output Index
Figure 28: Mail Volume and Miscellaneous Output Weighting for Total Output
• These graphs show the relationship between the Weighted Mail Volume and Miscellaneous Output in combining for Total Output.
Measuring Postal Service Efficiency Final Report
Northwest Postal Consulting Page 41
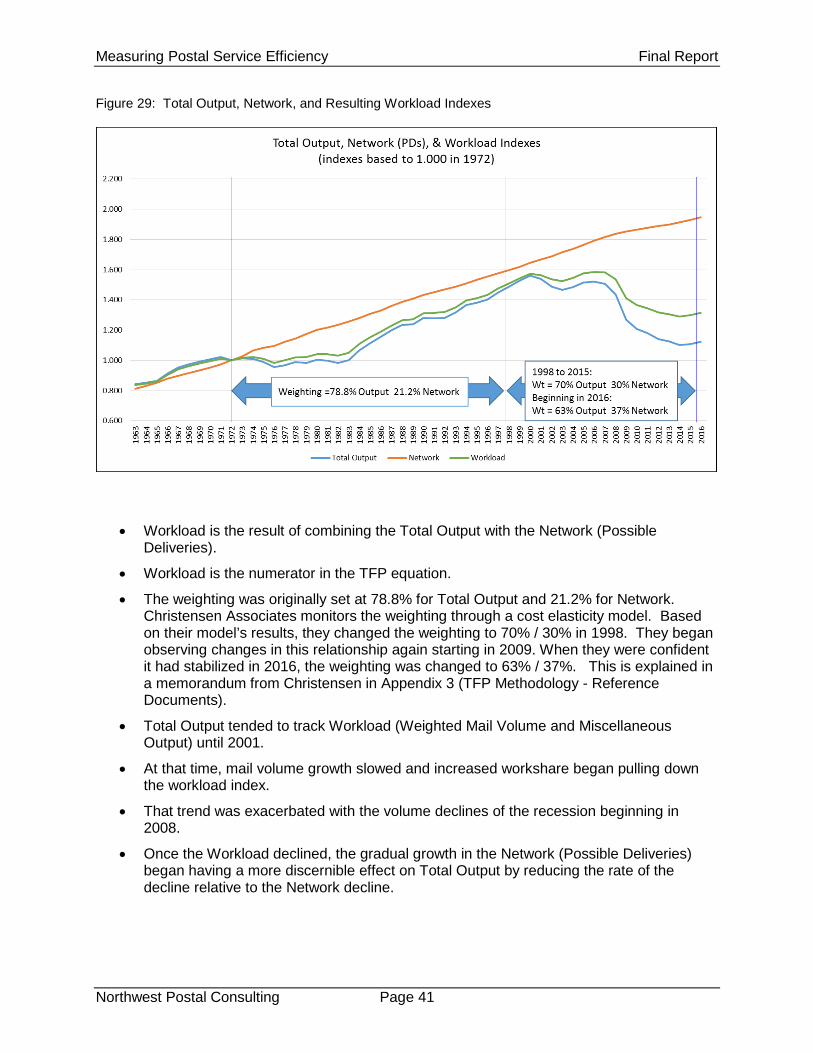
Figure 29: Total Output, Network, and Resulting Workload Indexes
• Workload is the result of combining the Total Output with the Network (Possible Deliveries).
• Workload is the numerator in the TFP equation.
• The weighting was originally set at 78.8% for Total Output and 21.2% for Network. Christensen Associates monitors the weighting through a cost elasticity model. Based on their model’s results, they changed the weighting to 70% / 30% in 1998. They began observing changes in this relationship again starting in 2009. When they were confident it had stabilized in 2016, the weighting was changed to 63% / 37%. This is explained in a memorandum from Christensen in Appendix 3 (TFP Methodology - Reference Documents).
• Total Output tended to track Workload (Weighted Mail Volume and Miscellaneous Output) until 2001.
• At that time, mail volume growth slowed and increased workshare began pulling down the workload index.
• That trend was exacerbated with the volume declines of the recession beginning in 2008.
• Once the Workload declined, the gradual growth in the Network (Possible Deliveries) began having a more discernible effect on Total Output by reducing the rate of the decline relative to the Network decline.

Measuring Postal Service Efficiency Final Report
Northwest Postal Consulting Page 42
Figure 30: Total Output Productivity Index - Using Only Total Output (No Possible Deliveries)
• One way to look at productivity is to take the network out of the equation and focus on the output of Weighted Mail Volume and Miscellaneous Output.
• Input (labor, capital and materials) tended to track output very closely through 1986.
• At that time, the Postal Service was able to reduce input growth below output growth.
• In fact, the gap between input and output growth mostly increased until 2008 at the time when the recession dramatically reduced mail volume and therefore output.
• Since then, the Postal Service has still managed to maintain a smaller but substantial positive gap between input and output declines.

Measuring Postal Service Efficiency Final Report
Northwest Postal Consulting Page 43
Figure 31: Growth Rates for Total Output Productivity Index
• As a bar graph, the top chart shows more positive than negative output productivity increases.
• The productivity growth chart shows declines in 2008 and 2009 where the Postal Service was unable to immediately match the large volume output declines with equal or greater reductions in inputs.
• The last two charts show output and input growth rates trend in a very similar manner suggesting that the Postal Service tends to match inputs with the output at hand.

Measuring Postal Service Efficiency Final Report
Northwest Postal Consulting Page 44
Figure 32: Labor, Capital, & Material Quantities
Figure 33: Percent of Value – Labor, Materials, & Capital
• The value of labor, capital, and materials increased almost steadily until the recession of 2008.

Measuring Postal Service Efficiency Final Report
Northwest Postal Consulting Page 45
• The next several years saw very small declines in the value of the inputs.
• The Quantity change from the previous year is weighted using the percentage share of current and previous year actual dollars.
• The weightings of the input show an interesting story.
o Since 1975, labor has very gradually declined in the weighting of total postal inputs.
o At the same time, materials have increased in share.
o Capital, which was always a small component, saw its weighting vary slightly. It plays a smaller role in TFP due to the relative small percentage of value compared to Labor and Materials.
Figure 34: Labor, Materials, and Capital Quantities
• The TFP model allows a comparison of relative quantities among the inputs of labor, capital, and materials.
• Labor peaked in 1999. Automation and other programs coupled with increased use of workshare by customers led to less of a demand for labor.
• Capital quantities increased for a while and materials moved slightly up and down reflecting to a certain degree changes in fuel costs affecting transportation.
• However, the decline of the largest input component, labor, caused a simultaneous decline in the quantity of all inputs.
• The TFP methodology used the ratio of change from the current year to the previous year, weighted using the average percentage of the actual dollars over the two years.

Measuring Postal Service Efficiency Final Report
Northwest Postal Consulting Page 46
Figure 35: Current Dollar Labor Compensation by Occupation
Figure 36: Annual Workhours by Occupation

Measuring Postal Service Efficiency Final Report
Northwest Postal Consulting Page 47
• These two charts show the compensation and work hours of major employee classification categories.
• A significant decline in the formerly largest category, clerks and mail handlers, which started in 1999, has led to overall declines in workhours.
• It is also worth noting the decline in city carrier work hours in the 2000’s as efficiency programs focusing on automating the sequencing of mail for carriers was implemented.
• Figure 35 shows that pay increases reduce the impact of fewer hours worked as shown in Figure 36.
Figure 37: Labor Quantity by Occupation Category
• The chart shows TFP labor quantities reflecting the trends previously discussed with regard to workhours.
• Clerks and mail handlers along with city carriers to a slightly lesser degree are declining.
• Rural carriers are increasing.

Measuring Postal Service Efficiency Final Report
Northwest Postal Consulting Page 48
Figure 38: Labor Quantity Indices – Clerk / Mail Handler, City Carriers, Rural, & Total
• The line graphs depict the trends in postal labor crafts clearly.
• Clerks and Mailhandlers fall the most dramatically followed by city delivery carriers
• Much of the growth in the delivery network is in exurbia or formerly rural areas which are handled by rural carriers.
• That growth has driven the increase in the number of rural carriers.
• Maintenance employees saw larger increases through 2000 as equipment and building maintenance became more demanding with the increased size and complexity of equipment.
• However, the same forces affecting Clerks and Mailhandlers have reduced maintenance employee quantities since then.
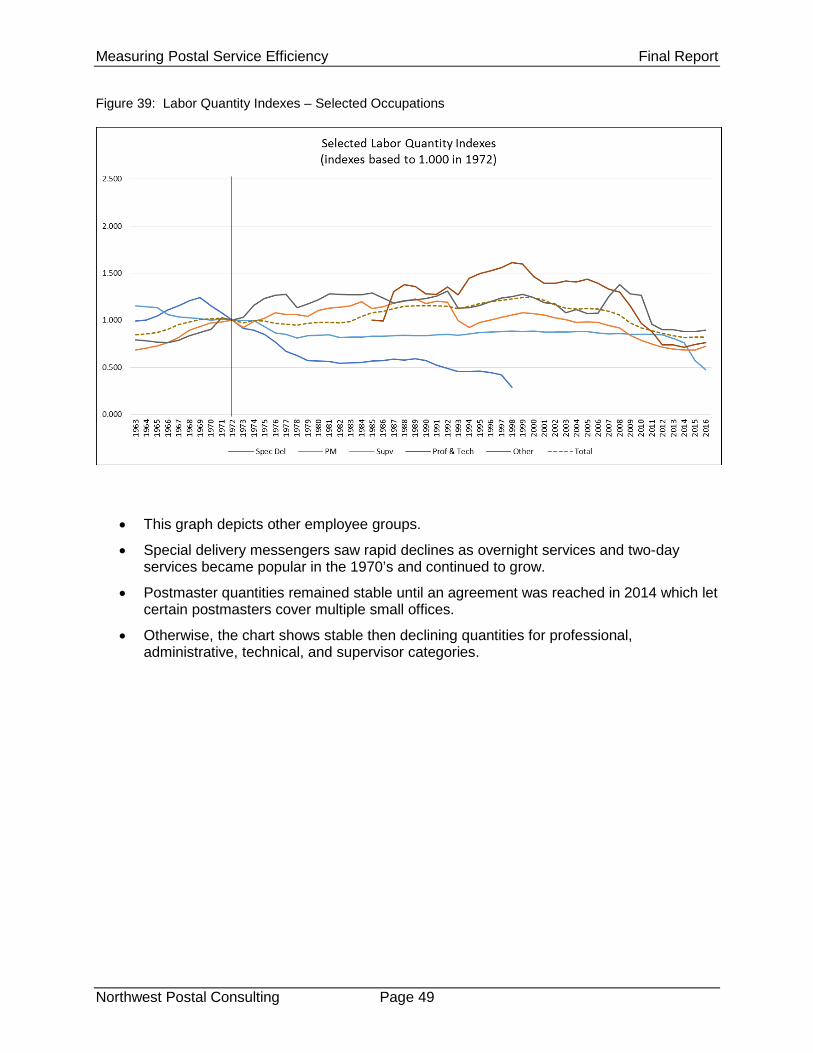
Measuring Postal Service Efficiency Final Report
Northwest Postal Consulting Page 49
Figure 39: Labor Quantity Indexes – Selected Occupations
• This graph depicts other employee groups.
• Special delivery messengers saw rapid declines as overnight services and two-day services became popular in the 1970’s and continued to grow.
• Postmaster quantities remained stable until an agreement was reached in 2014 which let certain postmasters cover multiple small offices.
• Otherwise, the chart shows stable then declining quantities for professional, administrative, technical, and supervisor categories.

Measuring Postal Service Efficiency Final Report
Northwest Postal Consulting Page 50
Figure 40: Wage Rates by Labor Occupation – Clerk/MH, City Carriers, Rural, & Maintenance
• The wage rate chart shows gradually increasing wage rates until the round of labor negotiations that occurred in the 2011-2012 time frame.
• Those negotiations slowed some increases and allowed new, lower rate employee categories for Clerks and City Carriers. This has resulted in a large shift from career to non-career employee use over the past five years. It has caused the composite wage rate to actually decrease for these occupation groups.
• Since 1980, Rural Carriers have tended to be paid less than other postal categories.
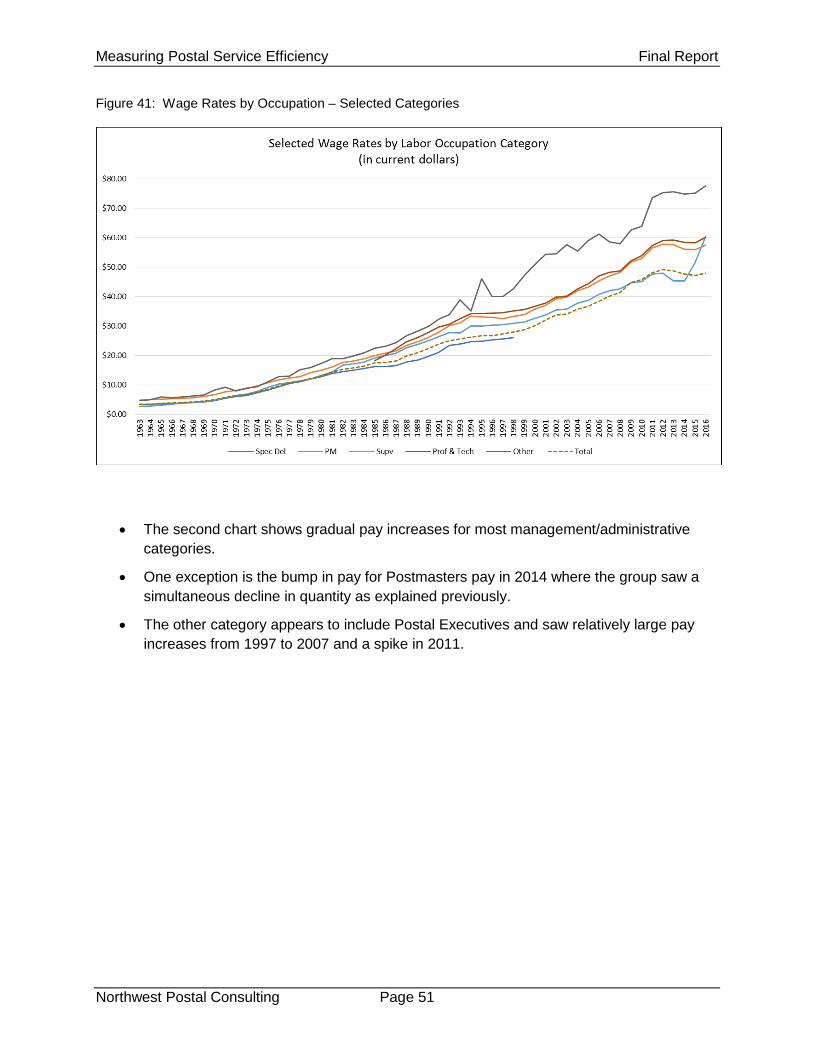
Measuring Postal Service Efficiency Final Report
Northwest Postal Consulting Page 51
Figure 41: Wage Rates by Occupation – Selected Categories
• The second chart shows gradual pay increases for most management/administrative categories.
• One exception is the bump in pay for Postmasters pay in 2014 where the group saw a simultaneous decline in quantity as explained previously.
• The other category appears to include Postal Executives and saw relatively large pay increases from 1997 to 2007 and a spike in 2011.
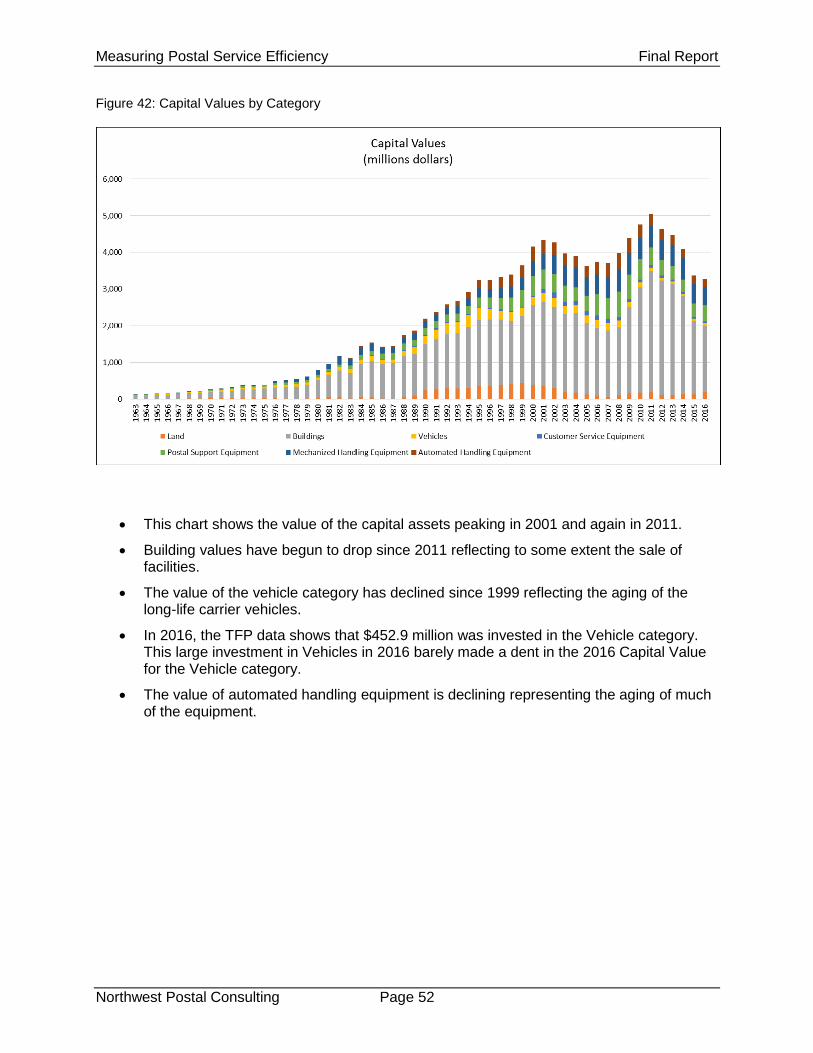
Measuring Postal Service Efficiency Final Report
Northwest Postal Consulting Page 52
Figure 42: Capital Values by Category
• This chart shows the value of the capital assets peaking in 2001 and again in 2011.
• Building values have begun to drop since 2011 reflecting to some extent the sale of facilities.
• The value of the vehicle category has declined since 1999 reflecting the aging of the long-life carrier vehicles.
• In 2016, the TFP data shows that $452.9 million was invested in the Vehicle category. This large investment in Vehicles in 2016 barely made a dent in the 2016 Capital Value for the Vehicle category.
• The value of automated handling equipment is declining representing the aging of much of the equipment.

Measuring Postal Service Efficiency Final Report
Northwest Postal Consulting Page 53
Figure 43: Capital Quantity
• The capital quantity index used by TFP provides a means to track and analyze the amount of capital stock the Postal Service maintains.
• The index shows a steady rise in capital from 1982 until 2009 and subsequent declines.
• That can be seen in the bar graph that shows declines in the capital growth rate from 2009 until 2016.
• Capital Quantity is calculated on a quarterly basis using a perpetual inventory type process.

Measuring Postal Service Efficiency Final Report
Northwest Postal Consulting Page 54
Figure 44: Capital Investments in Current Dollars
• FSS is shown as Mechanized Handling Equipment in 2010 and 2011.
• In 2016, a substantial investment was made in Vehicles. Only the current year impact of the investment gets reflected in the TFP Value and Quantity results.
• Overall, Capital has a small role in the TFP results.
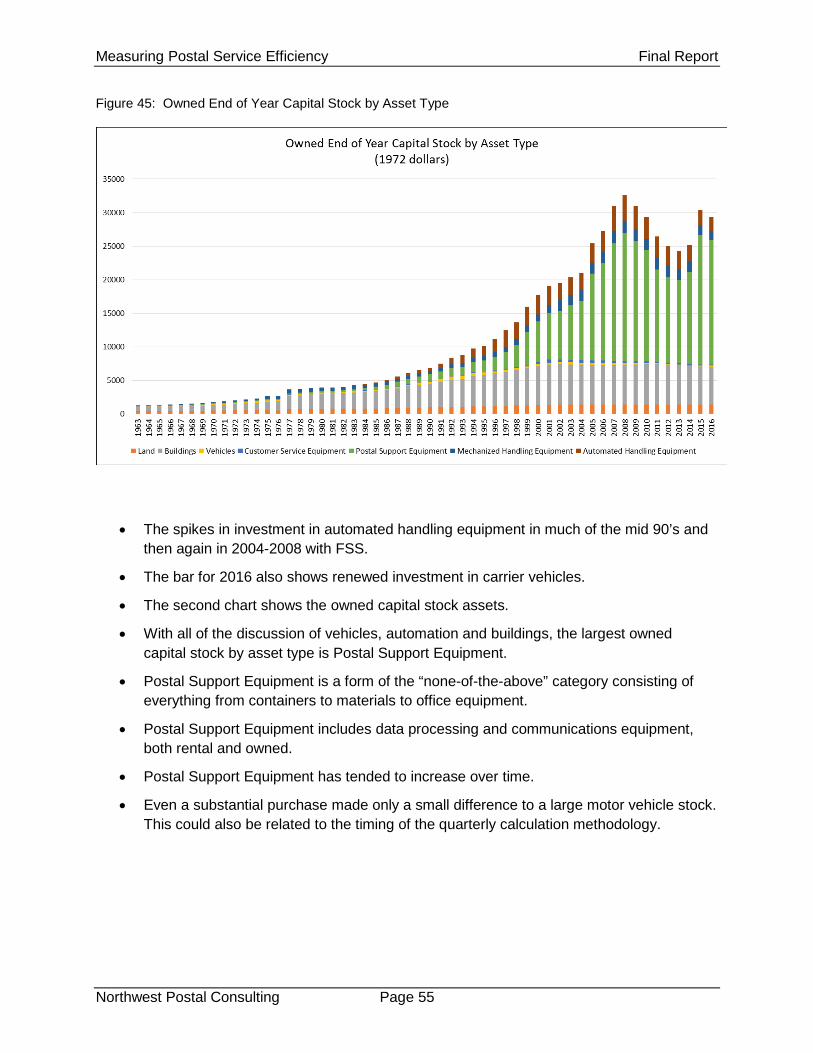
Measuring Postal Service Efficiency Final Report
Northwest Postal Consulting Page 55
Figure 45: Owned End of Year Capital Stock by Asset Type
• The spikes in investment in automated handling equipment in much of the mid 90’s and then again in 2004-2008 with FSS.
• The bar for 2016 also shows renewed investment in carrier vehicles.
• The second chart shows the owned capital stock assets.
• With all of the discussion of vehicles, automation and buildings, the largest owned capital stock by asset type is Postal Support Equipment.
• Postal Support Equipment is a form of the “none-of-the-above” category consisting of everything from containers to materials to office equipment.
• Postal Support Equipment includes data processing and communications equipment, both rental and owned.
• Postal Support Equipment has tended to increase over time.
• Even a substantial purchase made only a small difference to a large motor vehicle stock. This could also be related to the timing of the quarterly calculation methodology.

Measuring Postal Service Efficiency Final Report
Northwest Postal Consulting Page 56
Figure 46: Annual Materials Cost
• Annual material costs have increased over time.
• Air and surface transportation drove much of the increase.
• Supplies and services tended to grow until the 2008 volume decline and have stabilized since then.
• Though a relatively small segment, Vehicle Services in Materials have grown with the aging of the vehicle fleet.

Measuring Postal Service Efficiency Final Report
Northwest Postal Consulting Page 57
Figure 47: Material Quantity
• The material quantity index grew until 1999 and declined, for the most part, through 2012.
• The bar chart shows the uptick in the material growth rate over the past three years.
• That uptick coincides with conclusion of the rapid volume output declines that started in 2008 and began to slow down in 2012.

Measuring Postal Service Efficiency Final Report
Northwest Postal Consulting Page 58
Figure 48: Mail Volume - Pieces
• Within First Class, Standard, Periodicals, Package Services & International, there are Mail Class Products.
• Mail Products are used to create the Weighted Mail Volume Output index.
• Attributable Cost is used to weight the mail piece volumes to create the Weighted Mail Volume result.
• The ratio of the change in piece volume from the current year to the previous year is weighted using the average of the percent of attributable cost for the two years.
• There was an extra quarter in 1976 due to the change in the start of the Fiscal Year from July to October. This was adjusted in the Workload result before calculating TFP.
• There have been changes in the definition of “Other” since 2008 in the calculation of Quantity. These changes appear to be related to reporting of results rather than the methodology for calculating Quantity at the category level.

Measuring Postal Service Efficiency Final Report
Northwest Postal Consulting Page 59
Figure 49: Attributable Cost by Mail Product Category
Figure 50: Percentage of Attributable Cost
• The percentage of Attributable Cost is used in the weighting of the piece volumes.

Measuring Postal Service Efficiency Final Report
Northwest Postal Consulting Page 60
Figure 51: Weighted Mail Volume / Quantity
Figure 52: Actual Pieces to Weighted Mail Volume Quantity
• In Mail Volume, major changes were made in mail classifications in 2008, due to PAEA. The TFP model methodology used this change to reset the Quantity baseline to 2008 pieces.

Measuring Postal Service Efficiency Final Report
Northwest Postal Consulting Page 61
• Over the years, the quantity result for weighted mail volume diverges from the actual number of pieces. This can introduce distortion in results. For some Mail Products, the Quantity equals the number of pieces.
• This results in a factor to make an adjustment to the final Weighted Mail Volume index. This appears to be an appropriate adjustment methodology. This is shown as the spike in Quantity in 2008.
• The relationship between the Quantity and Pieces is shown to be closer after this adjustment.
• Moving forward in 2009, Quantity is calculated without an adjustment factor, as it used the current year and previous year volumes in the calculation.
• It will be further evaluated in Report 2 as part of the Before / After PAEA analysis.
• Attributable Cost per Piece trend lines is shown in the following page as Figure 53 and Figure 54.

Measuring Postal Service Efficiency Final Report
Northwest Postal Consulting Page 62
Figure 53: Cost per Piece
Figure 54: Cost per Piece

Measuring Postal Service Efficiency Final Report
Northwest Postal Consulting Page 63
2. Analysis of TFP Results
A. Key Components in TFP
The following are the key components in TFP. These are the components that most influence the TFP results.
1. TFP is weighted based on Value, with Labor accounting for approximately 76 percent of the cost in recent years. Materials, primarily driven by Transportation, accounts for approximately 18 percent in recent years. The remaining weight is Capital, at approximately 6 percent. The shifts over the historical period have not been significant.
2. Within Labor, the changes in operations categories have the most impact. The reduction in the number of hours is the primary cause of the reduction in Labor.
3. The recent shifts from career to non-career hours have had a large role in the reduction of Labor Input in recent years.
4. Mail Volume reduction has had the largest impact on Workload. The reduction in First Class Mail, along with corresponding change in Attributable Cost share, has been the primary cause of the Output reduction.
5. Network (Possible Deliveries) has had a linear growth impact on Workload.
6. The weighting factor used to combine Total Output and Network to create Workload is a key input in the final TFP value. This will be reviewed in detail in Report 2.
The following items summarize the key observations of the TFP methodology.
1. The Postal Service, overall, did a good job of matching inputs, particularly labor and materials with changes in output or weighted mail volume and miscellaneous services.
2. Subtle, positive differences in labor and materials usage compared to workload growth or decline led to productivity increases.
3. No productivity increases were due to dramatic changes in an input or workload component.
4. Even though labor has a slightly smaller weighting now than 50 years ago, it still is the driving input to TFP changes.
5. Until relatively recently, output (weighted mail volume and miscellaneous output) drove the workload measure because mail volume was growing.
6. Since 2008, the sharp declines in output resulted in mostly negative output productivity.
7. The growth in the delivery network push up workload slightly.
8. That positive delivery network effect has turned negative output productivities in some recent years to positive TFP that includes the delivery network.

Measuring Postal Service Efficiency Final Report
Northwest Postal Consulting Page 64
B. Factors that Affect TFP Results In summary, TFP does contain a complete set of data factors and applies them through an effective methodology to reach an accurate result. This section looks at the factors that affect TFP results. These factors are split into two groups for this purpose: underlying factors and exogenous factors.
Underlying Factors The Underlying Factors would be those that are considered as within the Postal Service’s control or influence. These are essentially programs and policies created by the Postal Service, aspects of operations, strategies to meet performance requirements or pricing discounts designed to reduce costs and incent new volumes. Examples include the following:
• The operational changes that transformed mail processing operations from manual and mechanized sorting to completely automated letter and flat sorting.
• The impact to delivery operations of Delivery Point Sorting (DPS) for letters and the Flat Sequence Sorting (FSS).
• The advent of presort discounts in 1976 where customers began taking over some of the mail sorting activities formerly done by the Postal Service.
• The Standard Mail carrier route presort discount implemented in 1978 that proved fortuitous in allowing the Postal Service to realize its share of the growth in the advertising market in the early 1980’s.
• A number of discounts were implemented in 1991. Some of these encouraged customers to barcode their mail thereby enhancing the automation program. Others encouraged customers to deposit Standard Mail, Periodicals along with Parcel Post closer to the delivery destination. These discounts reduced costs and improved customer incentives to use the mail.
• Capital programs that replace labor with automation or mechanization in operations, or that add value to the product offering.
• The management of the growth of package volumes due to ecommerce, including the role of work sharing product categories (e.g., DDU Parcel Select in 1998).
• The advent of Delivery Confirmation allowed parcel shippers to gain more visibility into the delivery of their product.
• The impact of network optimization and mail processing plant consolidation.
• Capital expenditure process impacts, including periods of freezes or limited availability.
• The type of impact a major infusion of capital has on TFP.
• How periods of substantial volume change (growth in the early 80s’ or declines in the late 00’s) impact productivity.
• Changes in labor agreements that affect employee categories, status, and allocations.
• Changes in labor agreements that affect workload, work assignments or other productivity related factors.

Measuring Postal Service Efficiency Final Report
Northwest Postal Consulting Page 65
Exogenous Factors Exogenous Factors are those that come from outside the Postal Service, over which the Postal Service has little or no ability to directly control. The isolation of the impact of exogenous factors on productivity measurement through quantitative and qualitative methods is a key objective in Report 2. Part of that objective is to ensure these factors are clearly defined as part of our results. The following exogenous factors would form the initial starting point for this analysis:
• The impact of increased electronic communication and payments on mail volumes including the reduction of “clean” easy-to-process mail.
• The growth of package volumes due to ecommerce, including the role of worksharing product categories (e.g., DDU Parcel Select). The impact of adding more volume that involves a greater workload (i.e., compared to letters) should be evaluated. It is possible that the major shift in parcels with a higher operational cost may lead to a lower overall productivity measurement result.
• The large growth of advertising in the early 1980’s led to substantially more Standard Mail volume.
• The large economic recession starting in 2008 coupled with electronic diversion mentioned above led to dramatic volume declines.
• The impact of the economy on mail volume, revenues, and resource usage.
Analysis of Factor Impact The underlying and exogenous factors will be developed further in the Report 2 process. The NWPC TFP model will be modified to support a Before and After analysis of PAEA. These factors will be used as part of this analysis. In addition, pricing factors will be added in the Report 2 process. The factors will be structured into a timeline format for inclusion into Report 2.
Another issue is whether service changes, specifically the recent declines, should be factored into the analysis of TFP results or directly into the calculation methodology. While the PRC’s concern about cost reductions that result in service declines is appreciated, that issue may be better addressed directly through various service measures. In addition, it is difficult to create a measure to account for service results in productivity based methodology. Offhand, it appears that the issue would have to be addressed either by arbitrary deductions in productivity or estimating the cost savings due to service changes and somehow putting them back into the input base.
The Bureau of Labor Statistics (BLS) provides a number of national, industry and postal productivity measures that may be relevant for comparison with TFP. An analysis of measures available through the BLS and their relevance to TFP measurement are included in Report 2.

Measuring Postal Service Efficiency Final Report
Northwest Postal Consulting Page 66
C. Comparison to Deliveries per Hour The determination of the effectiveness of the TFP results would benefit from having alternative productivity measures for comparison. The Postal Service has used Deliveries per Total Workhour (DPTWH) for its national productivity measurement. In fact, the Postal Service has replaced TFP with DPTWH as their primary national productivity indicator for planning purposes.
While DPTWH does have some merits, it does not include several of the key features of a TFP based measurement. DPTWH does not include Materials or Capital impact on inputs. It does not directly factor in the influence of changes in Weighted Mail Volume or Miscellaneous Output. It also does not reflect the recent significant substitution of non-career employee use (at a lower wage rate) for career employees in Clerk / Mail Handler and City Carrier operations.
The TFP data set contains the elements to calculate the deliveries per hour using several different methodologies. The graph below shows the Total Output per Network as a results indicator. In simple terms, the graph shows the relationship of Weighted Mail Volume and Miscellaneous Output relative to the Possible Deliveries. This relationship could be used as a new definition of Workload to as an alternative basis for a TFP calculation. This methodology will be evaluated in the Report 2.
Figure 55: Total Output per Delivery

Measuring Postal Service Efficiency Final Report
Northwest Postal Consulting Page 67
The following two graphs use the TFP database to calculate the Total Pieces per Delivery Point and the Deliveries per Total Work Hours. These align with the methodology currently reported by the Postal Service.
Figure 56: Pieces per Delivery Point per Day

Measuring Postal Service Efficiency Final Report
Northwest Postal Consulting Page 68
Figure 57: Deliveries per Total Workhour
There are additional metrics that could be developed based on the Mail Product data available in the TFP database. Of specific interest is the relationship of packages on productivity. Report 2 will investigate the impact of specific Mail Product trends on both TFP and with a Delivery per Hour approach.

Measuring Postal Service Efficiency Final Report
Northwest Postal Consulting Page 69
IV. Relevance of TFP Model Results
Coming into this analysis, there were several questions about TFP in terms of its relevance as a productivity measure. The following questions are used to evaluate the relevance of TFP. This evaluation is supported by the analysis and results provided in the previous sections. The responses to these questions are further detailed in the analysis of Report 2.
1. Is the model complete and accurate? At this point, the answer is yes.
• The model is comprehensive in that it accounts for all of the inputs in the form of the audited accounting costs of the Postal Service. These are placed into the “buckets” of Labor, Capital and Materials.
• All of the meaningful outputs in the form of mail volume and miscellaneous services weighted by CRA costs along with a factor for delivery are included.
• The impact of Possible Deliveries is weighed against the output of mail volume and miscellaneous products and services.
• The methodology follows economic standards and processes.
• The validation process did not identify any process or calculation issues that impact the accuracy or completeness of the results.
• There are no factors or inputs that are missing from the methodology.
In short, the model appears to do what it was designed to do. It takes all of the inputs and outputs and develops a measure of total productivity. That said, there appears to be ways in which the model could be incrementally improved. These are presented in the follow section of Potential Changes to TFP Methodology.
2. Is the model relevant? Relevance refers to how well the model measures Postal Service productivity. In short, the answer is “yes”.
• It provides a complete picture of postal productivity in that it comprehensively accounts for all of the inputs and outputs of the Postal Service.
• The model is more relevant than just the source of a single productivity measure. As illustrated throughout this report and the analytical results that can be generated from the data, the TFP process can provide useful insights on what is underlying the productivity performance and postal finances as a whole.
• For instance, data depicting employee mix illustrate important changes in labor usage and costs as less expensive non-career employees are substituted for more expensive career employees. TFP results reflect this shift in labor resource utilization.

Measuring Postal Service Efficiency Final Report
Northwest Postal Consulting Page 70
• The graphs describing capital illustrate the impact of various programs such as BCS and FCS implementation. It also shows the recent efforts to begin replacing the carrier vehicle fleet. However, as the capital process, in simple terms, reflects the current value that the capital inventory brings to operations, it does not have a significant impact on the TPH result. Instead, the saving generated from capital, such as automation, are reflected in the Labor input results.
• In terms of output, the gradual growth of the of the delivery network are highlighted against the declines of weighted mail volume due to the recent recession, electronic diversion and the continued growth of workshare. The relationship between mail volume and possible deliveries is examined in detail in Report 2.
3. Is the model transparent? One of the main goals of the PRC is transparency in the reporting of Postal Service information. With that in mind, the answer is “no” as to whether the model is transparent.
• First, the complexity and sophistication of the modeling tools obscure most forms of a straightforward analysis. For instance, the TFP results are reported as growth rates from one year to the next using logarithms.
• There is no documentation that clearly explains how TFP is calculated or how it works.
• There is no documentation that explains when and how calculation methodologies change as new labor categories are implemented or, on the output side, as products change.
• The results are not prepared in a manner that makes them readily useful or meaningful. Instead, the focus is on a single number while the underlying details can tell the productivity story as the tables show in the Appendix 1. The published report is close to 100 Excel worksheets covering disjointed periods of years. There are no formulas to allow an analyst to follow the calculation process. Terms such as Quantity, Value, and Price are not documented.
• There are very useful data sets and results buried in the TFP methodology. The majority of the effort on creating Report 1 has been having to turn a set of disjointed, inconsistent excel reports of numbers into the results presented here.
• Finally, TFP is widely accepted and referenced each year in the Annual Report. Yet how it is calculated beyond a general conceptual level is not widely understood.

Measuring Postal Service Efficiency Final Report
Northwest Postal Consulting Page 71
V. Potential Changes to TFP Methodology While our conclusion is favorable regarding the completeness and accuracy of the TFP, there are potential changes that could make the make the model more useful as a reporting tool. These potential changes relate to how TFP is calculated, how the results are used in management and oversight processes, and how some of the calculations might be simplified. These potential changes in the model are described in this section.
Northwest Postal Consulting has developed a model that calculates TFP. It follows the principles and methodology of Christensen’s TFP model to the extent possible. In order to distinguish the two models, this paper will use the term “NWPC TFP Model” to specifically identify the model developed for scenario analysis. A baseline result from the NWPC TFP Model will be used for comparison to scenarios where appropriate. This baseline will identify any differences between the published results and the NWPC TFP Model results.
1. Improve the Reporting & Use of Results The TFP results are only used to provide a couple of paragraphs in Annual Reports or special studies. It should be clear from this report that TFP could provide the basis for a much broader understanding of Postal Service productivity performance. The results could lead to better insight into other process. However, this would require the following actions:
1. Improve the reports showing information on inputs, outputs, and results. The results in this report provide a good starting point to demonstrate the value of the TFP process.
2. Examine measuring year-to-year productivity improvements by the traditional percentage comparison as compared to a logarithmic approach. This would make it consistent with other management reporting processes.
3. One of the goals in the development of the model would be to determine if a simplified approach is appropriate. Generally speaking, there is no way to substantially simplify the TFP methodology. Instead, there should be better documentation and a process to educate interested parties on TFP. This is essentially the transparency issue discussed in the previous section. However, there are some methodology adjustments that could take out minor factors.
4. This understanding and presentation of TFP could use the same types of data, but aim to consolidate, simplify, and publish the results in an effective manner. The objective would be to make the productivity measurement more effective through this simplification. This new model would have the following objectives:
a. Highlight responsiveness to recent changes in underlying or exogenous factors.
b. Segregate those factors that are more directly controllable by the Postal Service versus non-controllable factors for further analysis.
c. Relate more directly to the annual plan and compliance review processes.
d. Insure the model is immune from manipulation such as intentionally realigning assignment of inputs to affect the results
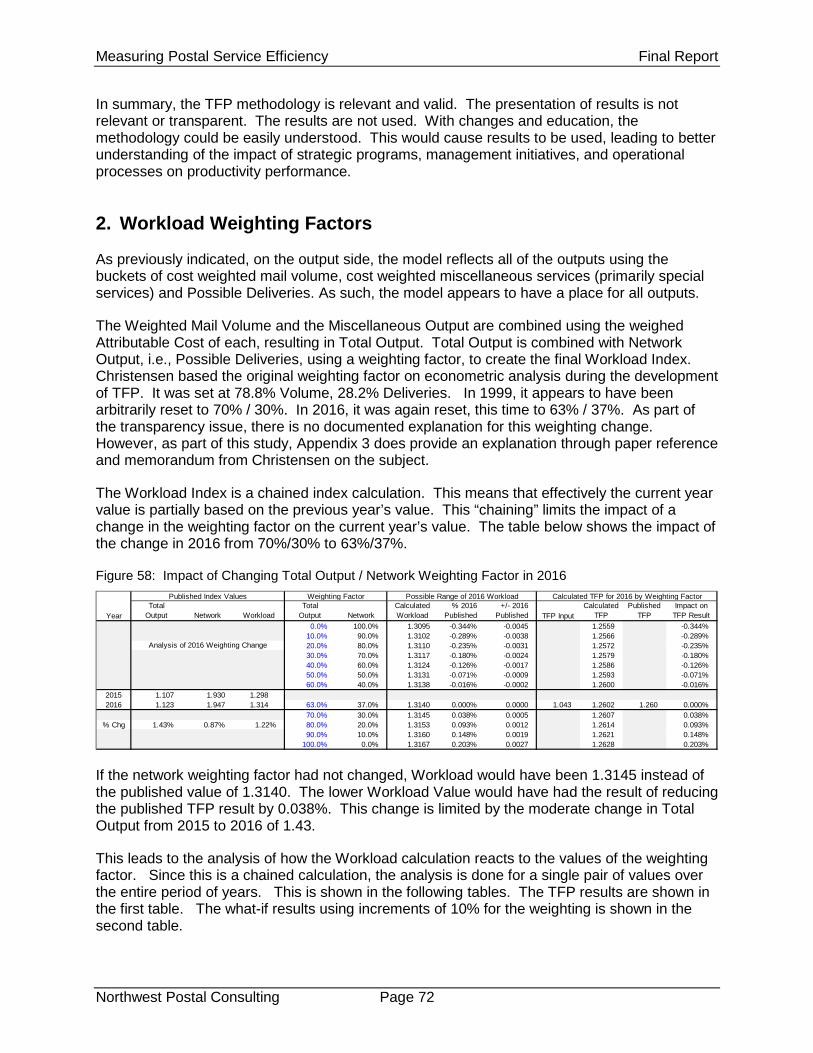
Measuring Postal Service Efficiency Final Report
Northwest Postal Consulting Page 72
In summary, the TFP methodology is relevant and valid. The presentation of results is not relevant or transparent. The results are not used. With changes and education, the methodology could be easily understood. This would cause results to be used, leading to better understanding of the impact of strategic programs, management initiatives, and operational processes on productivity performance.
2. Workload Weighting Factors As previously indicated, on the output side, the model reflects all of the outputs using the buckets of cost weighted mail volume, cost weighted miscellaneous services (primarily special services) and Possible Deliveries. As such, the model appears to have a place for all outputs.
The Weighted Mail Volume and the Miscellaneous Output are combined using the weighed Attributable Cost of each, resulting in Total Output. Total Output is combined with Network Output, i.e., Possible Deliveries, using a weighting factor, to create the final Workload Index. Christensen based the original weighting factor on econometric analysis during the development of TFP. It was set at 78.8% Volume, 28.2% Deliveries. In 1999, it appears to have been arbitrarily reset to 70% / 30%. In 2016, it was again reset, this time to 63% / 37%. As part of the transparency issue, there is no documented explanation for this weighting change. However, as part of this study, Appendix 3 does provide an explanation through paper reference and memorandum from Christensen on the subject.
The Workload Index is a chained index calculation. This means that effectively the current year value is partially based on the previous year’s value. This “chaining” limits the impact of a change in the weighting factor on the current year’s value. The table below shows the impact of the change in 2016 from 70%/30% to 63%/37%.
Figure 58: Impact of Changing Total Output / Network Weighting Factor in 2016
If the network weighting factor had not changed, Workload would have been 1.3145 instead of the published value of 1.3140. The lower Workload Value would have had the result of reducing the published TFP result by 0.038%. This change is limited by the moderate change in Total Output from 2015 to 2016 of 1.43.
This leads to the analysis of how the Workload calculation reacts to the values of the weighting factor. Since this is a chained calculation, the analysis is done for a single pair of values over the entire period of years. This is shown in the following tables. The TFP results are shown in the first table. The what-if results using increments of 10% for the weighting is shown in the second table.
Published Index Values Possible Range of 2016 Workload
YearTotal
Output Network WorkloadTotal
Output NetworkCalculated Workload
% 2016 Published
+/- 2016 Published TFP Input
Calculated TFP
Published TFP
Impact on TFP Result
0.0% 100.0% 1.3095 -0.344% -0.0045 1.2559 -0.344%10.0% 90.0% 1.3102 -0.289% -0.0038 1.2566 -0.289%20.0% 80.0% 1.3110 -0.235% -0.0031 1.2572 -0.235%30.0% 70.0% 1.3117 -0.180% -0.0024 1.2579 -0.180%40.0% 60.0% 1.3124 -0.126% -0.0017 1.2586 -0.126%50.0% 50.0% 1.3131 -0.071% -0.0009 1.2593 -0.071%60.0% 40.0% 1.3138 -0.016% -0.0002 1.2600 -0.016%
2015 1.107 1.930 1.2982016 1.123 1.947 1.314 63.0% 37.0% 1.3140 0.000% 0.0000 1.043 1.2602 1.260 0.000%
70.0% 30.0% 1.3145 0.038% 0.0005 1.2607 0.038%% Chg 1.43% 0.87% 1.22% 80.0% 20.0% 1.3153 0.093% 0.0012 1.2614 0.093%
90.0% 10.0% 1.3160 0.148% 0.0019 1.2621 0.148%100.0% 0.0% 1.3167 0.203% 0.0027 1.2628 0.203%
Analysis of 2016 Weighting Change
Weighting Factor Calculated TFP for 2016 by Weighting Factor

Measuring Postal Service Efficiency Final Report
Northwest Postal Consulting Page 73
Figure 59: Workload Results with Weighting Factor
Total Output, Network and Workload Indexes(indexes based to 1.0 in 1972)
YearTotal
Output Network WorkloadTotal
Output Network WorkloadTotal
Output Network1963 0.842 0.811 0.8361964 0.851 0.830 0.847 1.07 2.26 1.32 78.8% 21.2%1965 0.865 0.852 0.863 1.65 2.63 1.86 78.8% 21.2%1966 0.913 0.879 0.905 5.33 3.06 4.85 78.8% 21.2%1967 0.953 0.899 0.942 4.37 2.27 3.92 78.8% 21.2%1968 0.973 0.917 0.961 2.03 2.04 2.03 78.8% 21.2%1969 0.991 0.935 0.979 1.81 1.92 1.83 78.8% 21.2%1970 1.007 0.952 0.995 1.65 1.82 1.69 78.8% 21.2%1971 1.022 0.974 1.012 1.48 2.22 1.63 78.8% 21.2%1972 1.000 1.000 1.000 -2.19 2.67 -1.16 78.8% 21.2%1973 1.014 1.026 1.017 1.41 2.59 1.66 78.8% 21.2%1974 1.010 1.064 1.021 -0.41 3.58 0.44 78.8% 21.2%1975 0.990 1.083 1.009 -1.96 1.79 -1.17 78.8% 21.2%1976 0.955 1.096 0.983 -3.67 1.17 -2.64 78.8% 21.2%1977 0.969 1.123 1.000 1.50 2.51 1.71 78.8% 21.2%1978 0.990 1.145 1.021 2.08 1.93 2.05 78.8% 21.2%1979 0.983 1.175 1.021 -0.63 2.58 0.05 78.8% 21.2%1980 1.003 1.201 1.042 2.00 2.18 2.04 78.8% 21.2%1981 0.999 1.218 1.042 -0.41 1.37 -0.03 78.8% 21.2%1982 0.982 1.236 1.031 -1.74 1.46 -1.06 78.8% 21.2%1983 1.002 1.255 1.051 2.00 1.57 1.91 78.8% 21.2%1984 1.068 1.282 1.110 6.39 2.08 5.48 78.8% 21.2%1985 1.113 1.309 1.152 4.15 2.11 3.72 78.8% 21.2%1986 1.156 1.329 1.191 3.79 1.54 3.31 78.8% 21.2%1987 1.198 1.360 1.231 3.57 2.28 3.29 78.8% 21.2%1988 1.235 1.386 1.266 3.03 1.92 2.79 78.8% 21.2%1989 1.238 1.409 1.272 0.21 1.59 0.50 78.8% 21.2%1990 1.281 1.432 1.312 3.48 1.62 3.08 78.8% 21.2%1991 1.279 1.451 1.314 -0.15 1.33 0.16 78.8% 21.2%1992 1.282 1.469 1.320 0.25 1.22 0.45 78.8% 21.2%1993 1.317 1.488 1.352 2.68 1.30 2.39 78.8% 21.2%1994 1.367 1.510 1.396 3.72 1.48 3.24 78.8% 21.2%1995 1.382 1.533 1.413 1.07 1.48 1.16 78.8% 21.2%1996 1.403 1.555 1.434 1.51 1.47 1.50 78.8% 21.2%1997 1.449 1.575 1.475 3.26 1.27 2.84 78.8% 21.2%1998 1.488 1.597 1.509 2.63 1.34 2.25 70.0% 30.0%1999 1.529 1.619 1.544 2.68 1.42 2.31 70.0% 30.0%2000 1.560 1.645 1.573 2.01 1.55 1.87 70.0% 30.0%2001 1.539 1.667 1.565 -1.33 1.33 -0.53 70.0% 30.0%2002 1.489 1.690 1.535 -3.30 1.39 -1.89 70.0% 30.0%2003 1.466 1.715 1.525 -1.56 1.45 -0.65 70.0% 30.0%2004 1.486 1.738 1.546 1.37 1.34 1.36 70.0% 30.0%2005 1.515 1.765 1.575 1.92 1.55 1.81 70.0% 30.0%2006 1.521 1.792 1.586 0.36 1.50 0.70 70.0% 30.0%2007 1.507 1.818 1.582 -0.92 1.43 -0.22 70.0% 30.0%2008 1.438 1.838 1.536 -4.70 1.10 -2.96 70.0% 30.0%2009 1.270 1.853 1.412 -12.41 0.84 -8.43 70.0% 30.0%2010 1.208 1.866 1.366 -5.01 0.67 -3.31 70.0% 30.0%2011 1.180 1.877 1.346 -2.33 0.57 -1.46 70.0% 30.0%2012 1.141 1.888 1.317 -3.34 0.60 -2.16 70.0% 30.0%2013 1.125 1.899 1.307 -1.44 0.60 -0.83 70.0% 30.0%2014 1.100 1.914 1.290 -2.21 0.80 -1.31 70.0% 30.0%2015 1.107 1.930 1.298 0.61 0.80 0.66 70.0% 30.0%2016 1.123 1.947 1.314 1.42 0.87 1.21 63.0% 37.0%
Growth Rates (%) Weighting Factor

Measuring Postal Service Efficiency Final Report
Northwest Postal Consulting Page 74
Figure 60: Sensitivity Analysis of Workload Weighting Factor
These results are shown in the following two graphs. One is the Workload based on the weighting increments in the table above. The second shows the impact on TFP based on these increments.
Published Wokrload Result if Weighted Used from Base Year without Change78.80% 70% 63% 100% 90% 80% 70% 60% 50% 40% 30% 20% 10% 0%
Year 21.20% 30% 37% 0% 10% 20% 30% 40% 50% 60% 70% 80% 90% 100%1963196419651966196719681969197019711972 1.000 1.000 1.000 1.000 1.000 1.000 1.000 1.000 1.000 1.000 1.000 1.0001973 1.017 1.014 1.015 1.017 1.018 1.019 1.020 1.021 1.023 1.024 1.025 1.0261974 1.021 1.010 1.015 1.021 1.026 1.031 1.037 1.042 1.047 1.053 1.058 1.0641975 1.009 0.990 0.999 1.008 1.017 1.026 1.036 1.045 1.054 1.064 1.073 1.0831976 0.983 0.955 0.968 0.981 0.995 1.009 1.023 1.037 1.051 1.066 1.081 1.0961977 1.000 0.969 0.984 0.998 1.013 1.028 1.043 1.059 1.075 1.091 1.107 1.1231978 1.021 0.990 1.004 1.019 1.034 1.049 1.065 1.080 1.096 1.112 1.129 1.1451979 1.021 0.983 1.001 1.019 1.037 1.056 1.075 1.094 1.114 1.134 1.155 1.1751980 1.042 1.003 1.021 1.040 1.059 1.078 1.098 1.118 1.138 1.159 1.180 1.2011981 1.042 0.999 1.019 1.039 1.060 1.081 1.103 1.125 1.148 1.171 1.194 1.2181982 1.031 0.982 1.005 1.028 1.052 1.076 1.102 1.127 1.153 1.180 1.208 1.2361983 1.051 1.002 1.025 1.048 1.072 1.096 1.121 1.147 1.173 1.200 1.227 1.2551984 1.110 1.068 1.088 1.108 1.128 1.149 1.170 1.191 1.213 1.236 1.258 1.2821985 1.152 1.113 1.131 1.150 1.169 1.188 1.207 1.227 1.247 1.267 1.288 1.3091986 1.191 1.156 1.172 1.189 1.206 1.222 1.240 1.257 1.275 1.293 1.311 1.3291987 1.231 1.198 1.213 1.229 1.245 1.260 1.276 1.293 1.309 1.326 1.343 1.3601988 1.266 1.235 1.249 1.264 1.279 1.293 1.308 1.324 1.339 1.355 1.370 1.3861989 1.272 1.238 1.254 1.270 1.287 1.303 1.320 1.338 1.355 1.373 1.391 1.4091990 1.312 1.281 1.296 1.310 1.325 1.339 1.354 1.370 1.385 1.400 1.416 1.4321991 1.314 1.279 1.296 1.312 1.329 1.345 1.362 1.380 1.397 1.415 1.433 1.4511992 1.320 1.282 1.300 1.318 1.336 1.354 1.372 1.391 1.410 1.429 1.449 1.4691993 1.352 1.317 1.334 1.350 1.366 1.383 1.400 1.417 1.435 1.452 1.470 1.4881994 1.396 1.367 1.381 1.395 1.409 1.423 1.437 1.451 1.466 1.480 1.495 1.5101995 1.413 1.382 1.396 1.411 1.426 1.440 1.455 1.470 1.486 1.501 1.517 1.5331996 1.434 1.403 1.417 1.432 1.447 1.462 1.477 1.492 1.508 1.524 1.539 1.5551997 1.475 1.449 1.462 1.474 1.486 1.498 1.511 1.524 1.536 1.549 1.562 1.5751998 1.509 1.488 1.499 1.509 1.520 1.531 1.541 1.552 1.563 1.574 1.585 1.5971999 1.544 1.529 1.537 1.546 1.555 1.564 1.573 1.582 1.592 1.601 1.610 1.6192000 1.573 1.560 1.568 1.576 1.585 1.593 1.602 1.610 1.619 1.627 1.636 1.6452001 1.565 1.539 1.551 1.564 1.576 1.589 1.602 1.614 1.627 1.640 1.653 1.6672002 1.535 1.489 1.508 1.527 1.547 1.566 1.586 1.607 1.627 1.648 1.669 1.6902003 1.525 1.466 1.489 1.513 1.537 1.561 1.586 1.611 1.636 1.662 1.688 1.7152004 1.546 1.486 1.510 1.534 1.558 1.582 1.607 1.633 1.658 1.684 1.711 1.7382005 1.575 1.515 1.538 1.562 1.586 1.611 1.635 1.661 1.686 1.712 1.738 1.7652006 1.586 1.521 1.546 1.571 1.597 1.624 1.651 1.678 1.706 1.734 1.763 1.7922007 1.582 1.507 1.535 1.564 1.594 1.624 1.655 1.686 1.718 1.751 1.784 1.8182008 1.536 1.438 1.473 1.510 1.547 1.586 1.625 1.666 1.707 1.750 1.793 1.8382009 1.412 1.270 1.319 1.370 1.422 1.477 1.534 1.593 1.655 1.718 1.785 1.8532010 1.366 1.208 1.261 1.317 1.376 1.437 1.501 1.568 1.638 1.710 1.786 1.8662011 1.346 1.180 1.236 1.295 1.356 1.420 1.488 1.559 1.633 1.710 1.791 1.8772012 1.317 1.141 1.200 1.262 1.327 1.396 1.468 1.544 1.623 1.707 1.795 1.8882013 1.307 1.125 1.185 1.249 1.316 1.387 1.462 1.540 1.623 1.710 1.802 1.8992014 1.290 1.100 1.163 1.229 1.299 1.373 1.451 1.534 1.621 1.714 1.811 1.9142015 1.298 1.107 1.170 1.237 1.308 1.382 1.462 1.545 1.633 1.727 1.825 1.9302016 1.314 1.123 1.186 1.253 1.324 1.399 1.478 1.562 1.650 1.744 1.842 1.947
-14.57% -9.73% -4.62% 0.77% 6.48% 12.50% 18.87% 25.59% 32.70% 40.21% 48.14%

Measuring Postal Service Efficiency Final Report
Northwest Postal Consulting Page 75
Figure 61: Impact of Weighting Total Output versus Network on Resulting Workload Index
Figure 62: Impact of Weighting Total Output versus Network on TFP Result

Measuring Postal Service Efficiency Final Report
Northwest Postal Consulting Page 76
The outputs utilize weighted mail volume by using PRC approved attributable costs and miscellaneous output (primarily special services - including P. O. Boxes) plus a factor for the delivery network. In a TFP measure that is designed to be all-inclusive, this list of outputs appears to be “relevant” in attempting to account for all of the outputs.
There are a couple of areas that bear further examination. The current weighting of the delivery network utilizes an entirely separate methodology, compared to the rest of the outputs. It also adjusted sporadically in rather large increments relative to the more gradual continuous adjustments for Output. In addition, the PRC staff has raised concerns about intra-product movements that are not accounted for along with the thought that delivery expansion might occur disproportionately to lower delivery cost options.
The exploration of these topics is addressed in detail in Report 2. This discussion in Report 2 will include an alternative of delivery point weighting using the CRA delivery institutional costs. This alternative may be a more analytical means to weight delivery points.
3. Workhour Composition of Labor Factor One factor used in the Labor Input methodology is a “composition of labor input” factor to incorporate experience level into the productivity measurement. This factor segments employees into a number of groups based on increments of five years of employment. However, years of seniority may not be a significant factor in productivity performance in the environment of postal operations. The number of years of employment does determine salary level, based on the step structure. However, an employee will “top out” in the salary structure in the second experience group, distorting the impact of wage rate through the factor. The detailed explanation of the Composition of Labor factor as provided in the PRC methodology paper 2 is shown in Figure 63.
The value of the composition factor had shown almost no variation over the 54 years of history of its use. It also appears that this composition index has little impact on TFP results. However, the factor did make very large changes in value in 2016 for the first time. Since this Index is calculated in a separate process, the reason behind this large change cannot be validated for this report.
2 Page 11, Formulas for Total Factor Productivity, Labor Productivity, Postal Inflation, and the Aggregate Labor Price Index, Electronic Attachment to Postal Service Response to MPA/USPS-T2-3.b, Filed 6/23/2010.

Measuring Postal Service Efficiency Final Report
Northwest Postal Consulting Page 77
Figure 63: Explanation of Composition of Labor Input
This composition factor appears to add undue complexity to the methodology, possibly even distorting results. The NWPC TFP Model will be used to quantify the impact of removing the Composition of Labor factor. This is designated as Scenario 1. The result of removing it is shown in the Figure 64 as Scenario 1 (as the green line).
The Baseline model is compared to the Published Results to validate the accuracy of the model. For the Labor Input, the NWPC TFP model is almost identical to the Published Results, indicating the model is accurate.
Then, Scenario 1 is run without using the labor composition factor and compared to the Baseline model. The results of Scenario 1 compared to the Baseline model confirm that the Composition of Labor Index has had negligible impact on the Labor Quantity until the past five (5) years. However, a large change in the factor in 2016 did have an observable impact.
Measuring Postal Service Efficiency Final Report
Northwest Postal Consulting Page 78
Finally, the elimination of the Composition of Labor factor would allow the Labor Index to be calculated using readily available accounting data rather than the special reports necessary to categorize effectively all of the Postal Service employees into 5-year seniority groupings. This could lead to inclusion of the cost weighted workhours into ongoing management processes. For example, Deliveries per Hour could be based on a TFP oriented Input rather than just unadjusted workhours.
4. Inclusion of a Wage Rate Factor The Composition of Labor is in some ways a proxy for wage rate. The wage rate is not directly included as an underlying factor. It is, instead, reflected in the Value component as total dollars. One question about TFP effectiveness concerns how it reflects changes in both wage rates, especially in regards to the substitution of career employees with non-career employees. Stated differently, does the methodology account for the substitution of higher wage employees for lower wage employees that perform the same work?
The Postal Service has used this strategy in operations over the past six years through collective bargaining changes. For example, Clerk non-career hours have moved from 3.1% of total Clerk / Mail Handler hours in 2010 to 14.1% in 2016. The non-career Clerk wage rate ratio to a full-time Clerk career wage rate for 2016 is 0.422.
An analysis was done for Clerks / Mail Handlers from 2005 through 2016 to examine the impact of the wage rate and the change from career to non-career employees. This data is shown as Figure 65 and Figure 66.
A key question is how well TFP reacts to these changes in wage rates and changes in the number of hours by employee category, i.e., career versus non-career. The analysis for Clerks / Mail Handlers was done to examine this question.
As an alternative methodology to provide another measure of productivity comparison, the example calculates a “Current Year Indexed Workhours”. This method uses the Clerk Full-time wage rate as a base to index the other employee category wages rates within the same year. For example, a non-career Mail Handler is 0.376 of a Full-time clerk wage rate in 2016. By multiplying the workhours by this index, an “Indexed Workhour” metric can be created.
Figure 66 shows the results of this analysis. Using the simple percentage change calculation, the results show that workhours were -33.7% from 2005 to 2016. The Indexed Workhours were -36.5%, showing that the increased use of lower wage employees did have an observable impact. The Published TFP Quantity showed -39.3%, confirming that the changes in hour mix and wage rate are reflected in the methodology. The NWPC TFP Model Scenario 1, removing the Composition factor, showed -37.6%. Given the significant change in the Composition factor in the past several years, as stated previously, further analysis of HAT results is needed to further explain the difference.
This analysis documents that in general terms, wage rates and hour mix are reflected in the TFP Labor Index results. The Report 2 process provides additional analysis of this issue.

Measuring Postal Service Efficiency Final Report
Northwest Postal Consulting Page 79
Figure 64: NWPC TFP Model Results - Scenarios 1, 2 & 3 as Compared to Baseline / Published

Measuring Postal Service Efficiency Final Report
Northwest Postal Consulting Page 80
Figure 65: Analysis of Labor Quantity Methodology – Clerks / Mail Handlers 2005 - 2016
Analysis of Labor Quantity - Clerks / Mail Handlers - 2005 to 2016
Clerks MailhandlersFull-time Part Time Full-time Part Time Total Career
Year HoursCompIndex
Value -Dollars Hours
CompIndex
Value -Dollars Hours
Value -Dollars Hours
CompIndex
Value -Dollars Hours
CompIndex
Value -Dollars Hours
CompIndex
Value -Dollars Hours
Value -Dollars
Souce Data2005 323.1 1.008 12656.2 77.8 1.007 2654.0 37.8 548.6 95.7 1.006 3590.0 9.5 1.022 284.7 11.9 160.12006 317.5 1.008 13006.9 79.8 0.998 2794.5 32.1 471.4 98.1 1.004 3841.3 10.2 1.008 308.4 12.3 173.62007 298.4 1.006 12766.4 71.0 1.001 2674.3 30.5 469.7 97.5 1.001 4017.1 9.2 1.002 295.7 12.4 187.52008 291.4 1.002 12749.7 51.6 1.008 2041.1 26.3 413.5 93.3 0.997 3961.9 7.5 0.984 242.4 10.2 156.02009 263.5 1.002 12369.5 43.3 1.011 1871.2 14.4 232.7 85.0 0.998 3905.4 5.7 0.999 214.3 4.4 67.72010 232.2 1.004 11080.1 40.5 1.020 1792.1 11.4 174.1 80.3 1.001 3775.4 5.1 1.020 208.3 3.4 47.92011 221.0 1.005 11014.4 36.4 1.031 1707.4 13.1 212.8 78.2 1.006 3890.5 4.8 1.047 218.2 5.5 81.32012 218.9 1.005 11135.2 21.2 1.038 1028.1 23.2 473.9 75.0 1.009 3888.4 4.1 1.076 199.6 8.0 120.92013 197.6 1.005 10340.4 19.7 1.037 976.2 38.4 821.9 70.5 1.009 3710.3 2.4 1.068 121.8 12.6 214.62014 190.0 1.000 10012.2 19.0 1.032 942.4 41.4 907.1 70.0 1.015 3663.2 15.8 294.92015 197.3 0.992 10306.5 24.7 1.032 1061.9 46.0 1000.8 69.7 1.005 3674.6 16.1 304.32016 200.2 0.972 10561.9 28.9 1.032 1210.4 51.9 1155.0 71.2 0.976 3764.8 16.3 324.4
Share of Hours / Wage Rate2005 58.1% $ 39.17 14.0% $ 34.09 6.8% $ 14.51 17.2% $ 37.53 1.7% $ 29.92 2.1% $ 13.432006 57.7% $ 40.97 14.5% $ 35.00 5.8% $ 14.70 17.8% $ 39.16 1.9% $ 30.16 2.2% $ 14.162007 57.5% $ 42.78 13.7% $ 37.68 5.9% $ 15.40 18.8% $ 41.21 1.8% $ 32.29 2.4% $ 15.112008 60.7% $ 43.76 10.7% $ 39.56 5.5% $ 15.73 19.4% $ 42.46 1.6% $ 32.19 2.1% $ 15.312009 63.3% $ 46.95 10.4% $ 43.17 3.4% $ 16.20 20.4% $ 45.94 1.4% $ 37.38 1.1% $ 15.342010 62.3% $ 47.72 10.9% $ 44.20 3.1% $ 15.29 21.5% $ 47.03 1.4% $ 40.56 0.9% $ 14.212011 61.6% $ 49.83 10.1% $ 46.85 3.6% $ 16.24 21.8% $ 49.73 1.3% $ 45.36 1.5% $ 14.832012 62.5% $ 50.87 6.1% $ 48.46 6.6% $ 20.46 21.4% $ 51.88 1.2% $ 49.00 2.3% $ 15.152013 57.9% $ 52.34 5.8% $ 49.57 11.3% $ 21.41 20.7% $ 52.63 0.7% $ 50.26 3.7% $ 16.982014 56.5% $ 52.70 5.7% $ 49.50 12.3% $ 21.89 20.8% $ 52.34 4.7% $ 18.722015 55.8% $ 52.22 7.0% $ 42.96 13.0% $ 21.76 19.7% $ 52.71 4.5% $ 18.952016 54.3% $ 52.75 7.8% $ 41.83 14.1% $ 22.25 19.3% $ 52.85 4.4% $ 19.85
Index Hours = Hours / Index of Clerks FT Wage Rate Base to Category Wage Rate2005 323.1 1.000 67.8 0.870 14.0 0.371 91.7 0.958 7.3 0.764 4.1 0.3432006 317.5 1.000 68.2 0.854 11.5 0.359 93.8 0.956 7.5 0.736 4.2 0.3462007 298.4 1.000 62.5 0.881 11.0 0.360 93.9 0.963 6.9 0.755 4.4 0.3532008 291.4 1.000 46.6 0.904 9.4 0.359 90.5 0.970 5.5 0.736 3.6 0.3502009 263.5 1.000 39.9 0.920 5.0 0.345 83.2 0.979 4.6 0.796 1.4 0.3272010 232.2 1.000 37.6 0.926 3.6 0.321 79.1 0.986 4.4 0.850 1.0 0.2982011 221.0 1.000 34.3 0.940 4.3 0.326 78.1 0.998 4.4 0.910 1.6 0.2982012 218.9 1.000 20.2 0.953 9.3 0.402 76.4 1.020 3.9 0.963 2.4 0.2982013 197.6 1.000 18.7 0.947 15.7 0.409 70.9 1.006 2.3 0.960 4.1 0.3242014 190.0 1.000 17.9 0.939 17.2 0.415 69.5 0.993 5.6 0.3552015 197.3 1.000 20.3 0.823 19.2 0.417 70.4 1.009 5.8 0.3632016 200.2 1.000 22.9 0.793 21.9 0.422 71.4 1.002 6.2 0.376
Non-CareerNon-Career

Measuring Postal Service Efficiency Final Report
Northwest Postal Consulting Page 81
Figure 66: Analysis of Labor Quantity Methodology – Clerks / Mail Handlers 2005 - 2016
Analysis of Labor Quantity - Clerks / Mail Handlers - 2005 to 2016
Clerks and Mailhandlers Removed Current Yr Both Clerks and Mailhandlers Removed Current Yr BothComp Index Weighting Comp Index Weighting
Year HoursIndexed
HoursValue -Dollars
Wage Rate
Published Quantity
Model 1 Quantity
Model 2 Quantity
Model 3 Quantity Hours
Indexed Hours
Value -Dollars
Wage Rate
Published Quantity
Model 1 Quantity
Model 2 Quantity
Model 3 Quantity
Quantity Indexed to 20052005 555.9 19893.5 $ 35.79 3337.2 3280.8 3476.5 3413.4 1.000 1.000 1.000 1.000 1.000 1.000 1.0002006 550.0 20596.1 $ 37.45 3311.7 3261.1 3451.8 3394.8 0.989 0.990 1.035 0.992 0.994 0.993 0.9952007 518.9 20410.7 $ 39.33 3119.5 3075.7 3252.9 3203.3 0.934 0.939 1.026 0.935 0.937 0.936 0.9382008 480.3 19564.6 $ 40.73 2903.4 2870.5 3040.1 3002.4 0.864 0.880 0.983 0.870 0.875 0.874 0.8802009 416.3 18660.7 $ 44.82 2572.6 2542.3 2704.7 2669.8 0.749 0.783 0.938 0.771 0.775 0.778 0.7822010 372.9 17077.9 $ 45.80 2318.1 2284.5 2439.0 2401.0 0.671 0.705 0.858 0.695 0.696 0.702 0.7032011 359.1 17124.5 $ 47.69 2221.8 2182.0 2339.8 2295.4 0.646 0.677 0.861 0.666 0.665 0.673 0.6722012 350.3 16846.0 $ 48.09 2120.8 2080.1 2267.5 2221.9 0.630 0.652 0.847 0.635 0.634 0.652 0.6512013 341.2 16185.1 $ 47.44 1986.3 1947.9 2143.9 2100.4 0.614 0.609 0.814 0.595 0.594 0.617 0.6152014 336.2 15819.7 $ 47.06 1922.3 1892.3 2078.1 2042.7 0.605 0.591 0.795 0.576 0.577 0.598 0.5982015 353.8 16348.0 $ 46.20 1997.5 1981.4 2161.4 2140.8 0.637 0.616 0.822 0.599 0.604 0.622 0.6272016 368.7 17016.5 $ 46.16 2025.3 2047.3 2193.5 2213.7 0.663 0.635 0.855 0.607 0.624 0.631 0.649
Comparison to Published Quantity % Change (Common Formula)2005 -1.69% 4.17% 2.28%2006 -1.53% 4.23% 2.51% -1.1% -1.0% 3.5% 4.6% -0.8% -0.6% -0.7% -0.5%2007 -1.40% 4.28% 2.69% -5.6% -5.1% -0.9% 5.0% -5.8% -5.7% -5.8% -5.6%2008 -1.13% 4.71% 3.41% -7.4% -6.3% -4.1% 3.6% -6.9% -6.7% -6.5% -6.3%2009 -1.18% 5.13% 3.78% -13.3% -11.1% -4.6% 10.0% -11.4% -11.4% -11.0% -11.1%2010 -1.45% 5.21% 3.57% -10.4% -10.0% -8.5% 2.2% -9.9% -10.1% -9.8% -10.1%2011 -1.79% 5.31% 3.31% -3.7% -4.0% 0.3% 4.1% -4.2% -4.5% -4.1% -4.4%2012 -1.92% 6.92% 4.77% -2.5% -3.6% -1.6% 0.8% -4.5% -4.7% -3.1% -3.2%2013 -1.94% 7.94% 5.74% -2.6% -6.6% -3.9% -1.4% -6.3% -6.4% -5.4% -5.5%2014 -1.56% 8.10% 6.26% -1.5% -2.9% -2.3% -0.8% -3.2% -2.9% -3.1% -2.7%2015 -0.81% 8.20% 7.17% 5.3% 4.3% 3.3% -1.8% 3.9% 4.7% 4.0% 4.8%2016 1.09% 8.30% 9.30% 4.2% 3.1% 4.1% -0.1% 1.4% 3.3% 1.5% 3.4%
2005 to 2016 -33.7% -36.5% -14.5% 29.0% -39.3% -37.6% -36.9% -35.1%
Calculation of Indexed Hours % Growth Rate (Logarithm formula)2005 507.92006 502.7 -1.1% -1.0% 3.5% 4.5% -0.8% -0.6% -0.7% -0.5%2007 477.1 -5.8% -5.2% -0.9% 4.9% -6.0% -5.9% -5.9% -5.8%2008 447.1 -7.7% -6.5% -4.2% 3.5% -7.2% -6.9% -6.8% -6.5%2009 397.5 -14.3% -11.8% -4.7% 9.6% -12.1% -12.1% -11.7% -11.7%2010 357.9 -11.0% -10.5% -8.9% 2.2% -10.4% -10.7% -10.3% -10.6%2011 343.6 -3.8% -4.1% 0.3% 4.0% -4.2% -4.6% -4.2% -4.5%2012 331.2 -2.5% -3.7% -1.6% 0.8% -4.7% -4.8% -3.1% -3.3%2013 309.2 -2.6% -6.8% -4.0% -1.4% -6.5% -6.6% -5.6% -5.6%2014 300.2 -1.5% -3.0% -2.3% -0.8% -3.3% -2.9% -3.1% -2.8%2015 313.0 5.1% 4.2% 3.3% -1.8% 3.8% 4.6% 3.9% 4.7%2016 322.6 4.1% 3.0% 4.0% -0.1% 1.4% 3.3% 1.5% 3.4%
2005 to 2016 -41.1% -15.6% 25.4% -49.9% -47.2% -46.1% -43.3%

Measuring Postal Service Efficiency Final Report
Northwest Postal Consulting Page 82
Figure 67: NWPC TFP Model Results – Clerk / Mail Handler Labor Index

Measuring Postal Service Efficiency Final Report
Northwest Postal Consulting Page 83
5. Symmetric 2-Year Weighting Index The Tornqvist Index formula is used to calculate the Quantity index in the TFP process. For Labor, it measures the change in the number of Composition Hours as a ratio of the Current Year divided by the Previous Year, raised to the power of the average of the percentage of cost (dollars) over the two years. This method is called a symmetric index because the percentage of cost is weighed equally in the formula. This results in a smoothing effect on the results.
One qualitative observation by managers of TFP over the years is that it does not immediately respond to changes that occurred for the year. As a potential methodological alternative, a scenario was identified to weight the ratio of hours solely on the percent of the current year’s cost. In simple terms, remove the averaging of the two years percent cost in the exponent and only use the current year. We identified this as Scenario 3 in Figure 66. Scenario 2 was the combination of removing the Composition factor and using only current year weighting.
Figure 64 shows the results from the NWPC TFP model for Scenarios 2 (orange line) and Scenario 3 (purple line). In general, the result shows a growing gap in the value over the years, but no change in the basic trend. There is no shifting of results from one year to the next, especially where significant changes in value or cost occur in a particular year.
This demonstrates that the result of the symmetric weighting does smooth the results, leading to lower values in growth. A change to current year weighting would show higher levels of growth in the TFP data set. The relative change would still follow the same trend.
The conclusion is that the symmetric weighting in the index process should not be changed. Substantial work would be required to recast results, particularly for the other Input and Output categories. Plus the implications of all of these changes would need to be fully understood before such a modification could be made. If a new TFP model were to be developed, this factor might be considered in the design.
6. Restructure Mail Volume Category Components The Mail Product Categories used for reporting are comprised of segments of the traditional Mail Classes. All of the significant mail classification changes including the PAEA realignment to Products and movement of some parcel categories from Market Dominant to Competitive Mail Classification have had implications for the TFP methodology and required significant adjustments.
In a related matter, there have been a number of presort changes that occur below the mail categories used in TFP reporting. One question about productivity is the impact of implementing detailed workshare changes over the years in a manner that would not be directly picked up by the TFP mail categories that are reporting. For example, any changes from 3-digit to 5-digit sorting are not segregated in the TFP data categories. It could potentially be problematic to gather the historical data (including the volumes of these presort categories along with the associated cost avoidances over the many years covered by TFP.

Measuring Postal Service Efficiency Final Report
Northwest Postal Consulting Page 84
It is also likely that the net impact would not be realized, as in general, the aggregation in a Tornqvist process does not readily react to different categorization of the same data. However, the different categorization might provide better analytical reports that would be useful in understanding the contribution of specific categories.
With that in mind, the NWPC TFP Model can be used to regroup the Mail Class categories to create different groupings for analysis. Two scenarios that are of interest are as follows:
• First Class into Presort and Non-Presort categories • Standard into Carrier Preparation and Sort Preparation categories.
This analysis is done in Report 2 process.
7. Create an Operations Oriented Sub-Index The Aggregate Input Index is based on the Labor, Materials, and Capital. There are two primary results indicators – Total Factor Productivity and the Labor Productivity Index. A new Operations oriented Index could be created through components of Labor and Materials.
In Labor, there are two basic groups – Operations and Indirect. Operations would comprise Clerks / Mail Handlers, City Carriers / Vehicle Service Drivers, and Rural Carriers. Maintenance Service and Vehicle Service might be included in this Operations group. All other Labor classifications could be considered Indirect.
Materials can be grouped into Transportation and Not-Transportation groupings. Transportation represents over half of the Material category. It is directly related to Operations and can be used in a more detailed analysis.
In Report 2, this “Operations Productivity Index” is created using the existing TFP data elements.
8. Change Base Year TFP covers a 54-year period. Generally, the results use 1972 as a base year. Using 1972 has some logic as it is essentially the first full year the modern Postal Service operated under the Postal Reorganization Act. At the same time, this means that all of the calculations are utilizing a 45 year-old base period with relatively less relevant interim years leading up to the present day. The Mail Volume and Miscellaneous Output Quantities were reset in 2008, resulting in some adjustment factors to transition the metrics.
In a pure chained Tornqvist index, changing the base years only shifts the value up or down. The index is based on the year-to-year changes, with a seed year setting the starting value. But TFP is a mixed metric, using both chained indexes and base year indexes.
As part of Report 2, the methodology for changing the base year to 1990 is presented. It uses a Before / After TFP Model to reset mail volume quantities to 1990 and to calculate new index combinations.

Measuring Postal Service Efficiency Final Report
Northwest Postal Consulting Page 85
VI. Summary of Report 1 Process
1. Summary of Report 1
Report 1 described the TFP model development and validation process. The TFP model and methodology was validated, with no concerns identified regarding methodology or process validity.
An important part of the report is to explain and document the model. To that end, using 2010 as an example, underlying calculations along with explanatory documentation are provided. The end result is that the reader will understand how the TFP model works. With that as a backdrop, the published results are provided in a more user-friendly format along with an analysis of the results.
Key questions relate to the accuracy and relevance of the TFP model. Northwest Postal Consulting concludes that TFP is complete and accurate in calculations. Moreover, the wealth of data available makes it relevant for a variety of analytical uses. The only aspect that appears open to more consideration is the appropriate weighting of mail volume and deliveries for the creation of a composite workload. This issue is reviewed in detail in Report 2. The issue of transparency remains, however. Not only is the model complex and difficult to follow in the current format, there is little, if any, public documentation available that explains the inner-workings of TFP. As a result, it is not widely understood beyond a general conceptual level.
There are several changes that could potentially improve the TFP process. These include the following:
1. Improve the reporting and the use of the results.
2. Review the weighting factor used for final workload and other alternatives to workload, such as Total Output per Delivery.
3. Eliminate the Composition of Labor factor.
4. Create an operations oriented sub-index which better reflects how postal operations inputs affect various measures of productivity and examines how TFP tracks with postal operations measures such as delivery per hour.
5. Look at the impact of moving from a 45-year old base (1972) to one more current for comparison purposes.
This report is intended to set the stage for Report 2. Now that confidence in the TFP process has been established, Report 2 will use the TFP methodology and results to assess productivity in the Before and After PAEA periods.

Measuring Postal Service Efficiency Final Report
Northwest Postal Consulting Page 86
2. Transition to Report 2 – Before / After PAEA Report 2 will build directly on the results from the NWPC TFP model development and results from the Report 1 process. The approach for determining the productivity for Before / After PAEA study included the following actions.
1. Based on the results of Report 1 and PRC feedback, the scenarios defined here were refined and new analysis aspects were identified. This includes an update of the Underlying, Exogenous and Pricing factors.
2. The NWPC TFP model was updated to accommodate the Before/After analysis structure and the scenario analysis. The validation issues were finalized and an acceptable baseline result from the updated model was established.
3. Report 2 uses 1990 as the base year for the analysis. Reports and results were restructured to this 1990 base year approach.
4. Report 2 focused on an analysis of TFP Before and After the implementation of PAEA. Report 2 segmented the Before and After Periods more finely based upon different TFP trends within those broader periods. That analysis included how Underlying, Exogenous, and Pricing factors influenced the productivity trends.

Measuring Postal Service Efficiency Final Report
Northwest Postal Consulting Page 87
VII. Appendix Listing
The following are provided as Appendix to this report.
Appendix 1 Consolidated TFP Data Set – 2016 Final
Appendix 2 Single Year Example
Appendix 3 TFP Methodology – Reference Documents
Appendix 4 Alternative Methodology for the Workload Weighting Factor
Appendix 5 NWPC TFP Model – Version 2 (Excel File)
Appendix 6 Graphs Used in Reports 1 & 2 (Excel File)