possible technical problems encountered by the teacher in
TRANSCRIPT

European J of Physics Education Volume 11 Issue 2 1309-7202 Kateris et al.
5
Possible Technical Problems Encountered by The Teacher in
The Incorporation of Mobile Phone Sensors in The Physics Lab
Kateris Alexandrosa
Lazos Panagiotisb
Tsoukos Serafeimc
Tzamalis Pavlosd
Velentzas Athanasiose*
a2nd Experimental Lyceum of Athens
bNational and Kapodistrian University of Athens c2nd Experimental Junior High School of Athens
dAgricultural University of Athens eNational Technical University of Athens
*Corresponding author: [email protected]
(Received 25.11.2019, Accepted 09.02.2020)
Abstract
Several suggestions for the use of Mobile Phone (MP) sensors in science teaching are found in the literature, and most of them focus on proposing physics experiments that can be conducted with the aid of the sensors that commonly exist in smartphones. The proposed experiments rely on the Bring Your Own Devices (BYOD) approach, that is, students are allowed to bring and use their own MPs in the classroom or school science lab. The present study investigates (a) the variations in the results of experiments, and (b) other possible "technical" difficulties which arise when students use their personal MPs to take measurements with acceleration, sound, and light sensors because of the fact that the devices may be technologically different. According to the findings, as regards the acceleration and sound sensors, the teacher who decides to use the students' MPs in classroom experiments will not encounter problems with statistically significant differences in the results of the same experiment conducted with different devices. In contrast, the use of light sensors resulted in considerable difficulties, which made it possible to use only a small percentage of devices. Finally, the illuminance indications vary significantly between the devices, making it impossible to use them as reliable photometers.
Keywords: Mobile Devise Sensors; School Lab; BYOD; Smartphones; Physics Experiments

European J of Physics Education Volume 11 Issue 2 1309-7202 Kateris et al.
6
INTRODUCTION
Over the last three decades, there has been a keen interest in the educational community for the use of Information and Communication Technologies (ICT) in the classroom at all levels of education (Camilleri & Camilleri, 2017). In recent years, much of this interest has focused on the possibility of using both smartphones and tablets -known as mobile devices - in the classroom (Crompton et al., 2016; Zacharia et al., 2016). Mobile devices can be used to provide new educational experiences to students, such as learning that is contextualized, personalized, and not hindered by temporal or environmental constraints (Crompton, 2013; Laurillard, 2007; Traxler, 2010). These mobile devices have built-in sensors that can be used in teaching, and in particular in the school science lab (e.g. Gonzalez & Gonzalez, 2016). The use of mobile devices in the science lab is expected to yield positive results in teaching and learning because such devices are portable, and students are familiar with their use. This advantage will be even greater if the BYOD (Bring Your Own Devices) (Song, 2014; Stavert, 2013) program is adopted, that is, students are allowed to bring and use their own devices in the classroom or in the school science lab. Students using mobile devices in the science lab can easily, efficiently, and quickly conduct experiments and collect data in real-time, while at the same time have the ability to review and process these data (Kearney et al., 2012; Klein et al., 2014).
Mobile applications (Apps) for science learning offer a number of similar design features, including technology-based scaffolding, location-aware functionality, visual/audio representations, digital knowledge-construction tools and digital knowledge-sharing mechanisms (Zydney & Warner, 2016). Several suggestions for the use of mobile devices sensors in science teaching are found in the literature, and most of them focus on proposing experiments which can be conducted with the sensors that commonly exist in smartphones (e.g. Kuhn & Vogt, 2013a; Vogt & Kuhn, 2014; Wong et al., 2015; Iliaki et al. 2019). Only a few studies deal with technical problems that the users of mobile devices face (e.g. Monteiro et al. 2015). Therefore, it is considered expedient and necessary for the educational community to broaden the research on the optimal use of sensors of mobile devices in science teaching.
Such proposed broadened research could, on the one hand, focus on creating learning environments using mobile devices that foster understanding of the concepts of science, and on other hand explore the technical difficulties that may arise in classroom reality when students measure physical quantities by using their own devices. These technical difficulties – which should be known to the teacher beforehand – can be due to:
(i) the possible lack of easy use of mobile devices by the students-users,
(ii) variations among mobile devices due to different manufacturers, models, software (e.g.
iOS or Android), as well as among apps that use the sensors.

European J of Physics Education Volume 11 Issue 2 1309-7202 Kateris et al.
7
A first study into the above-mentioned difficulties would be to test the possible differentiation in the results of experiments, the measurements of which are taken by sensors, due to the variety of mobile devices and more specifically of mobile phones (MPs). This investigation is the aim of the present work: Three sensors that are extensively suggested for conducting experiments in the school science lab are the acceleration sensor (accelerometer), the sound sensor, and the light sensor (e.g. Klein et al., 2014; Hochberg et al., 2018; Kuhn & Vogt, 2013b). These sensors are explored in the present study. Specifically, what are investigated are (a) the variations in the results of experiments and (b) other possible "technical" difficulties which arise when students use their personal MPs to take measurements in a classroom or in a school lab with acceleration, sound, and light sensors because of the fact that the devices may be technologically different.
MATERIALS AND METHODS
In the present study, a number of Mobile Phones (MPs), popular among students, were first selected by the researchers. Afterward, a variety of apps that fed with data from the selected sensors were chosen, and then a selection of experiments that would allow researchers to ascertain possible variations in the results and other types of difficulties due solely to the variety of MPs was followed. These steps are described below.
The Process for Selecting MPs
The MPs used in the present study were selected according to the results obtained from a questionnaire distributed to students attending three high schools in the area of Athens. In the questionnaires, students were asked to anonymously record their class and the exact type (model) of their MP. The goal of the questionnaire was to identify the most popular MP models among the students, and thus to simulate as closely as possible the situation that a physics teacher confronts if s/he decides to incorporate the BYOD (Bring Your Own Devices) model in the classroom.
Figure 1. The number of each type of MP of the total 1083 questionnaires

European J of Physics Education Volume 11 Issue 2 1309-7202 Kateris et al.
8
A total of 1,083 questionnaires were collected, and student responses were statistically analyzed. The MPs were first classified according to the company that manufactured them, and that showed at least (due to a number of unclear responses) 24 different companies. A second, more detailed classification, revealed at least 280 different models of MPs.
The graph of Figure 1 shows the absolute number of each model encountered in the survey. Each bar corresponds to a different model that was recorded, while for ethical reasons their trade names do not appear but there are available in case of an inquiry. It is worth mentioning the large range of MP models (the MP with the highest frequency in the given student population appeared 60 times in the total of 1,083 responses, that is 5.5%). The science teacher should have in mind this fact if s/he would like to use students’ MPs in the lab.
The seven most popular MPs were then selected, with the additional provision of using both Android and iOS operating systems devices. The number of seven devices selected for the experiment corresponds to the common practice in a typical Greek school lab class of dividing students into seven or eight groups. This number was also consistent with practical constraints that were present in conducting the acceleration measurement experiment, as will be shown below in the description of the experiments.
It is worth noting that it was not possible for these same seven MPs to be used in all of the experiments: Specifically, during the measurement of the illuminance, it was observed that only some of the MPs had a light sensor accessible by the apps. In devices where the light sensor was inaccessible, the illuminance was estimated by the camera, which usually made automatic compensations, making the measurements unreliable. Thus, for this specific experiment, these devices were discarded and replaced by other popular MPs that could perform measurement of the illuminance using their light sensor. The measurements recorded by the seven MPs in each experiment are reported in the tables of findings with the names MP 1 to MP 7, and not by their brand names.
Finally, in order to emphasize the wide range of different types of MPs found among the 1,083 students, it is worth mentioning that the total number of the specific seven devices selected in the acceleration experiment corresponds to approximately 22% of the valid responses. It is worth noting that although the conclusions from the questionnaire could not be generalized, in another area outside of Athens the results could be slightly different, it’s not expected significant differences in the wide variation of MPs types among the student.
The Process for Selecting Sensors
The sensors that were used in the experiments, particularly for the measurement of acceleration sound and illuminance, were those that exist in all devices recorded in our research. Furthermore, we tried to avoid some sensors rarely found in MPs, such as the one for measuring pressure, which was only available on a limited number of models. Finally, a

European J of Physics Education Volume 11 Issue 2 1309-7202 Kateris et al.
9
significant advantage of these three sensors is that can be used in a wide range of experiments in mechanics, acoustics, oscillations, and optics.
It is very probable that in the near future, MPs will have at least the three above-mentioned sensors built-in since they perform important functions, such as the accelerometer, which is the one that turns the screen every time the user rotates the device. The evolution of technology indicates that gradually other more specialized sensors as well will be standard features in the majority of next-generation mobile phones.
The Process of Selecting Applications
The collection and recording of data from MP sensors can be performed only by specially designed application (apps) that are either available free of charge on the Internet or can usually be bought for a small fee. Generally, the apps that allow data collection directly can also present measurements in a graph form, or perform first, rapid processing of the measurements. To select appropriate apps, a determination needs to be made of their minimum capabilities and the features required in order to serve the objectives set during the design of the experiments each time. A study of the literature shows that the issue of selecting suitable apps is both open, as each article proposes a different app, and quite complicated, given the variety of apps available and the rapid pace at which they become obsolete by the advance of technology.
In selecting the apps for this study, certain criteria were set, such as their being available free of charge (free applications), and their ability for users to both complete the data processing/measurements directly on the device screen, and also export data for further processing. At the same time, the apps had to be able to achieve a satisfactory sampling rate so that they could be used in a study of phenomena that evolve very fast. Some very popular apps (such as phyphox) were excluded from our research since they did not comply with one or more of the above mention criteria. Furthermore, given the two dominant operating systems (Android and iOS), it was necessary to ensure that the proposed app worked on both platforms in the same format and could be handled in the same way. Based on the above-mentioned criteria, the SPARKvue app from Pasco was chosen as the main one for performing experiments involving all three sensors. However, in order to carry out the accelerometer experiment, it was also necessary to measure the angle of an inclined plane. To make this type of measurement, Compass Level and Surface Level apps, for the Android and iOS operating systems, respectively, were selected, both of which were also available for free.
Using the proposed apps, the angle of an inclined plane could be easily measured given, as an option, the possibility of calibration (zero level setting). Also, for measuring time using the microphone of an MP together with the SPARKvue application, which in this case records the sound intensity, apps having an oscilloscope function were also used because of their capability giving time measurements with a one-order of magnitude higher

European J of Physics Education Volume 11 Issue 2 1309-7202 Kateris et al.
10
accuracy (i.e., time measurements in milliseconds). In particular, the SignalScope X and Sound Oscilloscope applications were used with iOS and Android software MPs, respectively. Both apps allow quick measurements, and users have the option to make an instantaneous measurement of time on the screen (Figure 2).
Figure 2. Screenshots of MPs with SignalScope X (iOS) and Sound Oscilloscope (Android)
Selection and Description of The Experiments
The experiments were chosen in such a way that students should use the acceleration, microphone and light sensors on their MPs. Then, the researchers could analyze the results in order to find the existence of statistically significant differences, if any, between both the measurements taken by students on different MPs and the calculation of physical quantities resulting from the processing of the measurements. Also, the selected experiments involve areas of physics usually taught in international curricula, that can easily be carried out in any physics lab. It should be noted that experimentation was carried out by the researchers with the participation of the students who brought their MP devices to the physics lab. No comments from students about the ease of use of devices and apps or about the learning process were recorded because that was not the target of this investigation, which, as already mentioned, only focuses on possible differences in experimental results or other technical difficulties due to different types and models of MPs.
Acceleration Sensor
With regard to the use of the acceleration sensor, the experiment that was chosen is the one that allows us to calculate the coefficient of kinetic friction between a wooden rectangular parallelepiped and the sloping bench of the school physics lab. In order to implement the setup of the experiment, one side of the laboratory bench was raised with suitable support placed beneath it, creating an inclined plane of a constant angle. Then seven MPs were fixed and aligned on a solid wooden rectangular parallelepiped which placed on a horizontal plane (Figure 3) and using the SPARKvue application, the value of acceleration due to gravity, g, was measured by each MP.

European J of Physics Education Volume 11 Issue 2 1309-7202 Kateris et al.
11
Figure 3. The MPs on the wooden parallelepiped
Subsequently, the parallelepiped was held motionless at the top of the inclined plane and using the compass level or surface-level applications (as mentioned above), the value of the angle of inclination φ was measured and recorded by each mobile phone. Finally, the parallelepiped was allowed to slide down the incline, and the acceleration value was measured as a function of time by the SPARKvue application with a sampling rate set at the frequency of 1 kHz. It is worth noting that this particular experiment was chosen to be implemented by placing all the MPs together on the parallelepiped (rather than separately) so that they move in the same way. Therefore, any observed differences can safely be attributed to the differences in devices (hardware) or of the apps (software). This requirement, as already mentioned, has created a limitation on the number of devices used. If α is the acceleration value during a smoothly accelerating movement of the parallelepiped, it is easy to prove that the coefficient of kinetic friction is calculated from the equation:
Microphone Sensor
There is a great variety of candidate experiments in order to test the reliability and accuracy of the measurements obtained through the microphone sensors of different MPs. Indicatively, experiments such as interference between two sound waves of similar frequency, the measurement of a sphere's free fall time interval with the recording of launching and impact sounds, etc. were considered (Kuhn et. al. 2014). In each of the above cases, it is critical to accurately record the time in which a sound is produced. In the experiment conducted for this study, it was decided to use a metronome. The choice of the metronome was made because (a) its pendulum bar performs periodic motion while the period can be adjusted, and (b) the value of the period can be used as a reference value to check the accuracy of the measurements obtained through the MP apps.
European J of Physics Education Volume 11 Issue 2 1309-7202 Kateris et al.
12
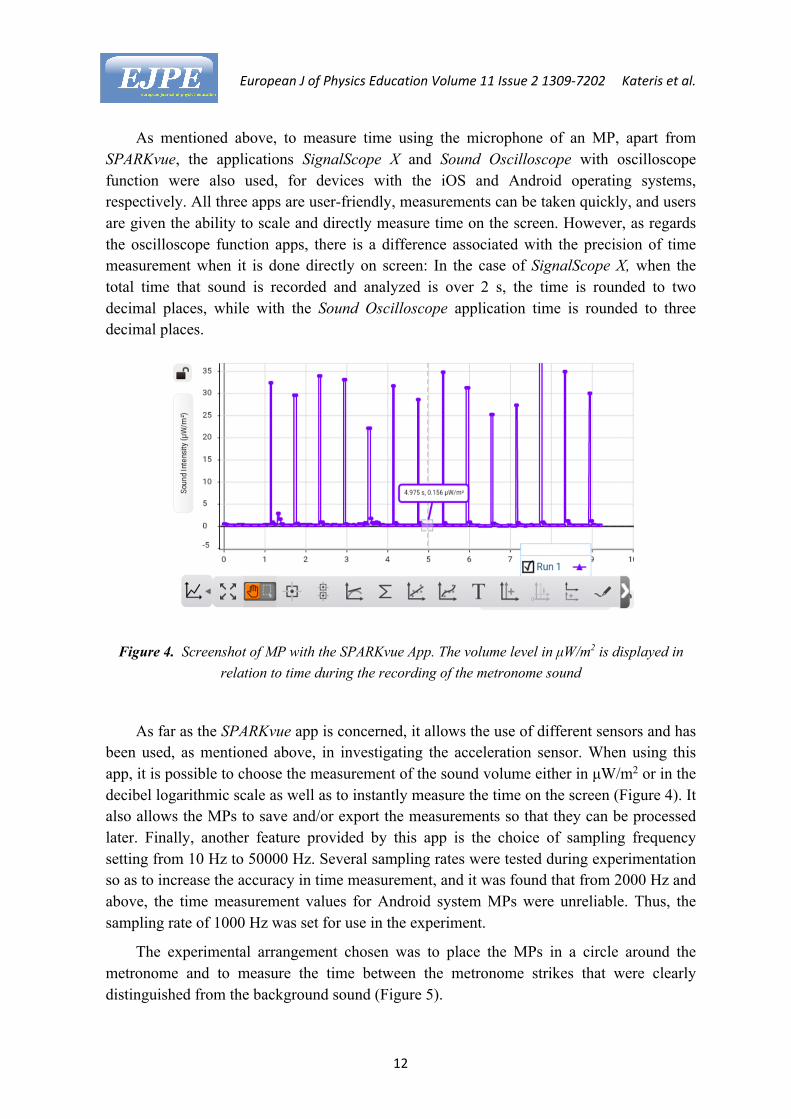
As mentioned above, to measure time using the microphone of an MP, apart from SPARKvue, the applications SignalScope X and Sound Oscilloscope with oscilloscope function were also used, for devices with the iOS and Android operating systems, respectively. All three apps are user-friendly, measurements can be taken quickly, and users are given the ability to scale and directly measure time on the screen. However, as regards the oscilloscope function apps, there is a difference associated with the precision of time measurement when it is done directly on screen: In the case of SignalScope X, when the total time that sound is recorded and analyzed is over 2 s, the time is rounded to two decimal places, while with the Sound Oscilloscope application time is rounded to three decimal places.
Figure 4. Screenshot of MP with the SPARKvue App. The volume level in μW/m2 is displayed in relation to time during the recording of the metronome sound
As far as the SPARKvue app is concerned, it allows the use of different sensors and has been used, as mentioned above, in investigating the acceleration sensor. When using this app, it is possible to choose the measurement of the sound volume either in μW/m2 or in the decibel logarithmic scale as well as to instantly measure the time on the screen (Figure 4). It also allows the MPs to save and/or export the measurements so that they can be processed later. Finally, another feature provided by this app is the choice of sampling frequency setting from 10 Hz to 50000 Hz. Several sampling rates were tested during experimentation so as to increase the accuracy in time measurement, and it was found that from 2000 Hz and above, the time measurement values for Android system MPs were unreliable. Thus, the sampling rate of 1000 Hz was set for use in the experiment.
The experimental arrangement chosen was to place the MPs in a circle around the metronome and to measure the time between the metronome strikes that were clearly distinguished from the background sound (Figure 5).

European J of Physics Education Volume 11 Issue 2 1309-7202 Kateris et al.
13
Figure 5. The layout of MPs around the metronome in order to measure the time between a certain number of strokes of the metronome
Light Sensor
The experiment chosen in the case of the light sensor was the measurement of the absorbance of visible polychromatic light when it passed through glass of different thicknesses which had been interpolated between the light source and the sensor in the experimental setup. The twofold purpose of the experiment was (a) to check whether the transmitted light is connected with an exponential relationship with the thickness of the interpolated glass, according to the Lambert law in the form:
Τ = e-μ·x or ln(T)= - μ·x,
where T is the transmittance obtained as the ratio of the intensity of the transmitted to the incident radiation, x the thickness of the glass and μ is the absorption coefficient of the glass and, (b) if the absorption coefficients determined by the processing of the measurements with the different MPs had statistically significant differences.
Figure 6. The experimental layout to obtain measurements with MPs equipped with a light sensor

European J of Physics Education Volume 11 Issue 2 1309-7202 Kateris et al.
14
Specifically, in the experimental arrangement, the seven different MPs were consecutively set at a fixed distance from an LED lamp (Figure 6), and measurements were made by each MP in turn with the SPARKvue application.
With the LED lamp on and the light sensor of the MPs always placed in the same position, relative to the lamp, measurements of illuminance (in Lux) were made, with the successive placement of 0 to 12 identical glass tiles in front of the light sensor. Special emphasis was put on the correct placement of the tiles, the absence of other light sources in the environment of the device, as well as the student-experimenters', maintaining the proper distance from the MP in order not to affect the light that reaches it.
FINDINGS
Measurements of The Acceleration Due to Gravity (G)
Table 1 shows (i) the measured value of the acceleration of gravity (g) from the seven MPs, (ii) the mean of these seven values of g, (iii) the standard deviation of the mean (SD), and (iv) the coefficient of variation (CV).
Table 1. Measurements of the acceleration due to gravity from the seven MPs
Measurements of The Slope Angle of The Inclined Plane
To measure the slope angle of the inclined plane, the surface level app was used for devices with the iOS platform (MP1 and MP2), while the compass level app was used for the remaining five devices (MP3 to MP7) with the Android platform. Table 2 illustrates (i) the measured value of the slope angle (φ) of the inclined plane from the seven MPs, (ii) the mean of these seven values of φ, (iii) the standard deviation of the mean (SD), and (iv) the coefficient of variation (CV).
Table 2. Measurements of the slope angle of the inclined plane from the seven MPs
MP 1 MP 2 MP 3 MP 4 MP 5 MP 6 MP 7 24° 24.5° 23.3° 24.4° 24.2° 23.8° 24.6°
Mean: 24.1° SD: 0.4° C.V: 1.67%
Measurements of g in m/s2 MP 1 MP 2 MP 3 MP 4 MP 5 MP 6 MP 7 9.91 9.83 9.76 9.84 9.91 9.96 9.63
Mean: 9.83 SD: 0.10 C.V: 1.02%

European J of Physics Education Volume 11 Issue 2 1309-7202 Kateris et al.
15
Measurements of The Acceleration of The Body Sliding on The Inclined Plane
Each MP can measure the total acceleration α and its components αΧ, αΥ and αΖ. The acceleration and its components are measured automatically, and the user has the ability to store and process either all or part of the data according to the requirements of the experiment. The data which was collected according to the procedure described in the corresponding experiment description were downloaded and analyzed on a PC.
Figure 7. The graph of the acceleration in relation to time from the downloaded data of an MP in a PC using the Logger Pro software
Figure 7 illustrates a typical graph of the acceleration α in relation to time from the downloaded data of an MP in a PC using the Logger Pro software, while Figure 8 shows a typical graph with the same data set directly on the screen of the smartphone. Through the processing of data in both the MP and a PC, it is possible to calculate the mean of acceleration values in a specific range.
Figure 8. The graph of the acceleration in relation to time directly from the screen of an MP using the SPARKvue app

European J of Physics Education Volume 11 Issue 2 1309-7202 Kateris et al.
16
As it is shown in Figures 7 and 8, the acceleration has an area with an approximately constant value (plateau) corresponding to the duration of the movement. From this area, a section (shaded section in Figure 7) was selected in which the minimum, the maximum and the mean value of the acceleration, as well as the standard deviation and the coefficient of variation, were calculated.
It is worth noting that the dispersion of values of the acceleration in each MP, is mainly due to experimental factors and not to possible problems of the device. Due to the high sampling frequency, even the slightest vibration of the sliding body results in changes in the acceleration value recorded by the sensors. In the experiment for calculating the coefficient of kinetic friction, the mean acceleration value in the plateau was used. The findings of the seven MPs are presented in Table 3.
Table 3. Characteristic values of the acceleration (in m/s2) in the plateau area
MP 1 MP 2 MP 3 MP 4 MP 5 MP 6 MP 7
amin 2.408 2.403 2.600 2.651 2.603 2.603 2.552 amax 3.166 3.109 3.174 2.956 3.079 3.071 3.117 amean 2.776 2.736 2.792 2.774 2.820 2.826 2.815 SD 0.173 0.172 0.188 0.117 0.171 0.153 0.168
C.V.(%) 6.23 6.29 6.73 4.23 6.05 5.41 5.98
As shown in Table 3, the mean acceleration values recorded by the seven devices differ slightly among them. The maximum mean (MP 6) from the minimum mean (MP 2) diverges about 3.3%.
Calculating the Kinetic Friction Coefficient
The kinetic friction coefficient was calculated using the equation (1), given the slope angle and the mean acceleration value as they were measured by each MP. In all cases, for the acceleration of gravity g, the value 9.81 m/s2 from the literature was used. The results of the kinetic friction coefficient calculations for each MP are shown in Table 4.
Table 4. The kinetic friction coefficient as it was calculated using the data from each MP
MP 1 0.13 MP 2 0.15 MP 3 0.12 MP 4 0.14

European J of Physics Education Volume 11 Issue 2 1309-7202 Kateris et al.
17
MP 5 0.13 MP 6 0.13 MP 7 0.14
It should be noted that the acceleration values measured by the MPs, as they were sliding down the incline, are compared to each other, but not to a reference value. For this reason, the acceleration of gravity, for which the reference value is the value of the literature, was measured by each MP as shown in Table 1, in order to estimate the accuracy of the measurements.
Table 5 shows the values and the errors of the mean acceleration (a and δa), the slope angle of the inclined plane (φ and δφ) and the kinetic friction coefficient (μ and δμ).
Table 5. The values and the errors of the mean acceleration (a and δa), the slope angle of the inclined plane (φ and δφ) and the kinetic friction coefficient (μ and δμ)
MP α (mean) (m/s2) δα (m/s2) φ (rad) δφ (rad) μ δμ 1 2.776 0.007 0.419 0.13 0.01 2 2.736 0.007 0.427 0.15 0.01 3 2.792 0.008 0.406 0.12 0.01 4 2.774 0.005 0.426 0.007* 0.14 0.01 5 2.820 0.007 0.422 0.13 0.01 6 2.826 0.006 0.415 0.13 0.01 7 2.815 0.006 0.429 0.14 0.01
* Τhe value of δφ is the error in the mean value of the angles of the inclined plane, indicated in column φ. With each mobile phone, one angle measurement was obtained.
Time Measurement Based on Sound
As previously mentioned, in addition to SPARKvue, other apps with oscilloscope mode were used to measure time with the microphone sensor, namely SignalScope X and Sound Oscilloscope for MPs with iOS and Android software, respectively.
Table 6. Average values of a metronome time period. All MPs used the app “SPARKvue”
MP Τ (s)
1 0.59±0.02 2 0.60±0.01 3 0.61±0.02 4 0.60±0.02 5 0.60±0.04 6 0.60±0.01 7 0.60±0.02

European J of Physics Education Volume 11 Issue 2 1309-7202 Kateris et al.
18
Table 6 shows the mean values and standard deviations calculated by the seven MPs for the periods of motion of the metronome. Five periods of motion were measured with each MP with the SPARKvue application, and then the mean and standard deviation of the period for each set of measurements was calculated. As observed, the mean value of the period for all MPs did not show statistically significant differences.
Table 7 illustrates the mean values and the standard deviations calculated by the seven MPs for the periods of motion of the pendulum bar of the metronome, one of which was measured with the SignalScope X App, and six with the Oscilloscope app.
Table 7. Average values of a metronome time period. MPs 1-6 used the “Sound Oscilloscope” an Android application, while MP 7 used the “SignalScope X”, an iOS application
MP Τ(s) 1 0.603±0.001 2 0.601±0.003 3 0.603±0.001 4 0.602±0.001 5 0.602±0.001 6 0.603±0.001 7 0.60±0.02
From the data shown in Tables 6 and 7, it is obvious that the accuracy in the measurement of time made directly on the MP screen increases by one order of magnitude when an oscilloscope app is used compared to SPARKvue.
Illuminance Measurement and Calculation of The Absorption Coefficient of Glass Using A Light Sensor
Experimenting on the phenomenon of diminishing light propagating through similar glass tiles was accomplished by using the SPARKvue app together with the light sensor of the MP. Table 8 illustrates the illuminance measurements (E) by one MP, as well as the values of the transmittance and its logarithm. Subsequently, the absorption coefficient for the particular glass was calculated from the gradient of the graph of the transmittance’s natural logarithm (lnT) in relation to the thickness of the glass (Figure 9).
Table 8. Light measurements and calculations for one MP Number of
tiles Glass thickness
(mm) Ε (Lux) T=E/E0 lnT
0 0 1875 1.000 0.000 1 3 1803 0.962 -0.039 2 6 1704 0.909 -0.096

European J of Physics Education Volume 11 Issue 2 1309-7202 Kateris et al.
19
3 9 1607 0.857 -0.154 4 12 1510 0.805 -0.216 5 15 1421 0.758 -0.277 6 18 1337 0.713 -0.338 7 21 1262 0.673 -0.396 8 24 1186 0.633 -0.458 9 27 1119 0.597 -0.516 10 30 1067 0.569 -0.564 11 33 997 0.532 -0.632 12 36 942 0.502 -0.688
It is worth noting that the values of the illuminance for the same light source, at the same distance, and with the same number of tiles varied considerably from one MP to another, a finding that leads to the conclusion that MPs cannot effectively play the role of a photometer. However, the values of the illuminance from each MP followed with great precision the exponential law, as shown indicatively for one device in the Figure 9.
Figure 9. Diagram of the logarithm of transmittance (lnT) in relation to the thickness of the glass
The light absorption coefficients as calculated by the above procedure are shown in Table 9. A deviation of 20% around a mean value is observed.

European J of Physics Education Volume 11 Issue 2 1309-7202 Kateris et al.
20
Table 5. Glass absorption coefficient
MP Absorbency factor of glass
(mm-1) 1 0.029 2 0.021 3 0.019 4 0.027 5 0.034 6 0.027
Mean Value 0.026±0.005
DISCUSSION AND CONCLUSIONS
The main characteristics of mobile phones, i.e., portability and connectivity to the worldwide web, combined with the sensors that any smartphone possesses, make it an ideal tool for learning in the science lab (Purba, 2017). However, as in any significant educational change, we ought to examine, among other factors, any potential problems before incorporating this “educational revolution in our classrooms” (Nielsen 2014). In our study, we addressed the issue of technical difficulties with student mobile phones and applications used for data collection.
As shown by the survey conducted in the three schools, students' MPs, all of which were smartphones, came from different manufacturers and encompassed a wide variety of models. This means that the teacher who chooses to adopt the BYOD (Bring Your Own Devices) model in his classroom will be faced with many different devices. S/He should, therefore, have a view, beforehand, of the limits of precision of all these different devices. For specific experiments, for example, the measurement of the acceleration of gravity, s/he should also know the limits of the accuracy that is expected to be achieved.
In addition, a teacher should be prepared to propose an appropriate app for the data collection to students depending on the type of their MPs. Although there is a wide variety of applications available, some of them are ephemeral due to the fast pace of technological development. This was the case during new research of ours. When one of the experiments had to be repeated, it was observed that the applications' surface level and compass level were no longer available for some new models of students' MPs but replaced by similar available applications without this being a problem. Therefore, the teacher should take care, in cooperation with students, to check shortly before the experiment whether all apps needed for the experiment are available for students' mobile devices.
Proposed apps will have to meet a number of criteria in order to be adopted for use in the physics lab of a public school. First of all, apps should be free of charge, easy to use and intuitively obvious to handle, as well as offering the possibility of processing data directly on the MP and the ability to export the data to appropriate software for further processing.

European J of Physics Education Volume 11 Issue 2 1309-7202 Kateris et al.
21
Overall, in the course of our study, despite the wealth of the available applications, we encountered the unexpected difficulty of finding apps that met the stated criteria.
However, the central question of this study was whether differences in experimental results that arise due to the different sensors used by each model render the use of MPs unsuitable for educational use. The results of direct measurements made by the MPs, such as the angle and the acceleration of gravity, as well as the mean value of the acceleration during sliding movement, have a deviation on the order of 2% maximum, which makes the MPs suitable for use within the physics or more general the science lab. Thus, according to our research, the teacher who decides to use the students' MPs in classroom experiments will not encounter problems with statistically significant differences in the results of the same experiment conducted with different MPs using different software.
The same findings hold true for the utilization of the sound sensor for timing purposes. In this case, the results of the measurements are both accurate, and they do not show statistically significant discrepancies due to the variety of devices. Another of our findings revealed that in order to conduct more accurate experiments and therefore achieve more precise results, oscilloscope applications should also be used. In contrast, the use of light sensors built into the MPs resulted in considerable difficulties, which made it possible to use only a small percentage of devices. In addition, the illuminance indications vary significantly between the devices, making it impossible to use them as reliable photometers. Furthermore, although the measurements from each individual MP followed the exponential law of light absorption with great precision, the calculated values of the absorption coefficient of light through the glass were only compatible in terms of orders of magnitude, with deviations between the values from different models of up to 20%.
Based on the findings of the present study, we can conclude that the wide variety of types of MPs does not pose serious problems for the teacher who decides to apply the BYOD model to the science classroom. Future research that is proposed and already in progress explores students' difficulties in handling their devices when they are experimenting in the school lab. However, a great deal of research is still needed for definitive conclusions to be made about the educational value of using MPs in the teaching and learning of science.
REFERENCES
Camilleri, M.A. & Camilleri, A.C. (2017). Digital Learning Resources and Ubiquitous Technologies in Education. Technology, Knowledge and Learning, 22 (1), 65-82.
Crompton, H. (2013). A historical overview of mobile learning: Toward learner-centered education. In Z. L. Berge, & L. Y. Muilenburg (Eds.), Handbook of mobile learning (pp. 3-14). Florence: Routledge.

European J of Physics Education Volume 11 Issue 2 1309-7202 Kateris et al.
22
Crompton, H., Burke, D., Gregory, K.H., Gräbe, C. (2016). The Use of Mobile Learning in Science: A Systematic Review. Journal of Science Education and Technology, 25(2): 149-160.
González, M. Á., & González M. Á. (2016). Smartphones as Experimental Tools to Measure Acoustical and Mechanical Properties of Vibrating Rods. European Journal of Physics, DOI:10.1088/0143-0807/37/4/045701
Hochberg, K., Kuhn, J., Müller, A., (2018). Using Smartphones as Experimental Tools Effects on Interest, Curiosity, and Learning in Physics Education. Journal of Science Education and Technology, 27:385–403.
Iliaki G., Velentzas A., Michailidi E. & Stavrou D. (2019) Exploring the music: a teaching-learning sequence about sound in authentic settings, Research in Science & Technological Education, 37:2, 218-238.
Kearney, M., Schuck S., K. Burden, & Aubusson P., (2012). Viewing Mobile Learning from a Pedagogical Perspective. Research in Learning Technology, 20 (1): 14406, DOI:10.3402/rlt.v20i0.14406.
Klein, P., Hirth M., Gröber S., Kuhn J., & Müller A. (2014). Classical Experiments Revisited: Smartphones and Tablet PCs as Experimental Tools in Acoustics and Optics. Physics Education, 49 (4): 412. DOI:10.1088/0031-9120/49/4/412.
Kuhn, J., Vogt, P. (2013a). Applications and Examples of Experiments with Mobile Phones and Smartphones in Physics Lessons. Frontiers in Sensors, 1(4), 67-73.
Kuhn, J., Vogt, P. (2013b). Smartphones as Experimental Tools: Different Methods to Determine the Gravitational Acceleration in Classroom Physics by Using Everyday Devices. European Journal of Physics Education, 4(1), 47-58.
Laurillard, D. (2007). Pedagogical forms for mobile learning: Framing research questions. In N. Pachler (Ed.), Mobile learning: Towards a research agenda (pp.153-175). London: W1.E Centre.
Monteiro, M., Cabeza, C. Marti, A. (2015). Acceleration measurements using smartphones sensors: Dealing with the equivalence principle. Revista Brasileira de Ensiro de Fisica, 37(1), 1303.
Nielsen, W., Miller, K.A., Hoban G. (2015) Science Teachers' Response to the Digital Education Revolution. Journal of Science Education and Technology, 24 (4) 417-431.
Purba, S.W.D., & Hwang W.Y. (2016) Investigation in Learning Behaviors and Achievement of Vocational High School Students Using a Ubiquitous Physics Tablet PC App. Journal of Science Education and Technology, 26(3) 322-331
Song, Y. (2014). “Bring Your Own Device (BYOD)” for seamless science inquiry in a primary school. Computers & Education, 74, 50–60.

European J of Physics Education Volume 11 Issue 2 1309-7202 Kateris et al.
23
Stavert B. (2013). BYOD in Schools Literature Review 2013, State of NSW Australia. Resource document, https://education.nsw.gov.au/policy-library/related-documents/BYOD_2013_Literature_Review.pdf. Accessed 15 June 2019.
Traxler, J. (2010). Will student devices deliver innovation, inclusions, and transformation? Journal of the Research Center for Educational Technologies, 6(1), 3-15.
Vogt, P., Kuhn, J., (2014). Acceleration Sensors of Smartphones Possibilities and Examples of Experiments for Application in Physics Lessons. Frontiers in Sensors (FS) V.2, 1-9.
Wong, WK., Chao, TK., Chen, PR., Lien, YW., Wu, CJ., et al. (2015). Pendulum experiments with three modern electronic devices and a modeling tool. Journal of Computers in Education. 2(1): 77–92
Zacharia, Z. C., Lazaridou C., & Avraamidou L. (2016). The Use of Mobile Devices as Means of Data Collection in Supporting Elementary School Students’ Conceptual Understanding about Plants. International Journal of Science Education, 38 (4): 596–620.
Zydney, J. M., & Warner, Z. (2016). Mobile apps for science learning: Review of research. Computers & Education, 94, 1–17.