possible mechanisms for turbofan engine ice crystal … · possible mechanisms for turbofan engine...
TRANSCRIPT
American Institute of Aeronautics and Astronautics
1
Possible Mechanisms for Turbofan Engine Ice Crystal Icing at High Altitude
Jen-Ching Tsao* Ohio Aerospace Institute, Cleveland, OH 44142
Peter Struk†, Michael Oliver‡ NASA John Glenn Research Center, Cleveland, OH 44135
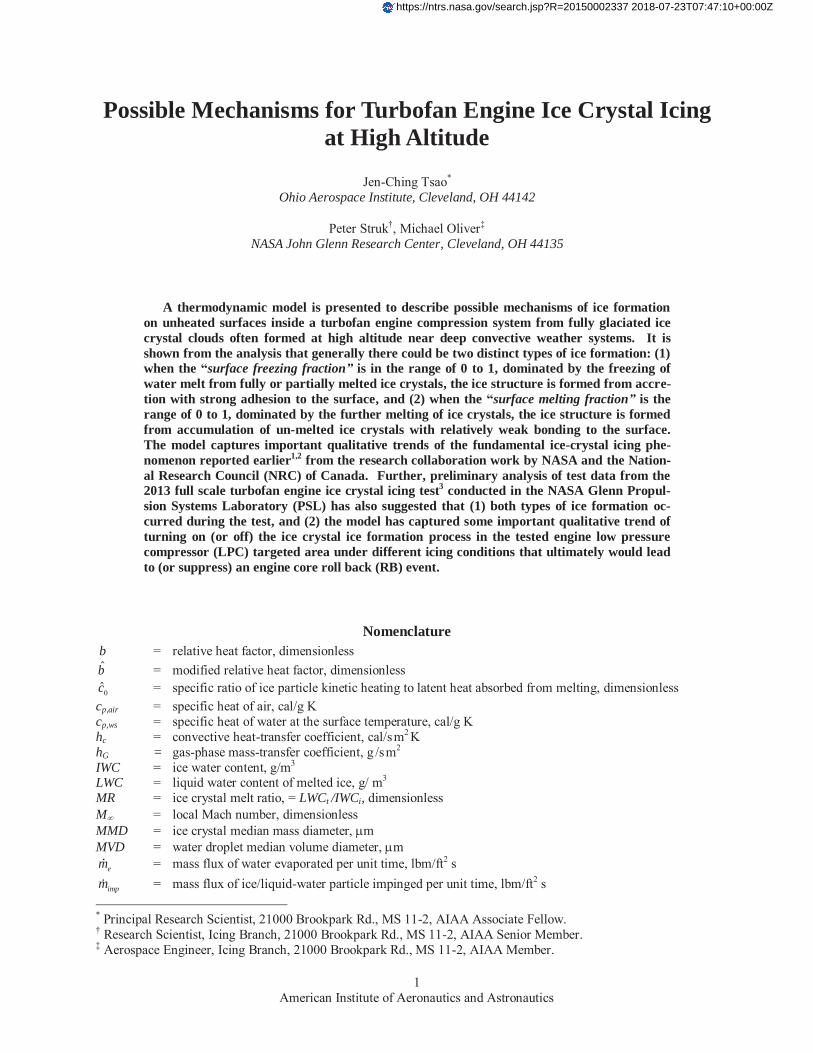
A thermodynamic model is presented to describe possible mechanisms of ice formation on unheated surfaces inside a turbofan engine compression system from fully glaciated ice crystal clouds often formed at high altitude near deep convective weather systems. It is shown from the analysis that generally there could be two distinct types of ice formation: (1) when the “surface freezing fraction” is in the range of 0 to 1, dominated by the freezing of water melt from fully or partially melted ice crystals, the ice structure is formed from accre-tion with strong adhesion to the surface, and (2) when the “surface melting fraction” is the range of 0 to 1, dominated by the further melting of ice crystals, the ice structure is formed from accumulation of un-melted ice crystals with relatively weak bonding to the surface. The model captures important qualitative trends of the fundamental ice-crystal icing phe-nomenon reported earlier1,2 from the research collaboration work by NASA and the Nation-al Research Council (NRC) of Canada. Further, preliminary analysis of test data from the 2013 full scale turbofan engine ice crystal icing test3 conducted in the NASA Glenn Propul-sion Systems Laboratory (PSL) has also suggested that (1) both types of ice formation oc-curred during the test, and (2) the model has captured some important qualitative trend of turning on (or off) the ice crystal ice formation process in the tested engine low pressure compressor (LPC) targeted area under different icing conditions that ultimately would lead to (or suppress) an engine core roll back (RB) event.
Nomenclature b = relative heat factor, dimensionless b = modified relative heat factor, dimensionless
0c = specific ratio of ice particle kinetic heating to latent heat absorbed from melting, dimensionless cp,air = specific heat of air, cal/g K cp,ws = specific heat of water at the surface temperature, cal/g K hc = convective heat-transfer coefficient, cal/sm2 K hG = gas-phase mass-transfer coefficient, g /sm2 IWC = ice water content, g/m3 LWC = liquid water content of melted ice, g/ m3 MR = ice crystal melt ratio, = LWCt /IWCi, dimensionless M = local Mach number, dimensionless MMD = ice crystal median mass diameter, m MVD = water droplet median volume diameter, m
em = mass flux of water evaporated per unit time, lbm/ft2 s
impm = mass flux of ice/liquid-water particle impinged per unit time, lbm/ft2 s * Principal Research Scientist, 21000 Brookpark Rd., MS 11-2, AIAA Associate Fellow. † Research Scientist, Icing Branch, 21000 Brookpark Rd., MS 11-2, AIAA Senior Member. ‡ Aerospace Engineer, Icing Branch, 21000 Brookpark Rd., MS 11-2, AIAA Member.
https://ntrs.nasa.gov/search.jsp?R=20150002337 2018-07-23T07:47:10+00:00Z

American Institute of Aeronautics and Astronautics
2
,,melt impm = mass flux of water-melt impinged per unit time, lbm/ft2 s m0 = surface melting fraction at stagnation, dimensionless n0 = surface freezing fraction at stagnation, dimensionless p = pressure, N/m2 pv,w = the saturation vapor pressure of water in atmosphere, N/m2 pv,ws = the saturation vapor pressure of water over icing surface, N/m2 qconv = surface heat loss due to convection, Btu/hr ft2 qevap = surface heat loss from evaporation, Btu/hr ft2 qfreeze = surface heat gain from release of latent heat of fusion, Btu/hr ft2 qkinetic = surface heat gain from kinetic energy of ice crystals and water drops, Btu/hr ft2 qmelt = surface heat loss from release of latent heat of fusion, Btu/hr ft2 RH = relative humidity, % RH_hyg = relative humidity measured when cloud on, % RTD1 = total air temperature measured in the test section when cloud on, °C SH = specific humidity, g of water vapor/kg of dry air Tf = freezing temperature of bulk water, °C Tice = ice crystal temperature, °C Tmelt = temperature of water melt, °C Ts = icing surface temperature (=Tf), °C Twall = wall temperature, °C Twb = air wet bulb temperature, °C T = air static temperature, °C V = air velocity, kt VWCgain = vapor water content gained (i.e. = VWCt – VWCi = air SH t - air SH i), g/ m3
0 = collection efficiency at stagnation line, dimensionless = ice/water mass energy transfer parameter, °C f, v = latent heat of freezing and evaporation, cal/g = air/vapor energy transfer parameter, °C = ice crystal cloud kinetic heating parameter, dimensionless
Y = ice crystal cloud melting profile, dimensionless
Subscripts
i = inlet, initial or dry condition t = target, terminal or wet condition s = at the surface 0 = stagnation value
= local static condition
Superscripts
* = threshold value ~ = threshold value
I. Introduction umerous turbofan engine power-loss events have been observed (some as recent as 2013§) on both commuter and large transport aircraft near large deep convective weather systems at high altitudes4. The deep convective updraft core can bring large amounts of condensed water from the surface to the cloud top. In theory the pre-
dicted maximum ice water content (IWC) above the freezing level in these clouds could reach up to about 9 g/m3 at around 30,000 ft. In addition, from more recent measurement data available on microphysical properties of deep convective clouds it appears that fully glaciated ice crystals have been dominated in the deep convection above the freezing level and the ice mass has been concentrated at sub-200 m sizes, and very little super-cooled liquid water content (LWC) has been observed. § Aviation Safety Network News, “Russia investigates serious engine icing incident on Boeing 747-800,” the link to the news website is: http://news.aviation-safety.net/2013/08/20/russia-investigates-serious-engine-icing-incident-on-boeing-747-800/20, reported on August 2013
N
American Institute of Aeronautics and Astronautics
3
Mason et al.4 have proposed a hypothesis for possible ice accretion due to ice crystal ingestion based on the in-strumented flight-testing data collected in commuter and transport aircraft engine events. The hypothesis basically recognized that ingested ice crystals could begin to melt causing mixed-phase conditions within the compression system passage of the engine. This mixed-phase water mass would impinge and accrete on unheated surfaces within the engine where the local air temperature was significantly higher than freezing before entering the cloud. This ice crystal icing inside the engine compression system has been shown to create flow blockage and hardware damage, as shown in Ref. 3, such that the engine could no longer function properly. The hypothesis specifically stated that liquid water is a necessary condition locally for ice accretion to continue. Furthermore, it was believed that this ice crystal accretion phenomenon is not unique to commuter or transport aircraft engine type and therefore it was ex-pected that certain common physical mechanisms for ice crystal accretion on all jet engines should exist.
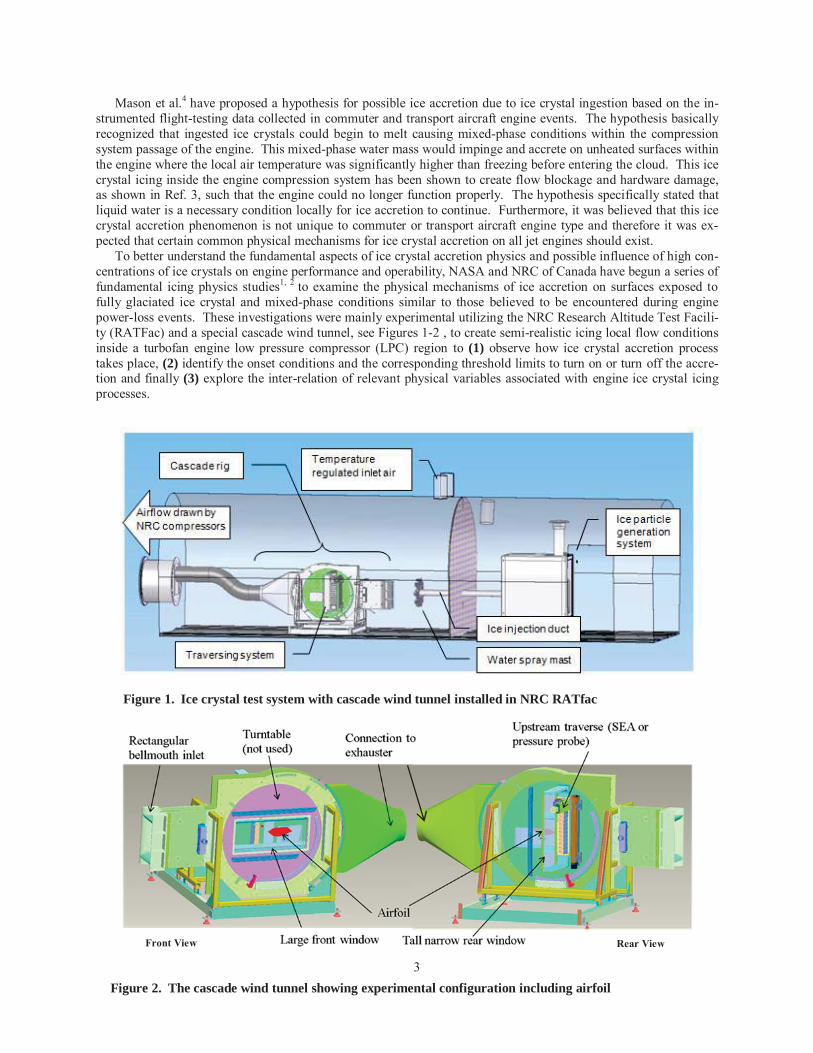
To better understand the fundamental aspects of ice crystal accretion physics and possible influence of high con-centrations of ice crystals on engine performance and operability, NASA and NRC of Canada have begun a series of fundamental icing physics studies1, 2 to examine the physical mechanisms of ice accretion on surfaces exposed to fully glaciated ice crystal and mixed-phase conditions similar to those believed to be encountered during engine power-loss events. These investigations were mainly experimental utilizing the NRC Research Altitude Test Facili-ty (RATFac) and a special cascade wind tunnel, see Figures 1-2 , to create semi-realistic icing local flow conditions inside a turbofan engine low pressure compressor (LPC) region to (1) observe how ice crystal accretion process takes place, (2) identify the onset conditions and the corresponding threshold limits to turn on or turn off the accre-tion and finally (3) explore the inter-relation of relevant physical variables associated with engine ice crystal icing processes.
3Figure 2. The cascade wind tunnel showing experimental configuration including airfoil
Figure 1. Ice crystal test system with cascade wind tunnel installed in NRC RATfac
Front View Rear View
American Institute of Aeronautics and Astronautics
4
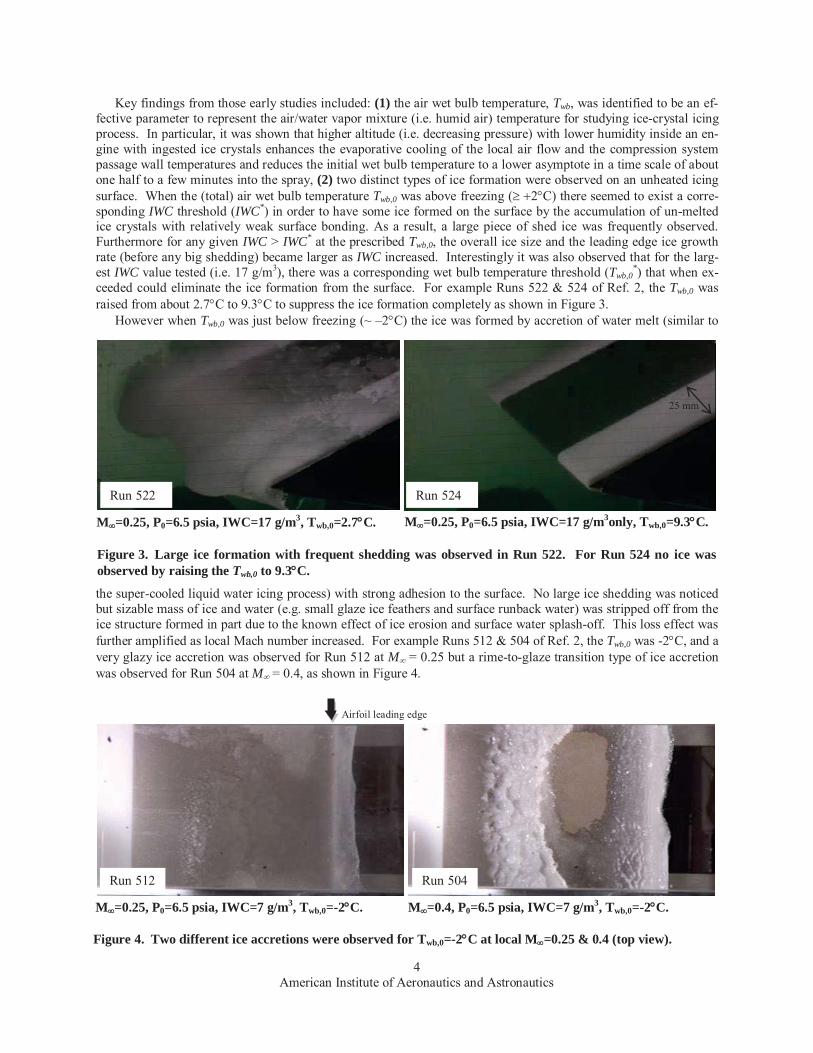
Key findings from those early studies included: (1) the air wet bulb temperature, Twb, was identified to be an ef-fective parameter to represent the air/water vapor mixture (i.e. humid air) temperature for studying ice-crystal icing process. In particular, it was shown that higher altitude (i.e. decreasing pressure) with lower humidity inside an en-gine with ingested ice crystals enhances the evaporative cooling of the local air flow and the compression system passage wall temperatures and reduces the initial wet bulb temperature to a lower asymptote in a time scale of about one half to a few minutes into the spray, (2) two distinct types of ice formation were observed on an unheated icing surface. When the (total) air wet bulb temperature Twb,0 was above freezing ( 2 C) there seemed to exist a corre-sponding IWC threshold (IWC*) in order to have some ice formed on the surface by the accumulation of un-melted ice crystals with relatively weak surface bonding. As a result, a large piece of shed ice was frequently observed. Furthermore for any given IWC > IWC* at the prescribed Twb,0, the overall ice size and the leading edge ice growth rate (before any big shedding) became larger as IWC increased. Interestingly it was also observed that for the larg-est IWC value tested (i.e. 17 g/m3), there was a corresponding wet bulb temperature threshold (Twb,0
*) that when ex-ceeded could eliminate the ice formation from the surface. For example Runs 522 & 524 of Ref. 2, the Twb,0 was raised from about 2.7 C to 9.3 C to suppress the ice formation completely as shown in Figure 3.
However when Twb,0 was just below freezing (~ –2 C) the ice was formed by accretion of water melt (similar to
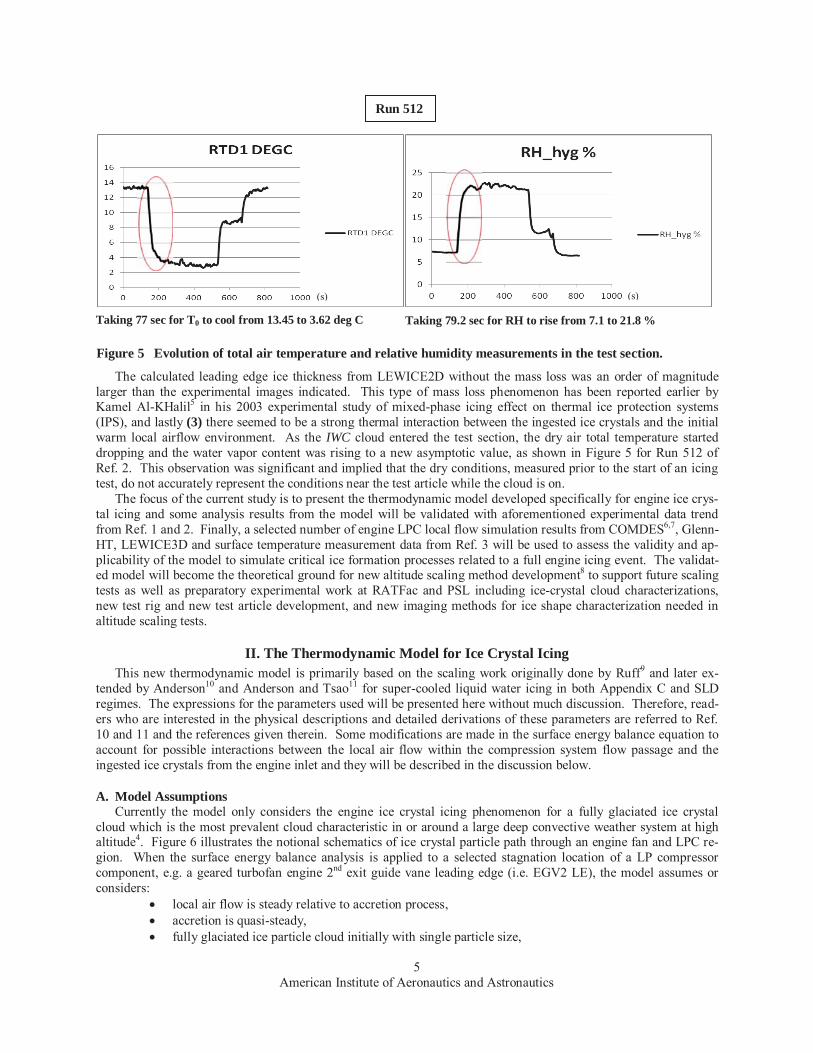
the super-cooled liquid water icing process) with strong adhesion to the surface. No large ice shedding was noticed but sizable mass of ice and water (e.g. small glaze ice feathers and surface runback water) was stripped off from the ice structure formed in part due to the known effect of ice erosion and surface water splash-off. This loss effect was further amplified as local Mach number increased. For example Runs 512 & 504 of Ref. 2, the Twb,0 was -2 C, and a very glazy ice accretion was observed for Run 512 at M = 0.25 but a rime-to-glaze transition type of ice accretion was observed for Run 504 at M = 0.4, as shown in Figure 4.
Run 512 Run 504
Figure 4. Two different ice accretions were observed for Twb,0=-2 C at local M =0.25 & 0.4 (top view).
M =0.25, P0=6.5 psia, IWC=7 g/m3, Twb,0=-2 C. M =0.4, P0=6.5 psia, IWC=7 g/m3, Twb,0=-2 C.
Airfoil leading edge
Figure 3. Large ice formation with frequent shedding was observed in Run 522. For Run 524 no ice was observed by raising the Twb,0 to 9.3 C.
Run 522 Run 524
M =0.25, P0=6.5 psia, IWC=17 g/m3, Twb,0=2.7 C. M =0.25, P0=6.5 psia, IWC=17 g/m3only, Twb,0=9.3 C.
25 mm
American Institute of Aeronautics and Astronautics
5
The calculated leading edge ice thickness from LEWICE2D without the mass loss was an order of magnitude larger than the experimental images indicated. This type of mass loss phenomenon has been reported earlier by Kamel Al-KHalil5 in his 2003 experimental study of mixed-phase icing effect on thermal ice protection systems (IPS), and lastly (3) there seemed to be a strong thermal interaction between the ingested ice crystals and the initial warm local airflow environment. As the IWC cloud entered the test section, the dry air total temperature started dropping and the water vapor content was rising to a new asymptotic value, as shown in Figure 5 for Run 512 of Ref. 2. This observation was significant and implied that the dry conditions, measured prior to the start of an icing test, do not accurately represent the conditions near the test article while the cloud is on.
The focus of the current study is to present the thermodynamic model developed specifically for engine ice crys-tal icing and some analysis results from the model will be validated with aforementioned experimental data trend from Ref. 1 and 2. Finally, a selected number of engine LPC local flow simulation results from COMDES6,7, Glenn-HT, LEWICE3D and surface temperature measurement data from Ref. 3 will be used to assess the validity and ap-plicability of the model to simulate critical ice formation processes related to a full engine icing event. The validat-ed model will become the theoretical ground for new altitude scaling method development8 to support future scaling tests as well as preparatory experimental work at RATFac and PSL including ice-crystal cloud characterizations, new test rig and new test article development, and new imaging methods for ice shape characterization needed in altitude scaling tests.
II. The Thermodynamic Model for Ice Crystal Icing This new thermodynamic model is primarily based on the scaling work originally done by Ruff9 and later ex-
tended by Anderson10 and Anderson and Tsao11 for super-cooled liquid water icing in both Appendix C and SLD regimes. The expressions for the parameters used will be presented here without much discussion. Therefore, read-ers who are interested in the physical descriptions and detailed derivations of these parameters are referred to Ref. 10 and 11 and the references given therein. Some modifications are made in the surface energy balance equation to account for possible interactions between the local air flow within the compression system flow passage and the ingested ice crystals from the engine inlet and they will be described in the discussion below.
A. Model Assumptions Currently the model only considers the engine ice crystal icing phenomenon for a fully glaciated ice crystal
cloud which is the most prevalent cloud characteristic in or around a large deep convective weather system at high altitude4. Figure 6 illustrates the notional schematics of ice crystal particle path through an engine fan and LPC re-gion. When the surface energy balance analysis is applied to a selected stagnation location of a LP compressor component, e.g. a geared turbofan engine 2nd exit guide vane leading edge (i.e. EGV2 LE), the model assumes or considers:
local air flow is steady relative to accretion process, accretion is quasi-steady, fully glaciated ice particle cloud initially with single particle size,
Figure 5 Evolution of total air temperature and relative humidity measurements in the test section.
Run 512
Taking 77 sec for T0 to cool from 13.45 to 3.62 deg C Taking 79.2 sec for RH to rise from 7.1 to 21.8 %
(s) (s)

American Institute of Aeronautics and Astronautics
6
no LWC supplement (i.e. fully glaciated ice crystal cloud at inlet) when ice particles experience some melting, Tice = Tmelt = Tf (i.e. 0 < MR < 1 ), when MR = 0 (no melting), Tice,i < Tice < Tf , when MR = 1 (fully melted), Tf < Tmelt < T0 , for partially-melted ice particle cloud, LWCt = IWCi * MR, IWCt = [IWCi * (1 – MR)] – VWCgain, on unheated surface (Twall could be fairly hot initially), Ts = Tf when glaze ice accreted or accumulated on surfaces.
B. The Surface Energy Balance Equation
As duly noted in Ref. 1 and 2, there are two distinct types of ice growth mechanism in ice crystal icing. It is ad-vantageous to present the corresponding equation accordingly from applying the mass and energy conservation laws on the icing surface. Here only the final governing equations and key expressions of parameters are presented with-out much discussion for brevity. These two types of ice growth mechanism are described as follows:
(1) Freezing dominated process on surface when cooling > heating (i.e. 0 n0 1)
evap conv kinetic freezeq q q q (1)
where
, ,0
0
,0
0
,1
0.622
v ws v w
evap e v vGv ws
p pP RHT T P
q m L hpP
T T
2,( / 2 ),conv c p air sq h T V c T
2 2
0 0, ) (1 ) ,2 2
( i gain lossimp tkineticV V
VWC V nq m IWC2imp t,m2imp t,
Vm
VVVmi
0 0 0 0, (1 ) .f i loss ffreeze melt imp n IWC MR V n nq m 0melt imp, n0mmm n0
Figure 6. The schematics of ice particle path through an engine fan and LPC region.
EGV 1 & 2
American Institute of Aeronautics and Astronautics
7
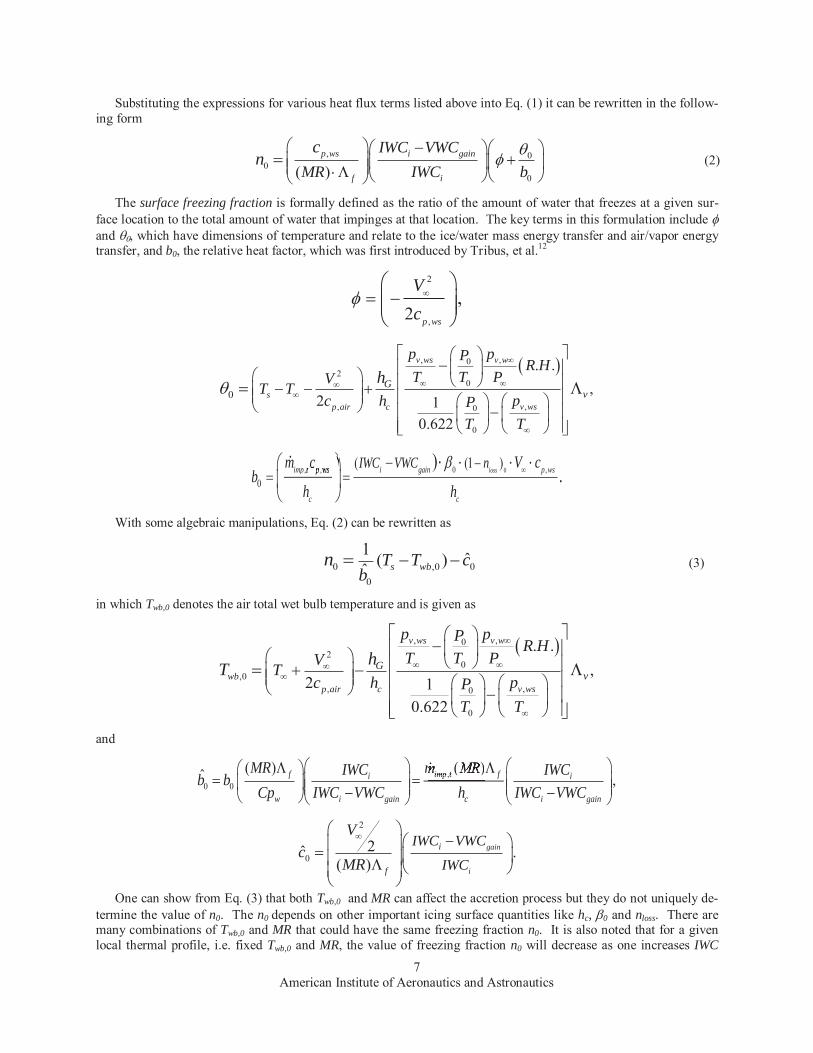
Substituting the expressions for various heat flux terms listed above into Eq. (1) it can be rewritten in the follow-ing form
, 00
0( )p ws i gain
f i
IWC VWCMR IWC b
cn (2)
The surface freezing fraction is formally defined as the ratio of the amount of water that freezes at a given sur-face location to the total amount of water that impinges at that location. The key terms in this formulation include and which have dimensions of temperature and relate to the ice/water mass energy transfer and air/vapor energy transfer, and b0, the relative heat factor, which was first introduced by Tribus, et al.12
2
,2,
p ws
Vc
, ,02
0
,, 0
0
0
. .,
2 10.622
v ws v w
sv wsp air c
Gv
p pP R HT T PV
T Tpc h P
T T
h
0, , 0 ,0
( (1 )).lossimp t p ws i gain p ws
c c
IWC VWC nm c V cb
h himpm ciimp t p w, ,,imp
With some algebraic manipulations, Eq. (2) can be rewritten as
0 ,0 00
1 ˆ( )ˆ s wbT T cb
n (3)
in which Twb,0 denotes the air total wet bulb temperature and is given as
, ,02
0,0
,, 0
0
. .,
2 10.622
v ws v w
wbv wsp air c
Gv
p pP R HT T PVT
pc h PT T
hT
and
,0 0
( ) ( )ˆ ,f imp t fi i
w i gain c i gain
MR m MRIWC IWCb bCp IWC VWC h IWC VWC
( )( )( ))((((imp t, ( ), ( ))( )(( )((p
2
02ˆ .
( )gain
i
i
f
IWC VWC
IWC
Vc
MR
One can show from Eq. (3) that both Twb,0 and MR can affect the accretion process but they do not uniquely de-termine the value of n0. The n0 depends on other important icing surface quantities like hc, 0 and nloss. There are many combinations of Twb,0 and MR that could have the same freezing fraction n0. It is also noted that for a given local thermal profile, i.e. fixed Twb,0 and MR, the value of freezing fraction n0 will decrease as one increases IWC

American Institute of Aeronautics and Astronautics
8
load. Similar behaviors were observed in super-cooled water icing. This strongly suggests that the most important parameter affecting the ice crystal accretion process is the freezing fraction. In addition, by letting n0 = 0, a total wet bulb temperature threshold is obtained
0 0 0 0ˆ ˆˆ ˆ .s fT T c T cb bˆs 0T T 0b00TT 0 (4)
It should be noted that some freezing of water melt would occur on surface if ,0wbT TT whereas some melting of
ice particle would occur on surface if ,0wbT TT .
(2) Melting dominated process on surface when heating > cooling (i.e. 0 m0 1)
conv evapkinetic meltq q q q (5)
Carrying out similar substitution procedures as described above, the surface melting fraction, formally defined as the ratio of the amount of ice that melts at a given surface location to the total amount of ice that impinges at that location, at stagnation can be rewritten from Eq. (5) as
0 ,0 0
0
=
ˆ( )ˆ (1 ( )) (1 ( ))gain gain
i i
wb sVWC VWC
IWC IWC
MR MRm T T cb MR MR (6)
Similar to the freezing dominated process, Eq. (6) shows that both Twb,0 and MR still affect the ice build-up pro-cess but they do not uniquely determine the value of m0. Further, for a given Twb,0 and MR, as one increases IWC load, m0 becomes smaller value ( 0) and the surface ice build-up will increase (both in size and rate). Likewise, for a given IWC cloud, as T0 rises, m0 becomes greater ( 1) and the surface ice formation will diminish. Asymp-totically the surface ice growth is proportional to (1 – m0).
To further understand whether in this regime the ice crystal icing phenomenon could be possibly turned on (i.e. m0 < 1) or turned off (m0 =1) by simply changing certain key variables, a special case of m0 =1 (i.e. fully melted condition) is studied with Eq. (6) and it is found that there exists an ice/water mass flux threshold to survive a com-plete melting on any given local stagnation surface
,0*,
( )s
f
c wbimp t
Y h T Tm* (c (imp t,
Y h (c (m (7)
in which
22
2 21 ( )
1 = 1, . gainf f
i
i gain
i
V MYY RT Y
VWCMR
IWC
IWC VWC
IWC
There are three distinctly different types of physical parameters involved to determine this threshold:
1. hc, representing the local surface convective heat transfer characteristics. The greater the local con-vective heat transfer is the larger the threshold would become. This suggests that with lower hc design stagnation regions inside the engine LPC the local surface might not have enough thermal margin to melt all possible impinging ice crystals for a given engine operation set point.
2. (Twb,0 - Ts), which represents the actual melting potential from air total wet bulb temperature to ice melting temperature. For a given engine LPC thermal profile, the lower the air pressure and water va-por content at higher flight altitude the smaller the air total wet bulb temperature becomes. Conse-quently it lessens the available melting potential inside the LPC which means the threshold would be lower. Unless the engine will increase its N1 setting or the aircraft will lower its flight altitude to raise its local air temperature, the ice crystal icing is likely to occur on surfaces with lower threshold.

American Institute of Aeronautics and Astronautics
9
3. and Y which are non-dimensional parameters denoting the ice crystal cloud kinetic heating and its melting profile right before impact. The net effect of this term (Y/ ) parametrically shows that the threshold will increase its value if the impinging IWC cloud could experience larger kinetic heating due to higher local inviscid flow velocity or the IWC cloud could have greater melting before impact. As a result, ice crystal icing would be more likely to occur at locations where the local inviscid flow velocity becomes slower or in engine operation conditions that do not promote more melting of ice particles early inside the LPC right before their impact. (e.g. the high altitude test points like DP 908 and SR-3 from the PSL engine icing test, see Ref. 3, 6 and 7)
Now considering for a given warm air total wet bulb temperature Twb,0 (> 0 ºC), from Eq. (7), it is shown that there exists a IWCi threshold to allow some ice to remain on the surface and it is written as
* ,0
0 0
( ).
(1 )s
f
gainc wb
loss
h T TIWC VWC
V n (8)
It suggests that if IWCi IWC*, no ice could survive the melting but if IWCi > IWC*, some ice build-up would re-main on the surface. As for a given IWCi cloud, Eq. (7) also shows that there exists a Twb,0 threshold to melt all the ice on local surface. This wet bulb temperature threshold is written as
* ,
.f
s
imp t
c
T TY h
mimp t,m (9)
Similarly it suggests that if Twb,0 T*, no ice could survive the melting but if Twb,0 < T*, some ice build-up would remain on the surface.
III. Model Analysis and Comparison with Existing Experimental Data In this section, some model analysis results are compared with aforementioned experimental data trend observed
from Ref. 1-3. The results are further divided into two parts:
A. NRC RATfac Test Data – Local Flow Simulation The Runs 506, 522, 524 and 530 were conducted on March 9, 10 and 11, 2011 separately with condition listed
below in Table 1. For Run 506, the initial Twb,0 was set to be -2 ºC. During the 6 minutes of IWC only spray some ice crystal accretion was formed on the wedge model mid-span leading edge surface with no large ice shedding ob-served. The thermocouple reading from the leading edge location was fluctuating around (-0.8, 0.2) ºC. Applying the Run 506 test condition to Eq. (4) it was shown that with Twb,0 = -2 ºC, MR = 0.1, and estimated nloss = 0.92, the total wet bulb temperature threshold is about - 0.8 .T CT C- 0.8 - 0 8 (10)
Since the initial Twb,0 set value is less than the threshold, some freezing of water melt would occur on surface.
Table 1 Run 506, 522, 524 and 530 test conditions
Test Conditions Run 506 (03-09-11)
Run 522 (03-10-11)
Run 524 (03-10-11)
Run 530 (03-11-11)
Ice Water Content IWCi g/m3 7.0 17.0 17.0 3.0 Ice Particle MMD MMD μm 115 115 115 115 Liquid Water Content LWCi g/m3 0.0 0.0 0.0 0.0 Total Temperature T0 ºC 13 20 23.5 23 Total Pressure P0 psia 6.5 6.5 6.5 6.5 Relative Humidity RH % 8.0 13.0 27.0 9.0 Total Wet Bulb temperature Twb,0 ºC -2.0 3.0 9.3 3.0 Mach Number M 0.4 0.25 0.25 0.25 Spray Time t min 6 2 2 3 Angle of Attack deg -6 -6 -6 0

American Institute of Aeronautics and Astronautics
10
For Run 530 the initial Twb,0 was set to be 3 ºC. After 3 minutes of IWC only spray, no ice formation was ob-
served on the test article surface. The surface thermocouple reading from the wedge model leading edge in time average was around 4.0 ºC. Applying the Run 530 test condition to Eq. (8) it was shown that with Twb,0 = 3 ºC, VWCgain = 0.935g/m3, MR = 0.3, and estimated nloss = 0.90, the IWC threshold is approximately
* 33.8 / .IWC g m (11)
Since the IWCi value is less than the threshold, no ice would survive (i.e. m0 =1, all melted). However if one let the IWCi be greater than the threshold, some ice build-up should remain on the surface. This was exactly the ra-tionale behind Run 522. It was a 2 minutes of IWCi only spray with everything the same as Run 530 except IWCi = 17 g/m3 and = -6 deg. For Run 522 a large ice formation with frequent ice shedding and growing was observed on the wedge airfoil surface at the same Twb,0 = 3 ºC, see Fig. 3.
Further, one could ask if it were possible to turn off this large ice build-up process completely by raising the air total wet bulb temperature. This was the design objective for Run 524 in which the Twb,0 was raised from 3 to 9.3 ºC. The large ice build-up completely vanished and became surface runback water (see Fig. 3). The thermocouple reading for this case in time average was around 7.0 ºC. Applying the Run 524 condition to Eq. (9) it was shown that with Twb,0 = 9.3 ºC, VWCgain = 0.967g/m3, MR = 0.41,and estimated nloss = 0.90, the Twb,0 threshold is about
* 7.9 T CC (12) Since the Twb,0 value now is much warmer than the threshold T*, all ice should be melted on the surface accord-
ing to the model estimates and the test data confirmed that there was no ice remaining on the wedge model surface.
B. NASA PSL Ice Crystal Icing Engine Test - Full Engine Flow Simulation A known AlliedSignal ALF 502-R5 turbofan engine RB condition, FLT 850, was chosen as the baseline for this
analysis. Due to very limited number of instruments installed in the engine LPC region for the 2013 PSL engine icing test, some local flow details of the ALF 502-R5 LF01 engine in FLT 850 condition were extracted from the baseline test data DP 443 or were calculated from COMDES/MELT, Glenn-HT and LEWICE3D simulations if the needed information was not available. In the analysis the main icing site under consideration is the 2nd exit guide vane stator leading edge (i.e. EGV2 LE).
The proposed key connection to a full engine RB event is that if ice crystal icing were sustained in EGV2 LE a RB event would occur for this engine and the stronger this ice build-up process were in EGV2 LE the quicker the RB event would occur. On the contrary, if icing is not allowed in EGV2 LE then no engine RB event would likely take place.
Table 2 displays a number of FLT 850 related test conditions that were selected for the comparison and the test conditions are all scaled by the baseline, DP 443. From the table one clearly can see how the change in IWC, N1 or T could affect the engine RB phenomenon. The PSL test data showed that an engine RB event can be turned off completely by reducing the IWC load like DP 574, or by increasing the fan speed N1 like DP 735, or by raising the ambient air temperature T like DP 740. The engine RB event can also be further enhanced by increasing the IWC intake like DP 577. It should be noted that the DP 729 is another FLT 850 baseline variant with 57% of the baseline IWC value that has experienced a slower called RB event.
For the first four test conditions in Table 2 Eq. (7) was used to determine the ice mass flux threshold. However the actual ice mass flux at EGV2 LE location was approximated from the combined Glenn-HT and LEWICE3D simulations. The final results were all scaled by the ice/water mass flux threshold of the baseline, DP 443, for data sanitization purpose.
Table 2 FLT 850 related test conditions in 2013 PSL engine icing test
Description D P Alt M T N1 IWC RB (Y, N) RB (Y, N) Call Time FLT 850 443 1 1 1 1 1 Y 1
574 1 1 1 1 0.33 N 7.1 577 1 1 1 1 1.23 Y 0.9
FLT 850-1 729 1 1 1 1 0.57 Y 1.7 735 1 1 1 1.06 0.57 N 6.9 740 1 1 1.02 1 0.57 N 3.8

American Institute of Aeronautics and Astronautics
11
Similarly for the last two test conditions in Table 2 Eq. (9) was used to calculate the Twb,0 threshold. To deter-mine the local air total wet bulb temperature Twb,0 the local surface temperature measurement data at EGV1 and EGV2 were also analyzed to find the estimate. The values were again scaled by the baseline Twb,0 threshold. The calculated results were tabulated in Table 3. It was noticed that for each RB event test condition there was ice build-up at EGV2 LE from the model prediction, and similarly for each non RB event condition no ice was allowed to form at EGV2 LE.
Table 3 The model analysis results
Data Point Location ,imp tmimp t,m *,imp tm*
imp t,m Icing (Y, N) 443 EGV2 LE 1.74 1 Y 574 EGV2 LE 0.57 1 N 577 EGV2 LE 2.14 1 Y 729 EGV2 LE 1.00 1 Y
Data Point Location Twb,0 T* Icing (Y, N)
735 EGV2 LE 1.003 1 N 740 EGV2 LE 1.006 1 N
As stated in the beginning of this comparison, it was believed and hypothesized by the first author that ice crystal
icing occurring at EGV2 LE location is directly tied to the formation of an engine RB event. The preliminary results from the model analysis seem to agree well with the PSL engine icing test data trend. This would indicate there is a strong connection between the local ice formation inside an engine LPC at EGV2 LE and the engine RB phenome-non.
V. Conclusion A thermodynamic model is developed to describe possible mechanisms of ice formation on unheated surfaces in-
side a turbofan engine compression system from fully glaciated ice crystal clouds. It is shown from the analysis that, in general, there could be two distinct types of ice formation: (1) when the surface is dominated by the freezing of water melt from fully or partially melted impinging ice crystals, the ice structure is formed from accretion with strong adhesion to the surface, and (2) when the surface is instead dominated by the further melting of ice crystals, the ice structure is formed from accumulation of un-melted ice crystals with relatively weak bonding to the surface. The model is able to capture important qualitative trends of the fundamental ice-crystal icing phenomenon reported early from the research collaboration work by NASA and the National Research Council (NRC) of Canada.
In addition, preliminary model analyses are performed to compare the model’s estimates with selected data from the 2013 full scale ALF 502-R5 LF01 turbofan engine ice crystal icing test conducted in the NASA Glenn PSL. The preliminary results showed that the model is able to capture important qualitative trend of turning on (or off) the ice crystal ice formation in the engine low pressure compressor EGV2 LE area under different icing conditions that ul-timately lead to (or suppress) an engine core roll back (RB) event. Detailed analyses on other interesting test data from the PSL test matrix, e.g. the FLT 855 no RB test point and six revenue service RB field event test points desig-nated as RS-1 to RS-6 in Ref. 3, will be performed to assess the overall validity and effectiveness of the proposed model. New altitude scaling methods derived from this model for simulating ice crystal accretion inside a turbofan engine will be developed and evaluated in PSL in the coming NASA engine icing test.
Acknowledgments This work is supported by the Atmospheric Environment Safety Technology Project (AEST) in the NASA Avia-
tion Safety Program, and is in response to the Engine Icing Technical Challenge. The first author is supported cur-rently under a NASA Glenn ARTS contract. Special thanks are extended to Dr. Ron Colantonio and Mr. Thomas Bond for their support of the work. The first author also wishes to acknowledge the help and guidance he received from Mr. Joe Veres (The Engine Icing Technical Lead) for providing the general aero-thermodynamic flow simula-tion of the overall engine system from the Honeywell Engines customer deck (CD) and COMDES/MELT, Dr. Da-vid Rigby (Vantage Partners, LLC) for providing the detailed engine LPC local flow simulation from Glenn-HT and Mr. Colin Bidwell for providing the detailed ice particle trajectory and phase change information from the LEWICE3D simulation.

American Institute of Aeronautics and Astronautics
12
References
1 Struk, P., Currie, T., Wright, W. B., Knezevici, D. C., Fuleki, D., Broeren, A., Vargas, M. and Tsao, J. C., “Fundamental Ice Crystal Accretion Physics Studies,” SAE 2011 International Conference on Aircraft and Engine Icing and Ground Deicing, SAE 2011-38-0018, June 2011 or NASA/TM-2012-217429, 2012.
2 Currie, T. C., Struk, P. M., Tsao, J. C., Fuleki, D. and Knezevici, D. C., “Fundamental Study of Mixed-Phase Icing with Application to Ice Crystal Accretion in Aircraft Jet Engines,” AIAA-2012-3035, June 2012
3 Oliver, M., “Inaugural Ice Crystal Icing Engine Test in the Propulsion Systems laboratory at NASA Glenn Research Cen-ter,” abstract CID# 1888452, to be presented in AIAA Aviation 2014 ASE Conference, June 2014.
4 Mason, J.G., Strapp, J.W. and Chow, P., “The Ice Particle Threat to Engines in Flight,” AIAA-2006-0206, January 2006. 5 Kamel Al-KHalil, “Assessment of Effects of Mixed-Phased Icing Conditions on Thermal Ice Protection Systems,”
DOT/FAA/AR-03/48, May 2003. 6 Veres, J. P., Jorgenson, P. C. E., “Modeling Commercial Turbofan Engine icing Risk with Ice Crystal Ingestion,” AIAA-
2013-2679, June 2013. 7 Veres, J. P., Jorgenson, P. C. E., “Modeling Commercial Turbofan Engine with Ice Crystal Ingestion; Follow-on,” abstract
CID# 1893152, to be presented in AIAA Aviation 2014 ASE Conference, June 2014. 8 Struk, P. M., Bencic, T., Tsao, J. C., Fuleki, D. and Knezevici, D. C., “Preparation for Ice-Crystal Icing Scaling Studies at
the NRC Research Altitude Test Facility,” AIAA-2013-2675, June 2013 9 Ruff, G.A., “Analysis and Verification of the Icing Scaling Equations,” AEDC-TR-85-30, Vol 1 (rev), March 1986. 10 Anderson, D. N., “Manual of Scaling Methods,” NASA /CR–2004-212875, March 2004. 11 Anderson, D. N. and Tsao, J. C., “Ice Shape Scaling for Aircraft in SLD Conditions,” NASA/CR-2008-215302,
DOT/FAA/AR-07/55, September 2008. 12 Tribus, Myron, Young, G.B.W. and Boelter, L.M.K., “Analysis of Heat Transfer Over a Small Cylinder in Icing Condi-
tions on Mount Washington,” Trans. ASME, vol. 70, November 1948, pp 971 – 976.