positive ageing in age friendly cities and counties · the age-friendly cities and counties...
TRANSCRIPT

Findings from the HaPAI Survey
POSITIVE AGEING IN AGE FRIENDLY CITIES AND COUNTIESLOCAL INDICATORS FOR IRELAND


Findings from the HaPAI Survey
POSITIVE AGEING IN AGE FRIENDLY CITIES AND COUNTIESLOCAL INDICATORS FOR IRELAND

ACKNOWLEDGMENTS
The Healthy and Positive Ageing Initiative (HaPAI) is a joint research programme led by the Department of Health with the Health Service Executive, Age-friendly Ireland and The Atlantic Philanthropies. The Initiative is part of the Research Services Unit in the Department of Health and one of its key objectives is to support and use research to better inform policy responses and service provision for people as they age in Ireland.
This report presents information from the HaPAI survey of Age Friendly Cities and Counties. This is a study involving adults aged 55 and older in 21 Local Authorities in Ireland.
The study was conducted by the HaPAI research team:
• Sinead Shannon, Programme Manager• Sarah Gibney, Programme Analyst• Eithne Sexton, Former HaPAI/TILDA Research Fellow (to March 2016)• Mark Ward, HaPAI TILDA Research Fellow (from September 2016)• Tara Moore, Research Assistant (from September 2016)• Niamh Moran, Research Assistant (from September 2016)
The team would like to thank all survey respondents who generously gave their time to share their views, circumstances, and experiences, and thank the following Local Authorities for taking part and co-funding the survey in their area: Clare; Cork County, Cork City; Cavan; Dublin City; Dublin Fingal; Dun Laoghaire-Rathdown; South Dublin; Galway County; Galway City; Kildare; Kilkenny; Laois; Limerick City and County; Louth; Meath; Mayo; Tipperary; Wicklow; and, Wexford.
The team would also like to acknowledge the support of the funders of the Initiative, the Atlantic Philanthropies, the HSE and the Department of Health and to thank the members of the HaPAI Steering Group and the HaPAI Oversight Group for their guidance throughout the project.
Suggested Citation: Gibney S, Ward M, Shannon S, Moore T, Moran N. Positive ageing in age friendly cities and counties: local indicators report. Dublin: Department of Health, 2018.
The Healthy and Positive Ageing Initiative, Department of Health, Hawkins House, Dublin 2.
www.hapai.net

CONTENTS
FOREWORD 3
LIST OF TABLES AND FIGURES 4
1 INTRODUCTION 9
Policy Context 10The Age-Friendly Cities and Counties programme 11The Healthy and Positive Ageing Initiative 12Report aims and structure 15
2 METHODOLOGY 17
Sampling strategy and data collection 18Response rates and sample weights 19Analysis
3 PARTICIPATION 24
NPAS Goal 1: Participation 253.1 Civic participation and employment 263.2 Lifelong learning 303.3 Volunteering and active citizenship 333.4 Social participation 413.5 Transportation 50
4 HEALTH 58
NPAS Goal 2: Health 594.1 Health status and behaviours 604.2 Community support and health services 734.3 Caregiving 73
5 SECURITY 88
NPAS Goal 3: Security 895.1 Housing 905.2 Outdoor spaces and buildings 975.3 Safety and perception of safety 120
6 AGEISM, RESPECT AND SOCIAL INCLUSION 126
NPAS cross-cutting objective: Combatting ageism 596.1 Ageism, respect and social inclusion 120
7 COMMUNICATION AND INFORMATION 140
NPAS cross-cutting objective:Improving information access 597.1 Communication and information 120
APPENDICES 153


3 POSITIVE AGEING LOCAL INDICATORS
FOREWORD
In recent years we have become acutely aware of demographic changes in our society, in particular the increasing number of older people. It is fair to say that much of the recent discussion on ageing in Ireland has centred its impact on services and implications for public policy. While these challenges are very real, it is equally necessary to celebrate the fact that people are living longer and healthier lives and to value the opportunities this brings to our society.
The National Positive Ageing Strategy is fundamental in setting out this vision of ageing in Ireland. The strategy and its goals underline the values and principles to which Government, its agencies and civic society can align their policies and strategies. The Healthy and Positive Ageing Initiative (HaPAI) has been a key actor in helping to realise the vision of the National Positive Ageing Strategy through its research. The first Positive Ageing National Indicators report, published in 2016, developed a set of 56 positive ageing indicators against which changes in older people’s health and well-being could be monitored.
Also in 2016 the HaPAI collaborated with Local Authorities and the Age Friendly Ireland programme to carry out research with people aged 55 and over. The Local Indicators Report will for the first time in Ireland shine a light on the experiences and preferences of older people living in our communities. This data offers the potential to inform service provision and to prioritise the allocation of resources to those most in need on a county by county basis in those participating areas. A significant outcome of the survey is the ability to identify the gaps and supports needed by older people to live healthy and independent lives as they grow older. At its core, this survey is providing a voice to older people living in Ireland that will inform policy making and service provision at a local level.
I am delighted that initiatives like the Local Indicators Report will continue to keep the National Positive Ageing Strategy relevant and at the forefront of all our minds. I hope this report will provide Local Authorities and all those working to improve the lives of older people the insights they require to continue providing age-friendly communities throughout Ireland.
Minister of State for Mental Health and Older People

4
LIST OF TABLES
TABLE 1 ALIGNMENT BETWEEN NPAS GOALS AND HAPAI SURVEY THEMES 14
TABLE 2 SURVEY SAMPLE AND RESPONSE RATE 19
TABLE 3 SOCIO-DEMOGRAPHIC, SOCIO-ECONOMIC, AND HEALTH INDICATORS 20
TABLE 4 WEIGHTED DEMOGRAPHIC, LOCATION, AND SOCIO-ECONOMIC CHARACTERISTICS 22
TABLE 5 PERCENTAGE WHO RETIRED EARLIER THAN AGED 66 YEARS GENDER (RETIRED RESPONDENTS ONLY) 27
TABLE 6 DECISION TO RETIRE BY GENDER AND AGE (RETIRED RESPONDENTS ONLY) 27
TABLE 7 PERCENTAGE OF ADULTS AGED 65+ WHO WERE EMPLOYED IN EACH LOCAL AUTHORITY AREA 28
TABLE 8 PERCENTAGE WHO REPORTED ATTENDING TRAINING OR EDUCATION IN THE PREVIOUS 12 MONTHS BY LOCAL AUTHORITY AREA. 31
TABLE 9 PERCENTAGE WHO VOLUNTEERED AT LEAST ONCE PER MONTH BY LOCAL AUTHORITY AREA 35
TABLE 10 PERCENTAGE WHO ENGAGED IN A POLITICAL ACTIVITY, BY LOCAL AUTHORITY AREA 38
TABLE 11 PERCENTAGE WHO PARTICIPATED IN COMMUNITY ACTIVITIES AT LEAST ONCE A MONTH BY LOCAL AUTHORITY AREA 41
TABLE 12 BARRIERS TO SOCIAL PARTICIPATION IN EACH LOCAL AUTHORITY AREA 43
TABLE 13 PERCENTAGE WHO MET AT LEAST MONTHLY WITH FRIENDS/RELATIVES/COLLEAGUES BY LOCAL AUTHORITY AREAS 47
TABLE 14 PUBLIC TRANSPORT ACCESS AND RATINGS BY LOCAL AUTHORITY AREA 51
TABLE 15 PERCENTAGE WITH DIFFICULTIES CAUSED BY LACK OF TRANSPORT BY LOCAL AUTHORITY AREA 53
TABLE 16 HEALTH CHARACTERISTICS 62
TABLE 17 SELF-RATED HEALTH OF ADULTS BY LOCAL AUTHORITY AREA 63
TABLE 18 PERCENTAGE WHO REPORTED CHRONIC CONDITIONS BY LOCAL AUTHORITY AREA 64
TABLE 19 PERCENTAGE WHO REPORTED ACTIVITY-LIMITING HEALTH CONDITIONS BY LOCAL AUTHORITY AREA 65
TABLE 20 SMOKING STATUS BY LOCAL AUTHORITY AREA 66
TABLE 21 WEEKLY ALCOHOL CONSUMPTION BY LOCAL AUTHORITY AREA 67
TABLE 22 WALKING IN LOCAL AREA FOR HEALTH OR FITNESS BY LOCAL AUTHORITY AREA 69
TABLE 23 AT LEAST 150 MINUTES OF MODERATE PHYSICAL ACTIVITY BY LOCAL AUTHORITY AREA 71
TABLE 24 UPTAKE OF PREVENTATIVE HEALTH MEASURES (FLU VACCINATION – AGE 65+; CHOLESTEROL TESTS AND BLOOD PRESSURE CHECKS) 75
TABLE 25 DIFFICULTY ACCESSING HEALTH SERVICES BY LOCAL AUTHORITY AREA 79
TABLE 26 EPERCENTAGE CARING REGULARLY FOR CHILDREN OR GRANDCHILDREN BY GENDER AND AGE 81

5 POSITIVE AGEING LOCAL INDICATORS
TABLE 27 PERCENTAGE CARING REGULARLY FOR CHILDREN OR GRANDCHILDREN BY LOCAL AUTHORITY AREA 82
TABLE 28 PERCENTAGE CARING REGULARLY FOR OLDER OR DISABLED RELATIVE BY GENDER AND AGE 83
TABLE 29 PERCENTAGE CARING REGULARLY FOR OLDER OR DISABLED RELATIVE BY LOCAL AUTHORITY AREA 84
TABLE 30 PERCENTAGE CARING REGULARLY FOR CHILDREN / GRANDCHILDREN OR PARENT / OLDER OR DISABLED RELATIVE BY GENDER AND AGE 85
TABLE 31 PERCENTAGE CARING REGULARLY FOR CHILDREN / GRANDCHILDREN OR PARENT / OLDER OR DISABLED RELATIVE BY LOCAL AUTHORITY AREA 86
TABLE 32 PERCENTAGE REPORTING HOUSING UPKEEP AND CONDITIONS PROBLEMS BY LOCAL AUTHORITY AREA 91
TABLE 33 PERCENTAGE REPORTING HOUSING FACILITY AND HEATING PROBLEMS BY LOCAL AUTHORITY AREA 92
TABLE 34 PERCENTAGE WITH HOUSING UPKEEP AND CONDITIONS DIFFICULTIES WHO WOULD LIKE HELP WITH MAINTENANCE AND UPKEEP 93
TABLE 35 AVERAGE SATISFACTION WITH THE BUILT ENVIRONMENT BY LOCAL AUTHORITY AREA (SCORE 0-14, LOW TO HIGH) 98
TABLE 36 DISSATISFACTION WITH ASPECTS OF THE URBAN BUILT ENVIRONMENT BY LOCAL AUTHORITY AREA 99
TABLE 37 DISSATISFACTION WITH FACILITIES AND APPEARANCE OF THE URBAN BUILT ENVIRONMENT BY LOCAL AUTHORITY AREA 100
TABLE 38 DISSATISFACTION WITH THE QUALITY AND CONTINUITY OF PATHS OR PAVEMENTS BY LOCAL AUTHORITY AREA 102
TABLE 39 DISSATISFACTION WITH THE WALKABILITY OF THE AREA BY LOCAL AUTHORITY AREA 103
TABLE 40 DIFFICULTY ACCESSING ESSENTIAL SERVICES BY LOCAL AUTHORITY AREA 106
TABLE 41 DIFFICULTY ACCESSING SOCIAL SERVICES BY LOCAL AUTHORITY AREA 107
TABLE 42 ACCESS TO POSTAL SERVICES BY LOCAL AUTHORITY AREA 108
TABLE 43 ACCESS TO BANKING SERVICES BY LOCAL AUTHORITY AREA 109
TABLE 44 ACCESS TO PUBLIC TRANSPORT BY LOCAL AUTHORITY AREA 110
TABLE 45 ACCESS TO SHOPS OR SUPERMARKETS BY LOCAL AUTHORITY AREA 111
TABLE 46 ACCESS TO GARDAI OR GARDA STATION BY LOCAL AUTHORITY AREA 112
TABLE 47 ACCESS TO CINEMA OR OTHER ENTERTAINMENT BY LOCAL AUTHORITY AREA 113
TABLE 48 ACCESS TO RECREATIONAL PARK OR GREEN AREA BY LOCAL AUTHORITY AREA 114
TABLE 49 ACCESS TO COMMUNITY CENTRE/VENUE FOR MEETING FRIENDS BY LOCAL AUTHORITY AREA 115
TABLE 50 ACCESS TO LIBRARIES BY LOCAL AUTHORITY AREA 116
TABLE 51 ACCESS TO RESTAURANTS OR CAFÉS BY LOCAL AUTHORITY AREA 117
TABLE 52 PERCENTAGE WHO FELT LESS THAN SAFE OUT AND ABOUT DURING THE DAY/ AT NIGHT BY LOCAL AUTHORITY AREA 121
TABLE 53 PERCENTAGE OF ADULTS AGED 55+ WHO REPORTED BEING ISOLATED OFTEN OR SOME OF THE TIME BY LOCAL AUTHORITY AREA 130

6
TABLE 54 PERCENTAGE OF ADULTS AGED 55+ WHO EXPERIENCED NEGATIVE ATTITUDES AND BEHAVIOURS AS AN OLDER PERSON BY LOCAL AUTHORITY AREA 132
TABLE 55 PERCENTAGE OF ADULTS AGED 55+ WHO PERCEIVE NEGATIVE ATTITUDES TOWARDS OLDER PEOPLE TAKING PART IN COMMUNITY ACTIVITIES BY LOCAL AUTHORITY AREA 133
TABLE 56 PERCENTAGE OF ADULTS AGED 55+ WHO REPORTED HAVING A FRIEND BELOW THE AGE OF 30 BY LOCAL AUTHORITY AREA 135
TABLE 57 PERCENTAGE WHO FEEL ‘IN TUNE’ WITH THE PEOPLE AROUND THEM BY FREQUENCY AND LOCAL AUTHORITY 137
TABLE 58 INTERNET USE AMONG ADULTS AGED 55+ BY LOCAL AUTHORITY AREA 144
TABLE 59 HOUSEHOLD INTERNET CONNECTIONS BY LOCAL AUTHORITY AREAS 146
TABLE 60 LEVEL OF DIFFICULTY ACCESSING INFORMATION ON LOCAL ACTIVITIES AND EVENTS BY LOCAL AUTHORITY AREA 147
TABLE 61 LEVEL OF DIFFICULTY ACCESSING INFORMATION ON LOCAL ACTIVITIES AND EVENTS AMONG ADULTS AGED 55+ BY LOCAL AUTHORITY AREA 148
LIST OF FIGURES
FIGURE 1 FACTORS ASSOCIATED WITH PAID EMPLOYMENT AGE 65+ 29
FIGURE 2 FACTORS ASSOCIATED WITH PARTICIPATING IN LIFELONG LEARNING 32
FIGURE 3 FACTORS ASSOCIATED WITH VOLUNTEERING AT LEAST MONTHLY 36
FIGURE 4 FACTORS ASSOCIATED WITH POLITICAL ENGAGEMENT 39
FIGURE 5 FACTORS ASSOCIATED WITH COMMUNITY PARTICIPATION 45
FIGURE 6 FACTORS ASSOCIATED WITH MEETING FRIENDS, RELATIVES AND COLLEAGUES AT LEAST ONCE A MONTH 48
FIGURE 7 FACTORS ASSOCIATED WITH TRANSPORT CAUSING DIFFICULTY SOCIALISING 54
FIGURE 8 FACTORS ASSOCIATED WITH TRANSPORT CAUSING DIFFICULTY DOING ESSENTIAL TASKS 55
FIGURE 9 FACTORS ASSOCIATED WITH TRANSPORT CAUSING DIFFICULTY GETTING TO HEALTH AND SOCIAL CARE APPOINTMENTS 56
FIGURE 10 FACTORS ASSOCIATED WITH GOOD/VERY GOOD HEALTH SELF-RATED HEALTH 68
FIGURE 11 FACTORS ASSOCIATED WITH WALKING IN THE LOCAL AREA FOR HEALTH OR FITNESS 70
FIGURE 12 FACTORS ASSOCIATED WITH 150 MINUTES MODERATE PHYSICAL ACTIVITY PER WEEK 72
FIGURE 13 FACTORS ASSOCIATED WITH FLU VACCINATION UPTAKE AGE 65+ 76
FIGURE 14 FACTORS ASSOCIATED WITH RECEIVING A CHOLESTEROL TEST 77
FIGURE 15 FACTORS ASSOCIATED WITH RECEIVING A BLOOD PRESSURE CHECK 78
FIGURE 16 FACTORS ASSOCIATED WITH DIFFICULTY ACCESSING LOCAL HEALTH SERVICES 80
FIGURE 17 FACTORS ASSOCIATED WITH HOUSING MAINTENANCE PROBLEMS 93
FIGURE 18 FACTORS ASSOCIATED WITH HOUSING CONDITION PROBLEMS 94

7 POSITIVE AGEING LOCAL INDICATORS
FIGURE 19 FACTORS ASSOCIATED WITH HOUSING FACILITY PROBLEMS 95
FIGURE 20 FACTORS ASSOCIATED WITH HOUSING HEATING PROBLEMS 96
FIGURE 21 FACTORS ASSOCIATED WITH DIFFICULTY WALKING IN THE LOCAL AREA 104
FIGURE 22 FACTORS ASSOCIATED WITH DIFFICULTIES ACCESSING ESSENTIAL SERVICES 118
FIGURE 23 FACTORS ASSOCIATED WITH DIFFICULTIES ACCESSING SOCIAL SERVICES 119
FIGURE 24 FACTORS ASSOCIATED WITH FEELING UNSAFE ‘OUT AND ABOUT’ DURING THE DAY 122
FIGURE 25 FACTORS ASSOCIATED WITH FEELING UNSAFE ‘OUT AND ABOUT’ AT NIGHT 123
FIGURE 26 FACTORS ASSOCIATED WITH FEELING UNSAFE IN URBAN ENVIRONMENTS 124
FIGURE 27 FACTORS ASSOCIATED WITH FEELING SOCIALLY ISOLATED 131
FIGURE 28 FACTORS ASSOCIATED WITH PERCEIVED NEGATIVE ATTITUDES 134
FIGURE 29 FACTORS ASSOCIATED WITH HAVING A FRIEND UNDER THE AGE OF 30 136
FIGURE 30 FACTORS ASSOCIATED WITH FEELING IN TUNE WITH OTHER PEOPLE 138
FIGURE 31 FACTORS ASSOCIATED WITH INTERNET USE 145
FIGURE 32 FACTORS ASSOCIATED WITH DIFFICULTY ACCESSING INFORMATION ON LOCAL ACTIVITIES AND EVENTS 149
FIGURE 33 FACTORS ASSOCIATED WITH DIFFICULTY ACCESSING INFORMATION ON HEALTH SERVICES 150

8

9 POSITIVE AGEING LOCAL INDICATORS / INTRODUCTION
INTRODUCTION
1

10
This report presents the first results of a survey carried out jointly by the Healthy and Positive Ageing Initiative and the Age Friendly Ireland programme in 20 local authority areas in Ireland. The survey was carried out to provide evidence about the experiences and preferences of older people and to identify the gaps in services and supports needed to allow them to age positively in their local communities. Demographic change has the potential to create opportunities and challenges for communities of the future. According to a recently published report by the ESRI, the proportion of people aged 65 and over is due to increase from 13% to between 17 and 19% and the number of people in this age group is predicted to increase by between 58 and 63% (Wren et al. 2017). In addition, the ESRI predicts, the numbers of people aged 80 and over will increase by between 85 and 94 %. This changing demographic profile has major implications for public policy, service provision, long-term planning and society as a whole, across areas as diverse as housing, transport, health, education, employment, tourism, business development, and volunteering.
The World Health Organisation (WHO) identified population ageing as one of humanity’s greatest triumphs and greatest challenges. The WHO argues that countries can afford to get old if governments, international organisations and civil society enact “active ageing” policies and programmes that enhance the health, participation and security of older citizens. “Making a city age-friendly is one of the most effective policy approaches for responding to demographic ageing” (WHO 2002).
The concept of ‘age-friendliness’ is linked to an initiative started by the WHO in 2007 called the WHO Global Age-Friendly Cities project. This project took place with participation from 33 countries, including Ireland (where Dundalk was the participating city). It highlighted the need to maximise the health and well-being of the older population in urban environments and involved extensive consultation with older people.
POLICY CONTEXT
In recent years the perception of ageing has changed for many people. Instead of being seen as a period of decline and ‘retirement’ from life, later life is increasingly seen as a period in which people can continue to develop and to contribute their experience and knowledge to their communities. This positive perception of ageing, evident in the WHO’s global framework, was central to the vision set out in the National Positive Ageing Strategy (NPAS), published in 2013 (Department of Health, 2013a). The Strategy arose from a commitment in the Programme for Government in early 2011 to complete and implement the NPAS so that ‘older people are recognised, supported and enabled to live independent full lives’ (Department of Health, 2013a: pg. 56).
From a national and local policy perspective, national strategies and plans such as the National Positive Ageing Strategy (Department of Health, 2013a), Healthy Ireland (Department of Health, 2013b), the Action Plan for Rural Development and the reforms set out under the ‘Putting People First’ – Action Programme for Effective Local Government (2012) have set out an approach to planning for a new Ireland.

11 POSITIVE AGEING LOCAL INDICATORS / INTRODUCTION
Under the local government reform programme, the vision set out for Local Community Development Committees was to achieve a more joined-up approach to service delivery at local level and to underpin this through the involvement of citizens and communities in the design, implementation and targeting of services. The goals and objectives of each of the national strategies and programmes share a strong and direct correlation with the goals and approaches of the Age Friendly Cities & Counties Programme. At local level, Local Economic and Community Plans are developed and are required to “…be based on best-available evidence and relevant, comprehensive, and accurate statistical and other data…”(Circular on Local Economic and Community Plans (LG 1/2015)).
The WHO’s Active Ageing – A Policy Framework provides a roadmap for designing multi-sectoral active ageing policies. It encourages policy makers to recognise and address factors or ‘determinants’ that affect how people and populations age, to adopt a life-course perspective, and to promote intergenerational solidarity in developing policies to respond to population ageing. It calls for action on three fronts, by defining active ageing as a process of optimising opportunities for participation, health and security - the three pillars of the National Positive Ageing Strategy.
The implementation of the NPAS requires a ‘whole of government’ response, and must be framed within the implementation of Healthy Ireland - the national framework for action to improve the health and wellbeing of the population (Department of Health, 2013b). Implementation of the NPAS is an essential part of the vision for creating a society in which “every individual and sector of society can play their part in achieving a healthy Ireland” (Healthy Ireland goal 4).
THE AGE-FRIENDLY CITIES AND COUNTIES PROGRAMME
In an age-friendly community, policies, services and structures related to the physical and social environment are designed to support and enable older people to “age actively” – that is, to live in security and good health, continuing to participate fully in society. Public and commercial settings and services are made accessible to accommodate varying levels of ability. Age-friendly service providers, public official and community leaders;
• Recognise the great diversity among older persons,• Promote their inclusion and contribution in all areas of community life,• Respect their decisions and lifestyle choices, and• Anticipate and respond flexibly to ageing-related needs and preferences.
To achieve this vision each local authority in Ireland has committed to developing an Age Friendly Programme based on the World Health Organisation (WHO) Age-Friendly Cities Framework and Guidelines (WHO, 2007). The Age Friendly Cities and Counties Programme embraces the challenges and opportunities presented by population ageing by providing a structure and the necessary supports to allow local authorities to take the lead on changing perceptions of ageing, and changing the planning and delivery of services.
At local level, each Age Friendly City or County has an Alliance, chaired at the outset by the Chief Executive of the County or City. This Alliance provides a structure to enable senior decision makers from the key Government agencies such as the local Authority, Health Service Executive, An Garda Síochána, Third Level Institutions, employers, older people and voluntary and private organisations to work together to create communities that are more responsive to the needs of older people.

12
These Age Friendly Programmes provide a mechanism for the relevant state agencies, working under the aegis of the Local Authorities, to ensure that their combined resources are used optimally, delivering necessary services to older people within their own local communities. In recognition of the fact that the fragmented, silo-based approach to service provision has proven to be inefficient - particularly when public budgets are increasingly tight - the pursuit of a more joined-up, collaborative approach to planning and service delivery at a local level lies at the heart of the Programme.
Each Age Friendly City and County follows a similar approach to developing an Age Friendly Programme, establishing an Alliance of stakeholders, carrying out a consultation process, developing a strategy, setting up an Older People’s Council, agreeing goals and finally developing an action plan for implementation of the strategy.
The National Age Friendly Ireland Programme entered a transition period at the end of December 2016 with the objective of creating a national centralised service, embedded in local government, to support the ongoing development, implementation and sustaining of the programmes strategy. The focus for the new centralised support service will be to lead the national programme, continue to connect the existing 31 local programmes and to support scaling and mainstreaming of age friendly practices with a focus on demonstrating how best practice can influence national policy. Under the leadership of Jackie Maguire, Chief Executive, Meath County Council, the National Age Friendly Ireland programme is currently being hosted by Meath County Council to continue the ongoing development and effective & efficient management of the programme.
THE HEALTHY AND POSITIVE AGEING INITIATIVE
Arising from the publication of the National Positive Ageing Strategy and local authority led the Healthy Ireland framework, the Department of Health (DOH) is leading a joint national programme with the Health Service Executive (HSE) - the Healthy and Positive Ageing Initiative (HaPAI). The role of the HaPAI is to support and use research to better inform policy responses and service provision for people as they age in Ireland.
In 2015, the Initiative invited the local authority led Age Friendly Ireland programmes to collaborate in a research programme to develop evidence to support the implementation of the NPAS at local level. While evidence on the lives of older people is available at national level through The Irish Longitudinal Study on Ageing (TILDA) and other nationally gathered surveys (Quarterly National Household Survey, Survey on Income and Living Conditions etc.) there is no similar data gathered in a systematic way at local level. This collaborative venture offered local authorities and AFCC Alliances the opportunity to play a role in implementation of the national strategies by filling a vital gap in the availability of reliable local data on the lives of older people.
The HaPAI AFCC Survey was carried out to provide evidence about the experiences and preferences of older people, and to identify the gaps and supports needed to allow them to age positively in their local communities. It is intended to inform the development of local strategies and to allow participating areas make comparisons with others and with the national position in order to help to identify priority issues and successes.
The data collected is linked to three goals of the National Positive Ageing Strategy (NPAS) and reflects the core domains of Age Friendly Programme in Ireland.

13 POSITIVE AGEING LOCAL INDICATORS / INTRODUCTION
This Initiative developed a standardised questionnaire, aligning the objectives and action areas of both the NPAS and the Age Friendly Ireland programme.
ParticipationCivic Participation and EmploymentSocial ParticipationRespect and Social Inclusion
HealthCommunity support and Health servicesCommunication and Information
SecurityHousingOutdoor Spaces and BuildingsTransportation
Civic Participation and Employment
Social Participation
Respect andInclusion
CommunitySupport andHealth Services
Communicationand Information
Housing
Outdoor Spacesand Buildings
Transportation
PARTICIPATION
HEALTH
SECU
RITY
CombatingAgeism
+Improving
InformationProvision
National Positive Ageing Strategy goals aligned with WHO Age Friendly themes
14
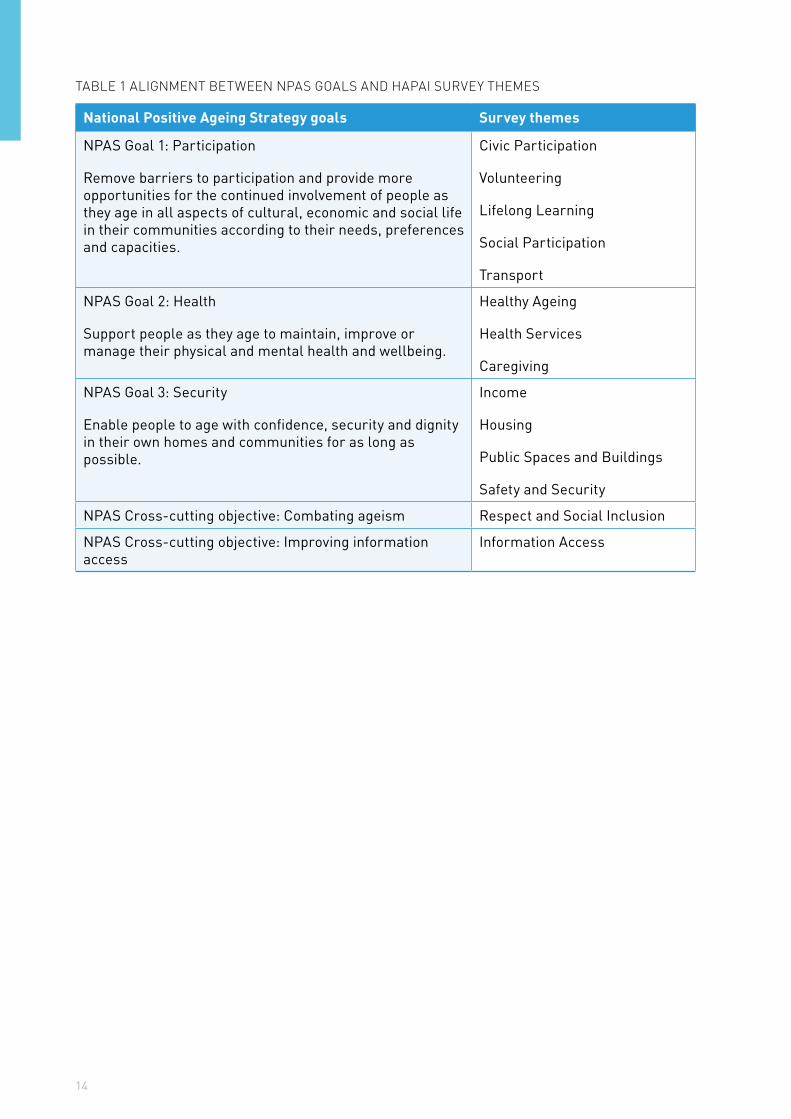
TABLE 1 ALIGNMENT BETWEEN NPAS GOALS AND HAPAI SURVEY THEMES
National Positive Ageing Strategy goals Survey themes
NPAS Goal 1: Participation
Remove barriers to participation and provide more opportunities for the continued involvement of people as they age in all aspects of cultural, economic and social life in their communities according to their needs, preferences and capacities.
Civic Participation
Volunteering
Lifelong Learning
Social Participation
Transport
NPAS Goal 2: Health
Support people as they age to maintain, improve or manage their physical and mental health and wellbeing.
Healthy Ageing
Health Services
Caregiving
NPAS Goal 3: Security
Enable people to age with confidence, security and dignity in their own homes and communities for as long as possible.
Income
Housing
Public Spaces and Buildings
Safety and Security
NPAS Cross-cutting objective: Combating ageism Respect and Social Inclusion
NPAS Cross-cutting objective: Improving information access
Information Access

15 POSITIVE AGEING LOCAL INDICATORS / INTRODUCTION
REPORT AIMS AND STRUCTURE
The aim of this report is to present the aggregated results of all 20 participating local authorities. The differences and similarities between respondents, across the cities and counties surveyed, are detailed under each subject area. The report also presents the results of more detailed analyses carried out to identify the characteristics or factors that have been found to contribute to a particular outcome.
Through the presentation of aggregate findings from the full sample, the report aims to provide stakeholders in both the participating and non-participating Age Friendly Cities and Counties programmes with evidence to inform their future practice. It also aims to provide evidence to support policy development and service provision for all those working to improve the lives of older people.
The disaggregation by area provides a context within which individual programmes can identify areas of excellence and good practice as well as areas in which a focus is needed. The further analysis facilitates a greater understanding of characteristics that can influence greater or lesser need. For example, in many of the subject areas covered by the survey, increased age contributes to greater need, in others socio-economic inequality is the main driver. The aim of this further analysis is to provide those working in this area with the evidence needed to focus resources on those who can most benefit.
This report is one of a series of reports produced by the Healthy and Positive Ageing Initiative arising out of the research carried out with older people during 2015. The key findings based on individual responses have already been disseminated to each participating local authority. A series of topic reports providing more detailed analysis, framed within the existing literature, have also been prepared. These are available on the HaPAI website, www.hapai.net
The report is structured as follows; Chapter 2 describes the study methodology. This includes how the survey was conducted, analysed and what measures we have used in this report to explore variations in the outcome measures of interest by demographic, socio-economic, health, and location characteristics.
The survey results are presented in chapters 3-7. Each chapter contains a description of the outcome measure, key findings, geographical variation and the findings from regression analysis of factors that are associated with the outcomes of interest.

16

17 POSITIVE AGEING LOCAL INDICATORS / METHODOLOGY
2METHODOLOGYOutline of survey methods, sampling strategy and response rates

18
The HaPAI AFCC survey was developed using a framework which mapped the goals and action areas of the NPAS to the domains of Age Friendly Ireland programme. The Global Age Friendly Cities Guide (WHO 2007) provides a detailed checklist of the features considered essential in an age friendly community. This guide was the product of research carried out in 33 participating cities involving 158 focus groups with persons aged 60 years and older from lower- and middle-income areas of a locally defined geographic area (n=1,485). No systematic differences in focus group themes were noted between cities in developed and developing countries, although the positive, age-friendly features were more numerous in cities in developed countries. The research found that physical accessibility, service proximity, security, affordability, and inclusiveness were important characteristics everywhere (Plouffe and Kalache 2010).
Thematic analysis of both the WHO Guide and the National Positive Ageing Strategy determined the core concepts to be measured by the survey. Because the Guide covers an extensive range of features, it was not possible to include questions on each. In general, features identified in the WHO checklist were covered comprehensively or condensed into an assessment of the core concepts. For example under the heading of Outdoor Spaces and Buildings, the questionnaire covered the issues of Safety (feeling safe in neighbourhood); Aesthetics (pleasant, litter free); Accessibility (of buildings/services); and Mobility/Walkability (Availability of resting places, toilets).
Over the course of 2015 a questionnaire was developed and piloted with older people in one of the participating Age Friendly Cities and Counties areas (Dun Laoghaire-Rathdown). Where possible, the team identified and used validated questions from national surveys such as TILDA, the European Social Survey (ESS), and the European Quality of Life Survey (EQLS) to facilitate comparability and to provide a benchmark. Ethical approval for the survey was granted by the Royal College of Physicians in Ireland.
SAMPLING STRATEGY AND DATA COLLECTION
The target population for this survey included all community-dwelling members of the population aged 55 and older in each Local Authority who were living in ‘private households’ as defined by the Census.
A multi-stage random-route sampling strategy was used to generate a sample of this population. This sampling approach involved several steps. Firstly, a random sample of 50 District Electoral Divisions (DED) in each Local Authority was selected as the primary sampling units (PSUs). Within each selected DED a starting address was selected at random. Beginning with this address a total of 10 interviews were to be completed in each of the 50 areas.
Detailed information on the approach that interviewers took to identify eligible households within each area for the survey is described below. In summary, from their starting address, interviewers called to every fifth house. The interviewer asked to speak to a person aged 55 years or older in the household. One person aged 55 or older per household was invited to complete the interview. If there were two or more older people in the household the interviewer applied the ‘next birthday’ rule to select one participant.
Fieldwork was carried out on a rolling basis over a ten month period commencing in mid-2015. The following local authorities participated in the survey: Dublin City; South Dublin; Fingal; Dun Laoghaire-Rathdown; Galway City; Galway Co.; Clare; Limerick

19 POSITIVE AGEING LOCAL INDICATORS / METHODOLOGY
City and County; Kildare; Kilkenny; Laois; Louth; Meath; Wexford; Wicklow; Cavan; Cork City; Cork County; Mayo; and Tipperary. It must be noted that although Limerick City and County is one local authority area, a separate survey was carried out in both the city and county areas and therefore the results are presented separately. A total of 10,540 interviews were completed.
Each participant completed a structured Computer-Assisted Personal Interview (CAPI) in their own home with a trained interviewer from Amárach Research. Respondents were also invited to complete an additional, separate, paper-based survey which included subjective wellbeing (depressive mood and quality of life) and experience of elder abuse.
RESPONSE RATES AND SAMPLE WEIGHTS
The response rate is the proportion of selected households that included an eligible participant who completed an interview. The overall response rate was 56%, and this ranged from 50% to 63% across the areas. This includes an estimate of the households who are likely to contain an eligible household member, but for which eligibility was not determined.
TABLE 2 SURVEY SAMPLE AND RESPONSE RATE
Area Sample (n value)
Response Rate (%) Area Sample
(n value)Response Rate (%)
Clare 500 59 Kilkenny 500 55
Cork County 501 58 Laois 501 60
Cork City 501 56 Limerick City 501 59
Cavan 500 56 Limerick Co. 502 59
Dublin City 502 57 Louth 500 53
Dublin Fingal 502 50 Meath 500 56
Dun Laoghaire-Rathdown 502 51 Mayo 502 51
South Dublin 501 57 Tipperary 502 54
Galway Co. 518 55 Wicklow 500 57
Galway City 504 63 Wexford 501 51
Kildare 500 62 Total 10,540 56
Response rates typically vary among different groups within a given population such as different age groups or levels of education. This variation can lead to biased estimates when reporting results. In order to adjust for this, sample weights have been applied to the survey data. The sample weights corresponded to the number of people, with a given set of characteristics, in the population that were represented by each survey participant. Weights which were applied to the survey sample were estimated using the Census of population (2011). The characteristics considered were age, gender, educational attainment (primary/secondary/third level) and marital status (married/not married).
The following table presents the socio-demographic, socio-economic and health characteristics that we included in the survey. In our analysis, we examine the impact of these characteristics, if any, on the outcomes and preferences expressed by survey respondents.

20
TABLE 3 SOCIO-DEMOGRAPHIC, SOCIO-ECONOMIC, AND HEALTH INDICATORS
Measures Description
Socio-demographic and socio-economic measures
Gender Male or female
Age Age group categories used in this study: 55+, 55-64, 55-69, 65+, 65-74, 70+ and 75+
Marital status Married/living with a partner as married, single (never married) divorced/separated, or widowed
OccupationRetired, employed (employed/self-employed), out of work (unemployed, in education or training, permanently sick or disabled), or looking after home/family
Household composition Living alone, living with spouse/partner, or living with family/non-family (without or without spouse/partner)
Material Deprivation Responding ‘no’ to two or more items from a list of 11 items about the household E.g. Does the household replace any worn out furniture
Income Income bands: €501 up to €1,000; €1,001 up to €1,500; €1,501 up to €2,500; €2,501 or more
Location of household Open countryside, village, or town, city or city suburb
Education Primary or no education, secondary education, or third level education
Health measures
Self-rated health How is your health in general? Very good or good, fair, or bad or very bad
Chronic conditions None, one chronic condition, two chronic conditions, or three or more chronic conditions
Long-standing illness or condition that limits everyday activities
No long-standing illness/condition; yes, not limiting; yes, limiting; yes, severely limiting
Smoking Current; former; or never smoked
Alcohol consumption Drinks alcohol at least weekly
Physical activity At least 150 minutes of moderate physical activity per week
Healthcare coverage Full medical card; GP visit card only; health insurance only; joint cover; and, no cover

21 POSITIVE AGEING LOCAL INDICATORS / METHODOLOGY
ANALYSIS
The analysis conducted for this report focused on different socio-demographic, socio-economic, and health characteristics of participants. However, it is important to acknowledge that there are many additional possible explanations for differences between individuals and local authority areas. For example, there may be historic social, economic and population differences that are not captured in this analysis. Differences may also be partly explained by the fact that some areas have been part of the Age Friendly Ireland programme for different lengths of time and as such may have developed responses to issues identified by focus groups and other consultations.
In order to investigate the association between different social, economic, health and environmental factors and outcomes, we used mixed effects regression models. We adopted this approach because the data collection methodology resulted in 21 sub-samples of respondents that are grouped or ‘nested’ within Local Authority areas. It may be the case that individuals within areas are more alike compared to individuals chosen at random across the whole population. The multi-level approach we have adopted in the analysis recognises the existence of these nested structures and adjusts for the fact that survey responses from respondents nested within an area are likely to be correlated.
Significant results from these analyses are presented in graphs throughout the report and the full regression models are presented in Appendix 2.
The results of regression analyses are reported as Odds Ratios (OR) with Confidence Intervals (CIs) reported at the 95% level. Odds Ratios can be interpreted as the effect of a one unit change in the independent variables (e.g. good health) in the predicted odds of the dependent outcome occurring (e.g. volunteering), when all other independent or predictor variables are held constant.
For the purpose of interpretation:
OR=1 The independent variable does not affect odds of the outcome occurringOR>1 The independent variable is associated with higher odds of outcome occurringOR<1 The independent variable is associated with lower odds of outcome occurring

22
TABLE 4 WEIGHTED DEMOGRAPHIC, LOCATION, AND SOCIO-ECONOMIC CHARACTERISTICS
% 95% (CI)
Age groupAge 55-69 62.9 (61.4, 64.3)
Age 70+ 37.1 (35.7, 38.6)
GenderMale 47.3 (46.0, 48.5)
Female 52.7 (51.5, 54.0)
Marital status
Married or living with a partner 65.0 (63.5, 66.5)
Single (never married) 10.1 (9.3,11.0)
Separated or divorced 6.2 (5.5, 6.9)
Widowed 18.7 (17.7, 19.8)
Household composition
Living alone 27.4 (26.1, 28.8)
Living with spouse or partner 54.4 (52.8, 56.1)
Living with spouse/partner and others (family and non-family) 16.0 (14.7, 17.3)
Living with family or non-family (not spouse/partner) 2.1 (1.8, 2.5)
Location of home
Open countryside 24.2 (21.6, 27.0)
Village 17.9 (15.9, 20.2)
Town (1500+ population) 25.4 (22.8, 28.2)
Inner city 4.9 (3.3, 7.2)
City suburb 27.5 (24.4, 30.9)
Highest level of education
Primary/None 34.4 (32.3, 36.4)
Secondary 47.8 (46.1, 49.5)
Third Level 17.9 (16.6, 19.2)
Net monthly household income
€2,501 or more 17.4 (15.7, 19.3)
€1,501 up to €2,500 20.8 (19.3, 22.5)
€1,001 up to €1,500 14.3 (13.0, 15.6)
€501 up to €1,000 15.1 (13.6, 16.6)
Missing 32.4 (29.8, 35.1)
Materially deprived Yes 7.9 (7.0 ,8.8)
Current occupational status
Employed or self-employed 25.0 (23.7, 26.4)
Retired 50.9 (49.2, 52.6)
Out of work 9.8 (9.0, 10.8)
Looking after home/family 14.2 (13.1, 15.4)
Total 100

23 POSITIVE AGEING LOCAL INDICATORS / METHODOLOGY
NOTES

24
3PARTICIPATION

25 POSITIVE AGEING LOCAL INDICATORS / PARTICIPATION
NPAS Goal 1: Participation
Remove barriers to participation and provide more opportunities for the continued involvement of people as they age in all aspects of cultural, economic and social life
in their communities according to their needs, preferences and capacity.
NPAS ObjectiveSurvey Themes and WHO Age Friendly Programme domains
Develop a wide range of employment options including options for gradual retirement and identify any barriers to continued employment and training opportunities.
Civic Participation and Employment
Promote access to a wide range of opportunities for continued learning and education. Lifelong Learning
Promote the concept of active citizenship and the value of volunteering, and encourage people of all ages to become more involved in and to contribute to their own communities.
Volunteering
Promote the development of opportunities for engagement and participation of people of all ages in a range of arts, cultural, spiritual, leisure, learning and physical activities in their local communities.
Social Participation
Enable people as they age ‘to get out and about’ through the provision of accessible, affordable, and flexible transport systems in both rural and urban areas.
Transportation

26
5.7%4.5%
9.2%
8%
3.6%
76% 15%
66+ 65–69 70+
58%
10%
EMPLOYMENT BEYOND THE AGE OF 65
happy to have retired
age
OF WOMENRETIREDEARLY
51%
OF MENRETIREDEARLY
EARLY RETIREMENT
would have preferred to remain working part-time
would have preferred to remain working full-time
RETIREDEARLIER
THANAGED 66
IN EMPLOYMENT
54%
age age
CIVIC PARTICIPATION & EMPLOYMENT3.1
Respondents were asked about their current occupational status. The possible response categories were: retired; employed (defined as having done any paid work in the 7 days prior to the survey date); self-employed (including farming); unemployed; permanently sick or disabled; looking after home or family; or in education or training.
If retired, they were asked whether they retired earlier than the standard expected age of retirement, and if so to indicate the reason why they had done so and how they felt about their decision.
KEY FINDINGS

27 POSITIVE AGEING LOCAL INDICATORS / PARTICIPATION
5.7%4.5%
9.2%
8%
3.6%
76% 15%
66+ 65–69 70+
58%
10%
EMPLOYMENT BEYOND THE AGE OF 65
happy to have retired
age
OF WOMENRETIREDEARLY
51%
OF MENRETIREDEARLY
EARLY RETIREMENT
would have preferred to remain working part-time
would have preferred to remain working full-time
RETIREDEARLIER
THANAGED 66
IN EMPLOYMENT
54%
age age
TABLE 5 PERCENTAGE WHO RETIRED EARLIER THAN AGED 66 YEARS GENDER (RETIRED RESPONDENTS ONLY)
Retired early Did not retire early
% 95% CI % 95% CI
GenderMale 50.5 (47.8,53.2) 49.5 (46.8,52.2)
Female 58.0 (54.9,60.9) 42.0 (39.1,45.1)
Age66-74 50.2 (47.4, 53.0) 49.8 (47.0, 52.6)
75+ 43.3 (51.9,56.3) 46.7 (53.2, 60.1)
Total 54.1 (39.9, 46.8) 45.9 (43.7,48.1)
TABLE 6 DECISION TO RETIRE BY GENDER AND AGE (RETIRED RESPONDENTS ONLY)
Happy to retireWould have preferred part-time work
Would have preferred full-time work
% 95% CI % 95% CI % 95% CI
GenderMale 73.3 (70.9,75.5) 14.8 (13.0,16.7) 11.9 (10.2,13.9)
Female 77.8 (75.4,80.0) 14.9 (13.2,16.9) 7.3 (6.0,8.8)
66-74 73.7 (71.3,75.9) 15.4 (13.7,17.3) 10.9 (9.4,12.7)
75+ 80.8 (78.1,83.2) 12.6 (10.7,14.7) 6.7 (5.2,8.6)
Total 75.5 (73.6,77.2) 14.9 (13.5,16.3) 9.7 (8.5,11.0)

28
GEOGRAPHICAL DIFFERENCE IN EMPLOYMENT AND RETIREMENT
There was a great deal of variation between the 21 local authorities in the percentage of adults aged 65 years and older who were employed past the retirement age of 65 years, ranging from 1.6% in Limerick City to 13.8% in Galway Co.
TABLE 7 PERCENTAGE OF ADULTS AGED 65+ WHO WERE EMPLOYED IN EACH LOCAL AUTHORITY AREA
Local Authority
Not employed post-retirement age
Employed post-retirement age
% 95% CI % 95% CI
Clare 96.0 (93.4, 97.6) 4.0 (2.4, 6.6)
Cork County 89.0 (83.5, 92.9) 11.0 (7.1, 16.5)
Cork City 95.0 (90.1, 97.6) 5.0 (2.4, 9.9)
Cavan 92.7 (89.3, 95.0) 7.3 (5.0, 10.7)
Dublin City 97.8 (95.4, 98.9) 2.2 (1.1, 4.6)
Dublin Fingal 95.0 (91.3, 97.1) 5.0 (2.9, 8.7)
Dun Laoghaire-Rathdown 94.4 (89.9, 97.0) 5.6 (3.0, 10.1)
South Dublin 93.9 (90.3, 96.3) 6.1 (3.7, 9.7)
Galway Co. 86.2 (81.0, 90.2) 13.8 (9.8, 19.0)
Galway City 94.3 (90.1, 96.8) 5.7 (3.2, 9.9)
Kildare 96.9 (93.7, 98.5) 3.1 (1.5, 6.3)
Kilkenny 95.4 (92.7, 97.1) 4.6 (2.9, 7.3)
Laois 95.1 (90.5, 97.6) 4.9 (2.4, 9.5)
Limerick City 98.4 (95.2, 99.5) 1.6 (0.5, 4.8)
Limerick Co. 90.0 (85.1, 93.4) 10.0 (6.6, 14.9)
Louth 97.8 (95.4, 99.0) 2.2 (1.0, 4.6)
Meath 94.6 (90.1, 97.1) 5.4 (2.9, 9.9)
Mayo 93.7 (89.2, 96.4) 6.3 (3.6, 10.8)
Tipperary 97.2 (94.4, 98.6) 2.8 (1.4, 5.6)
Wicklow 94.5 (90.1, 97.1) 5.5 (2.9, 9.9)
Wexford 95.4 (92.3, 97.4) 4.6 (2.6, 7.7)
Total 94.3 (93.4, 95.1) 5.7 (4.9, 6.6)

29 POSITIVE AGEING LOCAL INDICATORS / PARTICIPATION
FACTORS ASSOCIATED WITH BEING IN PAID EMPLOYMENT PAST THE AGE OF 65 YEARS
Further analysis identified a number of socio-demographic characteristics that help explain differences in participation in paid employment among the over 65s. The full results are presented in Appendix 2 (Table 1).
FIGURE 1 FACTORS ASSOCIATED WITH PAID EMPLOYMENT AGE 65+
Note: results are based on a mixed-effects regression model and reported as Odds Ratios with 95% Confidence Intervals.

30
Lifelong learning refers to any education or training that respondents attended in the 12 months prior to interview. Respondents were asked to choose all types of training that they attended from the following list of options.
– Literacy classes (to help overcome reading /writing difficulties)– ICT classes– Junior or Leaving Certificate– Special interest, for example, arts, crafts, cookery etc. – Technical or vocational course, not leading to a formal qualification – Diploma or degree – Postgraduate diploma or degree – Technical or vocational course, leading to a formal qualification
Barriers to lifelong learning; Respondents were also asked if they had been prevented from participating in education because costs, lack of transport/distance to course, no suitable/interesting courses available, responsibilities in the home (eg caring for spouse/other family member) or personal incapacity or ill health
KEY FINDINGS
LIFELONG LEARNING3.2
LIFELONG LEARNING
6.9%14%
55–69 70+
8.9% 13%
attended at least one typeof education or training
SPECIALINTERESTCOURSE
VOCATIONALCOURSE
ICT CLASS LITERACYCLASS
<1%1.5%2.1%
6.2%
55+11%
age
age age

31 POSITIVE AGEING LOCAL INDICATORS / PARTICIPATION
Very few adults aged 55 years and older engaged in any type of training or education. We collated the information provided on each of these individual types of education and training into one composite indicator that captures whether or not respondents attended any types of edcation or training in the previous 12 months.
GEOGRAPHICAL DIFFERENCE IN PARTICIPATION IN LIFELONG LEARNING
The percentage that attended any of the included training or educational courses in the previous 12 months ranged from 5.2% in Wicklow to 19.8% in Dun Laoghaire-Rathdown. Other urban areas, including Dublin Fingal, Dublin City, as well as Galway City had comparatively high rates of participation in education and training.
TABLE 8 PERCENTAGE WHO REPORTED ATTENDING TRAINING OR EDUCATION IN THE PREVIOUS 12 MONTHS BY LOCAL AUTHORITY AREA.
Local AuthorityNot engaged in learning Engaged in learning
% 95% CI % 95% CI
Clare 91.0 (87.4, 93.6) 9.0 (6.4, 12.6)
Cork County 88.7 (84.0, 92.1) 11.3 (7.9, 16.0)
Cork City 90.5 (87.2, 93.0) 9.5 (7.0, 12.8)
Cavan 92.1 (89.0, 94.4) 7.9 (5.6, 11.0)
Dublin City 87.6 (82.7, 91.3) 12.4 (8.7, 17.3)
Dublin Fingal 84.2 (79.8, 87.9) 15.8 (12.1, 20.2)
Dun Laoghaire-Rathdown 80.2 (74.4, 85.0) 19.8 (15.0, 25.6)
South Dublin 93.6 (89.6, 96.1) 6.4 (3.9, 10.4)
Galway Co. 83.2 (78.1, 87.2) 16.8 (12.8, 21.9)
Galway City 80.9 (76.1, 85.0) 19.1 (15.0, 23.9)
Kildare 92.3 (88.4, 94.9) 7.7 (5.1, 11.6)
Kilkenny 89.2 (85.3, 92.2) 10.8 (7.8, 14.7)
Laois 94.6 (91.5, 96.7) 5.4 (3.3, 8.5)
Limerick City 90.1 (86.1, 93.1) 9.9 (6.9, 13.9)
Limerick Co. 89.0 (84.8, 92.2) 11.0 (7.8, 15.2)
Louth 88.4 (84.1, 91.7) 11.6 (8.3, 15.9)
Meath 88.6 (83.9, 92.1) 11.4 (7.9, 16.1)
Mayo 94.1 (90.9, 96.3) 5.9 (3.7, 9.1)
Tipperary 91.2 (87.4, 93.9) 8.8 (6.1, 12.6)
Wicklow 94.8 (91.5, 96.8) 5.2 (3.2, 8.5)
Wexford 87.3 (83.6, 90.4) 12.7 (9.6, 16.4)
Total 88.8 (87.7, 89.7) 11.2 (10.3, 12.3)

32
FACTORS ASSOCIATED WITH PARTICIPATION IN LIFELONG LEARNING
Further analysis identified a number of socio-demographic characteristics that help explain differences in participation in education and training. The full results are presented in Appendix 2 (Table 2).
FIGURE 2 FACTORS ASSOCIATED WITH PARTICIPATING IN EDUCATION OR TRAINING
Note: results are based on a mixed-effects regression model and reported as Odds Ratios with 95% Confidence Intervals.
While there was no association between mental health and educational participation, poorer physical health appears to be a barrier to it.
Despite the comparatively high levels of participation in Dublin and Galway City, adults aged 55 years and older who lived in urban areas (inner city or suburbs) were significantly less likely to have participated in training or education in the previous 12 months, compared to those living in open countryside and villages.

33 POSITIVE AGEING LOCAL INDICATORS / PARTICIPATION
Respondents were asked how often they volunteered with community and social services; educational, cultural, sports or professional associations; social movements; and other voluntary organisations.
KEY FINDINGS
VOLUNTEERING AND ACTIVE CITIZENSHIP3.3
MONTHLY VOLUNTEERING(IN THE PAST 12 MONTHS)
WEEKLY OR MONTHLY
of adults volunteered in any type of organisation at least once per month
community and social services organisation
educational, cultural, sports or professional association
social movement
unspecified
25%
28% 19%
14%
13%
6.8%
7.1%
27%
22%
55–69 70+age age
Note: does not include weekly volunteers

34
WEEKLY VOLUNTEERING
volunteered at least weekly
educational, cultural, sports or professional association
community and social services
social movement
unspecified
15%
16% 12%
7.4%
8.0%
2.7%
3.7%
16%
14%
55–69 70+age age

35 POSITIVE AGEING LOCAL INDICATORS / PARTICIPATION
GEOGRAPHICAL DIFFERENCE IN VOLUNTEERING
Table 9 shows the variation in volunteering at least monthly across the local authority areas. The percentage who did so ranged from 18% in Dublin City to 33% in Limerick Co.
TABLE 9 PERCENTAGE WHO VOLUNTEERED AT LEAST ONCE PER MONTH BY LOCAL AU-THORITY AREA
Local AuthorityLess than monthly (including never)
Monthly (including weekly)
% 95% CI % 95% CI
Clare 79.7 (73.8, 84.6) 20.3 (15.4, 26.2)
Cork County 69.3 (62.0, 75.6) 30.7 (24.4, 38.0)
Cork City 71.8 (66.1, 76.8) 28.2 (23.2, 33.9)
Cavan 77.5 (70.9, 82.9) 22.5 (17.1, 29.1)
Dublin City 81.9 (77.1, 85.9) 18.1 (14.1, 22.9)
Dublin Fingal 81.1 (75.8, 85.4) 18.9 (14.6, 24.2)
Dun Laoghaire-Rathdown 68.9 (62.5, 74.6) 31.1 (25.4, 37.5)
South Dublin 76.9 (69.9, 82.7) 23.1 (17.3, 30.1)
Galway Co. 71.4 (65.4, 76.7) 28.6 (23.3, 34.6)
Galway City 78.0 (72.6, 82.6) 22.0 (17.4, 27.4)
Kildare 67.3 (58.8, 74.8) 32.7 (25.2, 41.2)
Kilkenny 80.8 (75.2, 85.3) 19.2 (14.7, 24.8)
Laois 71.8 (64.8, 77.9) 28.2 (22.1, 35.2)
Limerick City 79.6 (74.4, 84.0) 20.4 (16.0, 25.6)
Limerick Co. 66.7 (59.6, 73.2) 33.3 (26.8, 40.4)
Louth 81.0 (75.5, 85.5) 19.0 (14.5, 24.5)
Meath 77.0 (70.5, 82.5) 23.0 (17.5, 29.5)
Mayo 80.3 (73.0, 85.9) 19.7 (14.1, 27.0)
Tipperary 77.5 (71.8, 82.3) 22.5 (17.7, 28.2)
Wicklow 73.2 (66.3, 79.2) 26.8 (20.8, 33.7)
Wexford 74.6 (69.2, 79.3) 25.4 (20.7, 30.8)
Total 75.4 (73.8, 76.8) 24.6 (23.2, 26.2)

36
FACTORS ASSOCIATED WITH VOLUNTEERING MONTHLY
We examined a number of socio-demographic and other characteristics to identify factors associated with regular volunteering. Full results are presented in Appendix 2 (Table 3).
FIGURE 3 FACTORS ASSOCIATED WITH VOLUNTEERING AT LEAST MONTHLY
Note: results are based on a mixed-effects regression model and reported as Odds Ratios with 95% Confidence Intervals.
We found that younger respondents, men and those with higher levels of education (secondary and tertiary) were significantly more likely to volunteer at least monthly. Poorer health status, lower household income and material deprivation significantly lowered the odds of volunteering at least monthly.

37 POSITIVE AGEING LOCAL INDICATORS / PARTICIPATION
ACTIVE CITIZENSHIP
We asked respondents if they had, in the last 12 months: attended a meeting of a trade union, a political party or political action group; attended a protest or demonstration; or contacted a politician or public official (other than routine contact when using public services).
KEY FINDINGS
ACTIVE CITIZENSHIP
18% 12%
attended a meeting attended a protestor demonstration
contacted a politicianor public official
engaged in at least oneof these three activities
4.7% 6.5% 8.1%
15%
17% 11%
55–69 70+age age

38
GEOGRAPHICAL DIFFERENCE – ENGAGEMENT IN POLITICAL ACTIVITY
Table 10 shows the percentage of adults aged 55 years and older within each Local Authority area who engaged in at least one of the three political activities in the last 12 months. Political engagement was highest in urban centres and counties Kildare and Laois. Percentages range from 9.3% in Louth and South Dublin to 24% in Galway County.
TABLE 10 PERCENTAGE WHO ENGAGED IN A POLITICAL ACTIVITY, BY LOCAL AUTHORITY AREA
Local AuthorityNo political engagement Engaged in political activity
% 95% CI % 95% CI
Clare 88.8 (83.6, 92.6) 11.2 (7.4, 16.4)
Cork County 89.3 (84.5, 92.8) 10.7 (7.2, 15.5)
Cork City 80.8 (75.6, 85.1) 19.2 (14.9, 24.4)
Cavan 86.6 (80.6, 90.9) 13.4 (9.1, 19.4)
Dublin City 80.1 (74.7, 84.6) 19.9 (15.4, 25.3)
Dublin Fingal 87.0 (81.5, 91.0) 13.0 (9.0, 18.5)
Dun Laoghaire-Rathdown 81.3 (77.3, 84.8) 18.7 (15.2, 22.7)
South Dublin 90.7 (85.9, 93.9) 9.3 (6.1, 14.1)
Galway Co. 76.0 (70.6, 80.8) 24.0 (19.2, 29.4)
Galway City 80.9 (74.3, 86.1) 19.1 (13.9, 25.7)
Kildare 81.7 (76.0, 86.2) 18.3 (13.8, 24.0)
Kilkenny 90.0 (86.4, 92.8) 10.0 (7.2, 13.6)
Laois 76.6 (70.2, 82.0) 23.4 (18.0, 29.8)
Limerick City 84.2 (78.9, 88.4) 15.8 (11.6, 21.1)
Limerick Co. 83.2 (77.9, 87.5) 16.8 (12.5, 22.1)
Louth 90.7 (87.1, 93.4) 9.3 (6.6, 12.9)
Meath 88.5 (82.9, 92.5) 11.5 (7.5, 17.1)
Mayo 90.3 (83.0, 94.6) 9.7 (5.4, 17.0)
Tipperary 86.1 (80.5, 90.2) 13.9 (9.8, 19.5)
Wicklow 89.0 (82.9, 93.1) 11.0 (6.9, 17.1)
Wexford 88.4 (83.8, 91.7) 11.6 (8.3, 16.2)
Total 85.2 (84.0, 86.4) 14.8 (13.6, 16.0)

39 POSITIVE AGEING LOCAL INDICATORS / PARTICIPATION
FACTORS ASSOCIATED WITH POLITICAL ENGAGEMENT
Further analysis identified a number of socio-demographic characteristics that helped explain differences in levels of political engagement among adults aged 55 years and older. The results are presented in Appendix 2 (Table 4).
FIGURE 4 FACTORS ASSOCIATED WITH POLITICAL ENGAGEMENT
Note: results are based on a mixed-effects regression model and reported as Odds Ratios with 95% Confidence Intervals.

40
SOCIAL PARTICIPATION
Participation in Community Activities
We asked respondents how often they participated in any groups such as a sports or social club, a church connected group, a self-help or charitable body or other community group or a day centre; Responses were combined to measure participation at least once a month or less.
KEY FINDINGS
3.4
PARTICIPATION IN COMMUNITY ACTIVITIES (AT LEAST ONCE A MONTH)
participated in community activities at least once a month
cities or towns countryside or village
50% 46%49% 46%
55–69 70+
48% 47%
48% 55+
age age
age

41 POSITIVE AGEING LOCAL INDICATORS / PARTICIPATION
GEOGRAPHICAL DIFFERENCE
TABLE 11 PERCENTAGE WHO PARTICIPATED IN COMMUNITY ACTIVITIES AT LEAST ONCE A MONTH, BY LOCAL AUTHORITY AREA
Local Authority % 95% CI
Clare 43.5 (34.5, 53.0)
Cork County 54.8 (46.0, 63.2)
Cork City 45.3 (37.6, 53.2)
Cavan 38.1 (30.9, 46.0)
Dublin City 47.4 (39.8, 55.1)
Dublin Fingal 54.3 (45.4, 63.0)
Dun Laoghaire-Rathdown 60.2 (53.2, 66.8)
South Dublin 63.7 (54.4, 72.0)
Galway Co. 46.8 (40.9, 52.8)
Galway City 40.8 (34.1, 47.9)
Kildare 46.8 (37.3, 56.5)
Kilkenny 32.9 (26.7, 39.9)
Laois 28.2 (22.5, 34.8)
Limerick City 34.4 (29.2, 40.0)
Limerick Co. 44.2 (36.2, 52.5)
Louth 39.0 (32.8, 45.6)
Meath 47.2 (39.8, 54.8)
Mayo 45.3 (37.9, 52.9)
Tipperary 40.2 (32.6, 48.3)
Wicklow 45.2 (38.5, 52.1)
Wexford 40.9 (35.4, 46.6)
Total 47.5 (45.4, 49.5)

42
BARRIERS TO PARTICIPATION
We asked respondents to identify the barriers to participation in community and social activity. The choices offered included;
– the social activities available don’t interest me; – the costs involved are too high; – people have negative attitudes about older people being involved in the
activities;– I can’t get to the venues where the social activities are happening or– I don’t have any interest in attending social activities.
KEY FINDINGS
The percentage of people experiencing barriers to social participation varied across the areas surveyed. Difficulty getting to the social activities ranged from as little as 2.1% in suburban South Dublin to almost 25% in Laois. Table 11 and 12 show the percentage within each Local Authority area who experienced different barriers to social participation.
INDIVIDUAL BARRIERS TO PARTICIPATION
experienced one or more barriers
the activities availabledon’t interest them
don’t have any interest in attending activities
cannot get tothe venue
costs weretoo high
people have negativeattitudes towards older people being involved
25% 22%
37%
41%
11% 10% 8.2%
55–69
70+
age
age

43 POSITIVE AGEING LOCAL INDICATORS / PARTICIPATION
TABLE 12 BARRIERS TO SOCIAL PARTICIPATION IN EACH LOCAL AUTHORITY AREA
Local Authority
Can’t get to the venues where the social activities are happening
No interest in attending social activities
% 95% CI % 95% CI
Clare 6.2 (4.0, 9.5) 28.1 (22.7, 34.3)
Cork County 12 (8.6, 16.4) 28.3 (23.1, 34.2)
Cork City 15.2 (11.2, 20.3) 23.3 (17.5, 30.4)
Cavan 9.7 (6.1, 15.0) 26.4 (19.9, 34.1)
Dublin City 6.8 (4.8, 9.5) 14.1 (9.8, 19.8)
Dublin Fingal 10.8 (7.0, 16.4) 24.6 (18, 32.5)
Dun Laoghaire-Rathdown 15.1 (9.5, 23.0) 25.9 (19.6, 33.5)
South Dublin 2.1 (1.0, 4.2) 14.2 (9.0, 21.6)
Galway Co. 13.8 (10.4, 18.2) 19.9 (16.0, 24.6)
Galway City 10.2 (6.6, 15.4) 24.8 (19.2, 31.5)
Kildare 22.7 (16.6, 30.2) 32.0 (24.3, 40.7)
Kilkenny 5.5 (3.3, 8.9) 16.6 (10.6, 24.9)
Laois 24.6 (19.1, 31.0) 31.2 (24.2, 39.2)
Limerick City 7.6 (5.3, 10.9) 37.9 (31.5, 44.7)
Limerick Co. 14.9 (11.1, 19.7) 20.8 (15.6, 27.2)
Louth 6.8 (4.3, 10.6) 35.1 (28.6, 42.3)
Meath 13.0 (8.6, 19.2) 22.9 (16.6, 30.6)
Mayo 6.7 (3.6, 12.0) 10.0 (6.8, 14.5)
Tipperary 11.9 (7.5, 18.3) 16.7 (11.5, 23.6)
Wicklow 7.3 (4.1, 12.5) 22.3 (14.5, 32.8)
Wexford 9.0 (6.5, 12.4) 25.8 (20.5, 31.8)
Total 10.7 (9.7, 11.8) 22.4 (20.9,24.0)

44
TABLE 12 BARRIERS TO SOCIAL PARTICIPATION (CONTINUED)
Social Activities don’t Interest Me
The costs involved are too high
People have negative attitudes about older people being involved
% 95% CI % 95% CI % 95% CI
Clare 29.0 (23.6, 35.1) 4.3 (2.0, 8.9) 1.7 (0.6, 4.5)
Cork County 31.0 (25.7, 36.7) 10.7 (6.7, 16.7) 11.2 (6.0, 19.9)
Cork City 32.4 (25.9, 39.6) 11.3 (8.2, 15.3) 8.4 (5.0, 13.9)
Cavan 29.3 (22.4, 37.2) 9.7 (6.0, 15.2) 7.7 (4.8, 12.2)
Dublin City 11.5 (7.4, 17.4) 4.4 (2.5, 7.6) 5.5 (3.1, 9.7)
Dublin Fingal 23.5 (16.7, 32.0) 10.8 (6.4, 17.7) 15.9 (9.5, 25.3)
Dun Laoghaire-Rathdown 32.4 (25.1, 40.6) 19.3 (13.3, 27.2) 13.1 (7.9, 21.0)
South Dublin 14.7 (9.8, 21.6) 4.7 (2.9, 7.5) 4.8 (2.7, 8.6)
Galway Co. 24.2 (19.6, 29.6) 11.4 (8.0, 16) 7.2 (4.6, 11.0)
Galway City 29.0 (23.2, 35.7) 10.5 (6.9, 15.6) 5.6 (3.2, 9.5)
Kildare 36.2 (26.4, 47.2) 25.4 (19.0, 33.1) 18.1 (11.2, 27.7)
Kilkenny 24.9 (16.6, 35.5) 7.3 (3.8, 13.5) 5.6 (3.1, 10.0)
Laois 28.5 (21.6, 36.5) 31.2 (23.7, 39.7) 16.9 (12.9, 21.8)
Limerick City 40.9 (34.2, 48.0) 8.3 (5.2, 13.1) 4.8 (2.5, 8.7)
Limerick Co. 26.4 (20.0, 34.1) 9.9 (6.9, 14.1) 10.4 (6.1, 17)
Louth 23.1 (16.1, 32.1) 0.5 (0.1, 1.6) 3.1 (0.9, 9.6)
Meath 23.0 (15.2, 33.3) 8.0 (4.5, 13.6) 11.7 (6.8, 19.2)
Mayo 12.3 (8.4, 17.6) 2.2 (1.1, 4.3) 1.2 (0.4, 3.2)
Tipperary 21.2 (14.6, 29.8) 16.1 (10.6, 23.5) 6.6 (3.6, 11.5)
Wicklow 21.3 (13.9, 31.2) 5.7 (3.4, 9.4) 2.0 (0.6, 6.2)
Wexford 34.2 (27.8, 41.3) 7.4 (4.3, 12.6) 5.3 (3.5, 7.9)
Total 24.5 (22.8,26.3) 10.0 (8.8, 11.2) 8.2 (7.0, 9.5)

45 POSITIVE AGEING LOCAL INDICATORS / PARTICIPATION
FACTORS ASSOCIATED WITH COMMUNITY PARTICIPATION
Further analysis identified a number of socio-demographic characteristics that helped explain differences in levels of community participation among adults aged 55 years and older. Full results are presented in Appendix 2 (Table 5).
FIGURE 5 FACTORS ASSOCIATED WITH COMMUNITY PARTICIPATION
Note: results are based on a mixed-effects regression model and reported as Odds Ratios with 95% Confidence Intervals.

46
SOCIALISED AT LEAST ONCE A MONTH
We asked respondents how often they meet socially with friends, relatives, or colleagues. Responses were combined to measure whether respondents met with friends, relatives and colleagues once a month or less than monthly/never.
KEY FINDINGS
SOCIALISED AT LEAST ONCE A MONTH
inner cities and suburbs in towns in villages & open countryside
both men and women socialised regularly in almost equal measure
93% 90%
55–69 70+
92% 55+
93% 92% 91%
age
age age

47 POSITIVE AGEING LOCAL INDICATORS / PARTICIPATION
GEOGRAPHICAL DIFFERENCE IN SOCIALISING
Table 13 shows the percentage of adults aged 55 years and older within each Local Authority area who met with friends, relatives and colleagues once a month. In eight areas more than one in ten people do not meet friends, relatives or colleagues even once a month. The level of monthly socialising ranged from 83% in Galway City to 98% in Louth.
TABLE 13 PERCENTAGE WHO MET AT LEAST MONTHLY WITH FRIENDS/RELATIVES/ COLLEAGUES, BY LOCAL AUTHORITY AREAS
Local Authority
Does not meet friends, relatives, colleagues monthly
Does meet friends, relatives, colleagues monthly
% 95% CI % 95% CI
Clare 10.7 (7.9, 14.3) 89.3 (85.7, 92.1)
Cork County 9.9 (5.9, 16.1) 90.1 (83.9, 94.1)
Cork City 10.0 (6.9, 14.3) 90.0 (85.7, 93.1)
Cavan 11.8 (7.8, 17.4) 88.2 (82.6, 92.2)
Dublin City 6.1 (3.6, 10.2) 93.9 (89.8, 96.4)
Dublin Fingal 6.0 (3.5, 10.0) 94.0 (90.0, 96.5)
Dun Laoghaire-Rathdown 6.5 (3.8,10.9) 93.5 (89.1, 96.2)
South Dublin 3.4 (1.7, 6.5) 96.6 (93.5, 98.3)
Galway Co. 8.8 (6.4, 12.0) 91.2 (88.0, 93.6)
Galway City 17.1 (12.4,23.2) 82.9 (76.8, 87.6)
Kildare 7.0 (4.4, 11.0) 93.0 (89.0, 95.6)
Kilkenny 5.5 (3.6, 8.4) 94.5 (91.6, 96.4)
Laois 16.4 (11.5, 22.8) 83.6 (77.2, 88.5)
Limerick City 12.0 (8.9, 16.0) 88.0 (84.0, 91.1)
Limerick Co. 10.6 (7.5, 14.8) 89.4 (85.2, 92.5)
Louth 2.1 (0.9, 4.8) 97.9 (95.2, 99.1)
Meath 7.0 (4.3, 11.3) 93.0 (88.7, 95.7)
Mayo 12.1 (9.2, 15.7) 87.9 (84.3, 90.8)
Tipperary 5.8 (4.0 ,8.5) 94.2 (91.5, 96.0)
Wicklow 9.5 (5.4, 16.3) 90.5 (83.7, 94.6)
Wexford 8.2 (6.1, 11.1) 91.8 (88.9, 93.9)
Total 8.1 (7.2, 9.0) 91.9 (91.0, 92.8)

48
FACTORS ASSOCIATED WITH MEETING FRIENDS, RELATIVES OR COLLEAGUES
We examined a number of socio-demographic characteristics to identify factors that help explain differences in reports of meeting friends, relatives or colleagues monthly amongst adults aged 55 years and older. The full results are presented in Appendix 2 (Table 6).
FIGURE 6 FACTORS ASSOCIATED WITH MEETING FRIENDS, RELATIVES AND COLLEAGUES AT LEAST ONCE A MONTH
Note: results are based on a mixed-effects regression model and reported as Odds Ratios with 95% Confidence Intervals.

49 POSITIVE AGEING LOCAL INDICATORS / PARTICIPATION
Respondents were asked which mode of transport they had used. They were also asked how difficult it was for them to access public transport in their locality. Responses included: great/some difficulty, easily/very easily, service not used, and, service not available.
We combined great difficulty, and service not available to consider those who have the most difficulty/cannot access public transport.
We also asked respondents to rate their overall satisfaction with public transport options in their local area. Responses included: very poor, poor, fair, good, or excellent.
KEY FINDINGS - USUAL TRANSPORT
TRANSPORTATION3.5
USUAL TRANSPORT
drove themselves in the past week
were driven asa passengerin the past week
75% 58%
79% 59%
55–69 70+
30% 43%
25% 44%
55–69 70+
69%age age
age age

50
DIFFICULTIES WITH ACCESSING PUBLIC TRANSPORT(includes difficulty accessing and public transport not available)
reported difficulties overall
severely limited bylongstanding illness or health issues
living alone living with family
36% 27%
37%
27%
65%
31%55–69 70+
in city suburbs countryside
13% 68%
age age
PUBLIC TRANSPORT RATINGS
FAIR, POOR, OR VERY POOR TRANSPORT RATING(for people with an illness or health condition that limits everyday activities)
(poor or very poor)
people overall
moderately limited(people limited but not severely)
not limited(people with condition but no limitation)
36% 27%
30%
in villages countryside
41% 67%
severely limited(people severely limited)
46%

51 POSITIVE AGEING LOCAL INDICATORS / PARTICIPATION
GEOGRAPHICAL DIFFERENCE – ACCESS TO TRANSPORT AND SATISFACTION WITH TRANSPORT
The percentage in each area who reported difficulty accessing public transport, and satisfaction with transport (for all respondents and among non-drivers only) within each Local Authority area is presented in Table 14 below.
TABLE 14 PUBLIC TRANSPORT ACCESS AND RATINGS, BY LOCAL AUTHORITY AREA
Local Authority
Some/great difficulty accessing public transport
Good/excellent local public transport rating (all)
Good/excellent local public transport rating (non-drivers only)
% 95% CI % 95% CI % 95% CI
Clare 28.1 (20.2,37.6) 51.5 (40.9,61.9) 46.7 (32.6,61.4)
Cork County 62.6 (52.5,71.8) 26.3 (18.6,35.8) 23.6 (14.7,35.7)
Cork City 20.2 (15.0,26.6) 78.8 (70.8,85.1) 68.5 (53.6,80.4)
Cavan 45.2 (33.4,57.6) 37.7 (27.6,49.1) 25.6 (16.1,38.0)
Dublin City 6.0 (3.8,9.5) 81.3 (76.5,85.3) 73.3 (63.7,81.1)
Dublin Fingal 8.3 (5.3,13.0) 60.7 (49.3,71.1) 50.7 (34.2,67.1)
Dun Laoghaire- Rathdown 20.0 (14.9,26.4) 59.2 (51.2,66.7) 50.3 (35.3,65.2)
South Dublin 6.3 (3.7,10.7) 59.6 (50.7,67.9) 45.1 (31.9,59.0)
Galway Co. 50.1 (39.3,60.9) 36.3 (26.5,47.4) 32.8 (21.2,47.0)
Galway City 14.7 (9.2,22.8) 74.6 (64.8,82.4) 75.2 (64.1,83.7)
Kildare 24.2 (17.1,33.1) 60.0 (48.7,70.3) 59.4 (43.9,73.2)
Kilkenny 57.1 (44.8,68.5) 32.2 (22.5,43.9) 30.9 (18.8,46.4)
Laois 39.8 (30.8,49.6) 43.1 (33.1,53.6) 41.4 (29.0,54.9)
Limerick City 15.5 (10.9,21.6) 74.4 (67.1,80.5) 66.5 (53.3,77.5)
Limerick Co. 59.4 (49.0,69.1) 13.8 (8.3,22.2) 13.6 (6.7,25.6)
Louth 12.0 (7.3,19.0) 74.0 (65.2,81.2) 72.9 (56.5,84.7)
Meath 29.8 (21.2,40.1) 54.6 (45.1,63.8) 44.8 (29.4,61.3)
Mayo 50.6 (38.0,63.2) 26.2 (16.4,39.1) 20.0 (11.2,33.1)
Tipperary 26.7 (19.2,35.8) 64.4 (54.0,73.5) 58.2 (45.3,70.1)
Wicklow 48.7 (38.1,59.4) 36.0 (25.8,47.6) 15.1 (8.2,26.2)
Wexford 58.9 (48.3,68.8) 25.1 (18.0,34.0) 21.4 (13.0,33.2)
Total 30.6 (28.1,33.2) 51.6 (48.9,54.3) 42.8 (39.2,46.5)

52
IMPACT OF TRANSPORT PROBLEMS
We asked respondents how often a lack of transport caused them difficulty socialising, doing essential tasks e.g. grocery shopping, and getting to health and social care appointments. Responses included: never; rarely; some of the time; most of the time; and, all of the time. Our analysis focuses on those who reported difficulty some, most, or all of the time..
KEY FINDINGS
IMPACT OF TRANSPORT PROBLEMS OVERALL
have difficulty socialising, doing essential tasks, and/or getting to health or social care appointments due a to lack of transport
difficultysocialising
22%
difficulty doingessential tasks
18%
difficulty gettingto health or socialcare appointments
18%
25%
53 POSITIVE AGEING LOCAL INDICATORS / PARTICIPATION
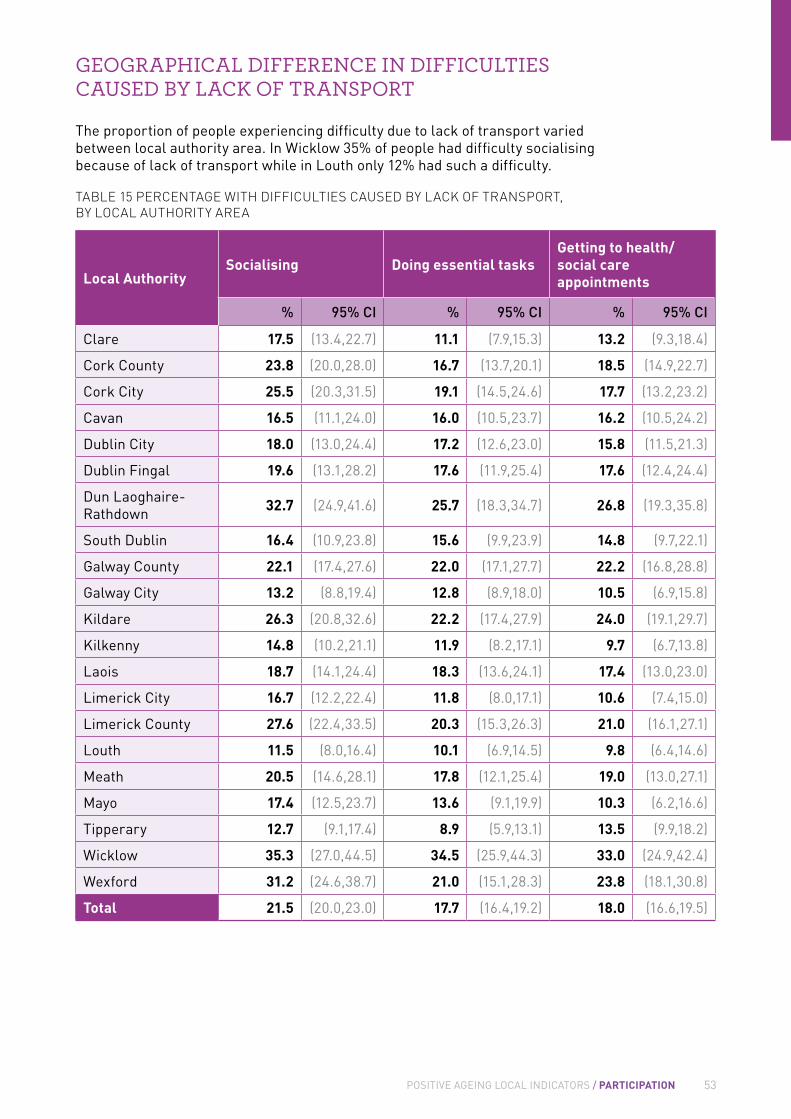
GEOGRAPHICAL DIFFERENCE IN DIFFICULTIES CAUSED BY LACK OF TRANSPORT
The proportion of people experiencing difficulty due to lack of transport varied between local authority area. In Wicklow 35% of people had difficulty socialising because of lack of transport while in Louth only 12% had such a difficulty.
TABLE 15 PERCENTAGE WITH DIFFICULTIES CAUSED BY LACK OF TRANSPORT, BY LOCAL AUTHORITY AREA
Local AuthoritySocialising Doing essential tasks
Getting to health/social care appointments
% 95% CI % 95% CI % 95% CI
Clare 17.5 (13.4,22.7) 11.1 (7.9,15.3) 13.2 (9.3,18.4)
Cork County 23.8 (20.0,28.0) 16.7 (13.7,20.1) 18.5 (14.9,22.7)
Cork City 25.5 (20.3,31.5) 19.1 (14.5,24.6) 17.7 (13.2,23.2)
Cavan 16.5 (11.1,24.0) 16.0 (10.5,23.7) 16.2 (10.5,24.2)
Dublin City 18.0 (13.0,24.4) 17.2 (12.6,23.0) 15.8 (11.5,21.3)
Dublin Fingal 19.6 (13.1,28.2) 17.6 (11.9,25.4) 17.6 (12.4,24.4)
Dun Laoghaire- Rathdown 32.7 (24.9,41.6) 25.7 (18.3,34.7) 26.8 (19.3,35.8)
South Dublin 16.4 (10.9,23.8) 15.6 (9.9,23.9) 14.8 (9.7,22.1)
Galway County 22.1 (17.4,27.6) 22.0 (17.1,27.7) 22.2 (16.8,28.8)
Galway City 13.2 (8.8,19.4) 12.8 (8.9,18.0) 10.5 (6.9,15.8)
Kildare 26.3 (20.8,32.6) 22.2 (17.4,27.9) 24.0 (19.1,29.7)
Kilkenny 14.8 (10.2,21.1) 11.9 (8.2,17.1) 9.7 (6.7,13.8)
Laois 18.7 (14.1,24.4) 18.3 (13.6,24.1) 17.4 (13.0,23.0)
Limerick City 16.7 (12.2,22.4) 11.8 (8.0,17.1) 10.6 (7.4,15.0)
Limerick County 27.6 (22.4,33.5) 20.3 (15.3,26.3) 21.0 (16.1,27.1)
Louth 11.5 (8.0,16.4) 10.1 (6.9,14.5) 9.8 (6.4,14.6)
Meath 20.5 (14.6,28.1) 17.8 (12.1,25.4) 19.0 (13.0,27.1)
Mayo 17.4 (12.5,23.7) 13.6 (9.1,19.9) 10.3 (6.2,16.6)
Tipperary 12.7 (9.1,17.4) 8.9 (5.9,13.1) 13.5 (9.9,18.2)
Wicklow 35.3 (27.0,44.5) 34.5 (25.9,44.3) 33.0 (24.9,42.4)
Wexford 31.2 (24.6,38.7) 21.0 (15.1,28.3) 23.8 (18.1,30.8)
Total 21.5 (20.0,23.0) 17.7 (16.4,19.2) 18.0 (16.6,19.5)

54
FACTORS ASSOCIATED WITH DIFFICULTY SOCIALISING RELATED TO A LACK OF TRANSPORT
We examined a number of socio-demographic characteristics to identify factors that help explain differences between respond reporting that a lack of transport causes difficulty socialising. The full results are presented in Appendix 2 (Table 7).
FIGURE 7 FACTORS ASSOCIATED WITH TRANSPORT CAUSING DIFFICULTY SOCIALISING
Note: results are based on a mixed-effects regression model and reported as Odds Ratios with 95% Confidence Intervals.

55 POSITIVE AGEING LOCAL INDICATORS / PARTICIPATION
DIFFICULTY DOING ESSENTIAL TASKS CAUSE BY A LACK OF TRANSPORT
We examined a number of socio-demographic characteristics to identify factors that help explain differences between respondants reporting that a lack of transport causes difficulty doing essential tasks. The full results are presented in Appendix 2 (Table 8).
FIGURE 8 FACTORS ASSOCIATED WITH TRANSPORT CAUSING DIFFICULTY DOING ESSENTIAL TASKS
Note: results are based on a mixed-effects regression model and reported as Odds Ratios with 95% Confidence Intervals.

56
DIFFICULTY GETTING TO HEALTH AND SOCIAL CARE APPOINTMENTS
We examined a number of socio-demographic characteristics to identify factors that help explain differences between respondants reporting that a lack of transport causes difficulty doing essential tasks. The full results are presented in Appendix 2 (Table 9).
FIGURE 9 FACTORS ASSOCIATED WITH TRANSPORT CAUSING DIFFICULTY GETTING TO HEALTH AND SOCIAL CARE APPOINTMENTS
Note: results are based on a mixed-effects regression model and reported as Odds Ratios with 95% Confidence Intervals.

57 POSITIVE AGEING LOCAL INDICATORS / PARTICIPATION
NOTES
58
4HEALTH

59 POSITIVE AGEING LOCAL INDICATORS / HEALTH
NPAS Goal 2: Health
Support people as they age to maintain, improve or manage their physical and mental health and wellbeing.
NPAS Objective Survey Themes and WHO Age Friendly Programme domains
Prevent and reduce disability, chronic disease and premature mortality as people age by supporting the development and implementation of policies to reduce associated lifestyle factors.
Healthy Ageing
Promote the development and delivery of a continuum of high quality care services and supports that are responsive to the changing needs and preferences of people as they age and at end of life.
Community Support and Health Services
Recognise and support the role of carers by implementing the National Carers’ Strategy (2012) Caregiving

60
Respondents were asked to rate their own health, to identify what, if any diagnosed conditions they had and whether or to what extent they were limited by illness. They were also asked about their health behaviours; physical activity; smoking and alcohol use.
KEY FINDINGS
SELF-RATED HEALTH
WALKING FOR HEALTH OR FITNESS
70%
RATED THEIR HEALTH AS ‘GOOD’ OR ‘VERY GOOD’
55+ 55+
30%
RATED THEIR HEALTH AS ‘FAIR’, ‘BAD’ OR ‘VERY BAD’.
walked in their local area for health or fitness
66%
do not walk in their area for health or fitness
29% cannot walk in their area due to mobility issues5.0%
rated their health as
55-6976%
GOOD VERYGOODor
walk for health or fitness
walk for health or fitness
70%59%
61% rated their health as
70+
GOOD VERYGOODor
OF MEN WALK FOR HEALTH
68% 65%
OF WOMEN WALK FOR HEALTH
55-69 70+
age age
age age
HEALTH STATUS AND BEHAVIOURS 4.1

61 POSITIVE AGEING LOCAL INDICATORS / HEALTH
Based on the self-reported levels of physical activity, it was possible to calculate the proportion of respondents complying with the National Physical Activity Guidelines recommendation of 150 minutes of moderate physical activity per week (Department of Health and Children & HSE, 2009).
SELF-RATED HEALTH
WALKING FOR HEALTH OR FITNESS
70%
RATED THEIR HEALTH AS ‘GOOD’ OR ‘VERY GOOD’
55+ 55+
30%
RATED THEIR HEALTH AS ‘FAIR’, ‘BAD’ OR ‘VERY BAD’.
walked in their local area for health or fitness
66%
do not walk in their area for health or fitness
29% cannot walk in their area due to mobility issues5.0%
rated their health as
55-6976%
GOOD VERYGOODor
walk for health or fitness
walk for health or fitness
70%59%
61% rated their health as
70+
GOOD VERYGOODor
OF MEN WALK FOR HEALTH
68% 65%
OF WOMEN WALK FOR HEALTH
55-69 70+
age age
age age
PHYSICAL ACTIVITY
51% 150mins
moderate physical activity per week
55% 150mins
moderate physical activity per week
47% 150mins
moderate physical activity per week
moderate physical activity per week
55-69150mins
58%
moderate physical activity per week
70+150mins40%
age age

62
TABLE 16 HEALTH CHARACTERISTICS
% (CI 95%)
Self-rated health statusGood or very good 70.3 (68.8, 71.7)
Fair, bad or very bad 29.7 (28.3, 31.2)
Number of chronic conditions
None 31.5 (29.8, 33.2)
One 27.1 (25.8, 28.4)
Two of more 41.4 (39.5, 43.3)
Long-standing illness or condition that limits daily activity
No 57.0 (55.2, 58.7)
Yes - not limited 14.0 (13.0, 15.2)
Yes – limited 22.2 (20.9, 23.5)
Yes - severely limited 6.8 (6.1, 7.5)
Smoking status
Current smoker 18.3 (17.1, 19.5)
Former smoker 29.1 (27.5, 30.7)
Never smoked 52.6 (50.8, 54.4)
Frequency of drinking alcohol in the past 6 months
Weekly (including daily) 24.3 (22.7, 25.9)
Once-twice a month 27.3 (25.9, 28.8)
Less than monthly 11.4 (10.5, 12.3)
Not at all 31.8 (30.1, 33.6)
Consumption varied 5.2 (4.2, 6.5)
Physically active 150mins/weekNo 48.9 (46.9, 50.9)
Yes 51.1 (49.1, 53.1)
Healthcare coverage
Full medical card only 40.2 (38.2, 42.2)
GP visit card only 2.9 (2.4, 3.4)
Health insurance only 27.3 (25.7, 29.0)
Joint cover 19.5 (18.1, 21.1)
No cover 10.1 (9.0, 11.3)

63 POSITIVE AGEING LOCAL INDICATORS / HEALTH
GEOGRAPHICAL DIFFERENCE IN SELF-RATED HEALTH AND LIMITING CONDITIONS
The majority of respondents rated their health as good or very good. The percentage ranged from 63% to 79%, with Meath having the highest proportion at 79%. Wexford had the highest proportion of older adults (37%) who rated their health as ‘fair/bad/very bad’.
TABLE 17 SELF-RATED HEALTH BY LOCAL AUTHORITY AREA
Good or very good Fair, bad or very bad
% 95% CI % 95% CI
Clare 72.3 (67.0,77.1) 27.7 (22.9,33.0)
Cork County 68.1 (64.0,72.0) 31.9 (28.0,36.0)
Cork City 63.7 (57.0,69.9) 36.3 (30.1,43.0)
Cavan 71.7 (65.3,77.4) 28.3 (22.6,34.7)
Dublin City 74.7 (69.1,79.6) 25.3 (20.4,30.9)
Dublin Fingal 75.2 (69.8,79.9) 24.8 (20.1,30.2)
Dun Laoghaire-Rathdown 71.2 (64.2,77.3) 28.8 (22.7,35.8)
South Dublin 62.9 (53.6,71.3) 37.1 (28.7,46.4)
Galway Co. 68.4 (63.6,72.8) 31.6 (27.2,36.4)
Galway City 73.0 (67.8,77.7) 27.0 (22.3,32.2)
Kildare 76.1 (70.3,81.0) 23.9 (19.0,29.7)
Kilkenny 74.1 (68.6,78.8) 25.9 (21.2,31.4)
Laois 65.5 (59.1,71.4) 34.5 (28.6,40.9)
Limerick City 63.6 (56.9,69.7) 36.4 (30.3,43.1)
Limerick Co. 71.4 (65.9,76.4) 28.6 (23.6,34.1)
Louth 72.5 (66.8,77.6) 27.5 (22.4,33.2)
Meath 78.7 (72.6,83.7) 21.3 (16.3,27.4)
Mayo 71.0 (64.2,77.0) 29.0 (23.0,35.8)
Tipperary 65.9 (60.1,71.3) 34.1 (28.7,39.9)
Wicklow 66.9 (59.5,73.5) 33.1 (26.5,40.5)
Wexford 62.7 (56.7,68.3) 37.3 (31.7,43.3)
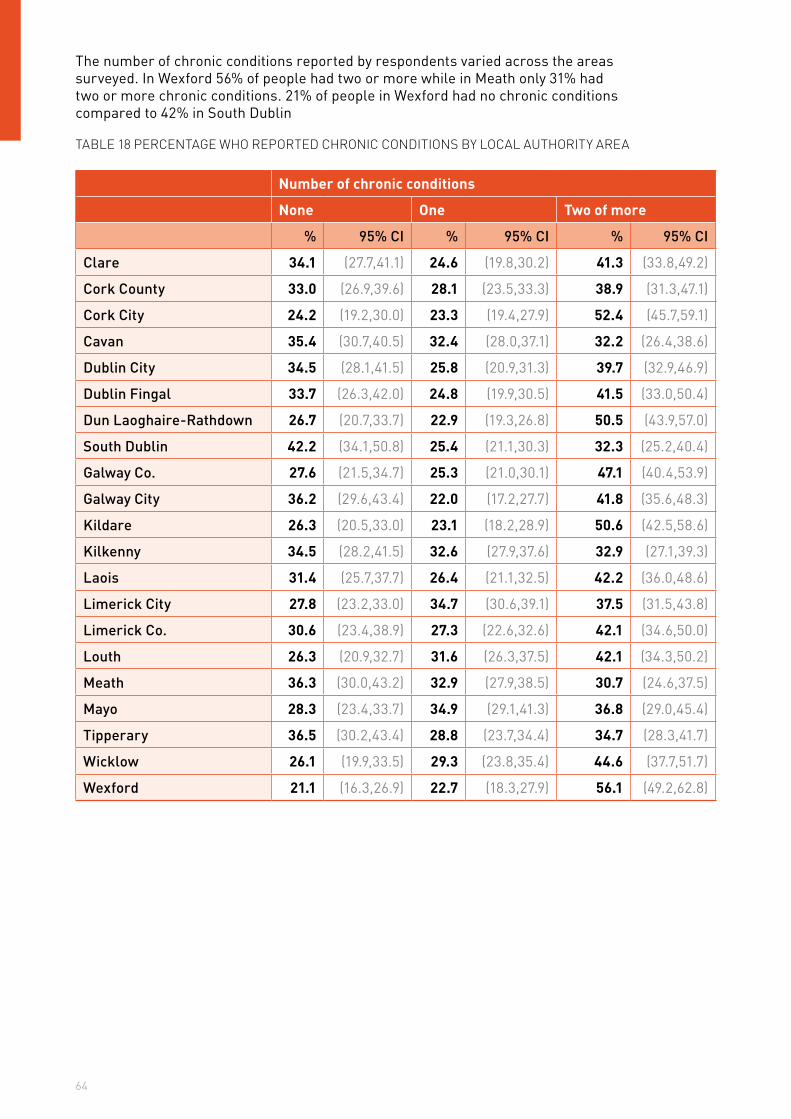
64
The number of chronic conditions reported by respondents varied across the areas surveyed. In Wexford 56% of people had two or more while in Meath only 31% had two or more chronic conditions. 21% of people in Wexford had no chronic conditions compared to 42% in South Dublin
TABLE 18 PERCENTAGE WHO REPORTED CHRONIC CONDITIONS BY LOCAL AUTHORITY AREA
Number of chronic conditions
None One Two of more
% 95% CI % 95% CI % 95% CI
Clare 34.1 (27.7,41.1) 24.6 (19.8,30.2) 41.3 (33.8,49.2)
Cork County 33.0 (26.9,39.6) 28.1 (23.5,33.3) 38.9 (31.3,47.1)
Cork City 24.2 (19.2,30.0) 23.3 (19.4,27.9) 52.4 (45.7,59.1)
Cavan 35.4 (30.7,40.5) 32.4 (28.0,37.1) 32.2 (26.4,38.6)
Dublin City 34.5 (28.1,41.5) 25.8 (20.9,31.3) 39.7 (32.9,46.9)
Dublin Fingal 33.7 (26.3,42.0) 24.8 (19.9,30.5) 41.5 (33.0,50.4)
Dun Laoghaire-Rathdown 26.7 (20.7,33.7) 22.9 (19.3,26.8) 50.5 (43.9,57.0)
South Dublin 42.2 (34.1,50.8) 25.4 (21.1,30.3) 32.3 (25.2,40.4)
Galway Co. 27.6 (21.5,34.7) 25.3 (21.0,30.1) 47.1 (40.4,53.9)
Galway City 36.2 (29.6,43.4) 22.0 (17.2,27.7) 41.8 (35.6,48.3)
Kildare 26.3 (20.5,33.0) 23.1 (18.2,28.9) 50.6 (42.5,58.6)
Kilkenny 34.5 (28.2,41.5) 32.6 (27.9,37.6) 32.9 (27.1,39.3)
Laois 31.4 (25.7,37.7) 26.4 (21.1,32.5) 42.2 (36.0,48.6)
Limerick City 27.8 (23.2,33.0) 34.7 (30.6,39.1) 37.5 (31.5,43.8)
Limerick Co. 30.6 (23.4,38.9) 27.3 (22.6,32.6) 42.1 (34.6,50.0)
Louth 26.3 (20.9,32.7) 31.6 (26.3,37.5) 42.1 (34.3,50.2)
Meath 36.3 (30.0,43.2) 32.9 (27.9,38.5) 30.7 (24.6,37.5)
Mayo 28.3 (23.4,33.7) 34.9 (29.1,41.3) 36.8 (29.0,45.4)
Tipperary 36.5 (30.2,43.4) 28.8 (23.7,34.4) 34.7 (28.3,41.7)
Wicklow 26.1 (19.9,33.5) 29.3 (23.8,35.4) 44.6 (37.7,51.7)
Wexford 21.1 (16.3,26.9) 22.7 (18.3,27.9) 56.1 (49.2,62.8)

65 POSITIVE AGEING LOCAL INDICATORS / HEALTH
TABLE 19 PERCENTAGE WHO REPORTED ACTIVITY-LIMITING HEALTH CONDITIONS, BY LOCAL AUTHORITY AREA
No Yes - not limited Yes - limited Yes - severely limited
% 95% CI % 95% CI % 95% CI % 95% CI
Clare 50.7 (43.7,57.6) 22.4 (18.2,27.4) 20.8 (15.9,26.7) 6.1 (4.4,8.5)
Cork County 47.8 (40.6,55.0) 14.6 (10.8,19.5) 29.5 (25.2,34.1) 8.1 (6.2,10.6)
Cork City 52.1 (45.8,58.4) 10.8 (7.8,14.7) 28.6 (23.3,34.6) 8.5 (5.4,13.0)
Cavan 55.6 (49.1,62.0) 15.4 (11.2,21.0) 21.7 (17.1,27.2) 7.3 (4.2,12.4)
Dublin City 58.5 (53.2,63.7) 17.8 (13.7,22.8) 19.4 (15.4,24.1) 4.3 (2.2,8.0)
Dublin Fingal 60.6 (53.2,67.5) 16.4 (12.5,21.1) 19.6 (14.8,25.4) 3.4 (1.7,6.7)
Dun Laoghaire-Rathdown 61.0 (54.4,67.3) 14.0 (10.0,19.3) 18.0 (13.9,23.0) 6.9 (4.3,10.9)
South Dublin 66.4 (58.1,73.8) 14.9 (10.7,20.4) 15.2 (10.0,22.3) 3.5 (1.9,6.5)
Galway Co. 64.3 (58.4,69.8) 4.6 (3.0,7.0) 22.1 (17.8,27.2) 8.9 (6.7,11.8)
Galway City 54.3 (45.7,62.5) 16.8 (11.8,23.2) 21.9 (17.0,27.6) 7.1 (4.5,11.1)
Kildare 65.7 (56.6,73.8) 9.9 (6.1,15.7) 18.6 (13.5,25.1) 5.8 (3.7,9.0)
Kilkenny 59.7 (53.4,65.7) 12.9 (9.9,16.7) 21.2 (16.6,26.7) 6.2 (4.0,9.4)
Laois 56.0 (47.1,64.4) 8.6 (5.7,12.5) 24.4 (19.2,30.5) 11.1 (6.9,17.4)
Limerick City 47.2 (41.4,53.0) 21.1 (16.8,26.2) 21.3 (16.2,27.4) 10.4 (7.4,14.6)
Limerick Co. 57.5 (49.2,65.5) 11.0 (7.9,15.2) 22.1 (17.6,27.5) 9.3 (6.4,13.4)
Louth 51.6 (45.8,57.4) 20.4 (16.3,25.3) 24.7 (19.6,30.6) 3.3 (1.7,6.0)
Meath 67.0 (60.2,73.2) 12.8 (9.2,17.4) 15.1 (10.9,20.7) 5.1 (3.2,8.0)
Mayo 61.2 (55.0,67.1) 7.4 (5.0,10.8) 23.7 (18.4,29.9) 7.7 (4.9,12.1)
Tipperary 50.6 (42.5,58.7) 13.1 (9.3,18.1) 27.4 (21.4,34.5) 8.8 (6.4,12.1)
Wicklow 58.6 (51.4,65.4) 9.7 (6.1,15.0) 22.0 (16.2,29.1) 9.7 (6.1,15.2)
Wexford 45.2 (39.1,51.4) 18.2 (14.1,23.1) 28.0 (23.0,33.7) 8.6 (6.0,12.3)

66
SMOKING STATUSThe level of current smoking among the over 55s varied across the areas surveyed from 12% in Meath to almost 36% in South Dublin. In most areas, a majority of people never smoked and the proportion of non-smokers ranged from 62% in Meath to almost 40% in Clare.
TABLE 20 SMOKING STATUS, BY LOCAL AUTHORITY AREA
Smoking Status
Current smoker Former smoker Never smoked
% 95% CI % 95% CI % 95% CI
Clare 18.6 (14.8,23.0) 41.5 (36.6,46.5) 39.9 (34.3,45.8)
Cork County 18.4 (15.3,21.9) 33.2 (28.5,38.3) 48.4 (43.2,53.6)
Cork City 26.2 (20.4,33.0) 20.7 (15.8,26.7) 53.0 (45.3,60.7)
Cavan 18.1 (13.6,23.7) 25.3 (20.3,30.9) 56.6 (50.6,62.4)
Dublin City 12.9 (9.9,16.8) 33.4 (26.9,40.5) 53.7 (45.5,61.6)
Dublin Fingal 20.6 (15.1,27.3) 25.0 (19.6,31.4) 54.4 (46.2,62.4)
Dun Laoghaire-Rathdown 15.2 (11.6,19.6) 28.6 (22.4,35.7) 56.3 (48.7,63.5)
South Dublin 35.8 (27.5,45.1) 15.0 (9.8,22.3) 49.2 (40.3,58.1)
Galway County 13.8 (10.4,18.1) 32.7 (26.5,39.7) 53.4 (47.1,59.7)
Galway City 15.8 (11.3,21.6) 35.7 (29.8,42.1) 48.5 (42.3,54.7)
Kildare 21.3 (15.9,28.0) 19.5 (14.2,26.2) 59.2 (51.8,66.2)
Kilkenny 13.9 (10.3,18.4) 29.4 (23.1,36.5) 56.7 (49.4,63.8)
Laois 23.8 (18.8,29.7) 18.1 (13.6,23.7) 58.0 (51.1,64.7)
Limerick City 25.2 (19.9,31.3) 28.8 (24.6,33.4) 46.0 (39.7,52.6)
Limerick County 16.6 (12.0,22.5) 28.7 (23.6,34.4) 54.8 (49.1,60.4)
Louth 20.8 (16.7,25.7) 33.4 (27.7,39.7) 45.7 (38.9,52.7)
Meath 12.0 (8.9,15.9) 25.8 (19.1,33.9) 62.2 (54.4,69.4)
Mayo 13.1 (10.0,17.0) 36.7 (29.7,44.4) 50.2 (43.9,56.5)
Tipperary 19.0 (14.9,23.9) 25.8 (20.5,31.9) 55.3 (49.1,61.2)
Wicklow 15.3 (11.2,20.7) 24.6 (18.6,31.8) 60.1 (52.0,67.6)
Wexford 18.3 (14.9,22.3) 38.7 (33.5,44.1) 43.0 (38.1,48.0)

67 POSITIVE AGEING LOCAL INDICATORS / HEALTH
WEEKLY ALCOHOL CONSUMPTIONThe percentage of respondents who reported that they consume alcohol on a weekly basis also varied across the areas surveyed, from 9.3% in Limerick County to 43.8% in Dun Laoghaire-Rathdown.
TABLE 21 WEEKLY ALCOHOL CONSUMPTION BY LOCAL AUTHORITY AREA
Consumes Alcohol Weekly
Yes
% 95% CIClare 14.5 (11.4,18.3)Cork County 22.3 (17.5,28.0)Cork City 25.1 (19.3,32.0)Cavan 13.8 (9.5,19.5)Dublin City 31.2 (25.3,37.7)Dublin Fingal 36.0 (30.6,41.9)Dun Laoghaire-Rathdown 43.8 (36.5,51.5)South Dublin 26.9 (20.6,34.2)Galway County 24.7 (18.8,31.6)Galway City 22.2 (17.3,28.1)Kildare 30.5 (23.3,38.8)Kilkenny 17.2 (12.8,22.8)
Laois 16.9 (12.6,22.3)
Limerick City 18.7 (14.5,23.8)Limerick County 9.3 (6.8,12.5)Louth 18.9 (14.0,25.0)Meath 27.0 (20.8,34.2)Mayo 12.1 (9.3,15.7)Tipperary 14.4 (10.4,19.5)Wicklow 22.1 (16.8,28.5)Wexford 22.8 (18.2,28.1)

68
FACTORS ASSOCIATED WITH ‘GOOD/VERY GOOD’ SELF-RATED HEALTH
Further analysis identified a number of socio-demographic characteristics such as age, education level, occupational status and health behaviours that explained the differences in self-rated health. The full results are presented in Appendix 2 (Table 10).
FIGURE 10 FACTORS ASSOCIATED WITH GOOD/VERY GOOD HEALTH SELF-RATED HEALTH
Note: results are based on a mixed-effects regression model and reported as Odds Ratios with 95% Confidence Intervals.
A note on alcohol consumption and self-rated health: These findings are consistent with trends in alcohol consumption reported in the Healthy Ireland Survey 2016 (Department of Health, 2017) which found that adults who are more affluent and live in more affluent areas tend to drink more frequently, and these adults also tend to have better health outcomes. However it is important to note that this measure only captures how often someone drinks, and not how much is consumed. In addition, it is worth noting that in Ireland there are a sizeable proportion of people who never drink alcohol.

69 POSITIVE AGEING LOCAL INDICATORS / HEALTH
GEOGRAPHICAL DIFFERENCE - WALKING FOR HEALTH OR FITNESS
Two-thirds of older adults walk in their local area for health or fitness. The percentage ranges from 41% in Laois to 80% in Dublin City. Laois also has the highest proportion of older adults who do not walk for health or fitness (53%) and Limerick City has the highest proportion of older adults who do not walk for health or fitness as a result of mobility issues (12%).
TABLE 22 WALKING IN LOCAL AREA FOR HEALTH OR FITNESS BY LOCAL AUTHORITY AREA
Yes No No, mobility issues
% 95% CI % 95% CI % 95% CI
Clare 69.4 (63.7, 74.5) 22.8 (18.4, 27.8) 7.9 (5.7, 10.8)
Cork County 73.9 (69.3, 78.0) 21.2 (16.9, 26.1) 5.0 (3.3, 7.4)
Cork City 52.3 (45.0, 59.5) 43.1 (36.3, 50.2) 4.6 (2.4, 8.6)
Cavan 63.1 (55.6, 70.1) 31.4 (24.6, 39.1) 5.5 (2.5, 11.4)
Dublin City 79.9 (72.6, 85.7) 14.5 (9.0, 22.5) 5.6 (3.5, 8.7)
Dublin Fingal 58.2 (48.7, 67.2) 36.6 (26.9, 47.5) 5.2 (3.0, 8.7)
Dun Laoghaire-Rathdown 63.9 (55.4, 71.6) 31.9 (23.9, 41.2) 4.2 (2.3, 7.5)
South Dublin 57.8 (47.4, 67.5) 40.3 (30.2, 51.3) 1.9 (0.8, 4.5)
Galway County 62.8 (54.2, 70.7) 30.6 (23.6, 38.7) 6.6 (4.7, 9.2)
Galway City 76.8 (71.3, 81.6) 20.7 (16.1, 26.3) 2.4 (1.3, 4.4)
Kildare 50.4 (40.6, 60.2) 43.1 (32.3, 54.7) 6.5 (3.4, 11.7)
Kilkenny 63.1 (55.8, 69.9) 32.0 (25.4, 39.5) 4.8 (2.9, 7.9)
Laois 41.3 (32.4, 50.7) 52.8 (44.4, 61.1) 5.9 (3.6, 9.5)
Limerick City 63.9 (56.8, 70.4) 24.0 (18.6, 30.4) 12.1 (8.6, 16.8)
Limerick County 67.0 (59.6, 73.7) 30.2 (24.0, 37.2) 2.8 (1.5, 4.9)
Louth 77.5 (69.6, 83.8) 18.6 (12.3, 27.3) 3.9 (2.5, 6.1)
Meath 62.3 (52.1, 71.5) 33.3 (23.9, 44.3) 4.4 (2.3, 8.2)
Mayo 73.2 (65.4, 79.8) 21.5 (15.7, 28.8) 5.2 (2.7, 9.8)
Tipperary 61.7 (53.8, 69.1) 35.2 (27.5, 43.7) 3.1 (1.6, 5.9)
Wicklow 69.9 (62.1, 76.7) 26.3 (19.5, 34.5) 3.8 (2.1, 6.9)
Wexford 64.9 (57.6, 71.6) 27.9 (20.9, 36.2) 7.2 (4.5, 11.2)
Total 66.2 (64.3, 68.1) 28.8 (26.8, 30.8) 5.0 (4.4, 5.7)

70
FACTORS ASSOCIATED WITH WALKING IN THE LOCAL AREA FOR HEALTH OR FITNESS
Further analysis identified a number of socio-demographic characteristics that help explain differences in walking for health or fitness among respondents. Respondents who feel safe out and about during the day were 2.5 times more likely to walk in their local area for health or fitness compared to those who reported not feeling safe out and about during the day. The full results are presented in Appendix 2 (Table 11).
FIGURE 11 FACTORS ASSOCIATED WITH WALKING IN THE LOCAL AREA FOR HEALTH OR FITNESS
Note: results are based on a mixed-effects regression model and reported as Odds Ratios with 95% Confidence Intervals. Analysis does not include respondents who were unable to walk in their local area for health or fitness due to mobility issues.

71 POSITIVE AGEING LOCAL INDICATORS / HEALTH
GEOGRAPHICAL DIFFERENCE – LEVELS OF PHYSICAL ACTIVITY
Just over half (51%) of all survey respondents do at least 150 minutes of moderate physical activity every week. The percentage ranged from 37% in Limerick County to 62% in Mayo.
TABLE 23 AT LEAST 150 MINUTES OF MODERATE PHYSICAL ACTIVITY, BY LOCAL AUTHORITY AREA
Yes No
% 95% CI % 95% CI
Clare 43.1 (36.7, 49.7) 56.9 (50.3, 63.3)
Cork County 51.2 (43.5, 58.8) 48.8 (41.2, 56.5)
Cork City 44.3 (38.3, 50.4) 55.7 (49.6, 61.7)
Cavan 60.6 (53.0, 67.8) 39.4 (32.2, 47.0)
Dublin City 54.8 (47.3, 62.1) 45.2 (37.9, 52.7)
Dublin Fingal 53.2 (44.5, 61.7) 46.8 (38.3, 55.5)
Dun Laoghaire-Rathdown 52.5 (44.3, 60.5) 47.5 (39.5, 55.7)
South Dublin 59.5 (48.8, 69.3) 40.5 (30.7, 51.2)
Galway County 58.9 (51.4, 66.1) 41.1 (33.9, 48.6)
Galway City 58.4 (49.1, 67.1) 41.6 (32.9, 50.9)
Kildare 43.0 (35.1, 51.3) 57.0 (48.7, 64.9)
Kilkenny 54.8 (47.3, 62.1) 45.2 (37.9, 52.7)
Laois 42.2 (35.9, 48.8) 57.8 (51.2, 64.1)
Limerick City 41.6 (35.7, 47.8) 58.4 (52.2, 64.3)
Limerick County 37.1 (30.0, 44.7) 62.9 (55.3, 70.0)
Louth 50.7 (43.7, 57.7) 49.3 (42.3, 56.3)
Meath 45.7 (36.4, 55.2) 54.3 (44.8, 63.6)
Mayo 62.2 (54.3, 69.6) 37.8 (30.4, 45.7)
Tipperary 52.7 (44.1, 61.1) 47.3 (38.9, 55.9)
Wicklow 44.3 (38.6, 50.1) 55.7 (49.9, 61.4)
Wexford 44.2 (36.4, 52.3) 55.8 (47.7, 63.6)
Total 51.1 (49.1, 53.1) 48.9 (46.9, 50.9)

72
FACTORS ASSOCIATED WITH ACHIEVING AT LEAST 150 MINUTES OF MODERATE OR VIGOROUS PHYSICAL ACTIVITY PER WEEK
Further analysis identified a number of personal demographic and socio-economic characteristics that help explain the likelihood that a person will get at least 150 minutes of moderate physical activity per week. Respondents who feel safe out and about during the day were over twice as likely to get at least 150 minutes of moderate physical activity per week (compared to respondents who do not feel safe out and about during the day). The full results are presented in Appendix 2 (Table 12).
FIGURE 12 FACTORS ASSOCIATED WITH 150 MINUTES MODERATE PHYSICAL ACTIVITY PER WEEK
Note: results are based on a mixed-effects regression model and reported as Odds Ratios with 95% Confidence Intervals.

73 POSITIVE AGEING LOCAL INDICATORS / HEALTH
Respondents were asked if they had received a range of different preventative health and screening services in the last 12 months. We also asked them to describe their access to health services
KEY FINDINGS
RECEIVED THE FLU VACCINATION
65% 65+76%
75+57% 65-74 age age age
RECEIVED A BLOOD TEST FOR CHOLESTEROL
75%
55+
77% 74%
85%
70+70% 55-69age age age
COMMUNITY SUPPORT AND HEALTH SERVICES4.2
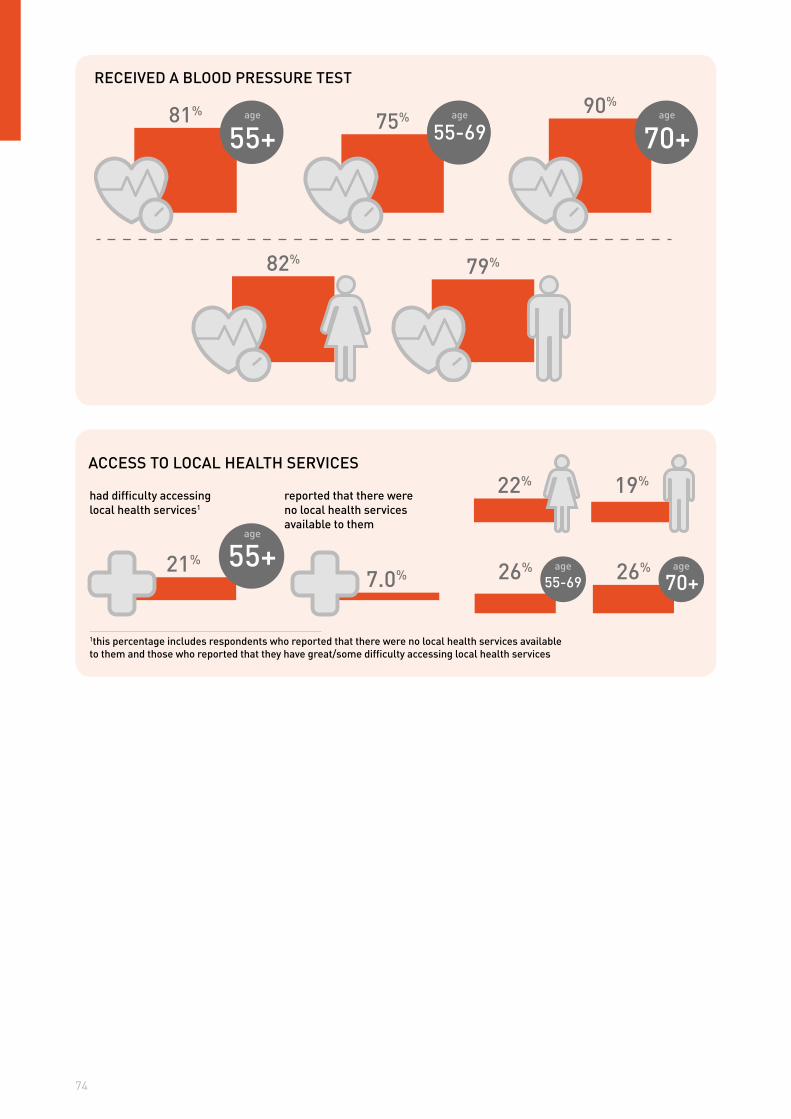
74
RECEIVED A BLOOD PRESSURE TEST
81%
55+90%
70+
82% 79%
75%
70+55-69age age age
ACCESS TO LOCAL HEALTH SERVICES
21% 55+
had difficulty accessing local health services1
7.0%
reported that there were no local health services available to them
22% 19%
26%
1this percentage includes respondents who reported that there were no local health services available to them and those who reported that they have great/some difficulty accessing local health services
70+26%55-69
age
ageage

75 POSITIVE AGEING LOCAL INDICATORS / HEALTH
GEOGRAPHICAL DIFFERENCE – PREVENTATIVE HEALTH
The uptake of the flu vaccination was highest in Kilkenny, Limerick City and Louth (Table 24). The average level of uptake was 65% and the percentage ranged from 50% in Kildare to 79% in Kilkenny. Nine local authority areas had a higher than average level of uptake.
TABLE 24 UPTAKE OF PREVENTATIVE HEALTH MEASURES (FLU VACCINATION – AGE 65+; CHOLESTEROL TESTS AND BLOOD PRESSURE CHECKS)
Flu vaccination Cholesterol test Blood pressure test
% (95% CI) % (95% CI) % (95% CI)
Clare 62.3 (56.6,67.6) 83.1 (78.1,87.2) 85.9 (80.5,90.0)
Cork County 71.3 (64.7,77.1) 82.4 (76.6,87.0) 86.4 (81.4,90.2)
Cork City 72.1 (61.9,80.5) 66.6 (58.8,73.6) 70.8 (62.7,77.7)
Cavan 71.9 (65.6,77.5) 78.9 (72.4,84.2) 84.4 (79.3,88.4)
Dublin City 70.2 (63.1,76.5) 73.5 (67.3,78.9) 79.7 (73.6,84.7)
Dublin Fingal 72.6 (66.0,78.3) 70.9 (62.6,78.1) 76.2 (68.9,82.2)
Dun Laoghaire-Rathdown 46.0 (36.9,55.4) 60.6 (52.2,68.5) 65.3 (56.6,73.1)
South Dublin 59.8 (47.9,70.6) 69.2 (60.8,76.4) 72.0 (63.2,79.5)
Galway Co. 60.7 (54.1,67.0) 76.5 (69.7,82.2) 84.1 (79.2,88.0)
Galway City 61.3 (54.2,68.0) 72.4 (65.3,78.6) 77.6 (70.7,83.2)
Kildare 50.1 (41.9,58.4) 65.1 (57.1,72.3) 73.5 (65.3,80.3)
Kilkenny 79.4 (73.5,84.2) 83.9 (78.1,88.4) 87.7 (81.7,92.0)
Laois 56.9 (48.1,65.2) 69.8 (62.3,76.3) 75.8 (68.0,82.2)
Limerick City 75.9 (70.4,80.6) 87.1 (83.5,89.9) 89.5 (85.8,92.3)
Limerick Co. 67.7 (61.1,73.6) 80.8 (75.1,85.5) 85.6 (79.5,90.1)
Louth 74.4 (68.9,79.2) 78.8 (72.5,83.9) 83.9 (78.3,88.2)
Meath 54.3 (45.9,62.5) 71.0 (64.2,76.9) 75.7 (68.4,81.8)
Mayo 60.1 (52.5,67.3) 79.6 (71.9,85.6) 85.5 (79.2,90.1)
Tipperary 63.8 (56.3,70.7) 81.2 (73.3,87.2) 88.0 (79.4,93.3)
Wicklow 68.1 (60.7,74.7) 82.7 (75.8,88.0) 87.4) (82.5,91.1
Wexford 65.7 (59.7,71.3) 78.5 (72.8,83.2) 86.7 (82.5,90.1)
Total 64.9 (62.9,66.8) 75.3 (73.6,76.9) 80.6 (79.0,82.1)

76
FACTORS ASSOCIATED WITH FLU VACCINATION UPTAKE
We examined a number of socio-demographic characteristics to identify factors that help explain differences in the uptake of flu vaccination among adults aged 65+. The full results are presented in Appendix 2 (Table 13).
FIGURE 13 FACTORS ASSOCIATED WITH FLU VACCINATION UPTAKE AGE 65+
Note: results are based on a mixed-effects regression model and reported as Odds Ratios with 95% Confidence Intervals. Includes respondents aged 65+ only.

77 POSITIVE AGEING LOCAL INDICATORS / HEALTH
FACTORS ASSOCIATED WITH THE UPTAKE CHOLESTEROL BLOOD TESTS AND BLOOD PRESSURE CHECKS
We examined a number of socio-demographic characteristics to identify factors that help explain differences in the uptake of both cholesterol tests and blood pressure checks among adults aged 55 years and older. The results are presented in Appendix 2 (Table 14).
FIGURE 14 FACTORS ASSOCIATED WITH RECEIVING A CHOLESTEROL TEST
Note: results are based on a mixed-effects regression model and reported as Odds Ratios with 95% Confidence Intervals.

78
FIGURE 15 FACTORS ASSOCIATED WITH RECEIVING A BLOOD PRESSURE CHECK
Note: results are based on a mixed-effects regression model and reported as Odds Ratios with 95% Confidence Intervals.
It is worth noting that the uptake of the cholesterol tests significantly differs depending on respondents’ health cover. Compared to respondents who do not have any medical cover, respondents with a full medical card were 2.5 times more likely to get a cholesterol test, respondents with a GP-only card were 51% more likely to get cholesterol test and respondents with private health insurance only were 2.58 times more likely to get a cholesterol test. Furthermore, respondents with dual cover (a medical card and health insurance) were 3.85 times more likely to get a cholesterol test compared to respondents without any medical cover.

79 POSITIVE AGEING LOCAL INDICATORS / HEALTH
Similarly, the uptake of blood pressure checks significantly differs depending on respondents’ health cover. Compared to respondents who do not have any medical cover, respondents with a full medical card were 2.69 times more likely to get a blood pressure check and respondents with private health insurance only were 2.84 times more likely to get a blood pressure check. Furthermore, respondents with dual cover (a medical card and health insurance) were 4.78 times more likely to get a blood pressure check compared to respondents without any medical cover.
GEOGRAPHICAL DIFFERENCE - DIFFICULTY ACCESSING LOCAL HEALTH SERVICES
Rates of difficulty accessing local health services among the overs 55s across the 21 Local Authority areas are presented in Table 23 below. Difficulty accessing local health services was highest within Wexford, Wicklow and Cork County.
TABLE 25 DIFFICULTY ACCESSING HEALTH SERVICES, BY LOCAL AUTHORITY AREA
Local Authority Difficult Easy Unavailable
% 95%CI % 95%CI % 95%CI
Clare 12.8 (7.4,21.3) 79.5 (69.2,87.0) 7.7 (3.2,17.6)
Cork County 18.3 (14.1,23.5) 68.2 (58.9,76.3) 13.4 (6.7,25.0)
Cork City 21.9 (16.1,29.0) 77.7 (70.5,83.5) <1
Cavan 10.3 (5.1,19.5) 77.4 (64.6,86.6) 12.3 (6.1,23.4)
Dublin City 8.4 (5.6,12.4) 91.4 (87.3,94.3) <1
Dublin Fingal 6.1 (3.8,9.8) 93.9 (90.2,96.2) <1
Dun Laoghaire-Rathdown 13.7 (8.8,20.6) 86.3 (79.4,91.2) 0.0
South Dublin 6.7 (3.5,12.4) 93.3 (87.6,96.5) 0.0
Galway County 25.1 (19.3,31.9) 72.5 (64.7,79.2) 2.4 (0.8,6.7)
Galway City 16.7 (11.4,23.8) 81.9 (74.2,87.7) <1
Kildare 20.6 (13.6,29.8) 76.9 (67.5,84.1) 2.6 (0.6,10.5)
Kilkenny 12.6 (8.4,18.4) 80.0 (70.8,86.8) 7.5 (3.7,14.6)
Laois 13.2 (8.6,19.6) 86.6 (80.0,91.2) <1
Limerick City 6.0 (3.9,9.0) 93.9 (90.8,96.0) <1
Limerick County 15.4 (10.0,22.9) 69.9 (58.4,79.3) 14.8 (7.8,26.3)
Louth 8.5 (5.2,13.6) 83.1 (73.7,89.7) 8.4 (3.4,19.1)
Meath 12.5 (8.3,18.5) 80.5 (72.0,87.0) 6.9 (2.6,17.1)
Mayo 11.5 (7.1,18.1) 68.3 (56.1,78.4) 20.2 (11.4,33.2)
Tipperary 17.0 (11.1,25.1) 77.6 (68.5,84.6) 5.4 (1.9,14.2)
Wicklow 18.7 (12.6,26.9) 61.7 (50.7,71.7) 19.6 (11.2,31.9)
Wexford 19.1 (13.8,25.9) 51.6 (41.4,61.6) 29.3 (19.7,41.1)
Total 14.0 (12.7,15.4) 79.0 (76.9,80.8) 7.0 (5.6,8.8)

80
FACTORS ASSOCIATED WITH DIFFICULTY ACCESSING LOCAL HEALTH SERVICES
We examined a number of socio-demographic characteristics to identify factors that help explain differences in experiencing difficulty accessing local health services among adults aged 55 years and older. The full results are presented in Appendix 2(Table 15).
FIGURE 16 FACTORS ASSOCIATED WITH DIFFICULTY ACCESSING LOCAL HEALTH SERVICES
Note: results are based on a mixed-effects regression model and reported as Odds Ratios with 95% Confidence Intervals.

81 POSITIVE AGEING LOCAL INDICATORS / HEALTH
Respondents were asked whether they were involved in providing care to a child or grandchild or whether they cared for an older or disabled relative. Those who do were asked how often they provide such care and whether their own lifestyle had been affected by the caring they provide.
KEY FINDINGS
CARING FOR CHILDREN OR GRANDCHILDREN
As shown in Table 26, 25% of adults aged 55 and older provided care to a child or grandchild on a weekly basis while a further 9.3% did so less regularly. Women were more likely than men to provide this care and respondents aged 75 years or older were significantly less likely to do so.
TABLE 26 PERCENTAGE CARING REGULARLY FOR CHILDREN OR GRANDCHILDREN BY GENDER AND AGE
Weekly Less than weekly Never
% 95% CI % 95% CI % 95% CI
GenderMale 22.5 (20.5,24.6) 8.5 (7.4,9.6) 69.0 (66.7,71.2)
Female 27.1 (25.3,29.0) 10.1 (9.0,11.3) 62.8 (60.6,64.9)
Age
55-64 29.0 (26.8,31.3) 9.2 (7.9,10.6) 61.8 (59.3,64.3)
65-74 26.7 (24.6,29.0) 11.0 (9.8,12.3) 62.3 (59.9,64.7)
75+ 13.9 (11.7,16.4) 7.4 (6.0,9.0) 78.7 (75.8,81.4)
Total 24.9 (23.4,26.5) 9.3 (8.5,10.2) 65.7 (63.9,67.5)
55+25%
provided care to a child or grandchild on a weekly basis.
8.5%
provided care each week to an older or disabled relative.
6.7%
provided care to a child / grandchild and parent / older or disabled relative.
age
CAREGIVING4.3

82
GEOGRAPHICAL DIFFERENCE
Turning to Table 27, the percentage of older adults who cared for a child or grandchild on a weekly basis was highest in and around the Dublin region with the highest proportion reported in Dublin Fingal (37.7%) followed by South Dublin (36.6%). The lowest percentage providing weekly care was found in Clare at 12.8%.
TABLE 27 PERCENTAGE CARING REGULARLY FOR CHILDREN OR GRANDCHILDREN BY LOCAL AUTHORITY AREA
Weekly Less than weekly Never
% 95% CI % 95% CI % 95% CI
Clare 12.8 (9.1,17.8) 5.7 (3.3,9.7) 81.5 (75.5,86.2)
Cork County 29.0 (23.7,35.1) 7.0 (4.7,10.3) 63.9 (58.1,69.4)
Cork City 28.2 (22.2,35.1) 10.4 (7.5,14.2) 61.4 (53.7,68.5)
Cavan 14.9 (11.2,19.5) 5.9 (3.9,8.9) 79.2 (73.9,83.6)
Dublin City 25.8 (20.2,32.3) 6.9 (4.8,9.7) 67.3 (60.5,73.5)
Dublin Fingal 37.7 (30.8,45.1) 10.2 (7.4,13.9) 52.1 (44.4,59.8)
Dun Laoghaire-Rathdown
33.8 (26.9,41.4) 13.4 (9.9,17.8) 52.9 (44.5,61.0)
South Dublin 36.6 (30.4,43.2) 21.3 (16.2,27.4) 42.2 (33.2,51.7)
Galway County 20.8 (16.2,26.2) 7.5 (5.1,11.0) 71.7 (65.0,77.6)
Galway City 19.7 (15.3,25.1) 8.8 (5.6,13.4) 71.5 (65.3,77.0)
Kildare 30.6 (24.3,37.9) 13.7 (9.0,20.3) 55.7 (47.4,63.6)
Kilkenny 19.4 (15.1,24.6) 8.7 (5.6,13.2) 71.9 (65.5,77.5)
Laois 14.6 (10.7,19.5) 7.9 (4.7,12.8) 77.6 (71.0,83.0)
Limerick City 18.0 (13.6,23.6) 6.0 (3.7,9.5) 76.0 (69.6,81.4)
Limerick County 22.5 (17.9,27.8) 15.2 (11.7,19.4) 62.3 (56.1,68.2)
Louth 27.8 (21.8,34.8) 6.5 (4.6,9.1) 65.7 (58.4,72.3)
Meath 22.8 (17.6,28.9) 7.6 (5.1,11.1) 69.7 (63.2,75.5)
Mayo 14.5 (9.5,21.4) 10.1 (7.3,13.9) 75.4 (68.0,81.5)
Tipperary 19.7 (15.0,25.3) 7.0 (4.4,11.1) 73.3 (67.0,78.9)
Wicklow 14.0 (9.4,20.4) 6.2 (3.6,10.7) 79.7 (71.2,86.2)
Wexford 21.3 (16.4,27.1) 6.4 (4.3,9.4) 72.3 (66.3,77.7)
Total 24.9 (23.4,26.5) 9.3 (8.5,10.2) 65.7 (63.9,67.5)
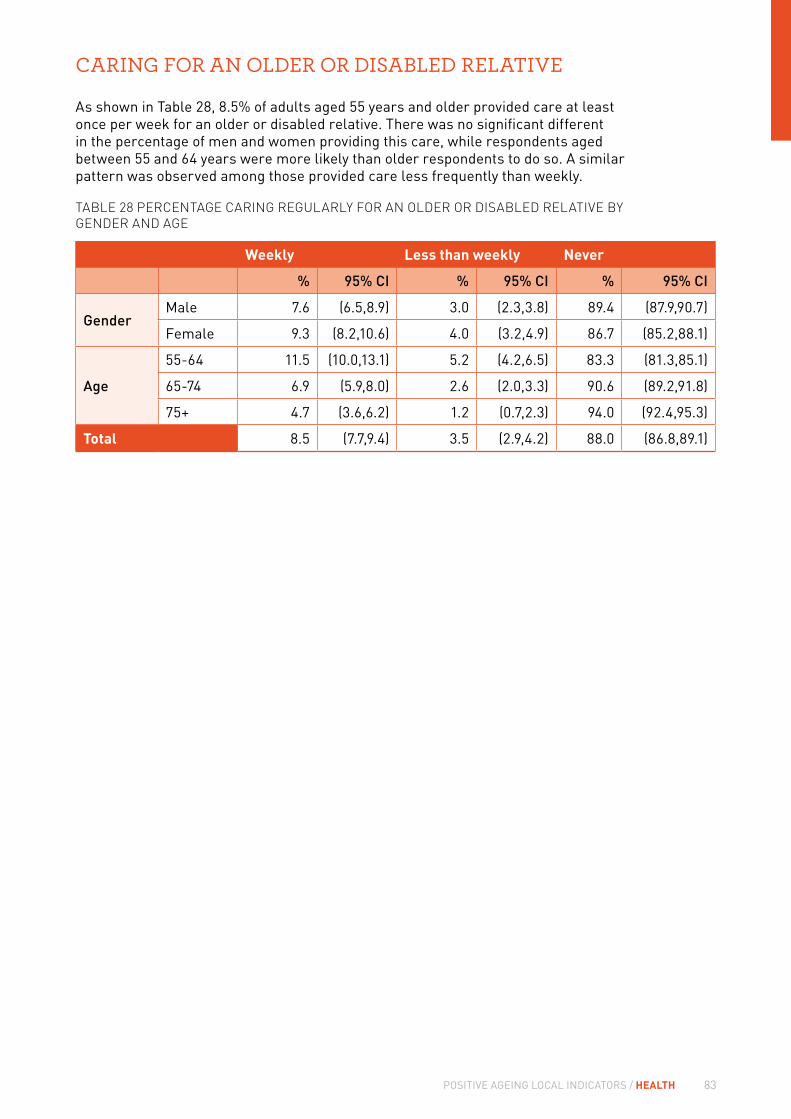
83 POSITIVE AGEING LOCAL INDICATORS / HEALTH
CARING FOR AN OLDER OR DISABLED RELATIVE
As shown in Table 28, 8.5% of adults aged 55 years and older provided care at least once per week for an older or disabled relative. There was no significant different in the percentage of men and women providing this care, while respondents aged between 55 and 64 years were more likely than older respondents to do so. A similar pattern was observed among those provided care less frequently than weekly.
TABLE 28 PERCENTAGE CARING REGULARLY FOR AN OLDER OR DISABLED RELATIVE BY GENDER AND AGE
Weekly Less than weekly Never
% 95% CI % 95% CI % 95% CI
GenderMale 7.6 (6.5,8.9) 3.0 (2.3,3.8) 89.4 (87.9,90.7)
Female 9.3 (8.2,10.6) 4.0 (3.2,4.9) 86.7 (85.2,88.1)
Age
55-64 11.5 (10.0,13.1) 5.2 (4.2,6.5) 83.3 (81.3,85.1)
65-74 6.9 (5.9,8.0) 2.6 (2.0,3.3) 90.6 (89.2,91.8)
75+ 4.7 (3.6,6.2) 1.2 (0.7,2.3) 94.0 (92.4,95.3)
Total 8.5 (7.7,9.4) 3.5 (2.9,4.2) 88.0 (86.8,89.1)

84
GEOGRAPHICAL DISTANCES
The highest percentage of respondents who provided weekly care was found in Dun Laoghaire-Rathdown (15.7%) followed by Cork City (11.7%). The lowest percentage was observed in Clare with 5.7% of respondents in that Local Authority providing this type of care.
TABLE 29 PERCENTAGE CARING REGULARLY FOR AN OLDER OR DISABLED RELATIVE BY LOCAL AUTHORITY AREA
Weekly Less than weekly Never
% 95% CI % 95% CI % 95% CI
Clare 4.7 (2.8,8.0) 0.6 (0.1,4.3) 94.6 (91.1,96.8)
Cork County 8.1 (5.3,12.1) 1.9 (0.8,4.5) 90.1 (85.6,93.2)
Cork City 11.7 (7.3,18.0) 6.5 (3.8,10.8) 81.9 (73.5,88.1)
Cavan 6.9 (4.6,10.3) 0.8 (0.2,2.5) 92.3 (88.8,94.8)
Dublin City 7.3 (4.9,10.7) 1.3 (0.6,3.0) 91.3 (87.9,93.9)
Dublin Fingal 9.3 (6.5,13.1) 6.0 (3.6,9.8) 84.7 (80.1,88.4)
Dun Laoghaire-Rathdown 15.7 (12.0,20.3) 11.1 (7.2,16.7) 73.2 (66.2,79.3)
South Dublin 10.8 (7.3,15.7) 13.2 (8.8,19.5) 76.0 (67.5,82.8)
Galway County 10.3 (7.2,14.6) 1.9 (1.0,3.7) 87.8 (83.3,91.2)
Galway City 7.8 (5.4,11.2) 1.7 (1.0,3.0) 90.5 (87.1,93.0)
Kildare 5.4 (3.2,9.0) 6.5 (3.7,11.4) 88.0 (82.1,92.2)
Kilkenny 9.5 (6.7,13.4) 1.7 (0.8,3.6) 88.8 (84.9,91.7)
Laois 6.3 (3.8,10.1) 1.1 (0.5,2.3) 92.7 (88.9,95.2)
Limerick City 7.4 (5.0,10.9) 0.3 (0.1,1.2) 92.3 (88.7,94.8)
Limerick County 7.2 (4.5,11.2) 1.5 (0.6,3.9) 91.3 (87.2,94.2)
Louth 8.3 (5.7,11.9) 0 --- 91.7 (88.1,94.3)
Meath 7.5 (5.1,11.1) 2.8 (1.1,6.9) 89.6 (85.2,92.8)
Mayo 8.6 (4.1,17.3) 0.1 (0.0,0.6) 91.3 (82.7,95.8)
Tipperary 7.1 (4.6,10.7) 1.5 (0.6,3.7) 91.4 (87.8,94.0)
Wicklow 6.4 (4.0,10.1) 4.2 (1.7,9.6) 89.4 (82.7,93.7)
Wexford 7.6 (5.2,11.1) 1.8 (0.8,3.9) 90.6 (86.5,93.5)
Total 8.5 (7.7,9.4) 3.5 (2.9,4.2) 88.0 (86.8,89.1)

85 POSITIVE AGEING LOCAL INDICATORS / HEALTH
CARING FOR A CHILD OR GRANDCHILD AND AN OLDER OR DISABLED RELATIVE
Tables 30 and 31 show the percentage of adults aged 55+ who provided any frequency of care to either a child or grandchild and older or disabled relative.
TABLE 30 PERCENTAGE CARING REGULARLY FOR CHILDREN / GRANDCHILDREN OR PAR-ENT / OLDER OR DISABLED RELATIVE BY GENDER AND AGE
No Yes
% 95% CI % 95% CI
GenderMale 94.0 (92.8,95.1) 6.0 (4.9,7.2)
Female 92.6 (91.4,93.6) 7.4 (6.4,8.6)
Age
55-64 90.3 (88.6,91.7) 9.7 (8.3,11.4)
65-74 94.7 (93.6,95.6) 5.3 (4.4,6.4)
75+ 97.5 (96.4,98.3) 2.5 (1.7,3.6)
Total 93.3 (92.3,94.1) 6.7 (5.9,7.7)

86
GEOGRAPHICAL DISTANCES
Table 31 shows that the highest percentage of respondents who provided care were found in South Dublin (20.4%) and Dun Laoghaire-Rathdown (17.0%) while the lowest was in Clare (2.4%).
TABLE 31 PERCENTAGE CARING REGULARLY FOR CHILDREN / GRANDCHILDREN OR PARENT / OLDER OR DISABLED RELATIVE BY LOCAL AUTHORITY AREA
No Yes
% 95% CI % 95% CI
Clare 97.6 (94.0,99.0) 2.4 (1.0,6.0)
Cork County 95.9 (91.4,98.1) 4.1 (1.9,8.6)
Cork City 86.7 (79.2,91.8) 13.3 (8.2,20.8)
Cavan 95.8 (92.6,97.6) 4.2 (2.4,7.4)
Dublin City 96.8 (94.6,98.1) 3.2 (1.9,5.4)
Dublin Fingal 89.8 (85.6,93.0) 10.2 (7.0,14.4)
Dun Laoghaire-Rathdown 83 (76.5,88.0) 17.0 (12.0,23.5)
South Dublin 79.6 (71.4,85.9) 20.4 (14.1,28.6)
Galway County 93.9 (90.2,96.2) 6.1 (3.8,9.8)
Galway City 96.3 (93.9,97.8) 3.7 (2.2,6.1)
Kildare 91.2 (85.9,94.6) 8.8 (5.4,14.1)
Kilkenny 96.1 (93.1,97.9) 3.9 (2.1,6.9)
Laois 97.2 (94.6,98.5) 2.8 (1.5,5.4)
Limerick City 97.5 (95.0,98.7) 2.5 (1.3,5.0)
Limerick County 95.7 (92.7,97.4) 4.3 (2.6,7.3)
Louth 97 (93.8,98.5) 3.0 (1.5,6.2)
Meath 95.8 (92.3,97.7) 4.2 (2.3,7.7)
Mayo 97.8 (95.6,98.9) 2.2 (1.1,4.4)
Tipperary 95.3 (91.8,97.3) 4.7 (2.7,8.2)
Wicklow 94 (87.6,97.2) 6.0 (2.8,12.4)
Wexford 95.9 (93.2,97.5) 4.1 (2.5,6.8)
Total 93.3 (92.3,94.1) 6.7 (5.9,7.7)

87 POSITIVE AGEING LOCAL INDICATORS / HEALTH
NOTES

88
5SECURITY

89 POSITIVE AGEING LOCAL INDICATORS / SECURITY
NPAS Goal 3: Security
Enable people to age with confidence, security and dignity in their own homes and communities for as long as possible
NPAS Objective Survey Themes
Facilitate older people to live in well-maintained, affordable, safe and secure homes, which are suitable to their physical and social needs.
Housing
Support the design and development of age friendly public spaces, transport and buildings
Outdoor Spaces and Buildings
Continue to implement An Garda Síochána Older People Strategy and empower people as they age to live free from fear in their own homes, to feel safe and confident outside in their own communities, and support an environment where this sense of security is enhanced.
Safety and Security

90
Respondents were asked to identify issues with housing upkeep, conditions and facilities.
Problems in relation to housing conditions included: rot in windows, doors or floors; damp or leaks in walls.
Problems in relation to housing facilities included: shortage of space; home too big for current needs; lack of indoor flushing toilet; lack of a bath or shower; lack of downstairs toilet/bathroom facilities and lack of place to sit outside.
Respondents were asked whether they had difficulty carrying out maintenance or upkeep themselves or whether their difficulty was with the cost of upkeep.
Heating difficulties were assessed using the question “Have you been able to keep your home adequately warm in the last 12 months?”
KEY FINDINGS
We did not observe significant differences between men and women, or between different age groups, for conditions, facilities, or heating problems.
HOUSING5.1
25%
had difficulty with housing maintenance
10%
had housing conditions problems
20.7%
had housing facility problems
10.4%
were unable to keep their home adequately warm
HOUSING MAINTENANCE
24% 17% 16%55-69 28%70+
Had difficulty carrying out maintenance themselves
Had difficulty carrying out maintenance themselves
age age

91 POSITIVE AGEING LOCAL INDICATORS / SECURITY
Across the different survey areas, the largest proportion of those reporting housing conditions problems was in Galway City (18.1%) and the lowest was in Mayo (4.5%). (See Table 32 for further detail).
TABLE 32 PERCENTAGE REPORTING HOUSING UPKEEP AND CONDITIONS PROBLEMS, BY LOCAL AUTHORITY AREA
Local AuthorityUpkeep (cost or carrying out maintenance) Conditions
(%) 95% CI (%) 95% CI
Clare 31.6 (24.7, 39.4) 7.8 (4.1, 14.6)
Cork County 38.6 (32.2, 45.3) 11.0 (7.3, 16.3)
Cork City 31.9 (24.2, 40.8) 17.3 (11.5, 25.0)
Cavan 25.5 (18.7, 33.8) 9.8 (6.1, 15.4)
Dublin City 20.5 (14.5, 28.0) 9.5 (6.2, 14.4)
Dublin Fingal 16.8 (11.4, 24.0) 10.1 (6.8, 14.8)
Dun Laoghaire-Rathdown 25.6 (20.3, 31.6) 5.2 (3.4, 7.9)
South Dublin 13.3 (8.7, 19.8) 7.6 (4.4, 13.0)
Galway Co. 42.5 (35.4, 50.0) 15.0 (10.9, 20.4)
Galway City 43.9 (36.5, 51.6) 18.1 (11.1, 28.2)
Kildare 23.3 (17.7, 29.9) 15.8 (11.4, 21.6)
Kilkenny 16.1 (11.4, 22.2) 6.4 (4.2, 9.5)
Laois 30.6 (24.4, 37.6) 15.5 (10.5, 22.3)
Limerick City 26.0 (20.1, 32.9) 2.7 (1.6, 4.5)
Limerick Co. 30.8 (24.0, 38.7) 15.8 (9.9, 24.4)
Louth 11.2 (7.2, 17.0) 6.6 (4.2, 10.2)
Meath 16.0 (10.7, 23.2) 11.1 (6.7, 17.8)
Mayo 11.3 (6.6, 18.5) 4.5 (2.4, 8.6)
Tipperary 21.0 (14.7, 29.0) 8.4 (5.8, 12.1)
Wicklow 22.3 (15.4, 31.1) 8.6 (5.1, 14.2)
Wexford 42.2 (34.2, 50.7) 13.2 (9.6, 17.8)
Total 25.4 (23.7, 27.3) 10.2 (9.2, 11.4)

92
The largest proportion of respondents who reported housing facility problems was in Galway City (39.7%) and the lowest was in South Dublin County (7.1%). The largest proportion of respondents who reported heating problems was in Cavan (26.0%) and the lowest was in Mayo (2.2%).
TABLE 33 PERCENTAGE REPORTING HOUSING FACILITY AND HEATING PROBLEMS, BY LOCAL AUTHORITY AREA
Local AuthorityFacilities Unable to keep house adequately
warm
(%) 95% CI (%) 95% CI
Clare 21.8 (16.6, 28.0) 7.0 (4.5, 10.7)
Cork County 22.2 (16.9, 28.5) 7.0 (4.5, 10.9)
Cork City 39.4 (31.2, 48.3) 20.7 (14.5, 28.8)
Cavan 20.8 (15.4, 27.4) 26.0 (17.0, 37.6)
Dublin City 22.6 (15.9, 31.1) 9.2 (5.6, 14.6)
Dublin Fingal 16.6 (10.5, 25.2) 9.2 (5.0, 16.3)
Dun Laoghaire- Rathdown 23.0 (16.7, 30.8) 17.5 (12.0, 24.8)
South Dublin 7.1 (4.2, 11.5) 12.5 (7.3, 20.6)
Galway Co. 24.4 (19.6, 30.0) 12.0 (7.8, 18.1)
Galway City 39.7 (31.6, 48.4) 7.8 (5.3, 11.3)
Kildare 28.7 (22.0, 36.6) 13.2 (9.1, 18.8)
Kilkenny 12.1 (8.6, 16.9) 5.2 (3.4, 8.1)
Laois 33.8 (26.8, 41.6) 10.5 (7.0, 15.4)
Limerick City 27.1 (20.4, 34.9) 11.3 (7.6, 16.6)
Limerick Co. 19.7 (13.6, 27.6) 9.0 (5.7, 13.7)
Louth 11.7 (7.9, 17.0) 5.6 (3.4, 9.0)
Meath 16.8 (10.9, 24.9) 13.2 (8.4, 20.1)
Mayo 9.7 (6.4, 14.4) 2.2 (1.1, 4.4)
Tipperary 19.4 (14.4, 25.6) 6.0 (3.6, 9.8)
Wicklow 15.0 (8.4, 25.4) 10.6 (6.2, 17.6)
Wexford 21.9 (17.3, 27.3) 12.3 (7.8, 18.7)
Total 20.7 (19.1, 22.5) 10.4 (9.2, 11.6)

93 POSITIVE AGEING LOCAL INDICATORS / SECURITY
The percentage of adults with housing problems who would like financial help for bills or upkeep, adaptation or physical improvements and who would like non-financial help with housing maintenance is summarised in Table 34 below.
TABLE 34 PERCENTAGE WITH HOUSING UPKEEP AND CONDITIONS DIFFICULTIES WHO WOULD LIKE HELP WITH MAINTENANCE AND UPKEEP
Financial help (bills/upkeep)
Financial help (adaptation/physical improvements)
Non-financial (maintenance)
% (95% CI) % (95% CI) % (95% CI)
Conditions Yes 56.9 (51.85,61.78) 59.9 (54.73,64.91) 59.7 (54.84,64.39)
No 34.0 (31.34,36.8) 33.7 (31.29,36.24) 31.9 (29.56,34.25)
FacilitiesYes 41.7 (7.86,45.69) 50.4 (46.29,54.59) 49.8 (45.86,53.65)
No 34.9 (32.02,37.94) 32.8 (46.29,54.59) 30.8 (28.45,33.33)
Upkeep Yes 55.1 (51.23,58.82) 60.9 (57.15,64.54) 65.5 (61.82,69.1)
No 30.1 (27.24,33.06) 28.1 (25.72,30.61) 24.3 (22.12,26.52)
FACTORS ASSOCIATED WITH DIFFICULTY WITH HOUSING MAINTENANCE
There are several personal demographic and socio-economic characteristics that increase the likelihood of experiencing difficulty with housing maintenance. The full results presented in Appendix 2 (Table 16).
FIGURE 17 FACTORS ASSOCIATED WITH HOUSING MAINTENANCE PROBLEMS
Note: results are based on a mixed-effects regression model and reported as Odds Ratios with 95% Confidence Intervals.
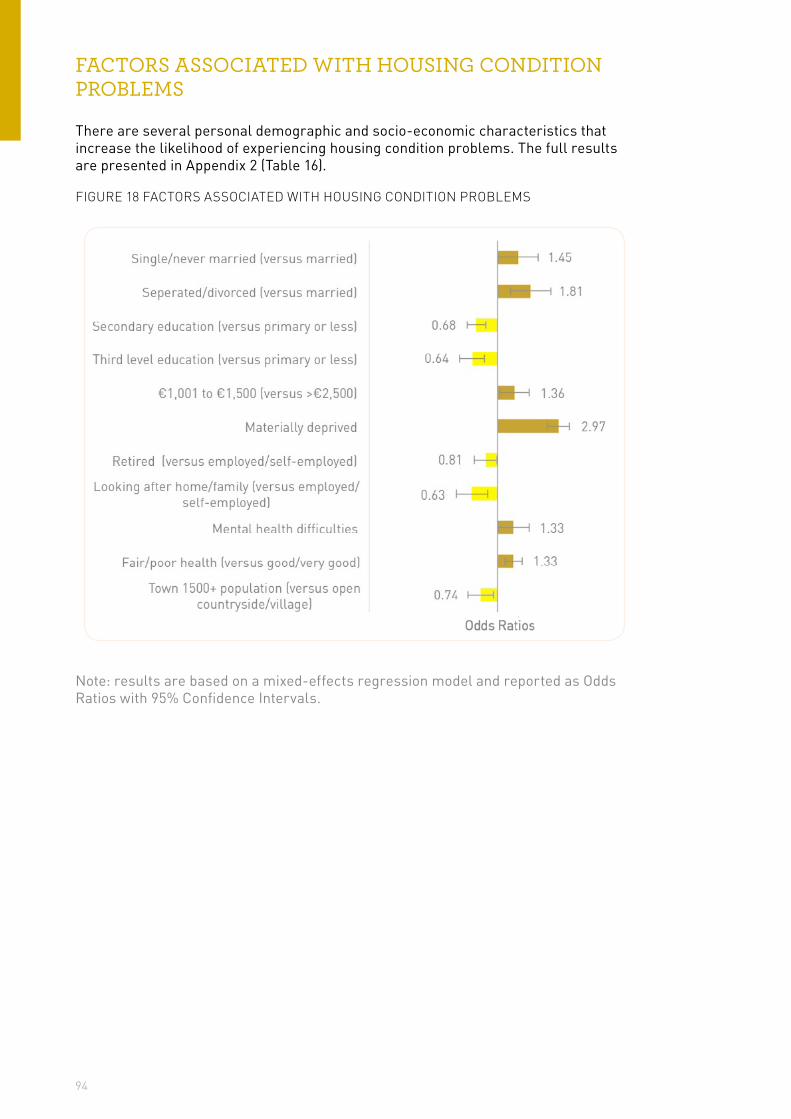
94
FACTORS ASSOCIATED WITH HOUSING CONDITION PROBLEMS
There are several personal demographic and socio-economic characteristics that increase the likelihood of experiencing housing condition problems. The full results are presented in Appendix 2 (Table 16).
FIGURE 18 FACTORS ASSOCIATED WITH HOUSING CONDITION PROBLEMS
Note: results are based on a mixed-effects regression model and reported as Odds Ratios with 95% Confidence Intervals.
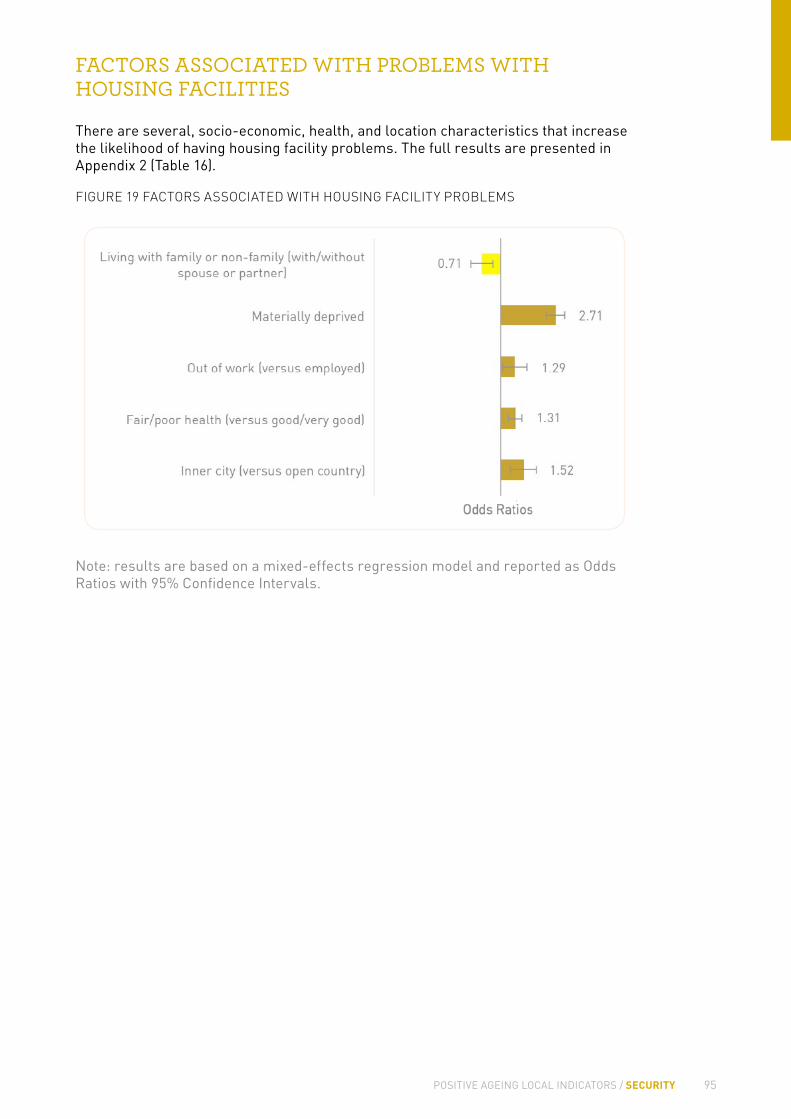
95 POSITIVE AGEING LOCAL INDICATORS / SECURITY
FACTORS ASSOCIATED WITH PROBLEMS WITH HOUSING FACILITIES
There are several, socio-economic, health, and location characteristics that increase the likelihood of having housing facility problems. The full results are presented in Appendix 2 (Table 16).
FIGURE 19 FACTORS ASSOCIATED WITH HOUSING FACILITY PROBLEMS
Note: results are based on a mixed-effects regression model and reported as Odds Ratios with 95% Confidence Intervals.

96
FACTORS ASSOCIATED WITH AN INCREASED LIKELIHOOD OF HAVING HEATING DIFFICULTY
FIGURE 20 FACTORS ASSOCIATED WITH HOUSING HEATING PROBLEMS
Note: results are based on a mixed-effects regression model and reported as Odds Ratios with 95% Confidence Intervals.

97 POSITIVE AGEING LOCAL INDICATORS / SECURITY
Respondents rated different aspects of the built environment in their local area; number of pedestrian crossings and traffic lights; timing of pedestrian crossings and traffic lights; availability of seats and resting places; availability or effectiveness of traffic calming measures; General appearances and upkeep (e.g. litter or graffiti); quality and continuity of paths or pavements; and availability of accessible toilets.
KEY FINDINGS
OUTDOOR SPACES AND BUILDINGS5.2
KEY FINDINGS – SATISFACTION WITH THE BUILT ENVIRONMENT
21%
More than one-in-five were dissatisfied with the number of pedestrian crossings and traffic lights in their area. This ranged from 44% in urban areas of Limerick County to 9.4% in Limerick City.
20%
One-in-five were dissatisfied with the timing of pedestrian crossings and traffic lights. This ranged from 37% in urban areas of Galway County to 8.2% in Limerick City.
29%
More than one-in-four were dissatisfied with traffic calming measures. This ranged from 53% in urban areas of Limerick County to 12% in South Dublin.
64%
More than two-thirds were dissatisfied with the availability of accessible toilets.This ranged from 92% in urban areas of Mayo to 40% in urban areas of Galway County.
45%
More than two-in-five were dissatisfied with the availability of seats or resting places. This ranged from 64% in Limerick County to 23% in Mayo.
15%
One-in-seven were dissatisfied with the general appearance and upkeep.This ranged from 26% in Dublin City to 4.9% in Mayo.
27%
More than one-in-four were dissatisfied with the quality and continuity of pavements. This ranged from 41% in Tipperary to 12% in South Dublin.Note: these results only
include respondents living in villages, towns, or cities

98
GEOGRAPHICAL DIFFERENCE
Based on the responses to the seven items listed above a rating score was developed to measure overall satisfaction with the urban built environment. Scores ranged from 0 (very dissatisfied) to 14 (very satisfied) and responses from rural-dwelling respondents were excluded (ie those who stated that the questions about the built environment were not applicable). The average rating for each Local Authority area is presented in Table 35 below.
TABLE 35 AVERAGE SATISFACTION WITH THE BUILT ENVIRONMENT BY LOCAL AUTHORITY AREA (SCORE 0-14, LOW TO HIGH)
Local authority Mean Score
Mean 95% CI
Clare 8.1 (7.1,9.1)
Cork County 8.8 (7.7,10.0)
Cork City 8.6 (7.6,9.6)
Cavan 8.1 (6.9,9.2)
Dublin City 8.0 (7.3,8.6)
Dublin Fingal 8.0 (7.1,8.9)
Dun Laoghaire-Rathdown 9.0 (8.2,9.7)
South Dublin 9.9 (9.3,10.5)
Galway County 7.4 (5.5,9.3)
Galway City 9.1 (8.6,9.6)
Kildare 8.7 (7.6,9.9)
Kilkenny 10.0 (8.9,11.1)
Laois 8.7 (7.8,9.6)
Limerick City 9.2 (8.7,9.8)
Limerick County 7.1 (6.1,8.1)
Louth 7.9 (7.0,8.8)
Meath 8.4 (7.6,9.2)
Mayo 5.9 (3.9,7.8)
Tipperary 9.4 (8.3,10.6)
Wicklow 8.4 (7.4,9.5)
Wexford 6.6 (5.7,7.4)
Total 8.6 (8.3,8.8)

99 POSITIVE AGEING LOCAL INDICATORS / SECURITY
No significant differences in satisfaction ratings were observed between men and women, or between different age groups. Respondents in poor health had a significantly lower mean rating compared with those who were in good or very good health.
TABLE 36 DISSATISFACTION WITH ASPECTS OF THE URBAN BUILT ENVIRONMENT BY LOCAL AUTHORITY AREA
Pedestrian crossings Timing of crossings Traffic calming measures
% (95% CI) % (95% CI) % (95% CI)
Clare 29.8 (22.0,39.0) 13.3 (7.9,21.5) 28.1 (20.3,37.5)
Cork County 30.0 (18.6,44.6) 15.3 (8.6,25.7) 35.3 (22.4,50.8)
Cork City 18.5 (13.7,24.6) 18.5 (13.5,24.8) 26.2 (19.7,33.8)
Cavan 28.7 (20.4,38.9) 25.3 (17.2,35.5) 33.5 (23.1,45.9)
Dublin City 17.6 (13.1,23.2) 20.2 (14.9,26.9) 29.3 (22.3,37.4)
Dublin Fingal 19.4 (13.7,26.8) 22.1 (16.0,29.6) 29 (22.5,36.5)
Dun Laoghaire- Rathdown 14.8 (10.9,19.8) 16.2 (11.3,22.6) 26.4 (20.7,33.0)
South Dublin 13.0 (8.9,18.5) 11.6 (8.1,16.5) 12.3 (8.2,17.9)
Galway County 34.7 (8.9,18.5) 36.8 (24.1,51.6) 49.3 (37.0,61.8)
Galway City 18.8 (13.2,26.0) 24.9 (18.9,32.1) 26.2 (20.9,32.4)
Kildare 24.5 (17.1,33.7) 23.3 (15.6,33.4) 29.0 (20.7,39.0)
Kilkenny 15.3 (9.9,22.9) 12.3 (7.5,19.6) 16.4 (10.3,25.1)
Laois 19.2 (13.6,26.4) 16.5 (11.4,23.4) 31.6 (23.4,41.1)
Limerick City 9.4 (6.4,13.5) 8.2 (5.2,12.6) 14.1 (10.1,19.3)
Limerick County 43.8 (28.0,61.0) 34.2 (20.2,51.6) 52.5 (39.0,65.7)
Louth 32.7 (25.1,41.3) 36.3 (27.7,45.9) 33.1 (26.2,40.8)
Meath 19.3 (13.6,26.6) 20.8 (14.5,28.9) 31.2 (23.6,40.0)
Mayo 33.3 (15.0,58.6) 25.9 (10.1,52.0) 43.1 (19.4,70.5)
Tipperary 25.0 (18.1,33.5) 18.8 (13.0,26.2) 29.6 (21.7,39.0)
Wicklow 21.4 (13.6,32.1) 23.5 (16.0,33.1) 42.9 (33.2,53.0)
Wexford 37.0 (29.8,46.7) 27.3 (16.8,41.1) 42.3 (33.9,51.2)
Total 21.0 (19.2,22.9) 19.6 (17.8,21.6) 29.0 (26.8,31.3)

100
TABLE 37 DISSATISFACTION WITH FACILITIES AND APPEARANCE OF THE URBAN BUILT ENVIRONMENT BY LOCAL AUTHORITY AREA
Availability of accessible toilets
Available seats resting places General upkeep
% (95% CI) % (95% CI) % (95% CI)
Clare 64.0 (47.5,77.7) 33.5 (22.2,47.1) 7.7 (5.0,11.8)
Cork County 63.7 (47.8,77.1) 29.0 (19.2,41.3) 8.0 (4.6,13.7)
Cork City 43.6 (34.0,53.7) 35.0 (26.8,44.2) 18.0 (12.1,25.8)
Cavan 74.4 (58.1,85.8) 38.6 (25.3,53.8) 19.6 (9.2,37.0)
Dublin City 78.4 (69.0,85.5) 57.4 (48.3,66.1) 26.1 (20.0,33.3)
Dublin Fingal 68.2 (58.6,76.5) 54.8 (44.5,64.7) 16.6 (11.9,22.8)
Dun Laoghaire-Rathdown 67.7 (56.3,77.3) 47.4 (38.3,56.8) 9.2 (6.2,13.4)
South Dublin 46.6 (35.2,58.4) 31.0 (22.1,41.5) 11.5 (6.5,19.8)
Galway County 40.2 (23.1,60.1) 36.4 (18.1,59.7) 10.8 (2.3,38.1)
Galway City 61.0 (52.5,68.9) 36.1 (29.4,43.4) 9.5 (6.4,13.9)
Kildare 64.8 (53.4,74.7) 39.5 (30.6,49.1) 12.9 (8.5,19.3)
Kilkenny 51.1 (37.1,65.0) 28.5 (19.0,40.3) 11.6 (6.5,20.1)
Laois 58.7 (47.3,69.3) 41.0 (32.2,50.5) 16.9 (11.7,23.7)
Limerick City 68.1 (52.3,80.5) 57.4 (46.4,67.8) 6.1 (3.5,10.2)
Limerick County 72.6 (55.7,84.8) 64.2 (49.5,76.6) 7.5 (2.6,19.9)
Louth 65.3 (50.8,77.3) 50.6 (38.7,62.4) 11.1 (7.5,16.2)
Meath 68.7 (57.8,77.9) 50.1 (40.0,60.1) 12.4 (8.3,18.0)
Mayo 91.6 (72.6,97.8) 22.8 (9.6,45.2) 4.9 (1.2,17.6)
Tipperary 44.7 (32.3,57.8) 43.6 (35.0,52.5) 16.3 (11.3,22.8)
Wicklow 56.3 (42.7,69.0) 33.8 (23.8,45.5) 18.3 (12.7,25.5)
Wexford 76.9 (66.9,84.5) 57.2 (43.3,70.0) 17.5 (10.3,28.1)
Total 63.8 (60.5,67.0) 44.5 (41.6,47.4) 14.9 (13.2,16.7)

101 POSITIVE AGEING LOCAL INDICATORS / SECURITY
WALKABILITYTo assess personal mobility and the accessibility of the built environment we asked respondents how difficult they found it to walk a quarter of a mile in their locality. Respondents were also asked to rate the quality of the paths or pavements in their area.
KEY FINDINGS
28% 21% 39%70+ 16%55-69
had difficulty walking in their area had difficulty walking in their local area
People in the countryside or village areas had more difficulty compared to those living in towns or inner cities and suburbs
RURAL
29%
URBAN
22%
WALKABILITY
age age

102
TABLE 38 DISSATISFACTION WITH THE QUALITY AND CONTINUITY OF PATHS OR PAVEMENTS, BY LOCAL AUTHORITY AREA
Walkability: Quality of pavements
% (95% CI)
Clare 32.7 (26.7,39.3)
Cork County 28.7 (19.3,40.4)
Cork City 30.4 (22.7,39.4)
Cavan 27.1 (14.4,45.1)
Dublin City 33.3 (26.5,40.8)
Dublin Fingal 27.9 (20.8,36.4)
Dun Laoghaire-Rathdown 17.6 (13.0,23.5)
South Dublin 12.4 (7.4,20.0)
Galway County 35.0 (20.8,52.4)
Galway City 21.3 (16.1,27.7)
Kildare 22.0 (14.9,31.2)
Kilkenny 19.6 (13.7,27.2)
Laois 33.1 (24.9,42.6)
Limerick City 21.2 (15.8,27.9)
Limerick County 21.8 (11.7,37.0)
Louth 23.5 (18.4,29.5)
Meath 23.1 (16.9,30.6)
Mayo 40.3 (23.3,60.0)
Tipperary 41.3 (32.3,51.1)
Wicklow 31.5 (22.8,41.8)
Wexford 26.3 (17.4,37.7)
Total 27.1 (25.0,29.3)
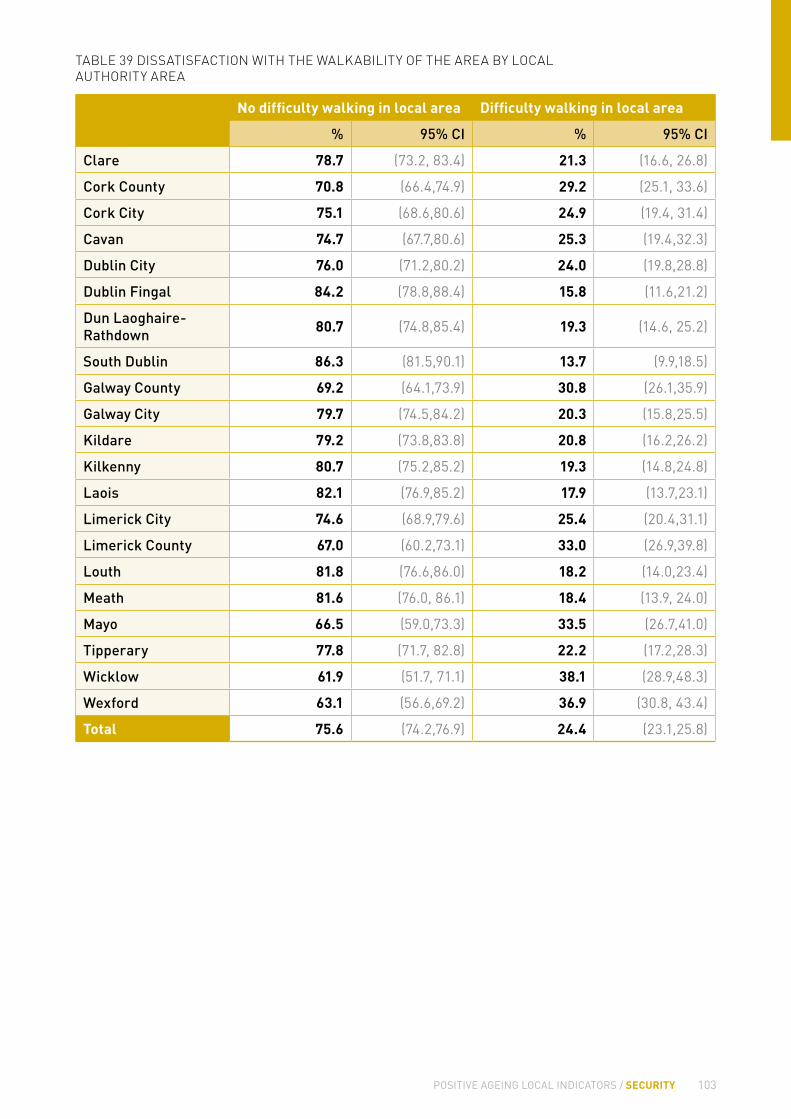
103 POSITIVE AGEING LOCAL INDICATORS / SECURITY
TABLE 39 DISSATISFACTION WITH THE WALKABILITY OF THE AREA BY LOCAL AUTHORITY AREA
No difficulty walking in local area Difficulty walking in local area
% 95% CI % 95% CI
Clare 78.7 (73.2, 83.4) 21.3 (16.6, 26.8)
Cork County 70.8 (66.4,74.9) 29.2 (25.1, 33.6)
Cork City 75.1 (68.6,80.6) 24.9 (19.4, 31.4)
Cavan 74.7 (67.7,80.6) 25.3 (19.4,32.3)
Dublin City 76.0 (71.2,80.2) 24.0 (19.8,28.8)
Dublin Fingal 84.2 (78.8,88.4) 15.8 (11.6,21.2)
Dun Laoghaire-Rathdown 80.7 (74.8,85.4) 19.3 (14.6, 25.2)
South Dublin 86.3 (81.5,90.1) 13.7 (9.9,18.5)
Galway County 69.2 (64.1,73.9) 30.8 (26.1,35.9)
Galway City 79.7 (74.5,84.2) 20.3 (15.8,25.5)
Kildare 79.2 (73.8,83.8) 20.8 (16.2,26.2)
Kilkenny 80.7 (75.2,85.2) 19.3 (14.8,24.8)
Laois 82.1 (76.9,85.2) 17.9 (13.7,23.1)
Limerick City 74.6 (68.9,79.6) 25.4 (20.4,31.1)
Limerick County 67.0 (60.2,73.1) 33.0 (26.9,39.8)
Louth 81.8 (76.6,86.0) 18.2 (14.0,23.4)
Meath 81.6 (76.0, 86.1) 18.4 (13.9, 24.0)
Mayo 66.5 (59.0,73.3) 33.5 (26.7,41.0)
Tipperary 77.8 (71.7, 82.8) 22.2 (17.2,28.3)
Wicklow 61.9 (51.7, 71.1) 38.1 (28.9,48.3)
Wexford 63.1 (56.6,69.2) 36.9 (30.8, 43.4)
Total 75.6 (74.2,76.9) 24.4 (23.1,25.8)

104
FACTORS ASSOCIATED WITH DIFFICULTY WALKINGThere are several, socio-economic, health, and location characteristics that increase the likelihood of experiencing difficulty walking in the local area. Further analysis found that age and health status contributes most to the level of difficulty experienced walking in the local area. Full results are presented in Appendix 2 (Table 17).
FIGURE 21 FACTORS ASSOCIATED WITH DIFFICULTY WALKING IN THE LOCAL AREA
Note: results are based on a mixed-effects regression model and reported as Odds Ratios with 95% Confidence Intervals. Note this analysis does not include respondents who stated that they were unable to walk due to illness and/or disability.
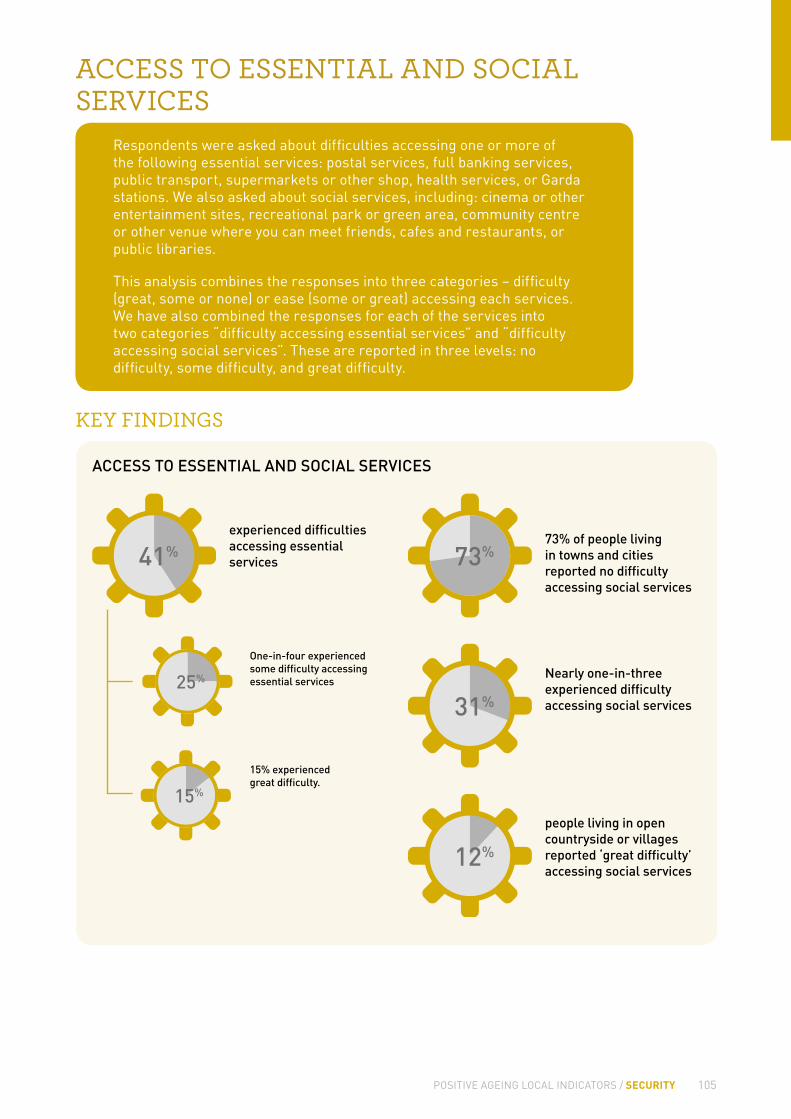
105 POSITIVE AGEING LOCAL INDICATORS / SECURITY
ACCESS TO ESSENTIAL AND SOCIAL SERVICES
Respondents were asked about difficulties accessing one or more of the following essential services: postal services, full banking services, public transport, supermarkets or other shop, health services, or Garda stations. We also asked about social services, including: cinema or other entertainment sites, recreational park or green area, community centre or other venue where you can meet friends, cafes and restaurants, or public libraries.
This analysis combines the responses into three categories – difficulty (great, some or none) or ease (some or great) accessing each services. We have also combined the responses for each of the services into two categories “difficulty accessing essential services” and “difficulty accessing social services”. These are reported in three levels: no difficulty, some difficulty, and great difficulty.
KEY FINDINGS
ACCESS TO ESSENTIAL AND SOCIAL SERVICES
experienced difficulties accessing essential services
One-in-four experienced some difficulty accessing essential services
15% experienced great difficulty.
41%
25% Nearly one-in-three experienced difficulty accessing social services31%
73% of people living in towns and cities reported no difficulty accessing social services
73%
people living in open countryside or villages reported ‘great difficulty’ accessing social services
12%
15%

106
GEOGRAPHICAL DIFFERENCES
The level of difficulty varied greatly across the areas surveyed. The percentage that experienced no difficulty accessing essential services ranged from 77% in Mayo to 33% in Limerick Co. The percentage that experienced ‘great difficulty’ ranged from 37% in Limerick Co. to only 4.2% in Louth.
The highest reports of experiencing great difficulty accessing essential services was evident amongst respondents living in open countryside or village areas (23%) and the highest reports of experiencing no difficulty accessing essential services was evident amongst respondents living in towns (71%). The level of difficulty experienced accessing social services shows a similar pattern across the areas surveyed.
TABLE 40 DIFFICULTY ACCESSING ESSENTIAL SERVICES BY LOCAL AUTHORITY AREA
Essential Services
No difficulty Some difficulty Great difficulty
% 95% CI % 95% CI % 95% CI
Clare 60.5 (50.9, 69.3) 27.9 (20.6, 36.7) 11.6 (6.9,18.8)
Cork County 44.5 (35.3, 54.0) 25.1 (18.4, 33.3) 30.4 (22.7,39.4)
Cork City 55.9 (47.8, 63.6) 33.2 (27.0, 40.2) 10.9 (7.5, 15.6)
Cavan 47.7 (37.8, 57.8) 30.8 (23.9, 38.5) 21.5 (14.4,30.9)
Dublin City 72.6 (64.8, 79.2) 19.7 (14.5, 26.2) 7.7 (4.9, 11.9)
Dublin Fingal 75.4 (67.1, 82.2) 17.3 (12.2,24.0) 7.2 (4.1, 12.6)
Dun Laoghaire-Rathdown 45.0 (36.0, 54.3) 36.9 (29.5,45.0) 18.1 (12.2,26.1)
South Dublin 73.5 (63.0, 81.8) 19.4 (12.9, 28.1) 7.1 (3.6, 13.6)
Galway Co. 46.5 (37.1, 56.2) 29.1 (23.0,36.1) 24.4 (17.4,33.1)
Galway City 61.2 (51.4, 70.2) 25.9 (19.4,33.8) 12.8 (7.9, 20.1)
Kildare 53.3 (44.5, 62.0) 28.1 (21.3,36.2) 18.5 (13.0,25.7)
Kilkenny 52.8 (44.2, 61.2) 29.5 (22.2,38.2) 17.7 (12.6,24.3)
Laois 53.2 (45.1,61.1) 28.7 (22.1, 36.5) 18.1 (12.7,25.1)
Limerick City 60.0 (52.2,67.3) 34.6 (28.0, 41.9) 5.4 (3.3,8.7)
Limerick Co. 33.7 (24.7, 43.9) 29.5 (22.9,37.1) 36.9 (27.6,47.1)
Louth 71.3 (63.4, 78.2) 24.5 (18.1,32.2) 4.2 (2.3,7.5)
Meath 65.8 (56.2,74.3) 23.6 (17.3,31.4) 10.5 (6.4,16.8)
Mayo 77.5 (68.4,84.6) 16.2 (11.2, 22.8) 6.3 (3.3, 12.0)
Tipperary 63.1 (53.4, 71.8) 25.5 (19.5,32.7) 11.4 (6.9, 18.2)
Wicklow 64.5 (54.1, 73.7) 20.3 (14.3,28.0) 15.2 (8.8, 25.0)
Wexford 54.8 (46.3, 63.0) 23.5 (17.9,30.1) 21.7 (15.3,29.8)
Total 59.4 (57.0, 61.8) 25.1 (23.4,26.9) 15.4 (13.8,17.2)

107 POSITIVE AGEING LOCAL INDICATORS / SECURITY
TABLE 41 DIFFICULTY ACCESSING SOCIAL SERVICES BY LOCAL AUTHORITY AREA
Social Services
% 95% CI % 95% CI % 95% CI
Clare 67.2 (57.0,76.0) 26.8 (18.5, 37.0) 6.0 (3.6, 9.9)
Cork County 60.8 (52.5,68.6) 25.1 (19.3, 31.8) 14.1 (9.6, 20.3)
Cork City 62.8 (54.3,70.6) 26.7 (21.1, 33.1) 10.5 (7.1, 15.3)
Cavan 72.7 (64.6, 79.5) 19.3 (14.0, 26.0) 8.0 (4.8, 13.3)
Dublin City 76.4 (69.5, 82.2) 17.5 (12.8, 23.5) 6.0 (3.8, 9.5)
Dublin Fingal 82.2 (75.1, 87.7) 13.2 (9.0, 19.1) 4.5 (2.3, 8.5)
Dun Laoghaire Rathdown 53.5 (44.4, 62.3) 30.4 (23.8, 37.9) 16.1 (10.7, 23.5)
South Dublin 74.2 (65.6, 81.3) 18.7 (13.2, 25.9) 7.1 (4.1, 11.9)
Galway County 66.1 (57.4, 73.8) 22.1 (17.0, 28.3) 11.8 (7.0, 19.3)
Galway City 68.2 (59.3, 76.0) 25.8 (19.0,34.0) 6.0 (3.2, 10.9)
Kildare 58.2 (48.7,67.2) 30.4 (23.0, 39.0) 11.3 (7.3, 17.2)
Kilkenny 77.5 (68.7, 84.5) 17.5 (11.2, 26.2) 5.0 (2.8, 8.9)
Laois 78.3 (70.8, 84.2) 14.5 (9.9, 20.7) 7.2 (4.0, 12.7)
Limerick City 68.6 (61.4, 75.0) 29.1 (22.7, 36.4) 2.3 (1.2, 4.4)
Limerick County 53.6 (43.0, 63.9) 27.5 (20.6, 35.6) 18.9 (12.3, 27.8)
Louth 81.1 (73.9, 86.7) 14.4 (9.5, 21.1) 4.5 (2.2, 9.1)
Meath 70.5 (62.1, 77.6) 19.8 (14.4, 26.6) 9.7 (5.6, 16.3)
Mayo 84.4 (77.3, 89.5) 11.6 (8.0, 16.7) 4.0 (1.7, 9.0)
Tipperary 72.3 (62.9, 80.1) 20.6 (14.4, 28.6) 7.1 (3.7, 13.4)
Wicklow 65.7 (57.0, 73.5) 21.0 (14.8, 28.9) 13.3 (8.7, 19.9)
Wexford 68.2 (60.0, 75.5) 16.2 (11.5, 22.4) 15.6 (10.7, 22.3)
Total 69.2 (67.1, 71.2) 21.3 (19.7, 22.9) 9.5 (8.4, 10.8)

108
Tables 42-51 below present the full breakdown by service, including the percentage who reported that these services were not available to them. In general, only a small percentage of respondents reported that services were not available. However there were some exceptions. The full results for difficulty accessing local health service were presented in the previous section (Health) on page 81. Public transport, the Gardai, and full banking services were most frequently reported as being unavailable in the local area.
TABLE 42 ACCESS TO POSTAL SERVICES, BY LOCAL AUTHORITY AREA
Access to Postal Services
Difficult Easy Unavailable
% 95% CI % 95% CI % 95% CI
Clare 11.6 (7.6,17.4) 85.4 (78.1,90.5) 3.0 (0.9,10.0)
Cork County 22.2 (17.5,27.8) 72.7 (65.5,78.8) 5.1 (1.8,13.9)
Cork City 21.7 (15.9,28.9) 78.0 (70.7,83.9) 0.3 (0.0,2.1)
Cavan 17.0 (11.3,24.8) 72.5 (62.1,80.9) 10.5 (5.2,20.2)
Dublin City 7.2 (5.0,10.3) 92.5 (89.1,94.9) <1
Dublin Fingal 6.0 (3.6,9.8) 94.0 (90.2,96.4) 0.0
Dun Laoghaire- Rathdown 19.8 (13.5,28.2) 80.2 (71.8,86.5) 0.0
South Dublin 6.8 (3.9,11.7) 93.2 (88.3,96.1) 0.0
Galway Co. 22.5 (17.3,28.7) 76.5 (69.9,82.0) 1.0 (0.3,2.8)
Galway City 14.0 (9.9,19.5) 85.2 (79.1,89.8) <1
Kildare 15.7 (10.0,23.8) 83.6 (75.5,89.4) <1
Kilkenny 16.3 (11.9,21.9) 79.0 (71.0,85.3) 4.7 (2.2,9.8)
Laois 10.7 (7.5,15.1) 89.3 (84.9,92.5) 0.0
Limerick City 12.1 (8.1,17.8) 87.9 (82.2,91.9) 0.0
Limerick Co. 15.1 (10.9,20.6) 77.1 (68.6,83.9) 7.7 (3.3,17.3)
Louth 10.0 (6.4,15.1) 86.8 (78.0,92.4) 3.2 (0.8,12.1)
Meath 9.1 (6.3,13.1) 90.3 (86.3,93.2) <1
Mayo 11.9 (7.6,18.1) 72.1 (61.3,80.8) 16.0 (8.6,27.8)
Tipperary 12.9 (9.0,18.1) 82.8 (75.9,88.0) 4.3 (1.4,12.6)
Wicklow 14.3 (9.4,21.2) 67.4 (56.4,76.7) 18.3 (10.3,30.6)
Wexford 15.1 (11.2,20.0) 62.3 (52.5,71.2) 22.6 (14.4,33.8)
Total 13.9 (12.7,15.2) 81.8 (80.1,83.4) 4.3 (3.3,5.6)

109 POSITIVE AGEING LOCAL INDICATORS / SECURITY
TABLE 43 ACCESS TO BANKING SERVICES, BY LOCAL AUTHORITY AREA
Access to Banking Services
Difficult Easy Unavailable
% 95% CI % 95% CI % 95% CI
Clare 24.2 (16.1,34.8) 64.9 (53.8,74.5) 10.9 (5.3,20.9)
Cork County 26.2 (19.5,34.1) 47.8 (37.7,58.0) 26.1 (16.0,39.4)
Cork City 31.9 (24.9,39.7) 67.0 (59.0,74.0) 1.2 (0.4,3.0)
Cavan 27.7 (19.3,38.0) 53.4 (42.0,64.5) 18.8 (10.9,30.5)
Dublin City 18.2 (12.6,25.7) 76.8 (68.9,83.1) 5.0 (2.3,10.6)
Dublin Fingal 12.9 (8.1,19.9) 85.3 (77.6,90.7) 1.7 (0.5,6.2)
Dun Laoghaire- Rathdown 29.8 (22.2,38.7) 69.0 (60.1,76.7) 1.3 (0.4,4.1)
South Dublin 18.5 (11.7,27.8) 81.3 (71.8,88.1) <1
Galway Co. 37.8 (29.3,47.2) 50.2 (40.5,59.9) 12.0 (6.5,21.0)
Galway City 22.4 (15.9,30.6) 76.4 (67.8,83.3) 1.2 (0.2,6.3)
Kildare 26.4 (19.3,35.0) 67.7 (58.8,75.5) 5.9 (2.6,13.0)
Kilkenny 21.6 (15.7,28.9) 60.5 (50.1,70.1) 17.9 (9.9,30.2)
Laois 15.6 (10.9,21.7) 81.7 (74.2,87.4) 2.8 (0.8,9.6)
Limerick City 13.3 (8.9,19.3) 86.4 (80.3,90.9) <1
Limerick Co. 35.9 (27.3,45.5) 51.7 (41.2,62.1) 12.3 (5.8,24.3)
Louth 13.4 (9.3,18.9) 69.0 (56.9,79.1) 17.6 (9.0,31.4)
Meath 20.8 (14.3,29.2) 64.1 (53.2,73.8) 15.1 (8.0,26.6)
Mayo 14.5 (8.9,22.8) 59.8 (47.1,71.3) 25.7 (15.6,39.3)
Tipperary 18.9 (11.6,29.3) 65.5 (53.6,75.8) 15.6 (8.3,27.3)
Wicklow 16.1 (10.6,23.6) 53.6 (42.3,64.5) 30.3 (19.6,43.7)
Wexford 21.4 (15.7,28.4) 37.6 (28.3,47.9) 41.1 (29.3,53.9)
Total 22.5 (20.7,24.5) 64.5 (62.0,67.0) 13.0 (11.0,15.3)

110
TABLE 44 ACCESS TO PUBLIC TRANSPORT, BY LOCAL AUTHORITY AREA
Access to Public Transport
Difficult Easy Unavailable
% 95% CI % 95% CI % 95% CI
Clare 20.6 (15.0,27.6) 71.9 (62.4,79.8) 7.5 (2.6,19.6)
Cork County 28.2 (21.1,36.5) 37.4 (28.2,47.5) 34.5 (24.1,46.6)
Cork City 19.8 (14.6,26.1) 79.8 (73.4,85.0) <1
Cavan 24.4 (16.3,34.9) 54.8 (42.4,66.6) 20.8 (12.1,33.4)
Dublin City 6.0 (3.8,9.5) 94.0 (90.5,96.2) 0.0
Dublin Fingal 8.3 (5.3,13.0) 91.7 (87.0,94.7) 0.0
Dun Laoghaire- Rathdown 20.0 (14.9,26.4) 80.0 (73.6,85.1) 0.0
South Dublin 6.3 (3.7,10.7) 93.7 (89.3,96.3) 0.0
Galway Co. 36.2 (27.6,45.7) 49.9 (39.1,60.7) 14.0 (8.2,22.7)
Galway City 13.4 (8.5,20.5) 85.3 (77.2,90.8) 1.3 (0.3,6.3)
Kildare 20.8 (14.9,28.2) 75.8 (66.9,82.9) 3.4 (0.6,16.5)
Kilkenny 11.8 (7.3,18.5) 42.9 (31.5,55.2) 45.3 (33.2,58.0)
Laois 29.5 (22.4,37.7) 60.2 (50.4,69.2) 10.4 (4.2,23.5)
Limerick City 15.1 (10.6,21.0) 84.5 (78.4,89.1) <1
Limerick Co. 22.1 (16.1,29.5) 40.6 (30.9,51.0) 37.4 (26.2,50.0)
Louth 8.0 (5.4,11.7) 88.0 (81.0,92.7) 4.0 (1.2,12.1)
Meath 21.2 (14.9,29.2) 70.2 (59.9,78.8) 8.6 (3.1,21.9)
Mayo 18.5 (11.8,27.9) 49.4 (36.8,62.0) 32.1 (21.4,45.0)
Tipperary 24.0 (17.3,32.3) 73.3 (64.2,80.8) 2.7 (0.5,12.1)
Wicklow 21.2 (13.6,31.4) 51.3 (40.6,61.9) 27.5 (18.0,39.6)
Wexford 24.5 (18.9,31.1) 41.1 (31.2,51.7) 34.4 (25.8,44.2)
Total 18.1 (16.5,19.8) 69.4 (66.8,71.9) 12.5 (10.6,14.8)

111 POSITIVE AGEING LOCAL INDICATORS / SECURITY
TABLE 45 ACCESS TO SHOPS OR SUPERMARKETS, BY LOCAL AUTHORITY AREA
Access to Shops or Supermarkets
Difficult Easy Unavailable
% 95% CI % 95% CI % 95% CI
Clare 7.9 (5.2,11.8) 91.2 (86.9,94.2) 0.9 (0.2,4.6)
Cork County 18.5 (14.5,23.4) 80.2 (74.8,84.7) 1.3 (0.4,4.5)
Cork City 21.0 (15.8,27.5) 78.6 (72.2,84.0) <1
Cavan 11.5 (7.0,18.2) 77.0 (66.6,84.9) 11.5 (5.7,21.8)
Dublin City 9.1 (6.1,13.2) 90.9 (86.7,93.9) <1
Dublin Fingal 5.8 (3.6,9.2) 93.8 (89.6,96.3) <1
Dun Laoghaire- Rathdown 14.6 (10.3,20.2) 85.4 (79.8,89.7) 0.0
South Dublin 7.0 (3.7,12.9) 93.0 (87.1,96.3) 0.0
Galway Co. 21.9 (16.2,28.9) 76.9 (69.2,83.2) 1.2 (0.4,3.7)
Galway City 10.8 (6.9,16.7) 88.2 (81.2,92.8) 1.0 (0.1,6.6)
Kildare 15.5 (10.2,22.7) 83.6 (76.0,89.1) 1.0 (0.3,2.9)
Kilkenny 12.9 (8.8,18.5) 76.1 (67.2,83.2) 11.1 (6.2,19.0)
Laois 13.7 (9.4,19.7) 86.1 (80.2,90.5) 0.1 (0.0,0.9)
Limerick City 12.7 (7.9,19.7) 87.0 (79.7,92.0) 0.3 (0.0,2.0)
Limerick Co. 14.1 (10.4,18.7) 79.1 (70.5,85.7) 6.8 (2.3,18.3)
Louth 9.8 (6.2,15.1) 87.3 (79.1,92.5) 3.0 (0.8,10.5)
Meath 12.5 (8.4,18.3) 86.5 (80.8,90.7) 1.0 (0.2,4.2)
Mayo 12.1 (8.1,17.9) 72.0 (61.1,80.8) 15.8 (8.4,27.8)
Tipperary 15.0 (10.7,20.7) 81.9 (75.0,87.2) 3.1 (0.7,12.3)
Wicklow 18.0 (12.6,25.1) 65.7 (55.9,74.4) 16.3 (9.1,27.4)
Wexford 16.6 (11.2,24.0) 66.3 (57.0,74.5) 17.0 (10.7,26.1)
Total 13.4 (12.3,14.7) 82.9 (81.4,84.4) 3.6 (2.8,4.7)

112
TABLE 46 ACCESS TO GARDAI OR GARDA STATION, BY LOCAL AUTHORITY AREA
Access to Gardaí
Difficult Easy Unavailable
% 95% CI % 95% CI % 95% CI
Clare 23.4 (14.9,34.6) 66.5 (54.5,76.8) 10.1 (4.5,21.0)
Cork County 42.3 (32.2,53.0) 40.7 (30.9,51.2) 17.1 (9.3,29.3)
Cork City 30.3 (23.3,38.2) 69.1 (61.1,76.1) <1
Cavan 30.2 (21.0,41.3) 54.4 (42.6,65.7) 15.4 (8.3,26.8)
Dublin City 15.4 (10.7,21.8) 83.0 (76.1,88.2) 1.6 (0.3,7.6)
Dublin Fingal 19.1 (13.1,26.9) 79.0 (70.6,85.4) 2.0 (0.8,4.9)
Dun Laoghaire- Rathdown 37.8 (29.3,47.0) 57.4 (47.4,66.8) 4.9 (1.9,12.1)
South Dublin 13.4 (7.7,22.4) 86.2 (77.2,92.0) 0.3 (0.1,1.6)
Galway Co. 34.3 (24.8,45.2) 43.1 (32.1,54.9) 22.6 (13.6,35.2)
Galway City 32.2 (22.9,43.1) 64.2 (52.7,74.2) 3.6 (1.4,9.2)
Kildare 32.7 (24.4,42.3) 62.2 (51.8,71.6) 5.1 (1.8,13.4)
Kilkenny 33.0 (23.4,44.3) 41.4 (30.9,52.8) 25.6 (15.8,38.6)
Laois 43.9 (34.4,53.9) 50.1 (39.8,60.4) 6.0 (1.8,17.8)
Limerick City 22.6 (15.8,31.1) 73.2 (64.7,80.3) 4.2 (1.6,10.8)
Limerick Co. 50.2 (39.7,60.7) 34.5 (24.8,45.7) 15.3 (8.3,26.3)
Louth 22.0 (15.3,30.5) 66.0 (53.8,76.4) 12.0 (5.4,24.7)
Meath 19.1 (13.0,27.1) 66.7 (55.9,75.9) 14.2 (7.4,25.7)
Mayo 8.6 (4.6,15.3) 49.8 (36.8,62.9) 41.6 (29.5,54.8)
Tipperary 21.5 (13.9,31.7) 72.9 (61.6,81.8) 5.6 (2.0,14.6)
Wicklow 24.9 (16.5,35.6) 56.1 (44.5,67.1) 19.0 (10.8,31.3)
Wexford 25.0 (17.6,34.2) 38.2 (28.3,49.1) 36.8 (25.5,49.9)
Total 26.8 (24.6,29.2) 61.1 (58.4,63.8) 12.0 (10.2,14.2)

113 POSITIVE AGEING LOCAL INDICATORS / SECURITY
TABLE 47 ACCESS TO CINEMA OR OTHER ENTERTAINMENT, BY LOCAL AUTHORITY AREA
Access to cinema or other entertainment
Difficult Easy Unavailable
% 95% CI % 95% CI % 95% CI
Clare 20.4 (12.3,31.8) 28.9 (19.3,40.9) 50.7 (36.7,64.6)
Cork County 28.3 (19.9,38.6) 29.9 (21.0,40.5) 41.8 (29.7,55.1)
Cork City 28.3 (21.6,36.1) 63.7 (54.1,72.4) 8.0 (4.4,14.1)
Cavan 15.1 (8.5,25.3) 20.5 (13.4,29.9) 64.5 (51.7,75.4)
Dublin City 17.1 (12.0,23.8) 78.1 (70.3,84.3) 4.8 (2.6,8.4)
Dublin Fingal 11.5 (7.6,17.1) 86.2 (79.4,91.1) 2.2 (0.6,7.4)
Dun Laoghaire-Rathdown 33.5 (25.5,42.5) 64.5 (55.4,72.7) 2.0 (0.8,4.9)
South Dublin 16.9 (11.2,24.7) 81.9 (73.6,88.0) 1.2 (0.3,4.1)
Galway Co. 25.1 (16.3,36.6) 26.9 (18.1,37.9) 48.0 (36.3,60.0)
Galway City 20.9 (14.6,28.8) 76.0 (67.7,82.7) 3.1 (1.3,7.2)
Kildare 28.5 (21.7,36.5) 43.7 (34.6,53.2) 27.8 (18.9,38.8)
Kilkenny 13.5 (7.2,24.0) 30.7 (20.7,42.8) 55.8 (41.9,68.8)
Laois 17.0 (10.5,26.4) 28.8 (19.2,40.7) 54.2 (39.7,68.0)
Limerick City 15.2 (9.6,23.3) 80.9 (72.8,87.0) 3.9 (2.0,7.4)
Limerick Co. 32.3 (22.3,44.2) 33.5 (23.4,45.5) 34.2 (22.2,48.5)
Louth 8.5 (5.1,13.6) 67.5 (54.2,78.5) 24.0 (13.5,39.1)
Meath 25.5 (18.5,34.1) 51.2 (40.4,62.0) 23.2 (14.0,36.0)
Mayo 10.7 (6.5,17.2) 48.0 (35.7,60.5) 41.3 (28.5,55.5)
Tipperary 14.2 (7.8,24.5) 48.3 (35.1,61.8) 37.4 (24.9,51.9)
Wicklow 18.8 (12.8,26.7) 27.3 (19.4,36.9) 53.9 (41.0,66.3)
Wexford 20.0 (13.6,28.4) 34.8 (25.0,46.0) 45.2 (33.1,57.9)
Total 21.0 (19.0,23.0) 52.9 (50.0,55.8) 26.1 (23.4,29.0)

114
TABLE 48 ACCESS TO RECREATIONAL PARK OR GREEN AREA, BY LOCAL AUTHORITY AREA
Access to recreational park or green area
Difficult Easy Unavailable
% 95% CI % 95% CI % 95% CI
Clare 13.9 (9.9,19.2) 75.3 (65.8,82.9) 10.7 (5.0,21.4)
Cork County 15.4 (11.7,20.1) 58.5 (50.5,66.1) 26.1 (18.3,35.6)
Cork City 21.2 (15.4,28.4) 75.9 (68.4,82.1) 2.9 (1.1,7.5)
Cavan 10.1 (5.5,17.8) 74.1 (63.1,82.7) 15.9 (8.8,26.9)
Dublin City 6.0 (3.9,9.1) 92.5 (88.8,95.1) 1.5 (0.5,4.2)
Dublin Fingal 8.3 (4.9,13.6) 91.2 (85.3,94.9) <1
Dun Laoghaire-Rathdown 19.1 (12.7,27.7) 80.9 (72.3,87.3) 0.0
South Dublin 5.6 (3.4,9.1) 94.4 (90.9,96.6) 0.0
Galway Co. 8.2 (4.9,13.3) 76.1 (65.4,84.3) 15.7 (8.9,26.2)
Galway City 6.9 (4.4,10.8) 91.5 (86.9,94.6) 1.5 (0.6,4.2)
Kildare 21.0 (14.9,28.7) 74.4 (66.1,81.3) 4.6 (2.1,9.6)
Kilkenny 10.0 (6.3,15.5) 60.2 (49.5,70.1) 29.8 (20.2,41.6)
Laois 18.3 (12.3,26.3) 70.0 (59.2,78.9) 11.7 (5.0,25.1)
Limerick City 12.8 (9.3,17.3) 86.0 (81.4,89.6) 1.2 (0.4,3.1)
Limerick Co. 16.0 (10.6,23.4) 47.8 (37.0,58.8) 36.2 (25.6,48.4)
Louth 6.6 (3.9,11.2) 91.9 (86.9,95.1) 1.5 (0.6,3.7)
Meath 11.2 (7.6,16.2) 83.8 (77.3,88.6) 5.0 (1.9,12.8)
Mayo 5.7 (2.8,11.3) 75.7 (63.4,84.8) 18.6 (10.2,31.4)
Tipperary 11.4 (7.8,16.5) 76.0 (65.8,83.8) 12.6 (6.2,23.9)
Wicklow 14.8 (9.7,21.9) 53.2 (42.9,63.3) 31.9 (21.9,43.9)
Wexford 20.7 (14.3,29.1) 42.4 (33.6,51.7) 36.9 (27.0,48.0)
Total 12.2 (11.0,13.5) 75.8 (73.6,77.8) 12.0 (10.3,13.9)

115 POSITIVE AGEING LOCAL INDICATORS / SECURITY
TABLE 49 ACCESS TO COMMUNITY CENTRE/VENUE FOR MEETING FRIENDS, BY LOCAL AUTHORITY AREA
Access to community centre or other venue where you can meet friends
Difficult Easy Unavailable
% 95% CI % 95% CI % 95% CI
Clare 11.4 (7.2,17.7) 80.5 (72.2,86.7) 8.1 (3.8,16.4)
Cork County 14.9 (11.1,19.7) 79.5 (74.2,84.0) 5.5 (2.9,10.2)
Cork City 21.7 (16.0,28.7) 78.3 (71.3,84.0) 0.0
Cavan 8.4 (4.8,14.5) 73.8 (61.4,83.3) 17.8 (10.1,29.5)
Dublin City 6.7 (4.4,10.0) 89.0 (84.2,92.5) 4.3 (2.3,7.9)
Dublin Fingal 6.4 (3.9,10.4) 93.1 (88.3,96.0) <1
Dun Laoghaire-Rathdown 21.3 (14.6,29.9) 77.9 (69.4,84.6) <1
South Dublin 5.8 (3.1,10.5) 93.7 (88.6,96.6) <1
Galway Co. 12.4 (7.8,18.9) 80.2 (71.8,86.6) 7.5 (3.9,13.8)
Galway City 13.9 (9.3,20.3) 81.7 (73.7,87.8) 4.3 (1.7,10.6)
Kildare 17.1 (10.5,26.7) 79.8 (70.2,86.9) 3.1 (1.2,8.0)
Kilkenny 10.3 (6.8,15.2) 71.7 (62.3,79.6) 18.0 (11.5,27.0)
Laois 17.6 (11.1,26.8) 78.6 (69.3,85.7) 3.8 (1.4,9.8)
Limerick City 5.8 (3.7,8.9) 73.2 (62.2,82.0) 21.0 (12.4,33.2)
Limerick Co. 13.2 (9.0,18.9) 71.9 (61.4,80.5) 14.9 (7.7,26.7)
Louth 7.5 (4.3,12.7) 86.2 (77.7,91.8) 6.3 (2.4,15.5)
Meath 13.8 (9.6,19.4) 80.8 (74.5,85.9) 5.4 (2.4,11.5)
Mayo 8.8 (5.4,14.0) 70.7 (59.0,80.3) 20.5 (12.3,32.1)
Tipperary 10.5 (7.0,15.5) 81.5 (73.3,87.6) 8.0 (3.6,17.0)
Wicklow 18.1 (12.9,24.8) 51.2 (40.6,61.7) 30.7 (20.6,43.1)
Wexford 14.3 (10.4,19.4) 63.5 (54.6,71.6) 22.2 (15.6,30.4)
Total 12.1 (10.9,13.3) 79.7 (77.9,81.4) 8.2 (7.0,9.6)

116
TABLE 50 ACCESS TO LIBRARIES, BY LOCAL AUTHORITY AREA
Access to Libraries
Difficult Easy Unavailable
% 95% CI % 95% CI % 95% CI
Clare 17.0 (9.6,28.4) 71.0 (58.4,81.1) 11.9 (5.4,24.4)
Cork County 17.5 (11.2,26.3) 49.4 (37.8,61.1) 33.1 (21.2,47.6)
Cork City 26.3 (18.9,35.4) 70.1 (60.8,78.0) 3.6 (1.2,9.9)
Cavan 12.3 (7.1,20.4) 62.7 (48.8,74.8) 25.0 (15.2,38.4)
Dublin City 12.2 (8.1,17.9) 82.8 (75.4,88.4) 5.0 (1.9,12.3)
Dublin Fingal 9.9 (6.2,15.5) 86.9 (79.0,92.1) 3.2 (1.1,9.2)
Dun Laoghaire-Rathdown 28.9 (20.9,38.6) 70.9 (61.3,79.0) <1
South Dublin 12.1 (7.1,19.7) 82.6 (73.0,89.3) 5.3 (2.6,10.4)
Galway Co. 22.8 (14.7,33.6) 47.0 (33.9,60.5) 30.2 (20.3,42.4)
Galway City 30.5 (22.7,39.6) 62.5 (52.1,71.8) 7.0 (3.8,12.6)
Kildare 23.5 (16.4,32.6) 68.2 (57.4,77.3) 8.3 (4.0,16.3)
Kilkenny 7.6 (4.1,13.5) 49.9 (36.2,63.7) 42.5 (28.7,57.5)
Laois 10.8 (5.5,20.0) 75.1 (61.1,85.3) 14.1 (6.3,28.6)
Limerick City 20.4 (14.3,28.2) 75.9 (67.9,82.4) 3.7 (1.9,7.1)
Limerick Co. 16.2 (9.9,25.4) 46.5 (35.0,58.5) 37.2 (24.9,51.5)
Louth 10.8 (6.1,18.3) 71.4 (58.8,81.3) 17.8 (9.2,31.9)
Meath 16.2 (10.5,24.3) 69.4 (57.7,79.0) 14.4 (6.9,27.4)
Mayo 10.0 (5.7,17.1) 49.2 (36.4,62.1) 40.8 (28.3,54.6)
Tipperary 11.2 (6.5,18.8) 67.4 (53.9,78.5) 21.4 (11.9,35.3)
Wicklow 15.5 (10.4,22.6) 49.9 (39.4,60.4) 34.6 (23.4,47.7)
Wexford 20.4 (14.2,28.3) 34.5 (24.9,45.4) 45.2 (33.3,57.7)
Total 16.5 (14.8,18.3) 65.1 (62.2,67.9) 18.4 (16.0,21.2)

117 POSITIVE AGEING LOCAL INDICATORS / SECURITY
TABLE 51 ACCESS TO RESTAURANTS OR CAFÉS, BY LOCAL AUTHORITY AREA
Access to Restaurants or cafés
Difficult Easy Unavailable
% 95% CI % 95% CI % 95% CI
Clare 12.6 (6.6,22.7) 82.3 (71.6,89.6) 5.1 (1.7,14.0)
Cork County 21.2 (16.6,26.8) 63.0 (54.1,71.1) 15.8 (8.6,27.1)
Cork City 27.1 (19.6,36.2) 71.8 (62.7,79.4) 1.1 (0.4,2.9)
Cavan 12.1 (7.7,18.4) 74.8 (64.4,82.9) 13.1 (6.7,24.1)
Dublin City 6.5 (4.0,10.4) 93.1 (89.1,95.8) <1
Dublin Fingal 8.1 (5.0,13.0) 91.3 (86.4,94.6) <1
Dun Laoghaire-Rathdown 18.8 (13.1,26.2) 80.8 (73.1,86.7) <1
South Dublin 11.0 (6.8,17.5) 89.0 (82.5,93.2) 0.0
Galway Co. 20.9 (13.9,30.1) 68.2 (57.7,77.1) 10.9 (5.8,19.6)
Galway City 16.4 (11.1,23.7) 81.4 (73.1,87.5) 2.2 (0.7,6.3)
Kildare 20.3 (13.7,28.9) 76.8 (67.9,83.8) 2.9 (1.1,7.3)
Kilkenny 13.3 (8.8,19.6) 52.7 (41.7,63.5) 33.9 (22.8,47.2)
Laois 11.3 (6.9,18.0) 80.5 (69.6,88.2) 8.1 (2.9,21.0)
Limerick City 10.0 (6.9,14.4) 88.4 (83.5,92.0) 1.5 (0.5,4.5)
Limerick Co. 22.5 (15.1,32.2) 56.8 (45.6,67.4) 20.7 (11.8,33.6)
Louth 8.6 (5.5,13.1) 83.3 (72.1,90.6) 8.1 (3.1,19.7)
Meath 11.0 (7.9,15.2) 87.2 (82.6,90.7) 1.8 (0.6,5.1)
Mayo 12.2 (7.6,19.2) 66.9 (54.7,77.2) 20.9 (11.9,34.1)
Tipperary 13.9 (9.3,20.2) 78.2 (69.0,85.2) 8.0 (3.1,18.8)
Wicklow 15.6 (10.8,22.0) 60.4 (49.4,70.5) 24.0 (14.8,36.5)
Wexford 14.4 (9.7,21.0) 54.8 (44.5,64.7) 30.7 (20.9,42.7)
Total 14.6 (13.3,16.1) 76.1 (74.0,78.2) 9.2 (7.6,11.1)

118
FACTORS ASSOCIATED WITH DIFFICULTY ACCESSING ESSENTIAL AND SOCIAL SERVICES
There are several characteristics that increase the likelihood of experiencing some level of difficulty accessing essential and social services. The full results are presented in Appendix 2 (Table 18).
FIGURE 22 FACTORS ASSOCIATED WITH DIFFICULTIES ACCESSING ESSENTIAL SERVICES
Note: results are based on a mixed-effects regression model and reported as Odds Ratios with 95% Confidence Intervals.

119 POSITIVE AGEING LOCAL INDICATORS / SECURITY
FIGURE 23 FACTORS ASSOCIATED WITH DIFFICULTIES ACCESSING SOCIAL SERVICES
Note: results are based on a mixed-effects regression model and reported as Odds Ratios with 95% Confidence Intervals.

120
Respondents were asked to rate their feeling of safety under in four different circumstances; at home during the day, out and about during the day, at home at night and out and about at night.
They were also asked if they had had an experience that left them concerned about their safety.
KEY FINDINGS
14%
had an experience thatleft them concerned about their personal safety
SAFETY AND PERCEPTION OF SAFETY
15%
13%
24%11%
15%
reported being concerned for their personal safety as the result of a previous experience
70+14%
55-69
More women reported feeling unsafe out and about at night compared to men
23%15%
Respondents aged 70 and over were more likely to feel unsafe out and about at night
70+ 55-69
of women had such an experience
of men had such an experience
age age
age age
SAFETY AND PERCEPTION OF SAFETY5.3

121 POSITIVE AGEING LOCAL INDICATORS / SECURITY
GEOGRAPHICAL DIFFERENCE - EXPERIENCE AND PERCEPTION OF SAFETY
The proportion of people who reported having had an experience that left them concerned about their personal safety varied greatly across the areas surveyed, from 26% in Wexford to 3.8% in Mayo. Reports of feeling less than safe during the day ranged from 6.9% in Laois to 0.5% in Mayo. The highest levels of feeling less than safe out and about during the day were reported in countryside or village areas (2.8%) followed by inner city or suburban areas (2.2%) and towns(2.1%).
TABLE 52 PERCENTAGE WHO FELT LESS THAN SAFE OUT AND ABOUT DURING THE DAY/AT NIGHT, BY LOCAL AUTHORITY AREA
Local Authority Had an experience Unsafe during the
day Unsafe at at night
% 95% CI % 95% CI % 95% CI
Clare 6.2 (4.1, 9.4) 0.8 (0.4,2) 14.0 (9.1,21.1)
Cork County 10.1 (6.7, 15.0) 2.5 (1.4,4.6) 23.5 (18, 30.2)
Cork City 21.3 (16.6, 26.9) 5.2 (2.7, 9.7) 22.9 (15.4, 32.7)
Cavan 11.7 (8.8, 15.41) 4.6 (2.1, 10.2) 14.2 (9.4, 21.0)
Dublin City 15.6 (11.0, 21.6) 2.9 (1.8, 4.8) 20.4 (16,25.6)
Dublin Fingal 14.1 (9.6, 20.2) 2.1 (0.6, 6.6) 10.4 (6.6,16.1)
Dun Laoghaire- Rathdown 19.4 (14.5, 25.3) 0.7 (0.3,2.0) 13.3 (9.4,18.7)
South Dublin 13.4 (8.6, 20.3) 1.6 (0.6,4.2) 9.7 (5.8,15.7)
Galway County 15.9 (11.6, 21.5) 2.6 (1.3, 5.2) 15.4 (10.1,22.6)
Galway City 17.6 (13.0, 23.4) 1.9 (0.8, 4.5) 13.8 (9.3,20.1)
Kildare 14.0 (9.9, 19.4) 4.0 (1.8,8.7) 26.8 (20.5,34.3)
Kilkenny 12.1 (8.9, 16.3) 2.2 (0.9,5.4) 13.0 (9.0,18.3)
Laois 11.4 (8.5, 15.2) 6.9 (4.6,10.4) 39.8 (30.8,49.5)
Limerick City 15.1 (11.5, 19.4) 1.0 (0.5,2.2) 39.8 (32.4, 47.8)
Limerick County 14.7 (11.1, 19.3) 3.7 (1.9,7.1) 19.5 (14.1,26.3)
Louth 16.9 (12.5, 22.5) 1.1 (0.4,3.3) 14.3 (9.5,21.1)
Meath 14.4 (10.6, 19.4) 2.9 (1.4,6.0) 20.9 (14.6,29.0)
Mayo 3.8 (1.6, 8.6) 0.5 (0.1,2.1) 3.2 (1.7,5.8)
Tipperary 8.7 (6.1, 12.3) 1.4 (0.6,3.5) 15.1 (10.1,22)
Wicklow 17.7 (12.8, 24.0) 1.9 (0.6,5.7) 11.0 (6.7,17.5)
Wexford 25.7 (20.9, 31.2) 3.3 (2.0,5.4) 21.4 (16.7,27.0)
Total 14.2 (13.0, 15.4) 2.4 (2,2.9) 17.6 (16.2, 19.1)

122
FACTORS ASSOCIATED WITH PERCEPTION OF SAFETY DURING THE DAY
We examined a number of socio-demographic characteristics to help explain differences in perception of safety ‘out and about’ during the day. The full results are presented in Appendix 2 (Table 19).
FIGURE 24 FACTORS ASSOCIATED WITH FEELING UNSAFE ‘OUT AND ABOUT’ DURING THE DAY
Note: results are based on a mixed-effects regression model and reported as Odds Ratios with 95% Confidence Intervals.

123 POSITIVE AGEING LOCAL INDICATORS / SECURITY
FACTORS ASSOCIATED WITH PERCEPTION OF SAFETY OUT AND ABOUT AT NIGHT
We examined a number of socio-demographic characteristics to help explain differences in perception of safety ‘out and about’ at night. The full results are presented in Appendix 2 (Table 20).
FIGURE 25 FACTORS ASSOCIATED WITH FEELING UNSAFE ‘OUT AND ABOUT’ AT NIGHT
Note: results are based on a mixed-effects regression model and reported as Odds Ratios with 95% Confidence Intervals.

124
URBAN BUILT ENVIRONMENT RATINGS AND FEELING SAFE IN THE COMMUNITY
For respondents living in urban areas we examined the association between levels of satisfaction with the built environment and whether or not respondents felt safe in their community (both out and about and at home). Respondents who were more satisfied with the urban built environment were less likely to report feeling unsafe (Net of other factors that are associated with perceived safety). The full results are presented in Appendix 2 (Table 21).
FIGURE 26 FACTORS ASSOCIATED WITH FEELING UNSAFE IN URBAN ENVIRONMENTS
Note: results are based on a mixed-effects regression model and reported as Odds Ratios with 95% Confidence Intervals. Includes respondents living in urban areas only.

125 POSITIVE AGEING LOCAL INDICATORS / SECURITY
NOTES

126
6AGEISM, RESPECT AND SOCIAL INCLUSION

127 POSITIVE AGEING LOCAL INDICATORS / AGEISM
Cross-cutting objective: Combatting Ageism
NPAS Objective Survey Themes and WHO Age Friendly Programme domains
Promote activities which will help to combat age discrimination and to dispel age related stereotypes.
Combat ageism through awareness campaigns and by encouraging the media and other opinion-making actors to give an age-balanced image of society.
Ensure that older people’s needs are considered in the development of any policies that might affect them.
Promote a better understanding of the importance of intergenerational solidarity and ensure that policy developments enhance solidarity between generations.
Encourage the development of intergenerational initiatives at local, regional and national level.
Create a better awareness of the needs and preferences of people as they age during policy
and service development by adopting more comprehensive and inclusive approaches to consultation.
Respect and Social Inclusion

128
Respondents were asked how often they feel isolated: all the time, some of the time, or rarely/never.
Respondents were also asked a series of questions about their involvement in activities in their local community. One of these questions asked the degree to which they agreed with the statement that People have negative attitudes about older people being involved in the activities I am interested in.
Respondents were asked how many friends, other than members of their family, they had who are younger than 30 years of age.
As part of a battery of questions about how older adults feel about different aspects of their life, respondents were asked how often they feel in tune with the people around them. The response categories were: often, some of the time, and hardly ever or never.
KEY FINDINGSKEY FINDINGS –SOCIAL ISOLATION
FEELING ISOLATED
55+15%
some or all of the time
2.9%
all the time
70+18%
some or all of the time
70+3.5%
all of the time
55+age age
age age
AGEISM, RESPECT AND SOCIAL INCLUSION6.1

129 POSITIVE AGEING LOCAL INDICATORS / AGEISM
There were no significant differences between men or women or between age groups in relation to these questions.
PERCEPTION OF NEGATIVE ATTITUDES TOWARDS OLDER PEOPLE IN THE COMMUNITY
11.1% 8.2%
experience negative attitudes or behaviours towards them as an older person
agreed with the statement “People have negative attitudes about older people being involved in the activities I am interested in”
INTER-GENERATIONAL FRIENDSHIPS
52%
had at least one friend aged less than 30 years
4.0%had only one friend aged less than 30 years
60%
25%
had between two and five
14%
had ten or more friends aged under 30 years of age.
55-6938%
had one or more friends under 30 years
had one or more friends under 30 years
70+age age
FEELING ‘IN TUNE WITH PEOPLE’ SOME OR ALL OF THE TIME
61%
said they often feel in tune with other people around them.
felt in tune with others only some of the time, 17%
hardly ever did22%

130
GEOGRAPHICAL DIFFERENCE - SOCIAL ISOLATION
The percentage of people who feel isolated varied across the different Local Authority areas. A large majority do not feel isolated and the percentage who do not ranged from 68.6% in Laois to 95% in Louth. The percentage who reported feeling isolated at least some of the time ranged from 5.3% in Louth to 31% in Laois.
TABLE 53 PERCENTAGE OF ADULTS AGED 55+ WHO REPORTED BEING ISOLATED OFTEN OR SOME OF THE TIME, BY LOCAL AUTHORITY AREA
Local AuthorityNot isolated Isolated often or some of the time
% 95% CI % 95% CI
Clare 90.4 (86.1, 93.5) 9.6 (6.5, 13.9)
Cork County 81.5 (77.4, 85.1) 18.5 (14.9, 22.6)
Cork City 76.2 (70.1, 81.3) 23.8 (18.7, 29.9)
Cavan 89.3 (84.2, 93.0) 10.7 (7.0, 15.8)
Dublin City 92.9 (89.1, 95.4) 7.1 (4.6, 10.9)
Dublin Fingal 82.7 (74.6, 88.7) 17.3 (11.3, 25.4)
Dun Laoghaire- Rathdown 78.1 (70.6, 84.1) 21.9 (15.9, 29.4)
South Dublin 86.7 (77.3, 92.5) 13.3 (7.5, 22.7)
Galway County 75.0 (67.6, 81.2) 25.0 (18.8, 32.4)
Galway City 79.7 (74.8, 83.8) 20.3 (16.2, 25.2)
Kildare 79.1 (71.6, 85.0) 20.9 (15.0, 28.4)
Kilkenny 89.6 (85.7, 92.6) 10.4 (7.4, 14.3)
Laois 68.6 (62.0, 74.5) 31.4 (25.5, 38.0)
Limerick City 86.3 (81.2, 90.2) 13.7 (9.8, 18.8)
Limerick County 88.9 (85.1, 91.8) 11.1 (8.2, 14.9)
Louth 94.7 (91.0, 96.9) 5.3 (3.1, 9.0)
Meath 83.6 (74.6, 89.8) 16.4 (10.2, 25.4)
Mayo 87.9 (81.4, 92.3) 12.1 (7.7, 18.6)
Tipperary 89.1 (84.5, 92.5) 10.9 (7.5, 15.5)
Wicklow 81.3 (75.6, 85.9) 18.7 (14.1, 24.4)
Wexford 84.2 (79.5, 87.9) 15.8 (12.1, 20.5)
Total 84.7 (83.3, 85.9) 15.3 (14.1, 16.7)

131 POSITIVE AGEING LOCAL INDICATORS / AGEISM
FACTORS ASSOCIATED WITH SOCIAL ISOLATION AMONG ADULTS AGED 55 YEARS AND OLDER
Here we investigated what socio-demographic and other characteristics were associated with feeling social isolated. The full results are presented in Appendix 2 (Table 22).
FIGURE 27 FACTORS ASSOCIATED WITH FEELING SOCIALLY ISOLATED
Note: results are based on a mixed-effects regression model and reported as Odds Ratios with 95% Confidence Intervals.

132
NEGATIVE ATTITUDES TOWARDS OLDER PEOPLE We observed variation between the Local Authority areas in the percentage of adults aged 55 and older who reported experiencing negative attitudes and behaviours from others because of their age. These ranged from 26.0% in Laois to 4.3% in Kilkenny.
GEOGRAPHICAL DIFFERENCE – EXPERIENCE OF NEGATIVE ATTITUDES AND BEHAVIOURS AS AN OLDER PERSON
TABLE 54 PERCENTAGE OF ADULTS AGED 55+ WHO EXPERIENCED NEGATIVE ATTITUDES AND BEHAVIOURS AS AN OLDER PERSON, BY LOCAL AUTHORITY AREA
Local Authority
% 95% CI
Kilkenny 4.3 3.1 9.0
Clare 5.4 5.0 11.4
Mayo 5.7 17.7 32.4
Wicklow 6.1 4.2 9.9
Cavan 6.5 6.1 12.0
South Dublin 7.0 11.1 25.5
Cork County 7.6 10.2 20.5
Louth 8.1 4.6 10.4
Dublin City 8.6 15.2 24.9
Limerick City 9.0 13.8 25.2
Tipperary 9.4 13.1 26.4
Limerick County 9.9 2.5 7.3
Meath 10.3 20.0 33.1
Wexfod 11.5 5.9 13.4
Dun Laoghaire-Rathdown 14.6 6.2 15.5
Dublin Fingal 17.1 5.0 12.8
Galway City 18.8 6.9 15.0
Kildare 18.9 3.5 9.1
Galway County 19.6 6.1 14.2
Cork City 24.3 3.5 10.3
Laois 26.0 8.3 15.8
Total 11.1 10.1 12.2

133 POSITIVE AGEING LOCAL INDICATORS / AGEISM
GEOGRAPHICAL DIFFERENCE – PERCEIVED NEGATIVE ATTITUDE TOWARDS OLDER PEOPLE TAKING PART IN COMMUNITY ACTIVITIES
We observed variation between the Local Authority areas in the percentage of adults aged 55 and older who perceive that other people have negative attitudes towards older people taking part in community activities. These ranged from 20.5% in Kildare to only 1.3% in Mayo and 1.9% in Clare.
TABLE 55 PERCENTAGE OF ADULTS AGED 55+ WHO PERCEIVE NEGATIVE ATTITUDES TOWARDS OLDER PEOPLE TAKING PART IN COMMUNITY ACTIVITIES, BY LOCAL AUTHORITY AREA
Local Authority Disagree Agree
% 95% CI % 95% CI
Clare 98.1 (95.1, 99.3) 1.9 (0.7, 4.9)
Cork County 88.3 (79.2, 93.8) 11.7 (6.2, 20.8)
Cork City 89.3 (81.8, 93.9) 10.7 (6.1, 18.2)
Cavan 91.1 (86.0, 94.5) 8.9 (5.5, 14.0)
Dublin City 94.3 (89.9, 96.9) 5.7 (3.1, 10.1)
Dublin Fingal 81.7 (71.0, 89.0) 18.3 (11.0, 29.0)
Dun Laoghaire-Rathdown 85.4 (76.7, 91.2) 14.6 (8.8, 23.3)
South Dublin 94.6 (90.4, 97.0) 5.4 (3.0, 9.6)
Galway County 92.0 (87.8, 94.9) 8.0 (5.1, 12.2)
Galway City 93.9 (89.5, 96.5) 6.1 (3.5, 10.5)
Kildare 79.5 (68.9, 87.2) 20.5 (12.8, 31.1)
Kilkenny 94.2 (89.7, 96.8) 5.8 (3.2, 10.3)
Laois 82.2 (77.1, 86.4) 17.8 (13.6, 22.9)
Limerick City 94.8 (90.5, 97.2) 5.2 (2.8, 9.5)
Limerick County 89.0 (82.0, 93.5) 11.0 (6.5, 18.0)
Louth 96.8 (90.0, 99.0) 3.2 (1.0, 10.0)
Meath 87.7 (79.5, 92.9) 12.3 (7.1, 20.5)
Mayo 98.7 (96.5, 99.5) 1.3 (0.5, 3.5)
Tipperary 93.2 (88.1, 96.3) 6.8 (3.7, 11.9)
Wicklow 98.0 (93.7, 99.4) 2.0 (0.6, 6.3)
Wexford 94.1 (91.1, 96.2) 5.9 (3.8, 8.9)
Total 91.2 (89.7, 92.5) 8.8 (7.5, 10.3)

134
FACTORS ASSOCIATED WITH PERCEIVING THAT PEOPLE HAVE NEGATIVE ATTITUDES TOWARDS OLDER PEOPLE TAKING PART IN COMMUNITY ACTIVITIES
We examined a number of socio-demographic characteristics to identify those who were most likely to perceive negative attitudes from others towards their involvement in activities in their local community. The results are presented in Appendix 2 (Table 23).
FIGURE 28 FACTORS ASSOCIATED WITH PERCEIVED NEGATIVE ATTITUDES
Note: results are based on a mixed-effects regression model and reported as Odds Ratios with 95% Confidence Intervals.

135 POSITIVE AGEING LOCAL INDICATORS / AGEISM
INTERGENERATIONAL FRIENDSHIPS
GEOGRAPHICAL DIFFERENCE – HAVING A FRIEND UNDER THE AGE OF 30
The percentage who reported having a friend under the age of 30 varied widely between the 21 Local Authority areas. In Laois, 75.2% reported having a younger friend, while in Mayo, only 30.4% did.
TABLE 56 PERCENTAGE OF ADULTS AGED 55+ WHO REPORTED HAVING A FRIEND BELOW THE AGE OF 30, BY LOCAL AUTHORITY AREA
Local AuthorityNone At least one
% 95% CI % 95% CI
Clare 60.1 (51.2, 68.5) 39.9 (31.5, 48.8)
Cork County 57.7 (50.6, 64.5) 42.3 (35.5, 49.4)
Cork City 56.5 (46.9, 65.7) 43.5 (34.3, 53.1)
Cavan 31.5 (23.7, 40.6) 68.5 (59.4, 76.3)
Dublin City 60.8 (52.3, 68.7) 39.2 (31.3, 47.7)
Dublin Fingal 43.7 (34.2, 53.8) 56.3 (46.2, 65.8)
Dun Laoghaire- Rathdown 49.4 (41.1, 57.6) 50.6 (42.4, 58.9)
South Dublin 33.3 (24.9, 42.9) 66.7 (57.1, 75.1)
Galway County 28.4 (21.1, 37.0) 71.6 (63.0, 78.9)
Galway City 46.7 (38.8, 54.8) 53.3 (45.2, 61.2)
Kildare 40.0 (32.1, 48.4) 60.0 (51.6, 67.9)
Kilkenny 36.8 (27.3, 47.5) 63.2 (52.5, 72.7)
Laois 24.8 (15.5, 37.4) 75.2 (62.6, 84.5)
Limerick City 62.1 (53.9, 69.8) 37.9 (30.2, 46.1)
Limerick County 37.9 (31.3, 45.1) 62.1 (54.9, 68.7)
Louth 44.6 (35.4, 54.1) 55.4 (45.9, 64.6)
Meath 46.2 (38.7, 53.8) 53.8 (46.2, 61.3)
Mayo 69.6 (61.4, 76.7) 30.4 (23.3, 38.6)
Tipperary 40.7 (31.3, 50.8) 59.3 (49.2, 68.7)
Wicklow 44.0 (34.9, 53.6) 56.0 (46.4, 65.1)
Wexford 48.2 (40.1, 56.4) 51.8 (43.6, 59.9)
Total 48.1 (45.9, 50.4) 51.9 (49.6, 54.1)
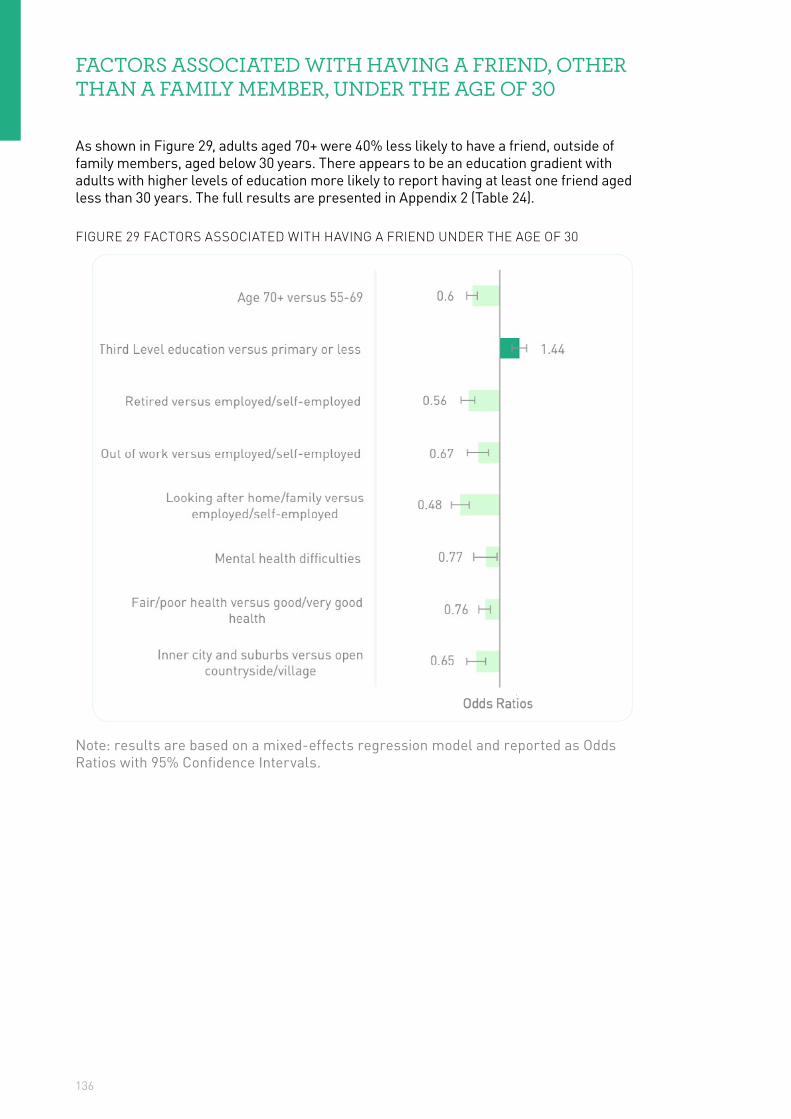
136
FACTORS ASSOCIATED WITH HAVING A FRIEND, OTHER THAN A FAMILY MEMBER, UNDER THE AGE OF 30
As shown in Figure 29, adults aged 70+ were 40% less likely to have a friend, outside of family members, aged below 30 years. There appears to be an education gradient with adults with higher levels of education more likely to report having at least one friend aged less than 30 years. The full results are presented in Appendix 2 (Table 24).
FIGURE 29 FACTORS ASSOCIATED WITH HAVING A FRIEND UNDER THE AGE OF 30
Note: results are based on a mixed-effects regression model and reported as Odds Ratios with 95% Confidence Intervals.

137 POSITIVE AGEING LOCAL INDICATORS / AGEISM
FEELING IN TUNE WITH THE PEOPLE
GEOGRAPHICAL DIFFERENCE – FEELING IN TUNE WITH OTHER PEOPLE
As shown in Table 58 there were some differences in how often adults felt in tune with people around them between the 21 Local Authorities. Adults in Louth (87.2%) were most likely to often feel in tune with those around them, while Cork City (39.3%) and Limerick Co. (41.4%) had the lowest proportion of adults aged 55 and older who said they often felt in tune with others.
TABLE 57 PERCENTAGE WHO FEEL ‘IN TUNE’ WITH THE PEOPLE AROUND THEM BY FREQUENCY AND LOCAL AUTHORITY AREA
Local AuthoritySome of the time or hardly ever Often
% 95% CI % 95% CI
Clare 30.0 (20.8, 41.1) 70.0 (58.9, 79.2)
Cork County 48.7 (39.8, 57.8) 51.3 (42.2, 60.2)
Cork City 60.7 (51.0, 69.6) 39.3 (30.4, 49.0)
Cavan 48.5 (39.7, 57.5) 51.5 (42.5, 60.3)
Dublin City 17.4 (11.1, 26.4) 82.6 (73.6, 88.9)
Dublin Fingal 42.9 (30.9, 55.7) 57.1 (44.3, 69.1)
Dun Laoghaire- Rathdown 40.4 (30.1, 51.6) 59.6 (48.4, 69.9)
South Dublin 42.3 (31.8, 53.5) 57.7 (46.5, 68.2)
Galway County 43.3 (36.2, 50.7) 56.7 (49.3, 63.8)
Galway City 48.5 (40.9, 56.1) 51.5 (43.9, 59.1)
Kildare 43.0 (31.7, 55.0) 57.0 (45.0, 68.3)
Kilkenny 53.7 (42.2, 64.8) 46.3 (35.2, 57.8)
Laois 50.9 (42.4, 59.4) 49.1 (40.6, 57.6)
Limerick City 35.4 (28.3, 43.3) 64.6 (56.7, 71.7)
Limerick County 58.6 (47.7, 68.7) 41.4 (31.3, 52.3)
Louth 12.8 (7.9, 20.2) 87.2 (79.8, 92.1)
Meath 30.3 (20.4, 42.4) 69.7 (57.6, 79.6)
Mayo 31.5 (24.0, 40.1) 68.5 (59.9, 76.0)
Tipperary 50.5 (40.2, 60.7) 49.5 (39.3, 59.8)
Wicklow 25.5 (17.8, 35.1) 74.5 (64.9, 82.2)
Wexford 33.1 (25.1, 42.3) 66.9 (57.7, 74.9)
Total 38.7 (36.2, 41.3) 61.3 (58.7, 63.8)

138
FACTORS ASSOCIATED WITH FEELING IN TUNE WITH OTHER PEOPLE
We examined a number of socio-demographic characteristics to identify factors that might help explain the differences between those who feel in tune with others more often than not, compared to those who do so only sometimes or hardly ever. The full results are presented in Appendix 2 (Table 25).
FIGURE 30 FACTORS ASSOCIATED WITH FEELING IN TUNE WITH OTHER PEOPLE
Note: results are based on a mixed-effects regression model and reported as Odds Ratios with 95% Confidence Intervals.

139 POSITIVE AGEING LOCAL INDICATORS / AGEISM
NOTES

140
7COMMUNICATION & INFORMATION

141 POSITIVE AGEING LOCAL INDICATORS / COMMUNICATION AND INFORMATION
NPAS Cross-cutting objective: Improving Information Provision
NPAS Cross-Cutting Objective Survey Themes and WHO Age Friendly Programme domains
Ensure that older people can exercise choice and control over their own lives by being able to access user-friendly, up-to-date, comprehensive and coordinated information and advice in relation to entitlements, services, support and activities.
Promote the development of advocacy services to assist older people to access the services, supports and activities that they may require.
Communication and Information

142
Respondents were asked how often they used the internet in the last three months.
Respondents were also asked if they had access to a household internet connection and if not, was this because of cost or for a different reason.
Respondents were also asked if they have difficulty accessing information on local events or activities, and information on health or social services.
KEY FINDINGS
INTERNET USAGE
DAILY
AGE 55+ USE THE INTERNET
WEEKLY MONTHLY DID NOT USE
61%
38% 17%6.8%
39%
74% 39%
55–69 70+
63% 59%
within the last three months
age age
INTERNET ACCESS
CAN’T AFFORD ONENO (OTHER REASON)
3.6%
68%28%
A HOUSEHOLDINTERNET CONNECTION
HAD ONE

143 POSITIVE AGEING LOCAL INDICATORS / COMMUNICATION AND INFORMATION
HAVE A HOUSEHOLD INTERNET CONNECTION
79% 51%
55–69 70+
70% 67%
age age
DIFFICULTY ACCESSING INFORMATION ABOUT LOCAL ACTIVITIES AND EVENTS
DIFFICULTY ACCESSING INFORMATION ABOUT HEALTH OR SOCIAL SERVICES
difficulty accessing information on local events and activities
difficulty accessing information on local health or social services
6.7% 7.4%
55–69 70+
7.7%6.2%
10% 12%
55–69 70+
11%
7.0%
age age
age age

144
GEOGRAPHICAL DIFFERENCE IN INTERNET USE
The percentage of older adults who used the internet ranges from 45% in Cavan to 79% in Dun Laoghaire-Rathdown. Cavan has the highest proportion of older adults (55%) who did not use the internet within the last three months.
TABLE 58 INTERNET USE AMONG ADULTS AGED 55+ BY LOCAL AUTHORITY AREA
Local AuthorityYes No
% 95% CI % 95% CI
Clare 49.8 (42.8, 56.7) 50.2 (43.3, 57.2)
Cork County 53.9 (47.2, 60.5) 46.1 (39.5, 52.8)
Cork City 59.2 (52.1, 65.9) 40.8 (34.1, 47.9)
Cavan 44.6 (37.3, 52.1) 55.4 (47.9, 62.7)
Dublin City 64.8 (57.2, 71.7) 35.2 (28.3, 42.8)
Dublin Fingal 72.1 (66.1, 77.4) 27.9 (22.6, 33.9)
Dun Laoghaire- Rathdown 79.1 (72.9, 84.2) 20.9 (15.8, 27.1)
South Dublin 77.5 (65.9, 86.0) 22.5 (14.0, 34.1)
Galway County 52.3 (45.0, 59.5) 47.7 (40.5, 55.0)
Galway City 60.8 (52.8, 68.4) 39.2 (31.6, 47.2)
Kildare 70.8 (63.0, 77.5) 29.2 (22.5, 37.0)
Kilkenny 60.0 (53.3, 66.4) 40.0 (33.6, 46.7)
Laois 51.3 (44.7, 57.8) 48.7 (42.2, 55.3)
Limerick City 46.1 (39.0, 53.4) 53.9 (46.6, 61.0)
Limerick County 58.4 (52.1, 64.4) 41.6 (35.6, 47.9)
Louth 56.3 (48.9, 63.5) 43.7 (36.5, 51.1)
Meath 69.6 (60.5, 77.3) 30.4 (22.7, 39.5)
Mayo 47.1 (40.4, 53.9) 52.9 (46.1, 59.6)
Tipperary 54.3 (47.4, 61.1) 45.7 (38.9, 52.6)
Wicklow 62.6 (53.2, 71.2) 37.4 (28.8, 46.8)
Wexford 52.6 (45.8, 59.3) 47.4 (40.7, 54.2)
Total 60.9 (59.0, 62.8) 39.1 (37.2, 41.0)

145 POSITIVE AGEING LOCAL INDICATORS / COMMUNICATION AND INFORMATION
FACTORS ASSOCIATED WITH INTERNET USE
There are several personal demographic and socio-economic characteristics that increase the likelihood that a person used the internet. The full results are presented in Appendix 2 (Table 26).
FIGURE 31 FACTORS ASSOCIATED WITH INTERNET USE
Note: results are based on a mixed-effects regression model and reported as Odds Ratios with 95% Confidence Intervals.

146
HOUSEHOLD INTERNET CONNECTIONSTable 60 shows the percentage of adults aged 55 years and older within each Local Authority area who have/do not have a household internet connection. The percentage of older adults who have access to a household internet connection ranges from 50.0% to 86.5% with Wicklow having the highest proportion at 86.5%. Laois has the highest proportion of older adults (50.0%) who do not have a household internet connection.
TABLE 59 HOUSEHOLD INTERNET CONNECTIONS BY LOCAL AUTHORITY AREAS
Local Authority Yes No
% 95% CI % 95% CI
Clare 53.7 (46.6, 60.7) 46.3 (39.3, 53.4)Cork County 57.4 (51.0, 63.7) 42.6 (36.3, 49.0)Cork City 65.7 (59.6, 71.3) 34.3 (28.7, 40.4)Cavan 54.4 (46.7, 61.9) 45.6 (38.1, 53.3)Dublin City 70.9 (64.2, 76.7) 29.1 (23.3, 35.8)Dublin Fingal 79.3 (73.6, 84.1) 20.7 (15.9, 26.4)Dun Laoghaire- Rathdown 82.8 (77.2, 87.2) 17.2 (12.8, 22.8)
South Dublin 86.1 (76.2, 92.3) 13.9 (7.7, 23.8)Galway County 57.5 (50.0, 64.7) 42.5 (35.3, 50.0)Galway City 72.1 (65.5, 77.8) 27.9 (22.2, 34.5)Kildare 72.1 (65.1, 78.1) 27.9 (21.9, 34.9)Kilkenny 69.8 (62.5, 76.2) 30.2 (23.8, 37.5)Laois 50.0 (43.7, 56.3) 50.0 (43.7, 56.3)Limerick City 53.7 (47.4, 59.9) 46.3 (40.1, 52.6)Limerick County 62.5 (56.3, 68.3) 37.5 (31.7, 43.7)Louth 70.8 (63.9, 76.9) 29.2 (23.1, 36.1)Meath 78.6 (69.9, 85.3) 21.4 (14.7, 30.1)Mayo 57.8 (51.5, 63.9) 42.2 (36.1, 48.5)Tipperary 64.3 (56.5, 71.3) 35.7 (28.7, 43.5)Wicklow 86.5 (79.4, 91.5) 13.5 (8.5, 20.6)Wexford 58.5 (50.3, 66.2) 41.5 (33.8, 49.7)Total 68.2 (66.4, 69.9) 31.8 (30.1, 33.6)

147 POSITIVE AGEING LOCAL INDICATORS / COMMUNICATION AND INFORMATION
DIFFICULTY ACCESSING INFORMATION ON HEALTH OR SOCIAL SERVICES IN EACH LOCAL AUTHORITY AREA
Table 61 shows the percentage of adults aged 55 years and older within each Local Authority area who experience difficulty accessing information on 1) local activities and events and 2) health or social services. The percentage of older adults who experience difficulty accessing information on local activities and events ranges from 1.3% to 17.0% with Kildare having the highest proportion at 17.0%. Kilkenny has the highest proportion of older adults (98.7%) who do not experience difficulty accessing information on local activities and events. The percentage of older adults who experience difficulty accessing information on health or social services ranges from 2.7% to 29.7% with Laois having the highest proportion at 29.7%. South Dublin has the highest proportion of older adults (97.3%) who do not experience difficulty accessing information on health or social services.
TABLE 60 LEVEL OF DIFFICULTY ACCESSING INFORMATION ON LOCAL ACTIVITIES AND EVENTS, BY LOCAL AUTHORITY AREA
Local AuthorityLocal activities and events Health or social services
% 95% CI % 95% CI
Clare 2.8 (1.5, 5.4) 8.7 (5.0, 14.6)
Cork County 5.2 (3.7, 7.3) 10.3 (7.3, 14.3)
Cork City 11.8 (8.1, 17.0) 12.4 (8.6, 17.4)
Cavan 10.1 (5.9, 16.8) 10.1 (6.0, 16.5)
Dublin City 8.3 (5.0, 13.5) 8.1 (5.0, 13.0)
Dublin Fingal 9.6 (6.2, 14.4) 11.3 (7.6, 16.5)
Dun Laoghaire-Rathdown 8.7 (6.0, 12.4) 9.6 (6.1, 14.9)
South Dublin 3.0 (1.3, 6.8) 2.7 (1.1, 6.4)
Galway County 6.2 (4.1, 9.3) 14.8 (10.3, 20.7)
Galway City 7.2 (4.7, 10.9) 16.0 (11.2, 22.2)
Kildare 17.0 (11.6, 24.2) 22.5 (16.6, 29.7)
Kilkenny 1.3 (0.5, 3.0) 3.1 (1.5, 6.5)
Laois 15.5 (10.9, 21.5) 29.7 (23.1, 37.2)
Limerick City 1.7 (0.7, 3.9) 7.0 (4.4, 10.9)
Limerick County 6.7 (3.9, 11.2) 13.7 (9.8, 18.7)
Louth 10.6 (7.1, 15.6) 17.5 (12.1, 24.5)
Meath 7.2 (4.2, 12.2) 11.6 (6.7, 19.2)
Mayo 2.0 (0.7, 5.5) 3.5 (1.4, 8.9)
Tipperary 2.3 (1.3, 3.9) 11.0 (6.9, 17.0)
Wicklow 3.7 (1.8, 7.8) 3.3 (1.6, 6.6)
Wexford 10.0 (6.9, 14.1) 13.9 (10.7, 17.8)
Total 7.0 (6.2, 7.9) 10.6 (9.6, 11.8)

148
TABLE 61 LEVEL OF DIFFICULTY ACCESSING INFORMATION ON LOCAL ACTIVITIES AND EVENTS AMONG ADULTS AGED 55+, BY LOCAL AUTHORITY AREA
Local AuthorityLocal activities and events Health or social services
% 95% CI % 95% CI
Clare 2.8 (1.5, 5.4) 8.7 (5.0, 14.6)
Cork County 5.2 (3.7, 7.3) 10.3 (7.3, 14.3)
Cork City 11.8 (8.1, 17.0) 12.4 (8.6, 17.4)
Cavan 10.1 (5.9, 16.8) 10.1 (6.0, 16.5)
Dublin City 8.3 (5.0, 13.5) 8.1 (5.0, 13.0)
Dublin Fingal 9.6 (6.2, 14.4) 11.3 (7.6, 16.5)
Dun Laoghaire- Rathdown 8.7 (6.0, 12.4) 9.6 (6.1, 14.9)
South Dublin 3.0 (1.3, 6.8) 2.7 (1.1, 6.4)
Galway County 6.2 (4.1, 9.3) 14.8 (10.3, 20.7)
Galway City 7.2 (4.7, 10.9) 16.0 (11.2, 22.2)
Kildare 17.0 (11.6, 24.2) 22.5 (16.6, 29.7)
Kilkenny 1.3 (0.5, 3.0) 3.1 (1.5, 6.5)
Laois 15.5 (10.9, 21.5) 29.7 (23.1, 37.2)
Limerick City 1.7 (0.7, 3.9) 7.0 (4.4, 10.9)
Limerick County 6.7 (3.9, 11.2) 13.7 (9.8, 18.7)
Louth 10.6 (7.1, 15.6) 17.5 (12.1, 24.5)
Meath 7.2 (4.2, 12.2) 11.6 (6.7, 19.2)
Mayo 2.0 (0.7, 5.5) 3.5 (1.4, 8.9)
Tipperary 2.3 (1.3, 3.9) 11.0 (6.9, 17.0)
Wicklow 3.7 (1.8, 7.8) 3.3 (1.6, 6.6)
Wexford 10.0 (6.9, 14.1) 13.9 (10.7, 17.8)
Total 7.0 (6.2, 7.9) 10.6 (9.6, 11.8)

149 POSITIVE AGEING LOCAL INDICATORS / COMMUNICATION AND INFORMATION
FACTORS ASSOCIATED WITH DIFFICULTY ACCESSING INFORMATION ON LOCAL ACTIVITIES AND EVENTS AND HEALTH OR SOCIAL SERVICES
We examined a number of socio-demographic characteristics to identify factors that help explain differences in difficulty accessing information on 1) local activities and events and 2) health or social services. The full results are presented in Appendix 2 (Table 27).
FIGURE 32 FACTORS ASSOCIATED WITH DIFFICULTY ACCESSING INFORMATION ON LOCAL ACTIVITIES AND EVENTS
Note: results are based on a mixed-effects regression model and reported as Odds Ratios with 95% Confidence Intervals.

150
FIGURE 33 FACTORS ASSOCIATED WITH DIFFICULTY ACCESSING INFORMATION ON HEALTH SERVICES
Note: results are based on a mixed-effects regression model and reported as Odds Ratios with 95% Confidence Intervals.

151 POSITIVE AGEING LOCAL INDICATORS / COMMUNICATION AND INFORMATION
NOTES

152
Department of Health and Children & Health Service Executive (2009) The National Guidelines on Physical Activity for Ireland. Dublin, Department of Health and Children.
Department of Health (2017) Healthy Ireland Survey 2016 Summary of Findings. Dublin, Stationery Office.
Department of Health (2013a) Positive Ageing Starts Now! National Positive Ageing Strategy. Dublin, Department of Health.
Department of Health (2013b) Healthy Ireland: A framework for improved health and wellbeing 2013 – 2025. Dublin, Department of Health.
Department of the Environment, Community and Local Government (2012) Putting People First – Action Programme for Effective Local Government. Dublin, Stationery Office.
Plouffe, L. and Kalache, A. (2010) Towards global age-friendly cities: determining urban features that promote active aging. Journal of Urban Health 87(5),733-739.
World Health Organisation (WHO) (2002) Active Ageing: A Policy Framework. Retrieved from: http://ec.europa.eu/public_opinion/archives/ebs/ebs_378_en.pdf on 6 June 2017
World Health Organisation (WHO) (2007) Global Age-friendly Cities: A Guide. Geneva, WHO.
Wren, M., Keegan, C., Walsh, B., Bergin, A., Eighan, J., Brick, Connolly, S., Watson, D., and Banks, J. (2017). Research Series Number 67: Projections of Demand for Healthcare in Ireland, 2015-2030 First Report from the Hippocrates Model. Dublin, Economic and Social Research Institute. Retrieved from https://www.esri.ie/pubs/RS67.pdf on 30 October 2017
REFERENCES

153
9APPENDICES

154

155
APPENDIX 1: DESCRIPTIVE STATISTICS TABLES
PROFILE OF SURVEY PARTICIPANTS
The majority of survey participants were aged between 55 and 69 (62.9%), women (52.7%), married (65.0%), and living with a spouse or partner (54.4%). Roughly one in four lived in a rural area (24.2% in open countryside), towns with a population of 1500+ (25.4%) and city suburbs (27.5%) with less than one in five living in villages (17.9%)
Less than one-in-five had a tertiary level of education (17.9%). Half of the respondents were retired (50.9%). Almost one third (29.4%) of respondents had a net monthly household income of €1,500 or less, however 32.4% of respondents chose not to answer this question. Just under one-in-ten (7.9%) were materially deprived. These characteristics are reported for each area surveyed in Tables 6 to 8.
HEALTH CHARACTERISTICS
The majority of respondents rated their health as good or very good (70.3%), and 41.4% had two or more chronic conditions.
Almost one third (29.0%) reported being limited in their daily activity by a health condition or illness.
A total of 18.3% were current smokers, and 24.3% reported consuming alcohol at least weekly.
Half of the respondents were moderately physically active at least 150 minutes per week, which is consistent with the National Physical Activity Guidelines for Ireland (Department of Health and Children & Health Service Executive, 2009).
A total of 10.1% of the respondents had no form of healthcare cover (medical card or health insurance) at the time of survey. These health characteristics are reported for each local authority area surveyed in Appendix 1.

156
TABLE 1 WEIGHTED AGE AND GENDER BY LOCAL AUTHORITY AREA
Age group Gender
Age 55-69 Age 70+ Male Female
% 95% CI % 95% CI % 95% CI % 95% CI
Clare 65.1 (60.4,69.5) 34.9 (30.5,39.6) 49.3 (44.4,54.2) 50.7 (45.8,55.6)
Cork County 62.0 (57.6,66.1 38.0 (33.9,42.4) 46.3 (41.9,50.8) 53.7 (49.2,58.1)
Cork City 58.7 (51.6,65.5) 41.3 (34.5,48.4) 45.8 (42.1,49.6) 54.2 (50.4,57.9)
Cavan 59.4 (52.9,65.5) 40.6 (34.5,47.1) 50.1 (43.7,56.4) 49.9 (43.6,56.3)
Dublin City 56.1 (49.9,62.2) 43.9 (37.8,50.1) 44.8 (39.5,50.2) 55.2 (49.8,60.5)
Dublin Fingal 69.5 (63.8,74.6) 30.5 (25.4,36.2) 48.2 (43.6,52.8) 51.8 (47.2,56.4)
Dun Laoghaire- Rathdown
59.8 (53.3,65.9) 40.2 (34.1,46.7) 45.6 (40.8,50.4) 54.4 (49.6,59.2)
South Dublin 73.4 (65.7,79.8) 26.6 (20.2,34.3) 47.8 (42.6,53.1) 52.2 (46.9,57.4)
Galway County 57.7 (52.8,62.5) 42.3 (37.5,47.2) 47.7 (43.0,52.5) 52.3 (47.5,57.0)
Galway City 64.2 (58.3,69.8) 35.8 (30.2,41.7) 45.8 (40.8,50.7) 54.2 (49.3,59.2)
Kildare 70.5 (64.4,75.9) 29.5 (24.1,35.6) 47.5 (42.4,52.6) 52.5 (47.4,57.6)
Kilkenny 61.3 (55.4,67.0) 38.7 (33.0,44.6) 49.2 (44.2,54.2) 50.8 (45.8,55.8)
Laois 64.7 (57.5,71.4) 35.3 (28.6,42.5) 49.7 (44.2,55.3) 50.3 (44.7,55.8)
Limerick City 62.1 (54.9,68.7) 37.9 (31.3,45.1) 46.2 (39.6,53.0) 53.8 (47.0,60.4)
Limerick County
63.8 (59.5,67.8) 36.2 (32.2,40.5) 48.6 (43.5,53.7) 51.4 (46.3,56.5)
Louth 60.8 (54.8,66.5) 39.2 (33.5,45.2) 48.0 (43.0,53.1) 52.0 (46.9,57.0)
Meath 68.7 (63.2,73.8) 31.3 (26.2,36.8) 48.9 (43.6,54.2) 51.1 (45.8,56.4)
Mayo 58.3 (52.2,64.1) 41.7 (35.9,47.8) 49.5 (44.2,54.9) 50.5 (45.1,55.8)
Tipperary 64.1 (58.8,69.1) 35.9 (30.9,41.2) 45.5 (40.8,50.2) 54.5 (49.8,59.2)
Wicklow 64.7 (59.5,69.5) 35.3 (30.5,40.5) 48.6 (43.5,53.7) 51.4 (46.3,56.5)
Wexford 65.3 (60.3,69.9) 34.7 (30.1,39.7) 48.8 (43.6,54.1) 51.2 (45.9,56.4)

157
TABLE 2 WEIGHTED MARITAL STATUS BY LOCAL AUTHORITY AREA
Married or living with a partner
Single (never married)
Separated or divorced
Widowed
% 95% CI % 95% CI % 95% CI % 95% CIClare 65.0 (59.7,70.0) 10.1 (7.5,13.6) 8.2 (6.4,10.5) 16.6 (14.1,19.6)Cork County 63.5 (58.2,68.5) 12.3 (10.0,15.1) 5.3 (3.5,7.8) 18.9 (15.6,22.6)Cork City 63.6 (57.6,69.1) 7.8 (5.8,10.5) 6.5 (4.3,9.7) 22.1 (18.2,26.5)Cavan 62.8 (57.8,67.6) 10.7 (8.2,13.8) 5.4 (3.5,8.4) 21.1 (17.4,25.3)Dublin City 56.7 (51.1,62.1) 14.1 (10.2,19.1) 6.9 (4.3,10.9) 22.3 (18.1,27.1)Dublin Fingal 73.0 (66.6,78.7) 4.2 (2.7,6.4) 7.5 (5.3,10.6) 15.3 (11.2,20.5)Dun Laoghaire- Rathdown
70.6 (64.0,76.4) 5.9 (3.9,8.8) 6.0 (3.7,9.8) 17.4 (13.5,22.3)
South Dublin 76.2 (68.4,82.5) 5.8 (3.3,10.1) 5.2 (2.8,9.6) 12.8 (8.2,19.4)Galway County 62.9 (57.3,68.2) 13.2 (10.7,16.2) 3.8 (2.4,6.0) 20.1 (16.4,24.4)Galway City 61.8 (56.1,67.2) 14.0 (10.5,18.5) 8.1 (5.5,11.8) 16.0 (13.0,19.7)Kildare 69.4 (62.2,75.7) 7.2 (4.5,11.1) 6.4 (4.1,9.9) 17.0 (12.9,22.1)Kilkenny 64.5 (58.8,69.9) 10.4 (7.3,14.6) 6.3 (3.9,10.2) 18.7 (15.4,22.4)Laois 64.5 (58.3,70.3) 8.5 (5.9,12.2) 8.6 (6.4,11.6) 18.4 (14.9,22.4)Limerick City 59.7 (53.9,65.2) 9.8 (6.7,14.1) 11.2 (7.7,16.0) 19.3 (16.0,23.1)Limerick County
64.2 (59.1,69.0) 10.6 (7.9,14.2) 5.2 (3.0,8.7) 20.0 (16.2,24.5)
Louth 62.8 (56.7,68.5) 10.7 (7.4,15.2) 5.3 (3.5,7.8) 21.3 (17.4,25.8)Meath 69.6 (62.9,75.6) 7.5 (4.6,11.9) 5.3 (3.5,8.0) 17.6 (13.6,22.3)Mayo 62.4 (55.7,68.7) 13.4 (10.7,16.7) 3.8 (1.6,8.5) 20.4 (15.8,26.0)Tipperary 63.2 (57.7,68.4) 11.6 (9.0,14.8) 6.8 (4.8,9.6) 18.4 (15.1,22.2)Wicklow 65.4 (59.2,71.2) 10.2 (7.1,14.5) 5.9 (3.9,8.7) 18.5 (14.6,23.2)Wexford 65.3 (59.9,70.3) 9.8 (7.4,12.9) 7.0 (4.7,10.2) 17.9 (14.4,22.2)

158
TABLE 3 WEIGHTED HOUSEHOLD COMPOSITION BY LOCAL AUTHORITY AREA
Living aloneLiving with spouse or partner
Living with spouse/ partner and others (family and non-family)
Living with family or non-family (not spouse/ partner)
% 95% CI % 95% CI % 95% CI % 95% CI
Clare 29.1 (24.6,34.1) 59.9 (54.5,65.0) 9.6 (6.7,13.5) 1.4 (0.8,2.7)Cork County 29.5 (24.9,34.6) 53.5 (47.1,59.9) 13.5 (9.2,19.4) 3.5 (2.3,5.2)Cork City 25.8 (20.5,32.0) 46.9 (40.1,53.8) 22.8 (17.3,29.4) 4.5 (2.6,7.7)Cavan 30.7 (26.2,35.7) 58.7 (53.1,64.1) 7.8 (5.4,11.1) 2.8 (1.4,5.5)Dublin City 32.9 (28.0,38.1) 45.7 (40.6,50.9) 19.8 (15.8,24.4) 1.7 (0.8,3.5)Dublin Fingal 18.7 (14.4,23.9) 59.2 (53.2,64.9) 20.3 (16.3,24.9) 1.9 (0.8,4.0)
Dun Laoghaire- Rathdown
22.6 (17.1,29.3) 52.2 (43.8,60.5) 22.2 (16.6,28.9) 3.0 (1.3,6.9)
South Dublin 15.8 (11.1,22.1) 56.8 (48.0,65.1) 27.2 (20.3,35.3) <1.0Galway County 27.6 (22.9,32.8) 55.2 (49.1,61.1) 15.3 (11.3,20.3) 2 (1.0,3.6)Galway City 29.5 (24.7,34.9) 55.0 (49.3,60.6) 13.2 (10.4,16.7) 2.2 (1.2,4.1)Kildare 23.7 (18.6,29.7) 58.7 (50.3,66.7) 15.2 (10.9,20.9) 2.3 (1.2,4.5)Kilkenny 28.6 (23.5,34.4) 57.5 (51.5,63.2) 12.6 (8.9,17.5) 1.3 (0.7,2.6)Laois 29.9 (24.4,36.1) 61.6 (55.3,67.5) 5.2 (3.3,8.1) 3.2 (1.7,6.1)Limerick City 3.02 (27.2,37.1) 57.6 (51.3,63.7) 10.1 (7.1,14.2) <1.0Limerick County
29.9 (26.1,33.9) 57.2 (51.6,62.6) 9.5 (6.1,14.4) 3.5 (2.1,5.6)
Louth 30.3 (25.4,35.8) 50.6 (43.9,57.4) 18.0 (12.2,25.7) 1.1 (0.4,3.2)Meath 23.9 (18.7,30.0) 56.6 (48.9,64.0) 19.1 (13.9,25.6) 0.4 (0.1,2.7)Mayo 29.8 (23.8,36.6) 62.2 (55.6,68.4) 5.6 (3.6,8.5) 2.4 (1.2,4.5)Tipperary 33.0 (27.8,38.5) 56.3 (50.2,62.2) 8.3 (5.4,12.5) 2.5 (1.5,3.9)Wicklow 25.9 (21.1,31.3) 52.7 (46.4,58.9) 19.2 (14.8,24.5) 2.3 (1.2,4.1)Wexford 29.4 (24.4,34.9) 53.4 (47.3,59.5) 16.0 (12.3,20.7) 1.2 (0.5,2.5)

159
TABLE 4 WEIGHTED HEALTH COVERAGE BY LOCAL AUTHORITY AREA
Healthcare CoverageFull medical card only
GP visit card only
Health insurance only
Joint cover No cover
% 95% CI % 95% CI % 95% CI % 95% CI % 95% CI
Clare 44.6 (36.5,52.9) 2.3 (1.1,4.6) 29.6 (23.4,36.5) 21.2 (17.0,26.1) 2.4 (1.2,4.6)Cork County 46.9 (40.7,53.3) 1.2 (0.5,3.2) 31.4 (26.0,37.2) 16.0 (12.1,20.8) 4.5 (2.8,7.2)Cork City 44.3 (36.7,52.1) 5.3 (2.4,11.4) 21.3 (16.5,27.1) 13.5 (8.6,20.5) 15.6 (11.0,21.5)Cavan 52.8 (46.3,59.2) 2.9 (1.5,5.5) 19.9 (15.0,25.9) 11.9 (8.4,16.5) 12.5 (7.5,20.1)Dublin City 37.3 (29.8,45.6) 3.2 (1.9,5.4) 25.1 (19.6,31.5) 23.6 (18.0,30.2) 10.8 (6.9,16.4)Dublin Fingal
21.6 (14.9,30.4) 3.9 (2.2,7.1) 32.0 (24.6,40.6) 26.0 (19.7,33.6) 16.3 (10.6,24.4)
Dun Laoghaire- Rathdown
20.3 (13.6,29.2) 4.1 (2.2,7.3) 31.7 (25.3,38.9) 31.6 (24.4,39.8) 12.3 (7.6,19.5)
South Dublin 21.3 (12.6,33.6) 5.3 (3.4,8.1) 31.9 (23.9,41.2) 27.8 (19.3,38.2) 13.8 (9.0,20.5)Galway County
45.5 (37.2,54.0) 2.6 (1.3,5.2) 25.9 (20.5,32.0) 13.6 (10.0,18.2) 12.5 (8.4,18.2)
Galway City 36.7 (29.1,44.9) 3.4 (1.8,6.4) 31.4 (25.5,38.0) 18.5 (13.9,24.2) 10.0 (6.9,14.3)Kildare 46 (38.8,53.2) 5.2 (2.5,10.5) 22.0 (16.7,28.3) 11.1 (7.4,16.4) 15.7 (10.7,22.6)Kilkenny 41.5 (34.7,48.6) <1.0 23.1 (18.3,28.7) 23.7 (19.3,28.8) 11.2 (6.8,18.0)Laois 61.4 (54.4,67.9) 4.9 (3.0,7.8) 20.1 (15.0,26.5) 5.1 (2.7,9.5) 8.5 (5.5,12.8)Limerick City
48.2 (39.2,57.4) 2.1 (1.0,4.4) 21.0 (16.4,26.4) 23.6 (17.7,30.6) 5.1 (2.8,9.3)
Limerick County
29.4 (23.6,36.1) 1.6 (0.7,3.8) 33.8 (27.5,40.7) 28.4 (23.9,33.5) 6.7 (4.3,10.3)
Louth 36.3 (29.2,44.1) 1.9 (0.9,4.1) 24.9 (19.4,31.4) 24.3 (19.4,29.9) 12.6 (8.5,18.2)
Meath 34.4 (27.0,42.6) 2.7 (1.3,5.5) 36.1 (27.8,45.3) 13.0 (8.9,18.5) 13.9 (10.5,18.2)Mayo 50.5 (42.4,58.6) <1 33.7 (26.6,41.6) 9.0 (6.1,13.1) 6.0 (3.6,9.7)Tipperary 57 (49.5,64.3) 2.4 (1.4,4.1) 14.4 (10.3,19.9) 18.7 (13.1,26.0) 7.4 (4.7,11.5)Wicklow 47.6 (39.4,56.0) 1.6 (0.7,3.6) 29.9 (23.2,37.7) 13.2 (10.3,16.9) 7.6 (4.9,11.8)Wexford 52.3 (44.8,59.7) 1.9 (0.9,4.1) 20.5 (15.8,26.3) 17.3 (13.9,21.4) 7.9 (5.4,11.5)

160
TABLE 5 WEIGHTED HIGHEST LEVEL OF EDUCATION BY LOCAL AUTHORITY AREA
Highest Level of Education
Primary/None Secondary Third Level
% 95% CI % 95% CI % 95% CI
Clare 34.3 (28.1,41.0) 49.3 (42.9,55.7) 16.4 (11.6,22.8)
Cork County 31.4 (25.9,37.4) 52.6 (47.3,57.9) 16.0 (12.0,21.1)
Cork City 37.3 (29.2,46.2) 46.3 (39.7,53.2) 16.4 (12.5,21.2)
Cavan 47.0 (39.9,54.3) 42.0 (35.9,48.4) 11.0 (7.8,15.3)
Dublin City 38.5 (29.7,48.1) 42.5 (35.6,49.6) 19.1 (14.4,24.9)
Dublin Fingal 25.0 (19.2,32.0) 51.6 (45.2,58.0) 23.4 (18.1,29.6)
Dun Laoghaire- Rathdown
16.9 (12.1,23.2) 47.0 (39.3,54.7) 36.1 (29.5,43.2)
South Dublin 35.4 (26.1,46.0) 49.7 (41.0,58.4) 14.9 (10.9,20.0)
Galway County 36.8 (29.5,44.8) 46.5 (40.5,52.6) 16.7 (12.4,22.2)
Galway City 25.2 (18.7,33.0) 46.9 (42.1,51.8) 27.9 (22.1,34.4)
Kildare 32.2 (26.1,38.9) 50.5 (44.8,56.1) 17.4 (12.8,23.0)
Kilkenny 35.3 (29.1,42.0) 50.8 (44.8,56.8) 13.9 (10.0,19.2)
Laois 42.2 (33.7,51.2) 46.1 (38.2,54.2) 11.7 (7.1,18.8)
Limerick City 37.8 (29.7,46.7) 48.7 (41.6,55.8) 13.5 (9.5,18.8)
Limerick County
32.5 (26.6,39.0) 52.2 (46.2,58.1) 15.3 (11.3,20.4)
Louth 43.5 (36.5,50.9) 43.6 (37.6,49.7) 12.9 (9.5,17.2)
Meath 36.5 (29.0,44.7) 48.5 (41.3,55.8) 15.0 (11.7,19.1)
Mayo 44.9 (35.5,54.7) 42.4 (34.8,50.3) 12.7 (9.9,16.1)
Tipperary 31.7 (25.2,38.9) 51.5 (45.5,57.4) 16.9 (12.3,22.6)
Wicklow 32.0 (24.7,40.3) 47.5 (40.2,54.9) 20.5 (14.9,27.5)
Wexford 42.2 (34.7,50.1) 45.6 (38.7,52.7) 12.2 (9.0,16.2)

161
TABLE 6 WEIGHTED MATERIAL DEPRIVATION BY LOCAL AUTHORITY AREA
Materially Deprived
Yes
% 95% CI
Clare 9.4 (6.3,14.0)
Cork County 8.9 (6.1,12.8)
Cork City 14.5 (10.1,20.4)
Cavan 5.1 (2.3,11.2)
Dublin City 6.3 (3.8,10.2)
Dublin Fingal 6.2 (3.5,10.7)
Dun Laoghaire-Rathdown 6.6 (4.0,10.6)South Dublin 1.2 (0.3,5.4)
Galway County 9.0 (5.9,13.5)
Galway City 12.1 (8.1,17.7)
Kildare 17.1 (11.8,24.0)
Kilkenny 4.3 (2.6,7.0)
Laois 20.6 (14.7,28.0)
Limerick City 12.5 (8.5,18.1)
Limerick County
7.5 (5.0,11.2)
Louth 1.7 (0.6,4.7)
Meath 7.8 (4.5,13.2)
Mayo 3.6 (1.8,7.0)
Tipperary 8.1 (5.6,11.6)
Wicklow 4.7 (2.7,8.1)
Wexford 12.1 (8.4,17.1)

162
TABLE 7 WEIGHTED PERCENTAGE OF ADULTS AGED 55+ WHO ARE PHYSICALLY ACTIVE BY LOCAL AUTHORITY AREA
Physically Active 150 mins/week
Yes
% 95% CI
Clare 43.1 (36.7,49.7)
Cork County 51.2 (43.5,58.8)
Cork City 44.3 (38.3,50.4)
Cavan 60.6 (53.0,67.8)
Dublin City 54.8 (47.3,62.1)
Dublin Fingal 53.2 (44.5,61.7)
Dun Laoghaire-Rathdown 52.5 (44.3,60.5)South Dublin 59.5 (48.8,69.3)
Galway County 58.9 (51.4,66.1)
Galway City 58.4 (49.1,67.1)
Kildare 43.0 (35.1,51.3)
Kilkenny 54.8 (47.3,62.1)
Laois 42.2 (35.9,48.8)
Limerick City 41.6 (35.7,47.8)
Limerick County
37.1 (30.0,44.7)
Louth 50.7 (43.7,57.7)
Meath 45.7 (36.4,55.2)
Mayo 62.2 (54.3,69.6)
Tipperary 52.7 (44.1,61.1)
Wicklow 44.3 (38.6,50.1)
Wexford 44.2 (36.4,52.3)

163
TABLE 8 SELF-RATED HEALTH OF ADULTS AGED 55+ BY LOCAL AUTHORITY AREA
Good/very good Fair/bad/very bad
% 95% CI % 95% CI
Clare 72.3 (67.0, 77.1) 27.7 (22.9, 33.0)
Cork County 68.1 (64.0, 72.0) 31.9 (28.0, 36.0)
Cork City 63.7 (57.0, 69.9) 36.3 (30.1, 43.0)
Cavan 71.7 (65.3, 77.4) 28.3 (22.6, 34.7)
Dublin City 74.7 (69.1, 79.6) 25.3 (20.4, 30.9)
Dublin Fingal 75.2 (69.8, 79.9) 24.8 (20.1, 30.2)
Dun Laoghaire-Rathdown
71.2 (64.2, 77.3) 28.8 (22.7, 35.8)
South Dublin 62.9 (53.6, 71.3) 37.1 (28.7, 46.4)
Galway County 68.4 (63.6, 72.8) 31.6 (27.2, 36.4)
Galway City 73.0 (67.8, 77.7) 27.0 (22.3, 32.2)
Kildare 76.1 (70.3, 81.0) 23.9 (19.0, 29.7)
Kilkenny 74.1 (68.6, 78.8) 25.9 (21.2, 31.4)
Laois 65.5 (59.1, 71.4) 34.5 (28.6, 40.9)
Limerick City 63.6 (56.9, 69.7) 36.4 (30.3, 43.1)
Limerick County
71.4 (65.9, 76.4) 28.6 (23.6, 34.1)
Louth 72.5 (66.8, 77.6) 27.5 (22.4, 33.2)
Meath 78.7 (72.6, 83.7) 21.3 (16.3, 27.4)
Mayo 71.0 (64.2, 77.0) 29.0 (23.0, 35.8)
Tipperary 65.9 (60.1, 71.3) 34.1 (28.7, 39.9)
Wicklow 66.9 (59.5, 73.5) 33.1 (26.5, 40.5)
Wexford 62.7 (56.7, 68.3) 37.3 (31.7, 43.3)
Total 70.3 (68.8, 71.7) 29.7 (28.3, 31.2)

164
TABLE 9 WEIGHTED MOTHLY DISPOSABLE INCOME BY LOCAL AUTHORITY AREA
€2,501 or more€1,501 up to €2,500
€1,001 up to €1,500
€501 up to €1,000
Missing
% 95% CI % 95% CI % 95% CI % 95% CI % 95% CI
Clare 11.4 (6.1,20.4) 32.2 (25.4,39.8) 23.6 (17.7,30.7) 20.0 (15.3,25.9) 12.8 (8.5,18.8)Cork County
18.2 (12.6,25.6) 18.0 (12.4,25.5) 10.7 (8.1,14.1) 15.6 (11.4,20.9) 37.5 (27.4,48.8)
Cork City 5.5 (3.0,9.9) 9.2 (5.4,15.3) 7.0 (4.2,11.5) 13.5 (8.5,20.8) 64.8 (55.1,73.3)Cavan 4.5 (2.1,9.4) 11.8 (7.5,18.1) 13.6 (9.8,18.5) 29.8 (21.7,39.5) 40.3 (29.3,52.4)Dublin City 10.1 (7.1,14.2) 23.1 (17.7,29.5) 21.5 (16.2,28.0) 16.6 (11.4,23.7) 28.7 (19.7,39.8)Dublin Fingal
23.3 (17.2,30.9) 22.8 (17.7,29.0) 7.7 (4.9,11.9) 1.3 (0.4,3.8) 44.8 (34.9,55.1)
Dun Laoghaire-Rathdown
47.4 (36.3,58.8) 9.3 (6.1,13.9) 4.0 (2.3,6.7) 6.3 (3.0,12.9) 33.0 (24.0,43.5)
South Dublin
22.7 (15.0,32.9) 15.0 (9.9,22.1) 4.4 (2.0,9.2) 4.9 (1.8,12.5) 53.1 (40.2,65.5)
Galway County
9.4 (6.1,14.3) 24.7 (19.4,30.9) 19.9 (15.7,24.8) 27.5 (21.2,34.9) 18.5 (11.5,28.5)
Galway City 9.0 (5.6,14.0) 29.9 (25.4,34.8) 22.0 (18.4,26.1) 17.4 (12.8,23.1) 21.7 (15.8,29.2)Kildare 9.4 (5.9,14.5) 19.2 (13.3,27.0) 13.8 (9.7,19.2) 22.0 (14.2,32.4) 35.6 (25.5,47.2)Kilkenny 3.1 (1.6,5.9) 24.7 (19.3,30.9) 11.7 (8.4,16.2) 22.7 (17.3,29.3) 37.8 (28.7,47.9)Laois 6.1 (3.2,11.6) 22.3 (16.5,29.5) 19.5 (14.2,26.2) 28.4 (20.6,37.8) 23.6 (16.2,33.1)Limerick City
6.7 (4.5,9.9) 24.7 (19.4,30.8) 21.1 (15.5,28.0) 25.9 (21.0,31.4) 21.6 (15.9,28.8)
Limerick County
15.8 (9.9,24.3) 23.5 (17.5,30.8) 14.2 (10.7,18.8) 22.2 (16.4,29.3) 24.2 (16.7,33.7)
Louth 11.8 (7.8,17.5) 34.5 (28.7,40.9) 24.1 (19.2,29.8) 6.5 (3.4,12.2) 23.0 (17.8,29.2)
Meath 24.8 (18.0,33.1) 26.7 (20.6,33.9) 26.4 (20.7,33.0) 17.6 (11.4,26.1) 4.5 (2.9,7.1)Mayo 35.3 (24.9,47.4) 17.4 (11.4,25.8) 9.2 (6.3,13.2) 9.7 (5.8,15.8) 28.4 (20.1,38.4)Tipperary 13.5 (7.9,22.0) 25.2 (18.4,33.4) 20.6 (14.8,27.9) 9.3 (6.1,14.0) 31.4 (21.7,43.1)Wicklow 15.8 (11.4,21.6) 29.5 (23.3,36.6) 8.6 (5.9,12.3) 18.9 (13.9,25.2) 27.2 (21.2,34.1)
Wexford 23.0 (14.7,34.1) 11.4 (8.0,16.0) 9.1 (5.9,13.6) 14.1 (8.8,21.8) 42.5 (33.4,52.1)

165
TABLE 10 WEIGHTED OCCUPATIONAL STATUS BY LOCAL AUTHORITY AREA
Employed or self-employed
Retired Out of workLooking after home/family
% 95% CI % 95% CI % 95% CI % 95% CI
Clare 23.1 (17.8,29.4) 51.1 (45.5,56.8) 11.5 (8.2,15.9) 14.2 (10.3,19.3)
Cork County 27.8 (23.1,33.0) 46.0 (40.5,51.5) 8.8 (6.2,12.4) 17.4 (13.6,22.1)
Cork City 17.9 (14.1,22.3) 50.4 (42.7,58.1) 15.7 (11.2,21.4) 16 (11.8,21.4)Cavan 22.2 (17.6,27.7) 58.2 (51.7,64.4) 6.1 (3.9,9.4) 13.5 (9.4,19.0)Dublin City 17.1 (13.1,22.1) 64.4 (58.3,70.1) 10.2 (7.4,13.9) 8.3 (5.5,12.3)Dublin Fingal 29.6 (23.7,36.4) 47.4 (40.1,54.9) 7.1 (4.6,10.7) 15.9 (11.9,20.8)Dun Laoghaire-Rathdown
26.0 (21.6,31.0) 53.0 (46.7,59.2) 11.2 (7.8,15.9) 9.8 (6.9,13.6)
South Dublin 34.2 (27.7,41.4) 44.7 (37.1,52.5) 9.7 (6.2,15.0) 11.4 (7.5,17.0)Galway County 34.1 (28.7,40.0) 42.2 (36.8,47.8) 5.2 (3.5,7.8) 18.4 (13.7,24.4)Galway City 29.0 (23.4,35.4) 50.8 (44.8,56.9) 12.6 (8.4,18.3) 7.6 (5.2,11.1)Kildare 28.7 (23.5,34.6) 43.1 (36.7,49.7) 11.8 (8.2,16.6) 16.5 (11.5,23.1)Kilkenny 21.5 (16.8,27.2) 57.7 (51.6,63.5) 11.9 (7.9,17.6) 8.9 (5.9,13.0)Laois 22.1 (17.3,27.9) 47.9 (41.1,54.7) 11.1 (8.2,14.7) 18.9 (14.1,24.9)Limerick City 18.2 (13.3,24.4) 45.6 (39.3,52.1) 14.2 (8.4,23.1) 22.0 (16.5,28.8)Limerick County
29.6 (24.7,34.9) 51.3 (45.5,57.0) 9.1 (6.0,13.6) 10.0 (7.4,13.3)
Louth 19.2 (15.3,23.7) 59.4 (53.3,65.3) 10.2 (6.6,15.5) 11.2 (7.3,17.0)Meath 30.4 (24.5,37.0) 47.4 (41.0,53.9) 8.3 (5.2,12.9) 13.9 (10.1,18.8)Mayo 33.7 (28.1,39.8) 45.7 (38.4,53.2) 4.8 (2.4,9.3) 15.7 (12.1,20.2)Tipperary 19.1 (14.6,24.5) 50.3 (44.0,56.7) 11.9 (8.7,15.9) 18.7 (14.6,23.8)Wicklow 21.3 (16.1,27.5) 48.3 (41.3,55.4) 10.3 (7.1,14.7) 20.2 (14.5,27.3)Wexford 18.6 (14.4,23.7) 52.6 (46.0,59.3) 10.7 (7.6,14.9) 18.0 (13.3,23.9)

166
TABLE 11 WEIGHTED HOUSEHOLD LOCATION BY LOCAL AUTHORITY AREA
Open countryside VillageTown (1500+ population)
Inner cityCity Suburb
% 95% (CI) % 95% CI % 95% CI % 95% CI % 95% CIClare 17.1 (9.9,27.9) 32.1 (22.1,44.2) 50.6 (37.9,63.3) n.a. 0.1 (0.0,1.0)Cork County 54.6 (43.9,64.9) 23.6 (16.1,33.2) 19.8 (11.7,31.4) n.a. 2.0 (0.4,9.5)Cork City <1.0 <1.0 5.6 (2.0,15.0) 10.2 (4.5,21.4) 82.9 (70.8,90.6)Cavan 55.4 (44.0,66.3) 9.3 (4.6,17.9) 35.3 (24.3,48.2) n.a. n.a.Dublin City n.a. 2.0 (0.4,9.1) 10.1 (4.5,21.1) 26.5 (16.1,40.3) 61.4 (47.3,73.8)Dublin Fingal 3.1 (1.1,8.7) 23.9 (14.8,36.3) 18.4 (11.0,29.1) 1.2 (0.2,7.7) 53.4 (38.9,67.3)Dun Laoghaire- Rathdown
2.4 (0.8,6.7) 4.8 (2.1,10.7) 12.8 (7.3,21.5) 6.4 (2.7,14.7) 73.5 (61.5,82.9)
South Dublin n.a. 13.0 (6.4,24.7) 24.8 (15.1,37.9) n.a 62.0 (48.0,74.2)Galway County 74.4 (63.8,82.8) 17.9 (11.1,27.4) 7.6 (3.0,17.7) n.a. n.a.Galway City 2.1 (0.4,10.5) n.a. 3.8 (1.0,13.0) 5.4 (1.9,14.2) 88.3 (77.9,94.1)Kildare 8.2 (3.7,17.0) 44.3 (32.7,56.6) 44.4 (32.9,56.5) n.a. 3.1 (1.2,7.9)Kilkenny 39.7 (29.2,51.3) 34.1 (23.9,46.0) 9.6 (4.5,19.1) 2.6 (0.5,11.6) 14.0 (7.0,26.1)Laois 6.9 (3.6,12.7) 34.3 (22.9,47.9) 58.6 (44.8,71.2) n.a. 0.2 (0.0,1.4)Limerick City n.a. n.a. 1.6 (0.2,10.5) 24.8 (14.8,38.5) 73.3 (59.5,83.6)Limerick County 66.8 (56.2,76.0) 15.5 (9.6,23.8) 7.5 (3.5,15.6) n.a. 10.0 (4.2,21.9)
Louth 11.9 (6.4,20.9) 18.6 (11.2,29.4) 61.9 (49.9,72.6) n.a. 7.5 (4.2,13.3)
Meath 6.9 (3.1,14.8) 35.7 (24.2,49.2) 56.4 (43.2,68.7) n.a. 1.0 (0.4,2.6)Mayo 81.7 (70.0,89.5) 10.0 (5.1,18.9) 8.0 (3.0,19.6) n.a. <1Tipperary 2.8 (1.0,7.4) 22.5 (13.2,35.5) 74.6 (60.6,84.8) n.a. <1Wicklow 23.3 (14.3,35.7) 26.3 (17.3,37.8) 40.5 (28.5,53.7) n.a. 9.9 (4.6,19.9)
Wexford 56.1 (45.0,66.7) 25.5 (17.6,35.4) 18.4 (10.6,30.0) n.a. n.a.

167
APPENDIX 2 - FULL REGRESSION MODELS The analysis presented in this report focuses on different socio-demographic, socio-economic, and health characteristics. However, it is important to acknowledge that there are many additional explanations for the variation between areas; there may be historic social, economic and population differences that are not captured in this analysis. The difference may also be partly explained by the fact that some areas have been part of the Age Friendly Ireland programme for different lengths of time and as such may have developed responses to issues identified by focus groups and other consultations.
In order to investigate the association between different social, economic, health and environmental factors and outcomes, we used mixed effects regression models. We adopted this approach because the data collection methodology resulted in 21 sub-samples of respondents that are grouped or ‘nested’ within Local Authority areas. It may be the case that individuals within areas are more alike compared to individuals chosen at random across the whole population. The multi-level approach we have adopted in the analysis recognises the existence of these nested structures and adjusts for the fact that survey responses from respondents nested within an area are likely to be correlated.
The tables in this appendix contain the full regression models that correspond with each Odds Ratio graphs throughout the report. The results of regression analyses are reported as Odds Ratios with confidence Intervals (CIs) reported at the 95% level. Odds Ratios (OR) can be interpreted as the effect of a one unit change in the exposure (e.g. good health) in the predicted odds of the dependent outcome occurring (e.g. volunteering), when all other exposures are held constant. For the purpose of interpretation:
OR=1 The independent variable does not affect odds of the outcome occurring
OR>1 The independent variable is associated with higher odds of outcome occurring
OR<1 The independent variable is associated with lower odds of outcome occurring

168
EMPLOYMENT
TABLE 1 RESULTS OF A MIXED-EFFECTS LOGISTIC REGRESSION OF FACTORS ASSOCIATED WITH BEING IN PAID EMPLOYMENT AGED 65 AND OLDER
Odds Ratio (OR) 95% CI
Age 70+ versus 66-69 0.48 (0.38-0.60)
Gender Female versus male 0.53 (0.42-0.67)
Marital status
Reference: Married
Single (never married) 1.81 (0.97-3.40)
Separated or divorced 1.61 (0.75-3.42)
Widowed 1.06 (0.58-1.91)
Household composition
Reference: Living alone
Living with spouse 0.92 (0.51-1.68)
Living with family or non-family 1.07 (0.69-1.65)
Educational attainment
Reference: Primary or less
Secondary 1.26 (0.96-1.67)
Third Level 1.26 (0.91-1.75)
Income
Reference: > €2,500
€1,501 up to €2,500 0.67 (0.47-0.95)
€1,001 up to €1,500 0.41 (0.26-0.64)
€501 up to €1,000 0.37 (0.23-0.59)
Missing 0.95 (0.68-1.31)
Material deprivation Yes versus no 0.55 (0.29-1.03)
Mental health difficulties Yes versus no 0.19 (0.05-0.76)
Health status Fair/poor versus good/very good 0.63 (0.48-0.82)
Location
Reference: Open countryside and village
Towns 1500+ population 0.61 (0.45-0.82)
Inner city and suburbs 0.40 (0.27-0.58)
Constant 1.01 (0.43-2.39)
BIC 2684.198
LL -1255.208
LR-test 42.71***
Variance 0.21
Std. Err. 0.09
ICC 0.06
N 5938
Areas 21

169
LIFELONG LEARNING
TABLE 2 RESULTS OF MIXED-EFFECTS LOGISTIC REGRESSION OF FACTORS ASSOCIATED WITH PARTICIPATION IN LIFELONG LEARNING
Odds Ratio (OR) 95% CI
Age 70+ versus 55-69 0.65 (0.55-0.77)
Gender Female versus male 1.92 (1.67-2.20)
Marital status
Reference: Married
Single (never married) 0.75 (0.53-1.05)
Separated or divorced 1.02 (0.73-1.42)
Widowed 0.74 (0.53-1.02)
Household composition
Reference: Living alone
Living with spouse 0.78 (0.57-1.06)
Living with family or non-family (with/without spouse or partner)
1.03 (0.79-1.33)
Educational attainment
Reference: Primary or less
Secondary 1.85 (1.48-2.31)
Third Level 3.93 (3.11-4.95)
Income
Reference: > €2,500
€1,501 up to €2,500 0.90 (0.74-1.10)
€1,001 up to €1,500 0.76 (0.59-0.97)
€501 up to €1,000 0.62 (0.47-0.81)
Missing 0.80 (0.67-0.97)
Occupational status
Reference: Employed/self-employed
Retired 0.91 (0.77-1.08)
Out of work 1.53 (1.17-2.00)
Looking after home/family 0.56 (0.44-0.72)
Material deprivation Yes versus no 0.91 (0.67-1.22)
Mental health difficulties Yes versus no 1.13 (0.81-1.56)
Health status Fair/poor versus good/very good 0.69 (0.58-0.82)
Location
Reference: Open countryside and village
Towns 1500+ population 1.18 (0.99-1.41)
Inner city and suburbs 0.76 (0.60-0.98)
Constant 0.07 (0.04-0.11)
BIC 6612.9
LL -3200.6
LR-test 111.6***
Variance (county/city) 0.21
Std. Err. 0.07
ICC 0.06
N 9930
Areas 21

170
VOLUNTEERING AND ACTIVE CITIZENSHIP
TABLE 3 RESULTS OF MIXED-EFFECTS LOGISTIC REGRESSION OF FACTORS ASSOCIATED WITH VOLUNTEERING AT LEAST MONTHLY
Odds Ratio (OR) 95% CI
Age 70+ versus 55-69 0.78 (0.70-0.88)
Gender Male versus female 0.90 (0.81-1.00)
Marital status
Reference: MarriedSingle (never married) 0.84 (0.64-1.09)Separated or divorced 0.85 (0.64-1.13)Widowed 0.88 (0.69-1.13)
Household composition
Reference: Living aloneLiving with spouse 1.02 (0.80-1.31)Living with family or non-family 0.93 (0.76-1.14)
Educational attainment
Reference: Primary or lessSecondary 1.69 (1.47-1.94)Third Level 2.71 (2.32-3.17)
Income
Reference: > €2,500€1,501 up to €2,500 0.94 (0.81-1.09)€1,001 up to €1,500 0.88 (0.74-1.06)€501 up to €1,000 0.51 (0.42-0.63)Missing 0.82 (0.71-0.94)
Occupational status
Reference: Employed/self-employedRetired 1.10 (0.97-1.25)Out of work 0.91 (0.72-1.14)Looking after home/family 0.83 (0.69-0.99)
Material deprivation
Yes versus no 0.51 (0.39-0.66)
Mental health difficulties
Yes versus no 1.07 (0.81-1.40)
Health status Fair/poor versus good/very good 0.56 (0.50-0.64)
Location Reference: Open countryside and villageTowns 1500+ population 1.18 (1.04-1.34)Inner city and suburbs 0.73 (0.61-0.87)
Constant 0.49 (0.33-0.72)
BIC 10619
LL -5203.7
LR-test 115.3***
Variance (county/city)
0.10
Std. Err. 0.04
ICC 0.03
N 9930
Areas 21

171
TABLE 4 RESULTS OF MIXED-EFFECTS LOGISTIC REGRESSION OF FACTORS ASSOCIATED WITH POLITICAL ENGAGEMENT
Odds Ratio (OR) 95% CIAge 70+ versus 55-69 0.76 (0.66-0.88)Gender Female versus male 0.63 (0.55-0.71)
Marital status
Reference: MarriedSingle (never married) 0.80 (0.59-1.09)Separated or divorced 1.24 (0.91-1.68)Widowed 0.71 (0.53-0.95)
Household composition
Reference: Living aloneLiving with spouse 1.01 (0.76-1.34)Living with family or non-family 1.13 (0.89-1.43)
Educational attainment
Reference: Primary or lessSecondary 1.16 (0.99-1.35)Third Level 1.34 (1.12-1.61)
Income
Reference: > €2,500€1,501 up to €2,500 1.12 (0.93-1.35)€1,001 up to €1,500 1.12 (0.90-1.40)€501 up to €1,000 0.97 (0.76-1.22)Missing 1.07 (0.89-1.28)
Occupational status
Reference: Employed/self-employedRetired 0.84 (0.72-0.98)Out of work 0.72 (0.56-0.93)Looking after home/family 0.76 (0.60-0.95)
Material deprivation Yes versus no 1.31 (1.05-1.64)Mental health difficulties
Yes versus no 1.21 (0.91-1.61)
Health status Fair/poor versus good/very good 0.91 (0.79-1.05)
Location Reference: Open countryside and villageTowns 1500+ population 1.51 (1.29-1.77)Inner city and suburbs 1.14 (0.91-1.42)
Constant 0.40 (0.25-0.63)BIC 8107.12LL -3947.7LR-test 120.39***Variance 0.15Std. Err. 0.05ICC 0.04N 9,930Areas 21
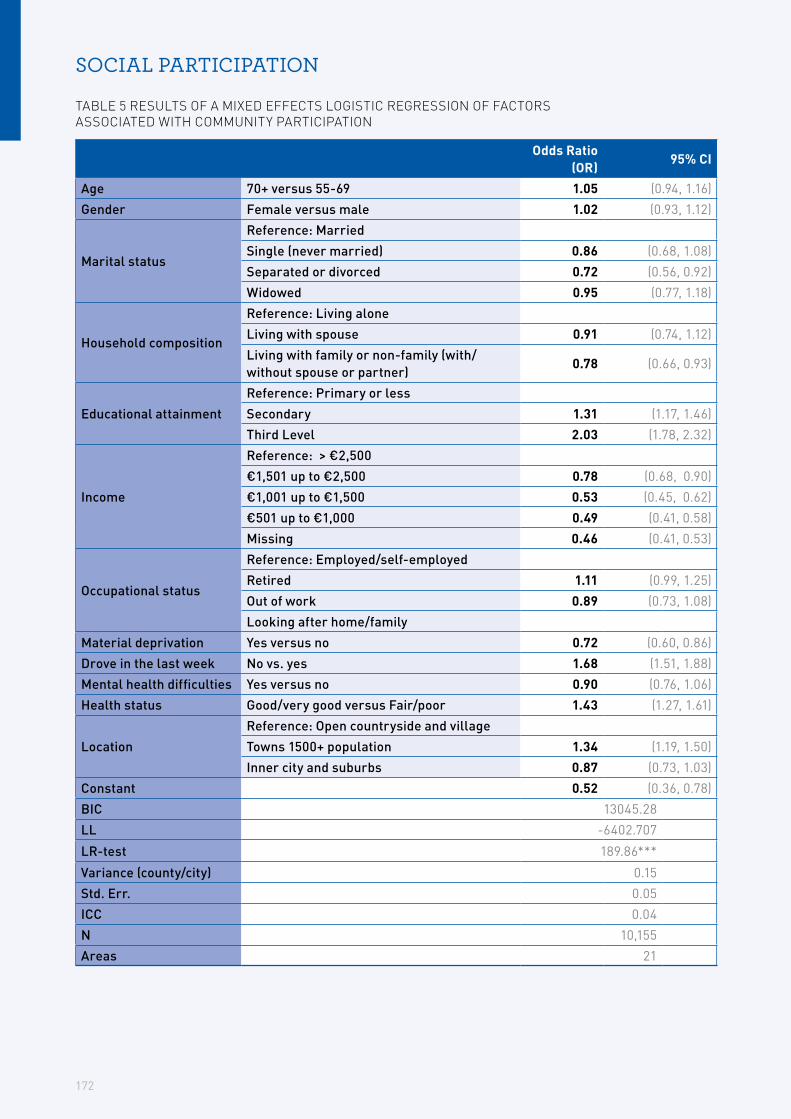
172
SOCIAL PARTICIPATION
TABLE 5 RESULTS OF A MIXED EFFECTS LOGISTIC REGRESSION OF FACTORS ASSOCIATED WITH COMMUNITY PARTICIPATION
Odds Ratio (OR)
95% CI
Age 70+ versus 55-69 1.05 (0.94, 1.16)Gender Female versus male 1.02 (0.93, 1.12)
Marital status
Reference: MarriedSingle (never married) 0.86 (0.68, 1.08)Separated or divorced 0.72 (0.56, 0.92)Widowed 0.95 (0.77, 1.18)
Household composition
Reference: Living aloneLiving with spouse 0.91 (0.74, 1.12)Living with family or non-family (with/without spouse or partner)
0.78 (0.66, 0.93)
Educational attainment Reference: Primary or lessSecondary 1.31 (1.17, 1.46)Third Level 2.03 (1.78, 2.32)
Income
Reference: > €2,500€1,501 up to €2,500 0.78 (0.68, 0.90)€1,001 up to €1,500 0.53 (0.45, 0.62)€501 up to €1,000 0.49 (0.41, 0.58)Missing 0.46 (0.41, 0.53)
Occupational status
Reference: Employed/self-employedRetired 1.11 (0.99, 1.25)Out of work 0.89 (0.73, 1.08)Looking after home/family
Material deprivation Yes versus no 0.72 (0.60, 0.86)Drove in the last week No vs. yes 1.68 (1.51, 1.88)Mental health difficulties Yes versus no 0.90 (0.76, 1.06)Health status Good/very good versus Fair/poor 1.43 (1.27, 1.61)
Location Reference: Open countryside and villageTowns 1500+ population 1.34 (1.19, 1.50)Inner city and suburbs 0.87 (0.73, 1.03)
Constant 0.52 (0.36, 0.78)BIC 13045.28LL -6402.707
LR-test 189.86***
Variance (county/city) 0.15Std. Err. 0.05ICC 0.04N 10,155Areas 21

173
TABLE 6 RESULTS OF A MIXED-EFFECTS LOGISTIC REGRESSION OF FACTORS ASSOCIATED WITH MEETING FRIENDS, RELATIVES AND COLLEAGUES AT LEAST ONCE A MONTH
Odds Ratio (OR) 95% CIAge 70+ versus 55-69 0.81 (0.67, 0.97)Gender Female versus male 1.10 (0.93, 1.30)
Marital status
Reference: MarriedSingle (never married) 0.98 (0.68, 1.46)Separated or divorced 1.11 (0.74, 1.66)Widowed 1.04 (0.73, 1.48)
Household composition
Reference: Living aloneLiving with spouse 1.13 (0.78, 1.62)Living with family or non-family (with/without spouse or partner)
0.85 (0.66, 1.10)
Educational attainment Reference: Primary or lessSecondary 1.27 (1.07, 1.51)Third Level 1.64 (1.28, 2.10)
Income
Reference: > €2,500€1,501 up to €2,500 0.86 (0.64, 1.16)€1,001 up to €1,500 0.76 (0.55, 1.03)€501 up to €1,000 0.71 (0.52, 0.97)Missing 0.79 (0.60, 1.04)
Occupational status
Reference: Employed/self-employedRetired 1.25 (0.98, 1.58)Out of work 0.92 (0.68, 1.25)Looking after home/family 0.89 (0.68, 1.19)
Material deprivation Yes versus no 0.48 (0.39, 0.59)Mental health difficulties Yes versus no 0.80 (0.63, 1.03)Drove in the last week No vs. yes 1.75 (1.48, 2.09)Health status Fair/poor versus good/very good 1.44 (1.19, 1.74)
Location
Reference: Open countryside and villageTowns 1500+ population 1.11 (0.91, 1.36)Inner city and suburbs 0.99 (0.75, 1.31)
Limiting Illness Reference: No limiting illnessNot limited by illness 1.08 (0.84, 1.40)Limited by illness 0.68 (0.56, 0.83)
Constant 8.41 (4.49, 15.74)BIC 5546.025
LL -2653.026
LR-test 41.48***Variance (county/city) 0.12Std. Err. 0.05ICC 0.04N 10,196Areas 21

174
TRANSPORT
TABLE 7 RESULTS OF MIXED-EFFECTS LOGISTIC REGRESSION FOR FACTORS ASSOCIATED WITH TRANSPORT CAUSES DIFFICULTY SOCIALISING
Odds Ratio (OR) 95% CIAge 70+ versus 55-69 0.96 (0.84, 1.10) Gender Female versus male 0.98 (0.86, 1.10)
Marital status
Reference: MarriedSingle (never married) 1.07 (0.80, 1.44)Separated or divorced 0.96 (0.70, 1.31) Widowed 1.32 (1.00, 1.73)
Household composition
Reference: Living aloneLiving with spouse 0.92 (0.70, 1.21)Living with family or non-family (with/without spouse or partner)
0.78 (0.63, 0.95)
Educational attainment Reference: Primary or lessSecondary 1.08 (0.94, 1.24)Third Level 1.38 (1.16, 1.65)
Income
Reference: > €2,500€1,501 up to €2,500 0.89 (0.73, 1.09)€1,001 up to €1,500 1.09 (0.87, 1.35)€501 up to €1,000 1.04 (0.83, 1.30)Missing 0.91 (0.76, 1.09)
Occupational status
Reference: Employed/self-employedRetired 0.90 (0.76, 1.06)Out of work 0.83 (0.65, 1.06)Looking after home/family 0.82 (0.66, 1.03)
Material deprivation Yes versus no 2.36 (1.95, 2.84) Mental health difficulties Yes versus no 1.59 (1.25, 2.03)Health status Fair/poor versus good/very good 1.65 (1.42, 1.91)
Longstanding illness
Reference: noYes – with no limitation 0.58 (0.48, 0.71)Yes – limited 1.07 (0.92, 1.26)Yes – severely limited 1.91 (1.53, 2.38)
Driven in the past week Yes versus no 0.21 (0.18, 0.24)
Location
Reference: Open countryside and villageTowns 1500+ population 1.04 (0.89, 1.24)City suburbs 0.83 (0.69, 0.99)Inner city 0.65 (0.51, 0.83)
Constant 0.63 (0.38, 1.03) BIC 8418.966LL -4080.78LR-test 221.20***Variance (county/city) 0.24Std. Err. 0.07ICC 0.07N 9828Areas 21

175
TABLE 8 RESULTS OF MIXED EFFECTS LOGISTIC REGRESSION FOR FACTORS ASSOCIATED WITH TRANSPORT CAUSES DIFFICULTY DOING ESSENTIAL TASKS
Odds Ratio (OR) 95% CI
Age 70+ versus 55-69 1.02 (0.88, 1.18)Gender Female versus male 0.94 (0.82, 1.07)
Marital status
Reference: MarriedSingle (never married) 1.12 (0.81, 1.55)Separated or divorced 0.96 (0.68, 1.36)Widowed 1.48 (1.10, 1.99)
Household composition
Reference: Living aloneLiving with spouse 1.00 (0.74, 1.34)Living with family or non-family (with/without spouse or partner)
0.82 (0.66, 1.02)
Educational attainment Reference: Primary or lessSecondary 1.12 (0.96, 1.29)Third Level 1.51 (1.24, 1.83)
Income
Reference: > €2,500€1,501 up to €2,500 0.78 (0.63, 0.98)€1,001 up to €1,500 1.07 (0.84, 1.36)€501 up to €1,000 0.99 (0.77, 1.26)Missing 1.00 (0.82, 1.23)
Occupational status
Reference: Employed/self-employedRetired 0.93 (0.77, 1.12)Out of work 0.90 (0.69, 1.17)Looking after home/family 0.89 (0.70, 1.13)
Material deprivation Yes versus no 2.33 (1.92, 2.84)Mental health difficulties Yes versus no 1.54 (1.19, 1.99)Health status Fair/poor versus good/very good 1.76 (1.50, 2.06)
Longstanding illness
Reference: NoYes – with no limitation 0.58 (0.46, 0.72)Yes – limited 1.17 (0.99, 1.39)Yes – severely limited 2.53 (2.01, 3.18)
Driven in the past week Yes versus no 0.18 (0.16, 0.21)
Location
Reference: Open country and villageTowns 1500+ population 0.99 (0.81, 1.20)City suburb 0.73 (0.60, 0.89)Inner city 0.43 (0.33, 0.56)
Constant 0.45 (0.26, 0.77)BIC 7303.629LL -3523.09LR-test 228.07***Variance (county/ city) 0.30Std. Err. 0.02ICC 0.08N 9847Areas 21

176
TABLE 9 RESULTS OF MIXED-EFFECTS LOGISTIC REGRESSION FOR FACTORS ASSOCIATED WITH TRANSPORT CAUSES DIFFICULTY GETTING TO HEALTH OR SOCIAL CARE APPOINTMENTS
Odds Ratio (OR) 95% CIAge 70+ versus 55-69 1.07 (0.92, 1.24)Gender Female versus male 0.94 (0.82, 1.08)
Marital status
Reference: MarriedSingle (never married) 1.07 (0.79, 1.47)Separated or divorced 0.93 (0.66, 1.30)Widowed 1.10 (0.82, 1.47)
Household composition
Reference: Living aloneLiving with spouse 0.79 (0.59, 1.06)Living with family or non-family (with/without spouse or partner)
0.78 (0.63, 0.97)
Educational attainment Reference: Primary or lessSecondary 1.12 (0.96, 1.29)Third Level 1.27 (1.04, 1.54)
Income
Reference: > €2,500€1,501 up to €2,500 0.88 (0.70, 1.09)€1,001 up to €1,500 1.26 (1.00, 1.59)€501 up to €1,000 1.08 (0.85, 1.37)Missing 0.85 (0.69, 1.04)
Occupational status
Reference: Employed/self-employedRetired 0.89 (0.74, 1.08)Out of work 0.82 (0.63, 1.06)Looking after home/family 0.79 (0.62, 1.01)
Material deprivation Yes versus no 2.31 (1.90, 2.80)Mental health difficulties Yes versus no 1.60 (1.25,2.06)Health status Fair/poor versus good/very good 1.73 (1.48, 2.02)
Longstanding illness
Reference: noYes – with no limitation 0.75 (0.61, 0.92)Yes – limited 1.30 (1.10, 1.54)Yes – severely limited 2.48 (1.98, 3.11)
Driven in the past week Yes versus no 0.22 (0.19, 0.25)
Location
Reference: Open country and villageTowns 1500+ population 0.93 (0.77, 1.13)City suburb 0.76 (0.62, 0.92)Inner city 0.40 (0.31, 0.53)
Constant 0.49 (0.28, 0.83)BIC 7460.286LL -3601.41LR-test 215.81***Variance (county/city) 0.29Std. Err. 0.10ICC 0.08N 9851Areas 21

177
HEALTHY AGEING
TABLE 10 RESULTS OF A MIXED-EFFECTS LOGISTIC REGRESSION OF FACTORS ASSOCIATED WITH GOOD OR VERY GOOD SELF-RATED HEALTH
Odds Ratio (OR) 95% CIAge 55-69 versus 70+ 1.44 (1.29-1.62)Gender Female versus male 1.16 (1.04-1.29)
Marital status
Reference: Seperated/divorcedMarried/living with partner 1.75 (1.34-2.30)Single (never married) 1.40 (1.11-1.77)Widowed 1.10 (0.88-1.36)
Household composition
Reference: Living aloneLiving with spouse 1.03 (0.86-1.22)Living with family or non-family (with/without spouse or partner)
0.99 (0.82-1.20)
Educational attainment
Reference: Primary or lessLower secondary 1.38 (1.22-1.57)Upper secondary 1.79 (1.55-2.06)Third Level 1.77 (1.54-2.05)
Income
Reference: < €1,000€1,001 up to €1,500 1.04 (0.89-1.22)€1,501 up to €2,500 1.15 (0.98-1.36)> €2,501 1.20 (0.99-1.45)Missing category 1.29 (1.11-1.51)
Occupational status
Reference: Out of workLooking after home/family 2.50 (2.02-3.09)Retired 2.37 (1.98-2.83)Employed/self-employed 5.88 (4.76-7.25)
Material deprivation No versus yes 2.59 (2.17-3.08)
Location Reference: Open countrysideVillage 1.06 (0.91-1.25)Town, city or city suburb 1.09 (0.94-1.26)
Smoking StatusReference: current smokerPast smoker 1.27 (1.10-1.46)Never smoked 2.00 (1.75-2.30)
Alcohol Consumption
Reference: NeverWeekly 2.07 (1.79-2.39)Monthly 1.59 (1.42-1.79)Changed drinking patterns in last six months
0.89 (0.70-1.31)
Constant 0.01 (0.01-0.02)BIC 10707.74LL -5229.45LR-test 77.80***Variance (county/ city) 0.08Std. Err. 0.03ICC 0.02N 10,063Areas 21

178
TABLE 11 RESULTS OF MIXED-EFFECTS LOGISTIC REGRESSION OF FACTORS ASSOCIATED WITH WALKING IN LOCAL AREA FOR HEALTH OR FITNESS
Odds Ratio (OR) 95% CI
Age 55-69 versus 70+ 1.55 (1.37-1.75)
Gender Female versus male 1.18 (1.06-1.32)
Marital status
Reference: Separated/divorcedMarried/living with partner 1.17 (0.89-1.54)Single (never married) 0.94 (0.74-1.20)Widowed 0.80 (0.64-1.01)
Household composition
Reference: Living aloneLiving with spouse 0.89 (0.70-1.13)Living with family or non-family (with/without spouse or partner)
0.99 (0.82-1.19)
Educational attainment
Reference: Primary/lessLower secondary 1.17 (1.02-1.34)Upper secondary 1.38 (1.20-1.60)Third Level 1.60 (1.38-1.86)
Income
Reference: < €1,000€1,001 up to €1,500 1.25 (1.05-1.50)€1,501 up to €2,500 1.20 (1.01-1.42)> €2,501 1.16 (0.96-1.41)Missing category 1.53 (1.30-1.79)
Occupational status
Reference: out of workLooking after home or family 1.17 (1.02-1.34)Retired 1.38 (1.20-1.60)Employed/self-employed 1.60 (1.38-1.86)
Material deprivation No versus yes 2.17 (1.80-2.63)
Alcohol consumption
Reference: NeverWeekly 1.95 (1.69-2.25)Monthly 1.36 (1.21-1.53)Changed drinking patterns 2.65 (2.02-3.49)
Smoking statusCurrent smokerPast smoker 1.72 (1.48-1.99)Never smoked 1.43 (1.25-1.64)
Chronic conditionsReference: 2+ chronic conditionsOne chronic condition 1.27 (1.13-1.43)No chronic condition 1.33 (1.18-1.50)
LocationReference: Open countrysideVillage 1.23 (1.05-1.45)Town, city or city suburb 1.09 (0.93-1.27)
Safe out and about during the day
Reference: feels unsafeFeels neither safe nor unsafe 0.77 (0.52-1.15)Feels safe 2.50 (1.79-3.49)

179
Safe out and about during the night
Reference: feels unsafeFeels neither safe nor unsafe 1.05 (0.88-1.25)Feels safe 0.96 (0.83-1.10)
Constant 0.02 (0.01-0.04)BIC 10519.58LL -5108.93LR-test 288.80***
Variance (county/ city) 0.24
Std. Err. 0.08ICC 0.07N 9,348Areas 21

180
TABLE 12 RESULTS OF A MIXED-EFFECTS LOGISTIC REGRESSION OF FACTORS ASSOCIATED WITH GETTING AT LEAST 150 MINUTES OF MODERATE PHYSICAL ACTIVITY PER WEEK
Odds Ratio (OR) 95% CIAge 55-69 versus 70+ 1.46 (1.31-1.62)Gender Male versus female 1.21 (1.09-1.33)
Marital status
Reference: Separated/divorcedMarried/living with partner 1.06 (0.83-1.36)Single (never married) 0.96 (0.77-1.20)Widowed 0.74 (0.60-0.91)
Household composition
Reference: Living aloneLiving with spouse 0.83 (0.67-1.03)Living with family or non-family (with/without spouse or partner)
1.03 (0.86-1.22)
Educational attainment
Reference: Primary or lessLower secondary 1.63 (1.44-1.85)Upper secondary 1.76 (1.55-2.01)Third Level 1.99 (1.75-2.28)
Income
Reference: < €1,000€1,001 up to €1,500 1.12 (0.96-1.32)€1,501 up to €2,500 1.55 (1.33-1.81)> €2,501 1.48 (1.24-1.76)Missing category 1.44 (1.24-1.67)
Occupational status
Reference: Out of workLooking after home/family 1.47 (1.18-1.81)Retired 1.55 (1.30-1.87)Employed/self-employed 1.67 (1.38-2.02)
Material deprivation No versus yes 1.86 (1.54-2.24)
LocationReference: Open countrysideVillage 0.94 (0.81-1.08)Town, city or city suburb 1.12 (0.97-1.28)
Chronic conditionsReference: 2+ chronic conditionsOne chronic condition 1.26 (1.14-1.41)No chronic condition 1.67 (1.49-1.86)
Alcohol consumption
Reference: NeverWeekly 1.79 (1.58-2.03)Monthly 1.25 (1.12-1.39)Changed drinking patterns 1.17 (0.94-1.46)
Smoking statusCurrent smokerPast smoker 1.34 (1.17-1.53)Never smoked 1.24 (1.09-1.41)
Safe out and about during the day
Reference: feels unsafeFeels neither safe nor unsafe 1.15 (0.78-1.71)Feels safe 2.29 (1.63-3.20)
Safe out and about during the night
Reference: feels unsafeFeels neither safe nor unsafe 1.13 (0.96-1.32)Feels safe 1.00 (0.88-1.13)
Constant 0.01 (0.01-0.02)

181
BIC 12501.07LL -6103.37LR-test 91.65***Variance (county/ city) 0.07Std. Err. 0.02ICC 0.02N 9,817Areas 21

182
TABLE 13 RESULTS OF A MIXED-EFFECTS LOGISTIC REGRESSION OF FACTORS ASSOCIATED WITH FLU VACCINATION AGE 65+
Odds Ratio (OR) 95% CI
Age 75+ versus 65-74 1.77 (1.54-2.04)Gender Male versus female 1.15 (1.00-1.32)
Marital status
Reference: Separated/divorcedMarried/living with spouse 1.64 (1.08-2.49)Single/never married 1.13 (0.80-1.59)Widowed 1.36 (0.99-1.86)
Household composition
Reference: Living with family or non-family(with/without spouse or partner)Living with spouse/partner 1.08 (0.82-1.45)Living alone 1.40 (1.11-1.77)
Educational attainment
Reference: Primary or lessLower secondary 1.11 (0.94-1.31)Upper secondary 1.03 (0.85-1.23)Third Level 1.14 (0.94-1.37)
Income
Reference: < €1,000€1,001 up to €1,500 1.04 (0.85-1.29)€1,501 up to €2,500 1.01 (0.81-1.24)> €2,501 0.94 (0.73-1.20)Missing category 1.08 (0.88-1.32)
Occupational status
Reference: Out of workEmployed/self-employed 0.91 (0.59-1.41)Retired 1.42 (0.96-2.08)Looking after home/family 1.59 (1.05-2.41)
Material deprivation Yes versus no 1.31 (1.00-1.72)Needs assistance with mobility
Yes versus no 1.65 (1.22-2.06)
Health status Fair/poor/very poor versus good/very good 1.36 (1.17-1.57)
Chronic conditions NoneOne 1.34 (1.14-1.58)Two or more 1.51 (1.28-1.78)
Health cover
Reference: no coverJoint cover 4.59 (3.29-6.40)Health insurance only 1.71 (1.22-2.39)GP visit card only 1.78 (1.10-2.88)Full medical card only 3.76 (2.71-5.22)
Alcohol consumption
Reference: weeklyMonthly 1.04 (0.88-1.23)Never 1.06 (0.89-1.27)Changed drinking pattern within last 6 months
0.96 (0.70-1.32)
Smoking statusReference: Current smokerPast smoker 1.49 (1.23-1.84)Never smoked 1.29 (1.04-1.52)

183
LocationReference: Open countrysideVillage 1.03 (0.85-1.26)Town, city or city suburb 1.13 (0.94-1.37)
Difficulty accessing health services
With difficulty versus no difficulty 0.88 (0.76-1.04)
Drive oneself in the past week
No versus yes 1.04 (0.89-1.22)
Constant 0.01 (0.00-0.02)BIC 6838.57LL -3259.41LR-test 88.57***Variance (county/ city) 0.12Std. Err. 0.04ICC 0.04N 5,665Areas 21

184
TABLE 14 RESULTS OF MIXED-EFFECTS LOGISTIC REGRESSIONS OF FACTORS ASSOCIATED WITH HEALTH CHECKS (CHOLESTEROL BLOOD TESTS AND BLOOD PRESSURE CHECKS)
Cholesterol test Blood pressure check
Odds Ratio (OR)
95% CIOdds Ratio (OR)
95% CI
Age 70+ versus 55-69 1.16 (1.00-1.35) 1.24 (1.04-1.48)
Gender Female versus male 1.15 (1.02-1.30) 1.24 (1.08-1.42)
Marital status
Reference: Separated/divorcedMarried/living with partner 1.22 (0.91-1.64) 1.22 (0.88-1.69)Single (never married) 1.13 (0.87-1.47) 1.09 (0.81-1.46)Widowed 1.27 (0.99-1.64) 1.23 (0.92-1.65)
Household composition
Reference: Living with family or non-family (with/without spouse or partner)Living with spouse 1.23 (1.02-1.47) 1.10 (0.90-1.34)Living alone 1.01 (0.81-1.26) 1.11 (0.87-1.43)
Educational attainment
Reference: TertiaryUpper secondary 0.89 (0.76-1.04) 0.87 (0.73-1.03)Lower secondary 0.95 (0.80-1.12) 1.10 (0.91-1.33)Primary or less 1.09 (0.91-1.31) 1.16 (0.94-1.43)
Income
Reference: > €2,500€1,501 up to €2,500 1.13 (0.94-1.36) 1.21 (0.98-1.49)€1,001 up to €1,500 1.18 (0.95-1.47) 1.06 (0.83-1.35)€501 up to €1,000 0.92 (0.73-1.15) 0.80 (0.62-1.03)Missing category 0.88 (0.75-1.04) 0.82 (0.68-0.98)
Occupational status
Reference: Employed/self-employedRetired 1.40 (1.21-1.63) 1.63 (1.39-1.92)Out of work 1.04 (0.82-1.32) 1.16 (0.90-1.52)Looking after home/family 1.25 (1.02-1.53) 1.64 (1.30-2.07)
Material deprivation No versus yes 1.67 (1.34-2.07) 1.49 (1.15-1.92)Needs assistance with mobility
Yes versus no 1.26 (0.96-1.64) 1.52 (1.07-2.16)
Health status Fair/poor/very poor versus good/very good
1.30 (1.12-1.51) 1.33 (1.12-1.59)
Chronic conditions NoneOne 2.19 (1.91-2.52) 2.32 (1.99-2.70)Two or more 3.07 (2.65-3.56) 3.86 (3.25-4.58)
Health cover
Reference: No coverJoint cover 3.85 (3.06-4.85) 4.78 (3.70-6.17)Health insurance only 2.58 (2.12-3.14) 2.84 (2.31-3.50)GP visit card only 1.51 (1.08-2.09) 1.40 (0.99-1.98)Full medical card only 2.50 (2.02-3.09) 2.69 (2.14-3.38)

185
Alcohol consumption
Reference: WeeklyMonthly 0.89 (0.77-1.03) 0.87 (0.74-1.02)Not at all 1.00 (0.85-1.19) 0.98 (0.81-1.19)Pattern changed drinking pattern in last 6 months
1.26 (0.94-1.69) 0.92 (0.67-1.26)
Smoking statusReference: Current smokerPast smoker 1.65 (1.39-1.95) 1.81 (1.50-2.19)Never smoked 1.43 (1.23-1.67) 1.47 (1.24-1.74)
Location
Reference: Town, city or city suburb)Village 1.31 (1.11-1.54) 1.26 (1.04-1.51)Open countryside 1.36 (1.13-1.64) 1.31 (1.06-1.62)
Difficulty accessing health services
With difficulty versus no difficulty
1.07 (0.91-1.25) 1.24 (1.03-1.49)
Driven in the past week Yes versus no 1.32 (1.13-1.53) 1.42 (1.20-1.69)Constant 0.04 (0.02-0.08) 0.03 (0.01-0.08)
BIC 8481.83 6992.87
LL -4072.69 -3328.14LR-test 93.02*** 62.78***Variance (county/ city) 0.11 0.11Std. Err. 0.04 0.04ICC 0.03 0.03N 8,894 8,932Areas 21 21

186
HEALTH SERVICES
TABLE 15 RESULTS OF A MIXED-EFFECTS LOGISTIC REGRESSION FOR FACTORS ASSOCIATED WITH DIFFICULTY ACCESSING LOCAL HEALTH SERVICES
Odds Ratio (OR) 95% CI
Age 70+ versus 55-69 1.26 (1.09-1.46)Gender Male versus female 1.05 (0.92-1.19)
Marital status
Reference: MarriedSingle (never married) 1.35 (0.95-1.91)Separated or divorced 0.97 (0.72-1.31)Widowed 1.21 (0.91-1.60)
Household composition
Reference: Living aloneLiving with spouse 0.96 (0.76-1.20)Living with family or non-family (with/without spouse or partner)
1.30 (1.04-1.64)
Educational attainment
Reference: Primary or lessLower secondary 1.07 (0.90-1.26)Upper secondary 1.03 (0.86-1.24)Third Level 1.19 (0.99-1.42)
Income
Reference: < €1,000)€1,001 up to €1,500 0.96 (0.79-1.18)€1,501 up to €2,500 0.87 (0.70-1.06)> €2,501 0.58 (0.46-1.74)Missing 1.37 (1.13-1.65)
Occupational status
Reference: Employed/self-employedRetired 0.97 (0.82-1.16)Out of work 1.00 (0.77-1.29)Looking after home/family 1.03 (0.82-1.30)
Material deprivation Yes versus no 1.49 (1.20-1.84)Needs assistance with mobility
Yes versus no 3.00 (2.43-3.69)
Health status Fair/poor/very poor versus good/very good 1.74 (1.52-1.99)
LocationReference: Town, city, city suburbVillage 3.03 (2.54-3.61)Open countryside 6.66 (5.49-8.07)
Drove themselves in past week
No versus yes 1.81 (1.57-2.10)
Satisfied with public transport
Fair/poor/very poor versus good/excellent 2.53 (2.21-2.90)
Constant 0.00 (0.00-0.00)BIC 7396.60LL -3580.13LR-test 229.31***Variance (county/ city) 0.29Std. Err. 0.10ICC 0.08N 8,866Areas 21

187
HOUSING
TABLE 16 RESULTS OF A MIXED-EFFECTS LOGISTIC REGRESSION OF FACTORS ASSOCIATED WITH HOUSING PROBLEMS (MAINTENANCE, CONDITIONS, FACILITIES AND HEATING)
Maintenance Conditions Facilities Heating*
OR 95% CI OR 95% CI OR 95% CI OR 95% CIAge 70+ versus 55-69 1.36 (1.21, 1.54) 0.99 (0.84, 1.18) 1.01 (1.09, 1.15) 0.77 (0.65, 0.92)Gender Female versus male 1.35 (1.21, 1.50) 1.00 (0.86, 1.16) 1.09 (0.97, 1.21) 1.05 (0.90, 1.22)
Marital status
Reference: Married
Single (never married) 1.04 (0.82, 1.36) 1.45 (1.01, 2.07) 1.03 (0.78, 1.37) 1.51 (1.03, 2.21)
Separated or divorced 1.36 (1.03, 1.80) 1.81 (1.26, 2.61) 1.24 (0.92, 1.66) 1.80 (1.22, 2.65)
Widowed 1.28 (1.00, 1.64) 1.26 (0.90, 1.78) 1.29 (0.99, 1.68) 1.59 (1.10, 2.28)
Household composition
Reference: Living alone
Living with spouse 0.87 (0.68, 1.12) 1.15 (0.82, 1.62) 0.91 (0.70, 1.18) 1.10 (0.77, 1.58)Living with family or non-family (with/without spouse or partner)
0.87 (0.73, 1.05) 1.13 (0.89, 1.44) 0.71 (0.58, 0.87) 0.73 (0.56, 0.94)
Educational attainment
Reference: Primary or less
Secondary 0.88 (0.78, 1.00) 0.68 (0.58, 0.81) 0.88 (0.78, 1.00) 0.84 (0.71, 0.99)
Third Level 0.82 (0.70, 0.95) 0.64 (0.51, 0.79) 0.90 (0.76, 1.05) 0.69 (0.55, 0.86)
Income
Reference: > €2,500
€1,501 up to €2,500 1.08 (0.90, 1.29) 0.90 (0.70, 1.16) 1.15 (0.96, 1.37) 1.02 (0.78, 1.34)
€1,001 up to €1,500 1.37 (1.13, 1.66) 1.36 (1.04, 1.77) 1.16 (0.95, 1.42) 1.27 (0.95, 1.68)
€501 up to €1,000 1.42 (1.16, 1.73) 1.26 (0.96, 1.65) 1.07 (0.87, 1.32) 1.44 (1.08, 1.90)
Missing 0.93 (0.78, 1.10) 0.80 (0.63, 1.02) 0.91 (0.76, 1.08) 1.16 (0.91, 1.47)
Material deprivation
Yes versus no 3.32 (2.79, 3.96) 2.97 (2.43, 3.62) 2.71 (2.28, 3.21) -- --
Occupational status
Reference: Employed/self-employed
Retired 1.24 (1.06, 1.44) 0.81 (0.66, 0.99) 0.99 (0.85, 1.16) 0.70 (0.57, 0.86)
Out of work 1.53 (1.23, 1.90) 1.30 (0.99, 1.69) 1.29 (1.04, 1.61) 1.53 (1.17, 1.98)Looking after home/family
1.04 (0.86, 1.27) 0.63 (0.48, 0.84) 1.05 (0.86, 1.28) 0.96 (0.74, 1.24)
Mental health difficulties
Yes versus no 1.33 (1.05, 1.67) 1.33 (1.01, 1.76) 0.99 (0.77, 1.26) 1.45 (1.10, 1.91)
Health status Fair/poor versus good/very good
1.71 (1.53, 1.91) 1.33 (1.14, 1.56) 1.31 (1.16, 1.47) 1.71 (1.46, 1.99)
Location
Reference: Open countryside and village
Towns 1500+ population 0.69 (0.59, 0.81) 0.74 (0.59, 0.93) 1.04 (0.87, 1.24) 0.98 (0.77, 1.25)
City (suburbs) 0.75 (0.64, 0.89) 0.80 (0.64, 1.00) 1.18 (1.00, 1.41) 1.40 (1.12, 1.75)
City (inner) 0.82 (0.65, 1.03) 0.82 (0.61, 1.10) 1.52 (1.20, 1.91) 0.99 (0.73, 1.36)
Constant 0.10 (0.06, 0.15) 0.12 (0.07, 0.20) 0.16 (0.10, 0.24) 0.09 (0.05, 0.17)
BIC 10075.91 6157.89 9670.402 6032.031
LL -4927.516 -2968.505 -4724.761 -2910.128
LR-test 370.37*** 93.94*** 190.02 *** 196.21***Variance (county/city)
0.29 0.21 0.2 0.3
Std. Err. 0.9 0.07 0.07 0.1ICC 0.08 0.06 0.06 0.09
N 9930 9930 9973
Areas 21 21 21
*Note: material deprivation was not included in the model for Heating as this heating difficulty is included in the measure of material deprivation.

188
PUBLIC SPACES AND BUILDINGS
TABLE 17 RESULTS OF A MIXED-EFFECTS LOGISTIC REGRESSION OF FACTORS ASSOCIATED WITH DIFFICULTY WALKING IN THE LOCAL AREA
Odds Ratio (OR) 95% CI
Age 70+ versus 55-69 2.16 (1.88, 2.49)Gender Gender (male versus female) 1.35 (1.19, 1.54)
Marital status
Reference: MarriedSingle (never married) 0.79 ( 0.57, 1.08)Separated or divorced 0.79 (0.57, 1.10)Widowed 1.15 (0.87, 1.54)
Household composition
Reference: living aloneLiving with spouse 0.65 (0.48, 0.87)Living with spouse and/or others (family or non-family)
0.89 (0.72, 1.10)
Educational attainment
Reference: Primary/lessSecondary 0.75 (0.65, 0.86)Third Level 0.72 (0.60, 0.86)
Income
Reference: > €2,500€1,501 up to €2,500 1.04 (0.83, 1.29)€1,001 up to €1,500 1.48 (0.91, 1.45)€501 up to €1,000 1.46 (1.15, 1.85)Missing 1.12 (0.92, 1.38)
Occupational status
Reference: employed/self-employedRetired 1.78 (1.45, 2.19)Out of work 1.92 (1.45, 2.53)Looking after home/family 1.66 (1.29, 2.14)
Material deprivation
Yes versus no 1.35 (1.10, 1.65)
Health status Fair/poor versus good/very good 0.30 (0.26, 0.34)
Location Reference: Open country and villagesTowns 1500+ population 0.74 (0.63, 0.87)Inner city and suburbs 0.68 (0.55, 0.84)
Limiting IllnessReference: no limiting illnessNot limited by illness 0.67 (0.54, 0.82)Limited by illness 3.41 (2.96, 3.94)
Constant 0.07 (0.04, 0.11)BIC 7576.631LL -3678.03LR-test 37.10 ***Variance (county/city)
0.07
Std. Err. 0.03ICC 0.02N 9,803Areas 21

189
TABLE 18 RESULTS OF MIXED-EFFECTS LOGISTIC REGRESSIONS OF FACTORS ASSOCIATEDWITH DIFFICULTIES ACCESSING SERVICES (ESSENTIAL SERVICES AND SOCIAL SERVICES)
Difficulty accessing essential services
Difficulty accessing social services
Odds Ratio (OR)
95% CIOdds Ratio
(OR)95% CI
Age 70+ versus 55-69 1.22 (1.10, 1.35) 1.09 (0.98, 1.21)
Gender Male versus female 1.05 (0.95, 1.15) 1.09 (0.99, 1.20)
Marital status
Reference: Married
Single (never married) 0.77 (0.61, 0.97) 0.82 (0.64, 1.03)
Separated or divorced 0.75 (0.59, 0.96) 0.86 (0.66, 1.10)
Widowed 0.94 (0.76, 1.16) 1.11 (0.90, 1.38)
Household composition
Reference: Living alone
Living with spouse 0.84 (0.68, 1.04) 0.90 (0.73, 1.12)
Living with family or non-family (with/without spouse or partner)
0.89 (0.75, 1.05) 0.99 (0.83, 1.17)
Educational attainment
Reference: Primary or less
Secondary 1.03 (0.92, 1.15) 1.11 (0.99, 1.24)
Third level 1.26 (1.10, 1.45) 1.46 (1.27, 1.68)
Income
Reference: > €2,500
€1,501 up to €2,500 0.84 (0.73, 0.98) 0.87 (0.75, 1.01)
€1,001 up to €1,500 0.92 (0.78, 1.08) 0.81 (0.68, 0.96)
€501 up to €1,000 1.05 (0.88, 1.25) 0.71 (0.60, 0.85)
Missing category 0.84 (0.73, 0.98) 0.83 (0.72, 0.95)
Occupational status
Reference: Employed/self-employed
Retired 0.91 (0.81, 1.03) 1.08 (0.92, 1.19)
Out of work 1.07 (0.89, 1.29) 0.97 (0.80, 1.19)
Looking after home/family 0.87 (0.74, 1.02) 0.90 (0.78, 1.07)
Material deprivation Yes versus no 1.27 (1.07, 1.50) 1.38 (1.17, 1.64)
Drove in the last week No versus yes 0.60 (0.54, 0.67) 0.58 (0.52, 0.65)
Health status Fair/poor/very poor versus good/very good
0.66 (0.59, 0.74) 0.75 (0.66 , 0.84)
Location
Reference: Open countryside
Village 0.35 (0.32, 0.40) 0.52 (0.46, 0.58)
Town, city or city suburb 0.49 (0.42, 0.58) 0.80 (0.68, 0.95)
Limiting Illness
Reference: no limiting illness
Not limited by illness 0.86 (0.76, 0.99) 0.92 (0.80, 1.06)
Limited by illness 1.50 (1.33, 1.69) 1.42 (1.25, 1.60)
Constant 1.59 (1.07, 2.36) 0.71 (0.48, 1.05)
BIC 12748.86 12074.59
LL -6258.99 -5921.855
LR-test 327.71*** 204.08***
Variance (county/ city) 0.19 0.14
Std. Err. 0.06 0.05
ICC 0.05 0.04
N 10,250 10,250
Areas 21 21

190
SAFETY AND SECURITY
TABLE 19 RESULTS OF MIXED-EFFECTS LOGISTIC REGRESSION OF FACTORS ASSOCIATED WITH FEELING UNSAFE ‘OUT AND ABOUT’ DURING THE DAY
Odds Ratio (OR) 95% CI
Age 70+ versus 55-69 1.22 (0.88, 1.69)Gender Female versus male 1.69 (1.24, 2.30)
Marital status
Reference: MarriedSingle (never married) 0.87 (0.41, 1.88)Separated or divorced 0.93 (0.43, 2.02)Widowed 0.85 (0.42, 1.72)
Household composition
Reference: Living aloneLiving with spouse 1.00 (0.49, 2.05)Living with family or non-family (with/without spouse or partner)
0.92 (0.56, 1.50)
Educational attainment
Reference: Primary or lessSecondary 0.83 (0.61, 1.13)Third Level 0.65 (0.41, 1.04)
Income
Reference: > €2,500€1,501 up to €2,500 2.64 (1.24, 5.58)€1,001 up to €1,500 3.18 (1.48, 6.84)€501 up to €1,000 4.37 (2.04, 9.33)Missing category 3.20 (1.55-6.58)
Occupational status
Reference: Employed/self-employedRetired 0.73 (0.47, 1.14)Out of work 0.77 (0.43, 1.36)Looking after home/family 0.82 (0.48, 1.38)
Material deprivation Yes versus no 2.44 (1.71, 3.48)Health status Fair/poor versus good/very good 0.71 (0.50, 1.01)
Location Reference: Open country and villagesTowns 1500+ population 0.90 (0.64, 1.27)Inner city and suburbs 0.65 (0.40, 1.07)
Limiting Illness Reference: No limiting illnessNot limited by illness 1.10 (0.64, 1.87)Limited by illness 2.61 (1.79, 3.79)
Constant 0.00 (0.00, 0.01)BIC 2172.468LL -975.4723LR-test 23.52***Variance (county/ city)
0.24
Std. Err. 0.11ICC 0.07N 10,200Areas 21

191
TABLE 20 RESULTS OF MIXED-EFFECTS LOGISTIC REGRESSION OF FACTORS ASSOCIATED WITH FEELING UNSAFE ‘OUT AND ABOUT’ AT NIGHT
Odds Ratio (OR) 95% CI
Age 70+ versus 55-69 1.27 (1.11, 1.45)Gender Female versus male 2.35 (2.07, 2.66)
Marital status
Reference: MarriedSingle (never married) 0.84 (0.62, 1.13)Separated or divorced 1.15 (0.85, 1.57)Widowed 0.89 (0.68, 1.17)
Household composition
Reference: Living aloneLiving with spouse 0.87 (0.66, 1.14)Living with family or non-family (with/without spouse or partner)
1.00 (0.81, 1.23)
Educational attainment
Reference: Primary or lessSecondary 0.91 (0.80, 1.05)Third Level 0.78 (0.65, 0.93)
Income
Reference: > €2,500€1,501 up to €2,500 1.37 (1.12, 1.68)€1,001 up to €1,500 1.37 (1.09, 1.72)€501 up to €1,000 1.57 (1.25, 1.98)Missing 1.14 (0.94, 1.40)
Occupational status
Reference: Employed/self-employedRetired 1.24 (1.04, 1.47)Out of work 0.93 (0.71, 1.20)Looking after home/family 1.25 (1.01, 1.55)
Material deprivation Yes versus no 2.23 (1.85, 2.68)Health status Fair/poor versus good/very good 0.94 (0.81, 1.09)
Location Reference: Open countryside and villageTowns 1500+ population 1.58 (1.36, 1.84)Inner city and suburbs 1.46 (1.16, 1.85)
Limiting Illness Reference: No limiting illnessNot limited by illness 1.62 (1.38, 1.92)Limited by illness 2.02 (1.74, 2.36)
Constant 0.02 (0.01, 0.03)BIC 8404.389LL -4091.666LR-test 353.12 ***Variance (county/city) 0.36Std. Err. 0.12ICC 0.10N 10,004Areas 21

192
TABLE 21 RESULTS OF A MIXED-EFFECTS LOGISTIC REGRESSION OF FACTORS ASSOCIATED WITH FEELING UNSAFE IN URBAN ENVIROMENTS
Odds Ratio (OR) 95% CI
Built environment rating 1-14 (low to high) 0.89 (0.87, 0.91)Age 70+ versus 55-69 1.35 (1.13, 1.62)Gender Female versus male 2.15 (1.82, 2.54)
Marital status
Reference: MarriedSingle (never married) 0.81 (0.53, 1.19)Separated or divorced 1.21 (0.81, 1.80)Widowed 0.89 (0.62, 1.27)
Household composition
Reference: Living aloneLiving with spouse 0.86 (0.60, 1.23)Living with family or non-family (with/without spouse or partner)
0.98
Educational attainment Reference: Primary or lessSecondary 0.84 (0.70, 1.01)Third Level 0.68 (0.54, 0.85)
Income
Reference: > €2,500€1,501 up to €2,500 1.64 (1.26, 2.14)€1,001 up to €1,500 1.66 (1.24, 2.23)€501 up to €1,000 1.66 (1.23, 2.26)Missing 1.34
Occupational status
Reference: Employed/self-employedRetired 1.24 (0.97, 1.58)Out of work 1.01 (0.71, 1.44)Looking after home/family 1.04 (0.77, 1.41)
Material deprivation Yes versus no 2.12 (1.63, 2.77) Mental health difficulties Yes versus no 1.17 (0.84, 1.63)Health status Fair/poor versus good/very good 1.29 (1.08, 1.53)
Location
Reference: Open countryside and villageTowns 1500+ population 1.88 (1.48, 2.38)City suburbs 1.65 (1.01, 2.69)Inner city 1.86 (1.36, 2.54)
Constant 0.12 (0.06, 0.09) BIC 4667.161LL -2228.89LR-test 138.40***Variance (county/city) 0.58Std. Err. 0.03ICC 0.09Number of observations 5333Areas 21

193
Combatting Ageism; Respect and Social InclusionTABLE 22 RESULTS OF MIXED EFFECTS LOGISTIC REGRESSION OF FACTORS ASSOCIATED WITH SOCIAL ISOLATION
Odds Ratio (OR) 95% CI
Age 70+ versus 55-69 1.11 (0.95-1.29)
Gender Female versus male 0.92 (0.81-1.06)
Marital status
Reference: married
Single (never married) 2.21 (1.58-3.08)
Separated or divorced 1.93 (1.36-2.75)
Widowed 2.37 (1.72-3.26)
Household composition
Reference: Living alone
Living with spouse 0.84 (0.61-1.15)
Living with family or non-family (with/without spouse or partner)
0.54 (0.44-0.67)
Educational attainment
Reference: Primary or less
Secondary 1.00 (0.86-1.16)
Third Level 1.16 (0.96-1.41)
Income
Reference: > €2,500
€1,501 up to €2,500 0.89 (0.72-1.10)
€1,001 up to €1,500 0.08 (0.69-1.11)
€501 up to €1,000 1.01 (0.80-1.28)
Missing 0.61 (0.50-0.75)
Occupational status
Reference: employed/self-employed
Retired 0.85 (0.70-1.02)
Out of work 1.26 (0.98-1.62)
Looking after home/family 1.17 (0.92-1.48)
Material deprivation Yes versus no 3.16 (2.64-3.80)
Mental health difficulties Yes versus no 2.06 (1.62-2.63)
Health status Fair/poor versus good/very good 2.28 (2.00-2.60)
Location
Reference: Open countryside and villages
Towns 1500+ population 1.10 (0.94-1.30)
Inner city and suburbs 1.01 (0.80-1.29)
Driven as passenger in car Yes versus no 1.04 (0.91-1.19)
Constant 0.10 (0.06-0.16)
BIC 7396.0
LL -3587.7
LR-test 178.0***
Variance (county/city) 0.24
Std. Err. 0.08
ICC 0.07
N 9810
Areas 21

194
TABLE 23 RESULTS OF A MIXED-EFFECTS LOGISTIC REGRESSION OF FACTORS ASSOCIATED WITH PERCEIVED AGEISM
Odds Ratio (OR) 95% CI
Age 70+ versus 55-69 0.93 (0.77-1.13)Gender Male versus female 1.03 (0.87-1.23)
Marital status
Reference: MarriedSingle (never married) 1.34 (0.86-2.07)Separated or divorced 1.11 (0.70-1.75)Widowed 1.09 (0.72-1.66)
Household composition
Reference: Living aloneLiving with spouse 1.03 (0.68-1.56)Living with family or non-family (with/without spouse or partner)
0.73 (0.53-1.02)
Educational attainment Reference: Primary or lessSecondary 0.84 (0.69-1.02)Third Level 0.82 (0.64-1.06)
Income
Reference: > €2,500€1,501 up to €2,500 0.80 (0.59-1.08)€1,001 up to €1,500 1.25 (0.92-1.71)€501 up to €1,000 1.14 (0.83-1.58)Missing 1.28 (0.99-1.67)
Occupational status
Reference: Employed/self-employedRetired 0.76 (0.61-0.96)Out of work 0.93 (0.67-1.30)Looking after home/family 1.01 (0.75-1.36)
Material deprivation Yes versus no 4.03 (3.19-5.08)Mental health difficulties Yes versus no 0.69 (0.47-1.03)Health status Fair/poor versus good/very good 1.52 (1.26-1.83)
Location
Reference: Open countryside and villageTowns 1500+ population 1.70 (1.38-2.09)Inner city and suburbs 0.77 (0.56-1.05)
Constant 0.06 (0.03-0.12)BIC 4742.7LL -2266.4LR-test 182.0***Variance (county/city) 0.52Std. Err. 0.19ICC 0.14N 9207Areas 21

195
TABLE 24 RESULTS OF MIXED-EFFECTS LOGISTIC REGRESSION OF FACTORS ASSOCIATED WITH HAVING A FRIEND BELOW THE AGE OF 30
Odds Ratio (OR) 95% CI
Age 70+ versus 55-69 0.60 (0.54-0.66)Gender Male versus female 0.91 (0.83-1.00)
Marital status
Reference: MarriedSingle (never married) 0.84 (0.66-1.06)Separated or divorced 1.03 (0.80-1.32)Widowed 0.84 (0.68-1.04)
Household composition
Reference: Living aloneLiving with spouse 0.98 (0.79-1.22)Living with family or non-family (with/without spouse or partner)
1.06 (0.89-1.25)
Educational attainment Reference: Primary or lessSecondary 1.17 (1.05-1.31)Third Level 1.44 (1.26-1.65)
Income
Reference: > €2,500€1,501 up to €2,500 0.89 (0.77-1.03)€1,001 up to €1,500 0.96 (0.81-1.14)€501 up to €1,000 0.88 (0.74-1.04)Missing 0.93 (0.81-1.06)
Occupational status
Reference: Employed/self-employedRetired 0.56 (0.49-0.63)Out of work 0.67 (0.55-0.81)Looking after home/family 0.48 (0.41-0.57)
Material deprivation Yes versus no 0.89 (0.75-1.06)
Mental health difficulties Yes versus no 0.77 (0.62-0.95)
Health status Fair/poor versus good/very good 0.76 (0.68-0.84)
Location
Reference: Open countryside and villageTowns 1500+ population 1.07 (0.95-1.20)Inner city and suburbs 0.65 (0.54-0.77)
Constant 5.29 (3.60-7.77)BIC 12362.8LL -6075.9LR-test 418.0***Variance (county/city) 0.24Std. Err. 0.08ICC 0.07N 9651Areas 21

196
TABLE 25 RESULTS OF MIXED EFFECTS LOGISTIC REGRESSION OF FACTORS ASSOCIATED WITH ‘FEELING IN TUNE’ WITH OTHER PEOPLE
Odds Ratio (OR) 95% CI
Age 70+ versus 55-69 0.98 (0.88-1.09)Gender Male versus female 0.99 (0.90-1.09)
Marital status
Reference: MarriedSingle (never married) 0.77 (0.61-0.98)Separated or divorced 0.80 (0.62-1.03)Widowed 0.79 (0.63-0.98)
Household composition
Reference: Living aloneLiving with spouse 0.87 (0.70-1.09)Living with family or non-family (with/without spouse or partner)
1.14 (0.97-1.35)
Educational attainment Reference: Primary or lessSecondary 1.28 (1.15-1.43)Third Level 1.45 (1.27-1.66)
Income
Reference: > €2,500€1,501 up to €2,500 1.10 (0.95-1.28)€1,001 up to €1,500 0.85 (0.72-1.00)€501 up to €1,000 0.89 (0.75-1.06)Missing 0.96 (0.84-1.10)
Occupational status
Reference: Employed/self-employedRetired 1.09 (0.97-1.23)Out of work 0.93 (0.77-1.13)Looking after home/family 1.17 (0.99-1.38)
Material deprivation Yes versus no 0.54 (0.45-0.64)
Mental health difficulties Yes versus no 1.09 (0.87-1.36)
Health status Fair/poor versus good/very good 0.68 (0.61-0.75)
Location Reference: Open countryside and villageTowns 1500+ population 0.76 (0.67-0.85)Inner city and suburbs 0.61 (0.52-0.73)
Constant 2.15 (1.42-3.25)BIC 12447.2LL -6117.9LR-test 578.1***Variance (county/city) 0.37Std. Err. 0.19ICC 0.10N 9788Areas 21

197
IMPROVING INFORMATION ACCESS; COMMUNICATION AND INFORMATION
TABLE 26 RESULTS OF A MIXED-EFFECTS LOGISTIC REGRESSION OF FACTORS ASSOCIATED WITH INTERNET USE
Odds Ratio (OR) 95% CI
Age 55-69 versus 70+ 2.84 (2.51-3.20)Gender Female versus male 1.11 (0.99-1.25)
Marital status
Reference: MarriedSingle (never married) 0.41 (0.31,0.55)Separated or divorced 0.73 (0.54,0.99)Widowed 0.59 (0.45,0.76)
Household composition
Reference: Living aloneLiving with spouse 1.32 (1.01-1.73)Living with family or non-family (with/without spouse or partner)
1.20 (0.98-1.45)
Educational attainment
Reference: Primary/lessSecondary 2.89 (2.56,3.26)Third level 10.30 (8.66,12.25)
Income
Reference: > €2,500€1,501 up to €2,500 0.50 (0.41,0.61)€1,001 up to €1,500 0.37 (0.30,0.47)€501 up to €1,000 0.26 (0.20,0.32)Missing 0.44 (0.36,0.54)
Occupation
Ref: Looking after home/familyOut of work 1.63 (1.28-2.08)Retired 1.72 (1.45-2.03)Employed/self-employed 2.79 (2.27-3.44)
Material deprivation No versus yes 1.92 (1.55-2.37)Mental health difficulties
Yes versus no 0.94 (0.73-1.22)
Health status Good/very good versus fair/poor/very poor 1.80 (1.60-2.02)
Location Reference: Open countrysideVillage 1.10 (0.92-1.31)Town, city or city suburb 1.22 (1.04-1.44)
Constant 0.00 (0.00-0.00)BIC 9057.67LL -4418.59LR-test 113.53***Variance (county/city) 0.15Std. Err. 0.05ICC 0.04N 9,773Areas 21

198
TABLE 27 RESULTS OF A MIXED-EFFECTS LOGISTIC REGRESSION FOR FACTORS ASSOCIATED WITH DIFFICULTY ACCESSING INFORMATION ON 1) LOCAL ACTIVITIES AND EVENTS AND 2) HEALTH OR SOCIAL SERVICES
Local activities and events
Health or social services
Odds Ratio (95% CI) Odds Ratio
(95% CI)
Age 55-69 versus 70+ 1.06 (0.86-1.32) 1.03 (0.87-1.22)
Gender Female versus male 1.26 (1.04-1.53) 1.15 (0.98-1.34)
Marital status
Reference: Married
Single (never married) 1.10 (0.71,1.69) 0.96 (0.67,1.37)
Separated or divorced 0.83 (0.52,1.32) 1.01 (0.70,1.46)
Widowed 0.84 (0.55,1.27) 0.79 (0.57,1.11)
Household composition
Reference: Living alone
Living with spouse 0.69 (0.45-1.06) 0.78 (0.56-1.10)
Living with family or non-family (with/without spouse or partner)
0.99 (0.72-1.36) 1.01 (0.78-1.30)
Educational attainment
Reference: Primary or less
Secondary 0.80 (0.65,0.98) 1.01 (0.86,1.19)
Third level 0.77 (0.58,1.01) 0.78 (0.62,0.97)
Income
Reference: > €2,501
€1,501 up to €2,500 1.07 (0.77-1.51) 1.56 (1.18-2.07)
€1,001 up to €1,500 1.36 (0.95-1.94) 1.77 (1.32-2.38)
< €1,000 1.24 (0.87-1.79) 1.60 (1.18-2.17)
Missing 0.98 (0.71-1.35) 1.26 (0.96-1.65)
Occupation
Ref: Looking after home/family
Out of work 1.48 (1.02-2.16) 1.22 (0.91-1.64)
Retired 1.25 (0.94-1.68) 1.05 (0.84-1.31)
Employed/self-employed 1.08 (0.75-1.56) 0.91 (0.69-1.21)
Material deprivation Yes versus no 3.88 (3.07-4.91) 3.42 (2.81-4.16)
Mental health difficulties Yes versus no 1.66 (1.21-2.28) 1.41 (1.07-1.85)
Health status Fair/poor/very poor versus good/very good
2.00 (1.65-2.43) 1.90 (1.63-2.22)
Location
Ref: Open countryside
Village 1.03 (0.76-1.39) 0.97 (0.77-1.23)
Town, city or city suburb 1.30 (0.99-1.72) 1.16 (0.93-1.45)
Constant 1.35 (1.08-1.68) 1.53 (1.29-1.81)
BIC 4155.31 5970.53
LL -1963.24 -2870.42
LR-test 147.67*** 209.37***
Variance (county/city) 0.46 0.41
Std. Err. 0.16 0.14
ICC 0.12 0.11
N 9,449 9,773
Areas 21 21


200
The Healthy and Positive Ageing Initiative, Department of Health, Hawkins House, Dublin 2.
www.hapai.net