portuguese population in france - universidade nova de...
TRANSCRIPT

Portuguese Population in France:

2
a snapshot 25 years after their arrival §
Pedro Telhado PereiraX and Lara Patrício TavaresD
Faculdade de Economia da Universidade Nova de Lisboa
Abstract
In year 2000 Portugal is celebrating the 500th anniversary of thearrival to Brazil. The Portuguese overseas adventure is now fivecenturies old and more than one third of the Portuguese nationals areliving outside their homeland; in France they are the largest foreigncommunity.
This paper uses the data from the French Employment Survey(Enquête de l’ Emploi) 1994 and 1995 to characterise the Portuguesepopulation and to study individual decisions taken by the Portuguesemigrants concerning naturalisation, family, residence and education.
As a result of the analysis it seems that the decisions of the youngerPortuguese are getting closer to the decisions of their Frenchneighbours, increasing the gap with respect to the decisions of theircountrymen who stayed in Portugal. In this very sense, we can say thatsome assimilation by the Portuguese is occurring in France. There is aneducational convergence of the Portuguese migrants in France and theFrench.
§ This paper was written under the scope of the “Labour Demand, Education and the Dynamics of SocialExclusion” European Commission TSER project.X E-mail: [email protected]. Research support by the Banco de Portugal during the period this paper waswritten is kindly acknowledged.D E-mail: [email protected]. Financial support from de European Commission TSER programme undercontract ERB4142 PL97/3148 is gratefully acknowledged.

3
I. Introduction
In year 2000 Portugal is celebrating 500 years of the arrival to Brazil. The Portuguese
overseas adventure is now five centuries old and the time has arrived to know more about the
Portuguese Diaspora. This paper is a contribution to that knowledge as the Portuguese community
in France is studied.
After a century long period of migration to overseas colonies and ex-colonies, a new
phenomenon appears in the Portuguese recent history: the migration to European countries. In
1950-54 around 2% of the more than 184,000 migrants, chose Europe as destination; ten years
later, in 1960-1964, more than 50% chose this destination; twenty years later, in 1970-1974, more
than 83% of the 667,000 emigrants were heading to Europe and more than 62% had France as
destination. As a result Portugal is a country which has one third of its nationals living abroad and
which holds the largest foreign nationality living in France.
The paper starts with a brief historical note where the main facts of the Portuguese
emigration are pointed. Follows, in part III, the characterisation of the samples used. In part IV
some decisions taken by the migrants are studied and compared to the same type of decisions taken
by the French and by the Portuguese who stayed in Portugal. We end with some conclusions and
topics for further research. The paper includes also an extended bibliography on the topic.
II. Historical background
Accordingly to official estimates more than 4.5 million Portuguese were living abroad in
95/961. This number assumes an even bigger importance if compared with the Portuguese
population. There are several different estimates for the Portuguese population in those two years.
Nonetheless, it can be said that it must lie between 9.8 and 9.9 million2. Therefore, one out of three
Portuguese lives abroad.
The American continent was the destination chosen by more than half of the Portuguese
emigrants, being Brazil the main destination. In Europe, the destination of almost 30% of the
Portuguese emigrants, France is the country with the largest Portuguese community. In fact, it is
the second larger Portuguese community, accounting for approximately 17% of the total
Portuguese living abroad, and was the first foreign community in France in 1990 (18% of the 3.6
million immigrants residing in that country) with 649714 individuals3.
1 More precisely, 4,638,998 - Direcção Geral dos Assuntos Consulares e Comunidades Portuguesas (Portuguese ForeignAffairs Ministry).2 9,921 thousand in 1995 and 9,935 thousand , in OCDE “Main Economic Indicators”, Dec 1996 and Dec 1997; The midyear estimates of IMF are 9,920 thousand in 1995 and 9,810 thousand in 1996, in “International Financial StatisticsYearbook”, 1998; 9,807 thousand in 1995 and 9,831 thousand in 1996 in Eurostat “Eurostatistics”, 1998.3 From the 1990 French Census, I.N.S.E.E., Branco (1998), Kotlok-Piot (1994) and Labat (1992).

4
The dimension of the actual Portuguese community in France is due to the massive
emigration that took place in Portugal between the sixties and mid seventies4. Once more the exact
figures are not known, for in that period a substantial part of departures were clandestine5. This was
particularly true for early seventies when clandestine emigration exceeded legal emigration. That
can be inferred comparing the legal departures’ number for 1970, 66,360, with some figures put
forward by some authors. According to Kotlok-Piot (1994), France alone received almost 90,000
Portuguese in 1970. Lebon (1989) goes even further presenting a figure beyond 135,000. The
SECP (Portuguese communities’ Secretary of State) gives an estimate of 173,268 for total
migration, consisting in legal emigration plus illegal emigration to France6. Baganha (1994)
presents a higher estimate for total Portuguese migration in 1970, 183,205 migrants, including all
the illegal emigrants.
4 92% of the Portuguese immigrants in France in 1990 were already living there in 1982, Labat (1992), and among the767304 Portuguese immigrants living in France in 1982 only 74640 did not live there already in 1975, Branco (1998).5 Clandestine in the sense that the Portuguese were not allowed to migrate freely. They had to ask for permission to leavePortugal. If granted they were considered legal emigrants; otherwise they were illegal or clandestine emigrants.6 French authorities gave the figures relative to illegal Portuguese immigrants in France.
Portuguese Emigration
0
20000
40000
60000
80000
100000
120000
140000
160000
180000
200000
1955 1960 1965 1970 1975 1980 1985 1990
Years
Em
igra
nts
Total official estimates Total Baganha's estimates
France Baganha's estimates
5
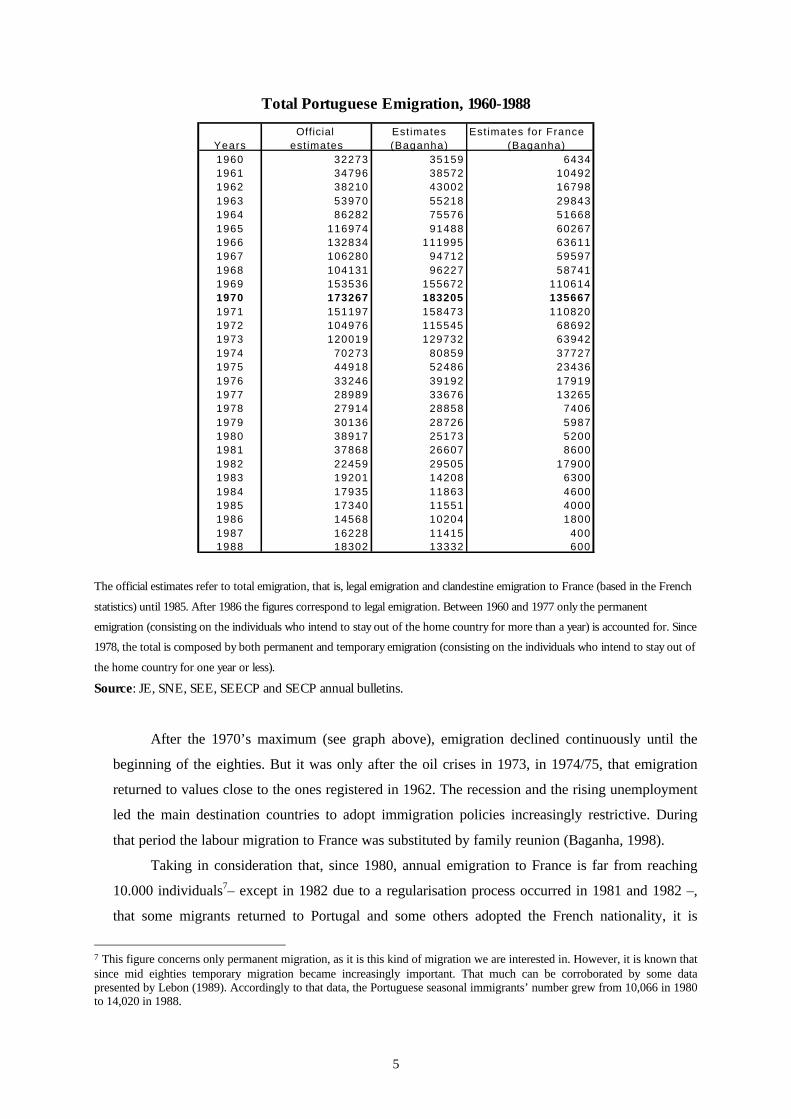
Total Portuguese Emigration, 1960-1988
Official Est imates Estimates for FranceYears estimates (Baganha) (Baganha)1960 32273 35159 64341961 34796 38572 104921962 38210 43002 167981963 53970 55218 298431964 86282 75576 516681965 116974 91488 602671966 132834 111995 636111967 106280 94712 595971968 104131 96227 587411969 153536 155672 1106141970 173267 183205 1356671971 151197 158473 1108201972 104976 115545 686921973 120019 129732 639421974 70273 80859 377271975 44918 52486 234361976 33246 39192 179191977 28989 33676 132651978 27914 28858 74061979 30136 28726 59871980 38917 25173 52001981 37868 26607 86001982 22459 29505 179001983 19201 14208 63001984 17935 11863 46001985 17340 11551 40001986 14568 10204 18001987 16228 11415 4001988 18302 13332 600
The official estimates refer to total emigration, that is, legal emigration and clandestine emigration to France (based in the French
statistics) until 1985. After 1986 the figures correspond to legal emigration. Between 1960 and 1977 only the permanent
emigration (consisting on the individuals who intend to stay out of the home country for more than a year) is accounted for. Since
1978, the total is composed by both permanent and temporary emigration (consisting on the individuals who intend to stay out of
the home country for one year or less).
Source: JE, SNE, SEE, SEECP and SECP annual bulletins.
After the 1970’s maximum (see graph above), emigration declined continuously until the
beginning of the eighties. But it was only after the oil crises in 1973, in 1974/75, that emigration
returned to values close to the ones registered in 1962. The recession and the rising unemployment
led the main destination countries to adopt immigration policies increasingly restrictive. During
that period the labour migration to France was substituted by family reunion (Baganha, 1998).
Taking in consideration that, since 1980, annual emigration to France is far from reaching
10.000 individuals7– except in 1982 due to a regularisation process occurred in 1981 and 1982 –,
that some migrants returned to Portugal and some others adopted the French nationality, it is
7 This figure concerns only permanent migration, as it is this kind of migration we are interested in. However, it is known thatsince mid eighties temporary migration became increasingly important. That much can be corroborated by some datapresented by Lebon (1989). Accordingly to that data, the Portuguese seasonal immigrants’ number grew from 10,066 in 1980to 14,020 in 1988.

6
reasonable to assume that the present Portuguese community in France is formed by the emigrants
of the “Portuguese migration golden period” (1965-1974) and their descendants.
II. Characterisation of the samples
From the Enquête de l’ Emploi 1994, 1995 we selected all individuals who were Portuguese
or were born in Portugal. We got a sample of 2033 and 1958 individuals in 1994 and 1995
respectively. This way we will study not only the Portuguese who maintained their nationality but
also the ones who decided to get the French nationality.
Because we included the Portuguese as well as all individuals who were born in Portugal
regardless of their nationality the samples have the following composition:
Nationality 1994 1995Portuguese 80.82% 79.72%French born in Portugal 4.53% 2.86%Naturalised French born in Portugal 11.76% 13.26%Other 2.89% 4.16%Portuguese or born in Portugal 100% 100%
From the above table we see that most of the individuals of our sample are Portuguese. Later
in this work we study the decision to become a French citizen.
Unfortunately we do not know the country of birth of all individuals. Therefore we are not
able to trace neither all the Portuguese who naturalised French nor the origin of all Portuguese. In
regard to the latter problem we can say though that approximately 98% of the Portuguese, for
whom the country of birth is known, were in fact born in Portugal (97.6% in 1994 and 98.1% in
1995), as expected.
The majority of the individuals are males as we can see below.
Sample composition by gender1994 in % 1995 in %
Males 1070 52,63 1012 51,69Females 963 47,37 946 48,31
Total 2033 100 1958 100
The above percentages are very similar to the one obtained for the Portuguese population in
France in the 1990 census: 53.5% of males.

7
Notice that this percentage is much lower than the percentage for other migrants’
populations: 58.6% for Argelians; 56.2 for Moroccans; and 57% for Italians (Kotlok-Piot, 1994),
for the Portuguese migration is a family migration where there is not a disproportionate number of
males (generally single).
The age composition of the samples is the following
Age compositionage 1994 in % 1995 in %
15-20 155 7,62% 116 5,92%21-25 165 8,12% 128 6,54%26-30 230 11,31% 254 12,97%31-35 240 11,81% 251 12,82%36-40 252 12,40% 237 12,10%41-45 259 12,74% 242 12,36%46-50 281 13,82% 256 13,07%51-55 171 8,41% 205 10,47%56-60 137 6,74% 121 6,18%+60 143 7,03% 148 7,56%
Sum 2033 100% 1958 100%Average 40.1 40.9
The most striking aspect of the table above is that more than 50% of the individuals in both
samples are younger than 40 years old. We have then a very young population (younger than other
populations of migrants), although it seems to be getting older. This can be explained by the fact
that the Portuguese migration to France is a relatively recent phenomenon.
Analysing the table below we see that there is a majority of females in the 36-45-age
bracket, in 1994, and a much smaller percentage after this age. In the 1995 sample women
concentrate more in the youngest and oldest age brackets. It is worth noticing that the 21-25
age bracket is one of the age groups where there are fewer females
Age distribution by gender1994 1995
Age Males in % Females in % Males in % Females in %15-20 81 52,26 74 47,74 57 49,14 59 50,8621-25 94 56,97 71 43,03 68 53,13 60 46,8826-30 125 54,35 105 45,65 129 50,79 125 49,2131-35 122 50,83 118 49,17 128 51,00 123 49,0036-40 125 49,60 127 50,40 121 51,05 116 48,9541-45 124 47,88 135 52,12 126 52,07 116 47,9346-50 157 55,87 124 44,13 132 51,56 124 48,4451-60 168 54,55 140 45,45 180 55,21 146 44,79+60 74 51,75 69 48,25 71 47,97 77 52,03
Sum 1070 52,63 963 47,37 1012 51,69 946 48,31
It would be interesting to know when did these migrants arrive in France. Unfortunately only
a small percentage answered the question about the year they entered France (35.6% in 1994 and
35.5% in 1995).

8
Looking at the sub-samples of those that recall their arrival date and comparing its
composition with the whole samples we see that there is not a clear bias. If in the 1994 sub-sample
the percentage of men who know the year they entered France (relative to whole men’s group) is
higher than the mean– meaning that more men recall their arrival date comparatively to women –
the reverse happens in the 1995 sub-sample.
Age distribution by gender of the 1994 sub-sample of the individuals who recall their arrival date
Age Total % of the sample's Men % of the sample's Women % of the sample's
age bracket a) age bracket a) age bracket a)
15-20 45 29,03% 22 27,16% 23 31,08%
21-25 78 47,27% 49 52,13% 29 40,85%
26-30 94 40,87% 58 46,40% 36 34,29%
31-35 84 35,00% 47 38,52% 37 31,36%
36-40 90 35,71% 48 38,40% 42 33,07%
41-45 78 30,12% 41 33,06% 37 27,41%
46-50 83 29,54% 43 27,39% 40 32,26%
51-55 65 38,01% 35 38,04% 30 37,97%
56-60 55 40,15% 30 39,47% 25 40,98%
+60 51 35,66% 24 32,43% 27 39,13%
Sum 723 35,56% 397 37,10% 326 33,85%
Age distribution by gender of the 1995 sub-sample of the individuals who recall their arrival date
Age Total % of the sample's Men % of the sample's Women % of the sample's
age bracket a) age bracket a) age bracket a)
15-20 35 30,17% 12 21,05% 23 38,98%
21-25 61 47,66% 30 44,12% 31 51,67%
26-30 108 42,52% 56 43,41% 52 41,60%
31-35 110 43,82% 58 45,31% 52 42,28%
36-40 70 29,54% 36 29,75% 34 29,31%
41-45 73 30,17% 38 30,16% 35 30,17%
46-50 74 28,91% 39 29,55% 35 28,23%
51-55 76 37,07% 37 34,58% 39 39,80%
56-60 40 33,06% 25 34,25% 15 31,25%
+60 48 32,43% 20 28,17% 28 36,36%
Sum 695 35,50% 351 34,68% 344 36,36%
In terms of age groups we can see that the intermediate ones show the lowest percentages, as
well as the youngest group. It is within the 21-30 age bracket, for 1994 or 21-35 for 1995, that
more individuals recall their arrival date. Consequently, the sub-samples’ population is slightly
a) number that recall in age bracket i
total in age bracket i× 100
9
younger than the whole samples’ population (the age average for the sub-samples is 39 years old
whereas for the samples is 40.1 and 40.9 for 1994 and 1995 respectively).
As it was said earlier, the huge dimension of the actual Portuguese community in France is
due to the massive emigration that took place in Portugal between the sixties and mid seventies. So
it is not very surprising to find that the distribution of the sub-samples’ over the arrival years is
very similar to the distribution of the total Portuguese emigration (see graph below).
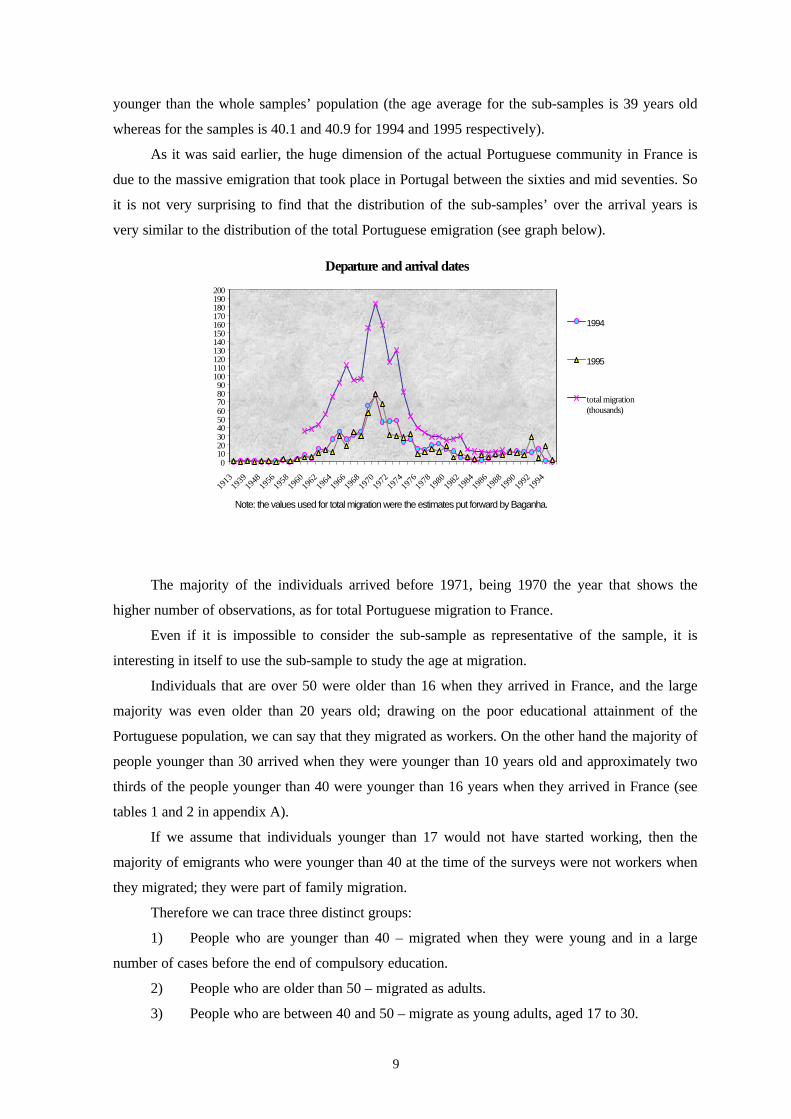
Departure and arrival dates
0102030405060708090
100110120130140150160170180190200
1913
1939
1948
1956
1958
1960
1962
1964
1966
1968
1970
1972
1974
1976
1978
1980
1982
1984
1986
1988
1990
1992
1994
Note: the values used for total migration were the estimates put forward by Baganha.
1994
1995
total migration(thousands)
The majority of the individuals arrived before 1971, being 1970 the year that shows the
higher number of observations, as for total Portuguese migration to France.
Even if it is impossible to consider the sub-sample as representative of the sample, it is
interesting in itself to use the sub-sample to study the age at migration.
Individuals that are over 50 were older than 16 when they arrived in France, and the large
majority was even older than 20 years old; drawing on the poor educational attainment of the
Portuguese population, we can say that they migrated as workers. On the other hand the majority of
people younger than 30 arrived when they were younger than 10 years old and approximately two
thirds of the people younger than 40 were younger than 16 years when they arrived in France (see
tables 1 and 2 in appendix A).
If we assume that individuals younger than 17 would not have started working, then the
majority of emigrants who were younger than 40 at the time of the surveys were not workers when
they migrated; they were part of family migration.
Therefore we can trace three distinct groups:
1) People who are younger than 40 – migrated when they were young and in a large
number of cases before the end of compulsory education.
2) People who are older than 50 – migrated as adults.
3) People who are between 40 and 50 – migrate as young adults, aged 17 to 30.
10
This is in accordance with the fact that the main Portuguese migration flow to France
occurred 20 to 30 years ago (that is, between 1965 and 1974). In 1994 and 1995 people would then
be 20 to 30 years older than what they were when they migrated.
On the other hand, in Portuguese migration the time gap between husband and wife’s arrival
was generally shorter than 3 years. That is the reason why the family flow became close to the one
of workers already at end of the sixties (Kotlok-Piot, 1994).
Considering the individuals who migrated younger than 16 as being part of a second
generation of migrants - for the decision to migrate must have been taken by their parents - we see
that 38% and 39% in 1994 and 1995 sub-samples are second generation migrants.
The proportion of second generation migrants for the whole sample should be around one
third. We obtained this number assuming that everyone who entered France having less than 17
years old was younger than 418 at the time of the surveys. The group of individuals younger than
41 accounts for half of each sample and among them, every two in three individuals, entered
France when they were younger than 17 years old (66%).
III. Study of some decisions taken by the migrants: naturalisation,
residence, education and family.
Naturalisation
The percentage of individuals of our samples who naturalised French was 11.76% and
13.28% in 1994 and 1995 respectively. The majority of individuals have remained Portuguese (see
table 3 in appendix A).
Tribalat (1995) also points the low number of naturalisations, even if she presents a higher
percentage, 17.5%. This author shows that only 7% of the males and 5% of the females who
arrived in France before 1974 took the French nationality, something that can, in part, explain the
low level we observe. As mentioned earlier the large majority of the individuals in our samples
must have entered France until 19749.
As, in general terms, the migrants who get naturalised are the ones who migrated single
(Tribalat et al., 1991), the low level of naturalisations of the Portuguese can also be explained by
the low level of migrants single (45%) when compared with the same percentage of other migrant
populations (Tribalat et al. 1991).
8 94.57% of the individuals in the 1994 sub-sample that entered France younger than 17 is less than 41 years old, being91.18% the percentage for the 1995 sub-sample.9 In the sub-samples, for which we know the arrival date, more than two thirds arrived in France before 1974.

11
Although we cannot check this explanation, because we do not have any information about
the marital status of the migrants at the time of their migration, it could be indeed one of the causes
of the low level of naturalisations observed. As we already pointed out, family migration is very
important in the Portuguese case. This theme will be presented below when we study the family
decisions.
Analysing table 3 (in appendix A), we see that excluding the last age bracket, which shows a
much higher percentage than the previous ones, the naturalisation percentage within each age
bracket shows an inverse U shaped form with age.
If we make a distinction by age and sex (see table 4 in appendix A), we see that females
show a slightly higher percentage of naturalisations. That could be due to the higher percentage of
Portuguese women who adopt the nationality of their French husband, when compared to the
percentage of Portuguese men who adopt the nationality of their French wife.
Women’s naturalisation shows a maximum at a younger age (19% in 1994 and 20% in 1995
at 31-35) than men. A possible explanation is that women adopt their husband’s nationality sooner
than men adopt their wives’ nationality. It is also true that men tend to marry later.
Naturalisation's percentages within each age bracket
0,00
5,00
10,00
15,00
20,00
25,00
15-20 21-25 26-30 31-35 36-40 41-45 46-50 51-60 +60Age brackets
% w
ithin
age
bra
cket
1994
1995
Females' naturalisations by age bracket
0%
5%
10%
15%
20%
25%
15-20 21-25 26-30 31-35 36-40 41-45 46-50 51-60 + 60Age brackets
%
1994
1995

12
If we exclude the last age class we see that naturalisations increase among men until the age
of 45 and among women until the age of 35. While the numbers decrease with age until the last
class for men, for women there is an increase after the age of 45.
An explanation for the low number of younger males who naturalise (when compared to
women) is that the military service is easier to avoid if they remain Portuguese (Tribalat, 1995).
Residence
As in the French census of 1990 there is a high concentration of individuals in our samples in
the Ile-de-France region (38% in 1994 and 37% in 1995). No other region attracts so many
Portuguese (see tables 5 and 6 in appendix A). The second region of attraction is Rhône-Alpes, and
yet it represents only 10% of the Portuguese population in France. We find figures close to this one
in our samples (9.2% in 1994 and 10.27% in 1995).
The fact that these two regions attract almost half of the individuals in our sample comes as
no surprise as they are the more densely populated regions and the ones with the higher percentage
of migrants. In Ile-de-France the concentration of migrants is twice the one of the French people.
As for Rhône-Alpes, in 1990, 12% of the foreign population lived there, making it the second
destination for migrants.
Kotlok-Piot (1994) explains the big concentration of Portuguese in the Paris region “by the
higher level of wages when compared to other parts of the country, by the dimension and diversity
of the labour market, by the constant need of no qualified workers, by the mobility among firms, by
the possibility of working illegally and by the possibility of working overtime”.
Males' naturalisations by age bracket
0%
5%
10%
15%
20%
25%
30%
15-20 21-25 26-30 31-35 36-40 41-45 46-50 51-60 +60Age brackets
%1994
1995

13
The attraction for Rhône-Alpes comes from the fact that this is an important industrial region
where, in the seventies, there were large investments in public works, which attracted Portuguese to
work in the construction sites.
If we look at the graph below we see that in regions like Champagne-Ardenne, Bourgogne,
Franche-Compté, Picardie, Limousin and Auvergne there is a higher concentration of individuals in
our sample than French (Eurostat 1993).
The same happens if we consider the foreign population as their concentration in the above
mentioned regions is smaller than the concentration we find in the samples. This happens even with
the Portuguese population in France (Census 1990), meaning that the Portuguese in our samples are
more concentrated in these regions than the Portuguese population as a whole.
Looking at tables 5 and 6 we see that there is no significant variation in the geographical
distribution (of the individuals in our sample) with age. The only way to note some differences is
to compare broad groups within each sample. Therefore, we divided both samples in two groups:
the group of the individuals who are younger than 41 and the one of those who are older than 40
years old.
If on one hand the younger individuals are slightly more concentrated in Ile-de-France, an
urban region, it also true that they represent the majority in rural regions like Aquitaine e Franche-
Compté (especially in the 1994 sample). On the other hand, the majority of people in Bourgogne,
also a rural region is older than 40 years old.
The industrial region of Rhône-Alpes seems to be loosing importance near the younger
individuals, the reverse happening in the Centre region.
Geographical distribution of the total French population (in 1993) and of the samples
0
5
10
15
20
25
30
35
40
45
Regions
French population
1994 sample
1995 sample

14
Education
It is known that the Portuguese who migrated in the sixties and early seventies had a low
formal education or none. In 1960, 40.3% of the Portuguese population had no formal education
and of those who had some almost 90% had at most elementary school. Furthermore a large
percentage of the migrants were from rural areas where schooling was below the national average;
in these regions the illiteracy rate was approximately 45% and 95% of those who had studied had at
most elementary school.10
As the first generation migrants are in majority in both samples, a low educational level was
expected. In fact, nearly half of the individuals in the samples has only primary education – 48.3%
in 1994 and 47.75% in 1995 – and 8.56% and 7.41% in 1994 and 1995 respectively have no formal
education (see tables 7 and 8 and graphs 1 and 2 in appendix A).
Nonetheless, a significant percentage of the individuals in the samples were in childhood or
adolescence when migrated. Taking in consideration that some of them may have proceeded their
studies in France, and that there has been an increasing trend in average education in Portugal, this
group is expected to be more educated.
Looking at the educational levels attained by age group (see appendix B for a short
description of the French educational system) we see that the individuals older than 35 are the ones
to “blame” for the high percentage of elementary education. More than 75% of the individuals
older than 40, and almost 50% of the ones in the 36-40 cohort, have at most primary education.
This percentage reduces drastically for younger cohorts; in the 31-35 cohort it is about half the one
of the next cohort, the 36-40 cohort.
Several works – Cunha (1989), Dubet (1989), Fernandes (1989), Silberman and Fournier
(1998) - refer the preference of the Portuguese migrants’ children for vocational training over an
academic education. Our data support their statements. Approximately one third of the individuals
aged 16 to 40, 11 in both samples, have a CAP-BEP certificate, whereas those who completed the
“terminale”12 represent only 5% in both samples (5.1% and 4.9%, respectively). However the
preference for vocational training is declining, as the next two graphs show.
10 All the percentages were calculated from the 1960 Portuguese Census.11 We do not consider individuals who are 15 as they are too young to have obtained this degree, neither individuals olderthan 40, because the percentage of this individuals who have the CAP-BEP is very low.12 We only consider individuals who are 18 or older as the others are too young to have obtained this degree.

15
Proportion of individuals who did not choose the vocational branch at higher secondary school or
continued to study afterwards
010203040506070
16 17 18 19 20 21-23
24-25
26-30
31-35
36-40
Age%
with
in a
ge g
roup
1994
1995
CAP-BEP (after 5ème)
0
5
10
15
20
25
30
15 17 19
21-
23
26-
30
36-
40
46-
50
61-
70
Age
% w
ithin
age
gro
up
1994 1995
The second graph includes all individuals who have a CAP-BEP certificate; there are two
ways of obtaining it (see appendix B): after the 5ème and after 3ème. The individuals who want to
obtain the CAP-BEP after the 3ème will have to study two more years, which implies that they will
only get the certificate when they are 17 or 18 years old. That could be the reason for the low
percentages of individuals with 16 and 17 having a CAP-BEP already. The declining percentages
of those who choose the vocational training after the 5ème is evidence that, at least, the individuals
are postponing their decision to get the CAP-BEP certificate.
However, as many young individuals are still in the 3ème, it can not be said for sure that they
will, or will not, choose to get the CAP-BEP certificate. We can see though, that almost everyone,
who reached the second cycle (higher secondary school) already, is in the general & technological
branch, that is, chose an academic education.
CAP-BEP
0
10
20
30
40
50
16 17 18 19 20 21-23
24-25
26-30
31-35
36-40
Age
% w
ithin
age
gro
up
1994
1995

16
It is clear, looking at the first graph on the previous page, that the proportion of individuals
younger than 21 that chose an academic education is substantially higher than for older individuals;
it is even above 50% for the individuals who are 20 years old. That could suggest an assimilation of
the Portuguese migrants’ children, as nearly 70% of the French students in the higher secondary
school in 94/95 were in the general & technological branch (data from EURYBASE13).
The values reported by Tribalat (1995)14, relative to the 25-29 age group are somewhat
different from ours. In her sample one in two individuals has a CAP-BEP certificate15, a higher
percentage than the one we got for the same age group, which is about 45%. But the big difference
is in the percentage of those who have a university degree or a BAC+2 degree. Even though this is
the age group where we can find substantially more individuals with these qualifications, our
percentages do not reach 10% (8.7% in 1994 and 7.5% in1995) whereas Tribalat’s percentage is
17%.
For obvious reasons, the percentages of individuals who continued to study beyond
secondary school for the whole samples are much lower than the one referred above, less than 4%
for both samples. Those who have a university degree represent only 1.03% in 1994 and 0.66% in
1995.
Despite all the differences, the Portuguese migrants’ children are becoming more French and
less Portuguese in what education is concerned. On one hand, the preference for shorter cycles
seems to be declining. On the other hand, there is a clear distinction between the education profile
of the migrants and the Portuguese who remained in Portugal.
In general individuals younger than 40 years old, of which about two thirds are second
generation migrants, are more educated than individuals of the same age in Portugal. That much
can be seen comparing our samples with the Portuguese dataset “Quadros de Pessoal” (Personnel
Records) for 1994, for ages between 18 and 40.
In our samples the majority of the individuals between 18 and 35 years old, within each age
group, have at least the higher secondary school or the CAP-BEP after 5ème 16(see graphs 1 and 2 in
appendix A). In “Quadros de Pessoal”, and for the same age interval, more than 60%, again within
each age group, has at most six years of education. For the 35-40 age group though the education
profile of the migrants and the one of the Portuguese who remained in Portugal is more alike
regarding the years of education.
Another feature that distinguishes the Portuguese migrants from the Portuguese who
remained in Portugal is, still, the preference for the vocational branch. Although this option is
13 EURYBASE is provided by EURYDICE European Unit (a project supported by the European Commission).14 In the survey “Mobilité Geographique et Insertion Social”, a survey of 13000 individuals done by INED.15 We refer here the average percentage as the author reports the women and men percentages separately.16 In the 1995 sample and for the 31-35 age group, the individuals who have at least the higher secondary or the CAP-BEPafter the 5ème are not quite the majority; they represent 46.7%.

17
available in Portugal too, the percentage of people who choose it is extremely low (below 1%,
between 2% and 3%, and 6.7%, for the 18-23, 24-35 and 36-40 age groups respectively).
This shows that there is a cut with the past by the Portuguese migrants. This cut can be due
to the enforcement and higher levels of minimum education and not to a free decision taken by the
migrants. However, either freely or in a compulsory way, the Portuguese migrants are becoming
less Portuguese regarding their options relatively to education.
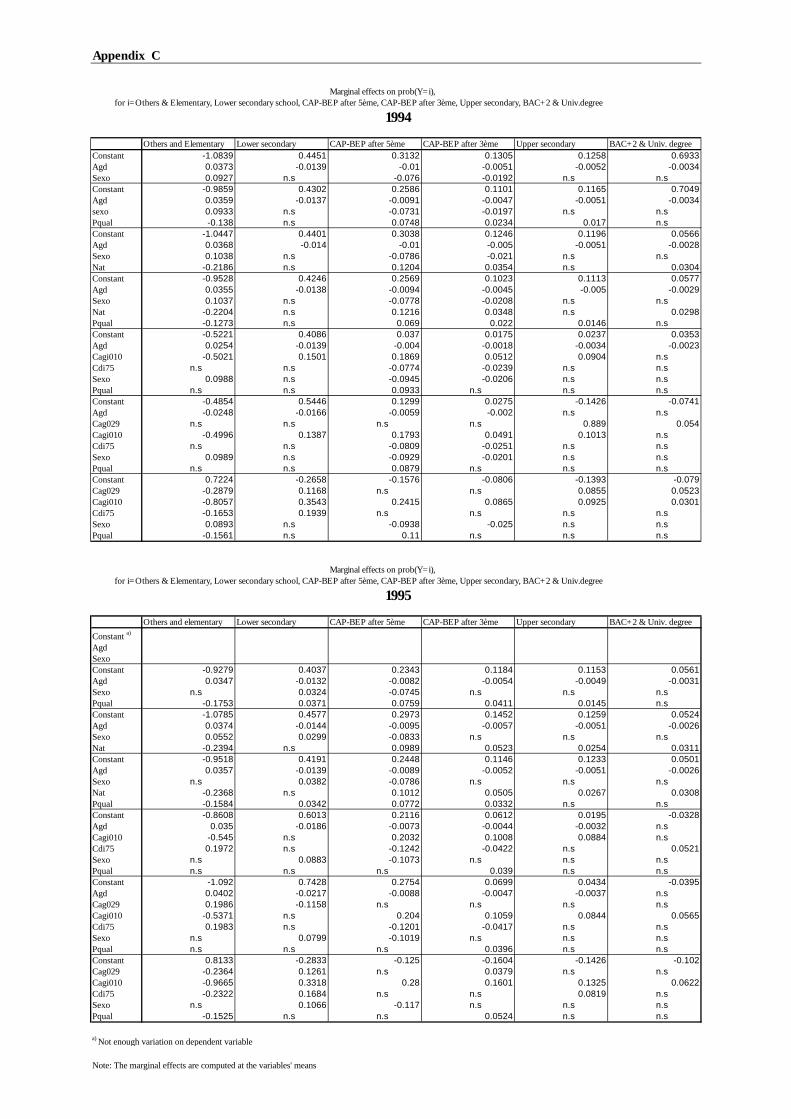
Using a multinomial logit to explain the different levels of education attended -
Others&Elementary, Lower secondary, CAP-BEP after 5ème, CAP-BEP after 3ème, Upper
secondary, and BAC+2&University degree - we were able to confirm this process of assimilation.
The regressors used were age (AGD), and dummies that take value one if: age cohort 15-30
(CAG029); the individuals were younger than 10 years old when they entered France (CAGI010);
migration date is post-1974 (CDI75); the father is a qualified worker (PQUAL) as a proxy for the
social background; the person got the French nationality (NAT1) and female (SEXO) - see
appendix C for detailed results.
As expected, age has a positive sign for the first level of education – which includes the
individuals with no formal education and with elementary school – and negative for all the others.
That is, younger individuals have a higher probability of having more than elementary school. In
particular, being less than 30 years old rises the probability of having attended the lower or upper
secondary or even university. The same happens if an individual entered France when he or she
was younger than 10 years old, only in this case the probability of having a CAP-BEP also rises (at
least in the 1994 sample). The reverse happens for those who entered France after 1974, that is,
these individuals have a smaller probability of having followed the vocational branch.
This is a very interesting insight that led us to the conclusion that the children of the first
Portuguese migrants, that is, those who took part of the first migration wave to France in the early
sixties, were the ones who preferred the shorter cycles the most. The children of the migrants who
arrived afterwards - that entered France only after 1974 in the context of family reunion - began to
prefer an academic education to the vocational branch.
Holding the French nationality also diminishes the probability of having only elementary
school or not having any formal education. In others words, a Portuguese migrant who got the
French nationality has a higher probability of, at least, having attended secondary school. In fact he
has a higher probability of having gone to university.
A qualified worker’s child has a higher probability of having a CAP-BEP certificate and a
lower probability of having only elementary school and, in some regressions, also has a higher
probability of having attended upper secondary school.
A female has a higher probability than a male of having only elementary school or having no
formal education (or having attended lower secondary school, for the 1994 sample), whereas a

18
male has a higher probability of having a CAP-BEP after 5ème (or a CAP-BEP after 3ème,again for
the 1994 sample).
Family decisions
It was pointed already that the Portuguese migration to France was a family migration. That
determines the age structure as well as the males proportion in the populations.
Another feature of the family migration is the high percentage of married people: 73% and
74% in 1994 and 1995 respectively. These percentages are higher than the one in the 1991 Census
for the Portuguese population, which is 61.2%17. The inverse happens for the widows’ percentage;
being about 2% in both samples, is less than a third of the percentage we observe for Portugal in
1991. The percentage of divorced persons in the samples is almost three times the one observed in
Portugal in 1991; 3.15% and 3.42% for the 1994 and 1995 samples respectively and 1.2% for
Portugal 1991.
The individuals in our samples are more like the Portuguese in terms of deciding to get
married but at the same time they also get divorced more easily. In that aspect they are more like
the French18.
Only 5% of the individuals in our samples live alone, of which the majority is males.
In our sample we have only information on the number of unmarried children living at home;
this is a lower bound indicator of the number of children.
The percentage of individuals who, being part of a couple, have at least one child is 81% in
both samples. The number of single-headed families is rather small; 10 fathers and 54 mothers in
1994 and 11 fathers and 64 mothers in 1995.
As can be seen in tables 9 and 10 in appendix A the majority has two or more children. For
the age brackets between 31 and 45 more than 60%19 of the individuals have two or more children.
For younger cohorts, namely the 21-25 and 26-30 age brackets, this percentage is about half that
value, and there is a higher percentage of individuals with one or no children.20
As said above the information concerns only unmarried children living with the parents
which turns any extrapolation for the whole population very difficult to make.
Kotlok-Piot (1994) and Cunha (1988) show that the fertility rate has been decreasing rather
slowly among the Portuguese population in France. So, nowadays the Portuguese migrants’ fertility
17 And they must be higher than the percentage of married people in France, as the Portuguese crude marriage rate –marriages per 1000 population - in 1994 was higher than the French was, 6.7 versus 4.4 (Eurostat).18 In 1993, the Portuguese and the French crude divorce rates – per 1000 population – were 1.2 and 1.9, respectively(Eurostat).19 Except for the age bracket 41-45 in the 1995 sample for which the percentage is 58.69.20 The percentages for individuals aged 15 to 20 do not seem representative of the age cohort as they have much higherfertility rates than what was to be expected.

19
rate is closer to the French than to the Portuguese fertility rate as the latter has been declining
heavily. In 1994 and 1995 the fertility index21 in Portugal was 1.422 whereas in France was 1.7, in
both years23.
IV. Conclusions
The Portuguese community in France, as it appears in our samples, is a young, genders
balanced population, that is getting older as the inflows are much smaller than what they used to
be. They arrived mainly in the 1965-1974 period, although the majority of them seem not to
remember the exact date of their arrival.
As a result of the concentration of the inflows in a ten-year period, individuals who were 40
or younger at the time of the surveys (1994-1995) arrived in a educational/formation age;
individuals who are older than that migrated as workers. This fact, in conjunction with the low
levels of formal schooling in the homeland, explains the different pattern of schooling of the two
groups. An older generation with almost no schooling and a younger generation with much higher
schooling – still low in French terms (comparison base: the French) but high in Portuguese terms
(comparison base: the Portuguese living in Portugal).
Not only the level of schooling has increased, but also the type of schooling chosen has
changed. In a first stage shorter cycles of vocational education were chosen, in a second stage
longer cycles of vocational education and in the third and present stage a increased preference for
academic or technological education as the French do. In this sense, there is a process of
assimilation by the younger Portuguese and their families.
The low levels of naturalisations and their evolution with age (an inverse U shaped graph)
are not very conclusive. If we divide the sample in two age groups, as above, we see that in the
younger sub-group the naturalisations increase with age, what can be considered another sign of
assimilation among the younger population.
The residence decisions do not show any significant evolution with age. The Portuguese are
concentrated in the Ile de France region, but can be found in almost all other areas.
The data we have concerning family decisions shows a married population with high but
decreasing fertility. As fertility has been decreasing both in France and in Portugal it is hard to infer
about to what model there is a convergence to, if any.
21 Average number of children that a woman has in her fertile lifetime period.22 INE, “Portugal Social, 1991/95”23 Source:INSEE, in Lévy (1998).

20
There are signs of assimilation by the Portuguese living in France, meaning a convergence of
decisional patterns. The next step is to use the same datasets to see if there are signs of
discrimination against the Portuguese in the labour market.

i
References
Baganha, Maria Ioannis (1994) As correntes emigratórias portuguesas no século XX e o seu impacto naeconomia nacional. Análise Social xxix (128): 959-980.
Branco, Jorge Portugal (1998) Les Portugais residant en France - Breve caracterisation statistique. In PrésencePortugaise en France. CEMRI, Universidade Aberta, Lisboa.
Cordeiro, Albano (1989) Le paradoxe de l’immigration portugaise. Hommes & Migrations 1123, June-July.
Cunha, Maria do Céu (1988) Portugais de France. Éditions L’Harmattan, Paris.
Cunha, Maria do Céu (1989) Un défi: La réussite scolaire des enfants portugais. Hommes & Migrations 1123,June-July.
Dubet, François (1989) Immigrations: qu’en savon-nous?. Notes et Études Documentaires 4887, LaDocumentation Française, Paris.
EUROSTAT (1996) Retrato estatístico da União Europeia, Brussels.
EUROSTAT (1995) Demographic statistics. Brussels.
EUROSTAT (1999) Eurostatistics 10. Brussels.
Fernandes, Altina (1989) Les enfants Portugais à l’école française. Hommes & Migrations 1123, June-July.
IMF International Financial Statistics Yearbook, 1998.
INE [Instituto Nacinal de Estatística] (1998) Portugal Social, 1991/1995, Lisboa.
JE [Junta de Emigração] annual bulletins from 1960 to 1969.
Kotlok-Piok, Nathalie (1994) La Communaute Portugaise en France - Espace et Devenir, Doctoral thesis inGeography, Universite de Toulouse- Le-Mirail – Institute Daniel Faucher, U.F.R. de Geographieet Amenagement.
Labat, Jean-Claud (1992) La Population étrangère en France par nationalité. Problèmes économiques 2301, 25Nov. (INSEE Première).
Lebon, André (1989) L’immigration Portugaise in France – Dossier statistique. Hommes & Migrations 1123,June-July.
Lévy, Michel Louis (1998) La Population de la France, 1995-1997. Populations & Sociétés 333, March 1998.
OCDE Main economic Indicators Dec.1996 and Dec1997, Paris.
SECP [Secretaria de Estado das Comunidades Portuguesas] annual bulletins from 1986 to 1988.
SEE [Secretaria de Estado da Emigração] annual bulletins from 1973 to 1975.
SEECP [Secretaria de Estado da Emigração e Comunidades Portuguesas] annual bulletins from 1976 to 1985.
Silberman, Roxane and Fournier, Irène “Educational attainment and unemployment for immigrants in France:An investigation of the discrimination hypothesis” presented at Metropolitan Economic Performance TSERconference, Lisbon, October29- November 1st 1998.
SNE [Secretariado Nacional da Emigração] annual bulletins from 1970 to 1972.
Tribalat, Michèle, Garson, J.P., Moulier-Boutang, Y. and, Silberman, R. (1991) Cent Ans D’Immigration,Étrangers D’Hier Français D’Aujourd’hui. Travaux et Documents, INED/PUF, Paris.
Tribalat, Michèle (1995) Faire France - Une enquête sur les immigrés et les enfants. Éditions La Découverte,Paris.

ii
Other Bibliography
Almeida, J.F. (1993) Integração social e exclusão social: algumas questões. Análise Social xxviii (123-124).
Antunes, M.L.M. (1981) Migrações, mobilidade social e identidade cultural: factos e hipóteses sobre o casoportuguês. Análise Social xvii (65).
Baganha, Maria Ioannis and Pereira, Pedro T.(1999) Portuguese Migration: from the regulation of the outflowsto the regulation of the inflows. Mimeo.
Bauer, T., Pereira, P.T., Vogler, M. and Zimmermann, K.F. (1998) Portuguese migration to Germany: AnAnalysis of the labor market performance and self-selection. Iza Discussion Papers 20, CEPRDiscussion Papers 2047.
Borjas, G.J. (1991) Immigration and the family. Journal of Labor Economics 9, No.2.
Borjas, G.J. (1994) Immigrant skills and ethnic spillovers. Journal of Population Economics 7: 99-118.
Branco, J. P. (1986) A estrutura da comunidade Portuguesa em França. Secretaria de Estado das ComunidadesPortuguesas - Centro de Estudos, Porto.
Cordeiro, A. (1992) La communauté Portugaise de France Colóquio Internacional sobre a emigração e imigraçãoportuguesa – séculos XIX e XX, ISCTE nov.1992, Lisboa.
Dustman, C. (1996) The social assimilation of immigrants. Journal of Population Economics 9.
Fénart, J.S. (1987) Jeunes d’aujourd’hui – Les “Beurs” font leurs chemin. Notes et Études Documentaires, LaDocumentation Française, Paris.
Ferrão, J. (1996) Três décadas de consolidação do Portugal demográfico moderno. In A situação Social emPortugal, 1960-1995. Instituto de Ciências Sociais da Universidade de Lisboa.
Frybès, M. (1992) Un équilibre pragmatique fragile. Notes et Études Documentaire 4952, La DocumentationFrançaise, Paris.
Garson, J.P. (1987) Le chômage des étrangers in France. Problèmes Economiques 2010, 4Feb.
Garson, J.P. (1992) International migration: facts, figures, policies. OECD Observer 176, Jun/Jul.
Garson, J.P. and Neymarc, K.(1996) Integrating immigrants in urban life. OECD Observer 197.
Geddes, A. (1995) Immigrant and ethnic minorities and the E.U. “democratic deficit”. Journal of commonmarket studies 33, No.2, Jul.
Lapeyronnie, D. (1992) Les politiques locales d’intégration des immigrés en Europe in Immigrés en Europe –politiques locales d’intégration. Notes et Études Documentaires 4952, La Documentation Française,Paris.
Neto, F. (1985) Jovens Portugueses em França – Aspectos da sua adaptação psico-social. Série migrações,Secretaria de Estado das Comunidades Portuguesas - Centro de Estudos, Porto.
Pereira, P.T. (1994) Portuguese emigration 1958-1985: some empirical evidence. Empirical Economics 19: 647-657.
Raveau, François (1998) Espaces Pluriculturels et Ethnicité: Présence Portugaise en France. In PrésencePortugaise en France. CEMRI, Universidade Aberta., Lisboa.
Serrão, J. (1985) Notas sobre emigração e mudança social no Portugal contemporâneo. Análise Social xxi (87-88-89).
Trindade, M.B.R. (1981) Estudos sobre a emigração Portuguesa. Cadernos da Revista Económica e Social.
Verhaeren, R-E. (1986) Politiques d’immigration en Europe. Problèmes Politiques et Sociaux 530, 21 Feb, LaDocumentation Française, Paris.
Villanova, R. (1983) A segunda geração de emigrantes – potencial ou “handicap”?. Análise Social xix 877-78-79).

iii
Zimmermann, K.F. (1995) European Migration: Push and Pull. In Proceedings of the World Bank AnnualConference on Development Economics 1994, supplement to the World Bank Economic Reviewand the World Bank Research Observer 1995.
Zimmermann, K.F. (1995) Tackling the European Migration Problem. Journal of Economic Perspectives 9,No.2.

iv

Appendix A
Table 1: Age by age at migration, 1994age at migration
age 0-4 5-10 11-16 17-20 21-30 31-40 41-50 +50 Total15-20 41 0 4 0 0 0 0 0 45
%row 91.11 0.00 8.89 0.00 0.00 0.00 0.00 0.00 100.00%column 28.28 0.00 5.71 0.00 0.00 0.00 0.00 0.00
21-25 47 7 4 14 6 0 0 0 78%row 60.26 8.97 5.13 17.95 7.69 0.00 0.00 0.00 100.00
%column 32.41 11.48 5.71 13.21 2.62 0.00 0.00 0.0026-30 40 21 8 7 18 0 0 0 94
%row 42.55 22.34 8.51 7.45 19.15 0.00 0.00 0.00 100.00%column 27.59 34.43 11.43 6.60 7.86 0.00 0.00 0.00
31-35 15 24 9 17 15 4 0 0 84%row 17.86 28.57 10.71 20.24 17.86 4.76 0.00 0.00 100.00
%column 10.34 39.34 12.86 16.04 6.55 4.17 0.00 0.0036-40 2 7 32 16 21 12 0 0 90
%row 2.22 7.78 35.56 17.78 23.33 13.33 0.00 0.00 100.00%column 1.38 11.48 45.71 15.09 9.17 12.50 0.00 0.00
41-45 0 2 10 37 25 4 0 0 78%row 0.00 2.56 12.82 47.44 32.05 5.13 0.00 0.00 100.00
%column 0.00 3.28 14.29 34.91 10.92 4.17 0.00 0.0046-50 0 0 3 10 66 2 2 0 83
%row 0.00 0.00 3.61 12.05 79.52 2.41 2.41 0.00 100.00%column 0.00 0.00 4.29 9.43 28.82 2.08 18.18 0.00
51-60 0 0 0 5 74 40 1 0 120%row 0.00 0.00 0.00 4.17 61.67 33.33 0.83 0.00 100.00
%column 0.00 0.00 0.00 4.72 32.31 41.67 9.09 0.00+60 0 0 0 0 4 34 8 5 51
%row 0.00 0.00 0.00 0.00 7.84 66.67 15.69 9.80 100.00%column 0.00 0.00 0.00 0.00 1.75 35.42 72.73 100.00
Total 145 61 70 106 229 96 11 5 723%total 20.06 8.44 9.68 14.66 31.67 13.28 1.52 0.69
Table 2: Age by age at migration, 1995age at migration
age 0-4 5-10 11-16 17-20 21-30 31-40 41-50 +50 Total15-20 29 2 2 2 0 0 0 0 35
%row 82.86 5.71 5.71 5.71 0.00 0.00 0.00 0.00 100.00%column 25.89 2.25 2.82 2.00 0.00 0.00 0.00 0.00
21-25 30 4 7 10 10 0 0 0 61%row 49.18 6.56 11.48 16.39 16.39 0.00 0.00 0.00 100.00
%column 26.79 4.49 9.86 10.00 4.31 0.00 0.00 0.0026-30 39 22 5 12 30 0 0 0 108
%row 36.11 20.37 4.63 11.11 27.78 0.00 0.00 0.00 100.00%column 34.82 24.72 7.04 12.00 12.93 0.00 0.00 0.00
31-35 11 44 15 9 25 6 0 0 110%row 10.00 40.00 13.64 8.18 22.73 5.45 0.00 0.00 100.00
%column 9.82 49.44 21.13 9.00 10.78 9.09 0.00 0.0036-40 2 14 22 16 10 6 0 0 70
%row 2.86 20.00 31.43 22.86 14.29 8.57 0.00 0.00 100.00%column 1.79 15.73 30.99 16.00 4.31 9.09 0.00 0.00
41-45 0 2 14 29 24 2 2 0 73%row 0.00 2.74 19.18 39.73 32.88 2.74 2.74 0.00 100.00
%column 0.00 2.25 19.72 29.00 10.34 3.03 12.50 0.0046-50 0 1 4 15 51 0 3 0 74
%row 0.00 1.35 5.41 20.27 68.92 0.00 4.05 0.00 100.00%column 0.00 1.12 5.63 15.00 21.98 0.00 18.75 0.00
51-60 0 0 1 7 76 29 2 1 116%row 0.00 0.00 0.86 6.03 65.52 25.00 1.72 0.86 100.00
%column 0.00 0.00 1.41 7.00 32.76 43.94 12.50 11.11+60 1 0 1 0 6 23 9 8 48
%row 2.08 0.00 2.08 0.00 12.50 47.92 18.75 16.67 100.00%column 0.89 0.00 1.41 0.00 2.59 34.85 56.25 88.89
Total 112 89 71 100 232 66 16 9 695%total 16.12 12.81 10.22 14.39 33.38 9.50 2.30 1.29

Table 3: Nationality by age1994 1995
Naturalized Total Naturalized Total
age French Portuguese (whole sample) French Portuguese (whole sample)15-20 0 149 155 0 113 116
%row 0.00 96.13 0.00 97.41%column 0.00 9.07 0.00 7.24
21-25 9 149 165 4 119 128%row 5.45 90.30 3.13 92.97
%column 3.77 9.07 1.54 7.6226-30 29 184 230 25 210 254
%row 12.61 80.00 9.84 82.68%column 12.13 11.20 9.62 13.45
31-35 39 168 240 32 194 251%row 16.25 70.00 12.75 77.29
%column 16.32 10.23 12.31 12.4336-40 40 192 252 47 166 237
%row 15.87 76.19 19.83 70.04%column 16.74 11.69 18.08 10.63
41-45 36 198 259 50 168 242%row 13.90 76.45 20.66 69.42
%column 15.06 12.05 19.23 10.7646-50 36 226 281 45 197 256
%row 12.81 80.43 17.58 76.95%column 15.06 13.76 17.31 12.62
51-60 26 264 308 29 280 326%row 8.44 85.71 8.90 85.89
%column 10.88 16.07 11.15 17.94+60 24 113 143 28 114 148
%row 16.78 79.02 18.92 77.03%column 10.04 6.88 10.77 7.30
Column's total 239 1643 2033 260 1561 1958%row 11.76 80.82 13.28 79.72

Table 4: Naturalisations by age bracket1994 1995
Males % (1) Females % (2) Males % (1) Females % (2)
15-20 0 0.00% 0 0.00% 0 0% 0 0%21-25 3 3.19% 6 8.45% 2 2.94% 2 3.33%26-30 12 9.60% 17 16.19% 9 6.98% 16 12.80%31-35 16 13.11% 23 19.49% 7 5.47% 25 20.33%36-40 21 16.80% 19 14.96% 24 19.83% 23 19.83%41-45 21 16.94% 15 11.11% 32 25.40% 18 15.52%46-50 21 13.38% 15 12.10% 25 18.94% 20 16.13%51-60 9 5.36% 17 12.14% 12 6.67% 17 11.64%+60 15 20.27% 9 13.04% 17 23.94% 11 14.29%
Sum 118 11.03% 121 12.56% 128 12.65% 132 13.95% (1) % of correspondent males'total age bracket(2) % of correspondent females'total age bracket

Table 5: Residency region by age group, 1994
Regionsage Ile-de-FranceRhône-Alpes Centre Auvergne Picardie Bourgogne AquitaineFranche-Compté Others Total
15 - 20 62 10 5 10 13 5 6 9 35 155%row 40.00 6.45 3.23 6.45 8.39 3.23 3.87 5.81 22.58
%column 7.93 5.35 4.55 9.90 13.27 5.43 7.41 11.69 6.9321 - 25 58 16 17 2 6 11 8 7 40 165
%row 35.15 9.70 10.30 1.21 3.64 6.67 4.85 4.24 24.24%column 7.42 8.56 15.45 1.98 6.12 11.96 9.88 9.09 7.9226 - 30 85 19 12 11 12 10 17 8 56 230
%row 36.96 8.26 5.22 4.78 5.22 4.35 7.39 3.48 24.35%column 10.87 10.16 10.91 10.89 12.24 10.87 20.99 10.39 11.0931 - 35 88 19 15 9 10 6 7 10 76 240
%row 36.67 7.92 6.25 3.75 4.17 2.50 2.92 4.17 31.67%column 11.25 10.16 13.64 8.91 10.20 6.52 8.64 12.99 15.0536 - 40 115 24 11 11 9 10 17 10 45 252
%row 45.63 9.52 4.37 4.37 3.57 3.97 6.75 3.97 17.86%column 14.71 12.83 10.00 10.89 9.18 10.87 20.99 12.99 8.9141 - 45 102 22 12 19 10 15 8 8 63 259
%row 39.38 8.49 4.63 7.34 3.86 5.79 3.09 3.09 24.32%column 13.04 11.76 10.91 18.81 10.20 16.30 9.88 10.39 12.4846 - 50 114 19 15 14 10 16 12 9 72 281
%row 40.57 6.76 5.34 4.98 3.56 5.69 4.27 3.20 25.62%column 14.58 10.16 13.64 13.86 10.20 17.39 14.81 11.69 14.2651 - 60 120 40 11 13 22 10 6 14 72 308
%row 38.96 12.99 3.57 4.22 7.14 3.25 1.95 4.55 23.38%column 15.35 21.39 10.00 12.87 22.45 10.87 7.41 18.18 14.26
+60 38 18 12 12 6 9 0 2 46 143%row 26.57 12.59 8.39 8.39 4.20 6.29 0.00 1.40 32.17
%column 4.86 9.63 10.91 11.88 6.12 9.78 0.00 2.60 9.11Total 782 187 110 101 98 92 81 77 505 2033
%total 38.47 9.20 5.41 4.97 4.82 4.53 3.98 3.79 24.84

Table 6: Residency region by age group, 1995
Regionsage Ile-de-FranceRhône-Alpes Centre Auvergne Picardie Bourgogne AquitaineFranche-Compté Others Total
15 - 20 44 8 5 4 8 8 4 11 24 116%row 37.93 6.90 4.31 3.45 6.90 6.90 3.45 9.48 20.69 100.00
%column 6.06 3.98 5.38 5.13 9.30 6.67 4.60 13.10 4.9721 - 25 50 11 5 6 4 7 7 11 27 128
%row 39.06 8.59 3.91 4.69 3.13 5.47 5.47 8.59 21.09 100.00%column 6.89 5.47 5.38 7.69 4.65 5.83 8.05 13.10 5.5926 - 30 100 35 11 9 14 11 14 7 53 254
%row 39.37 13.78 4.33 3.54 5.51 4.33 5.51 2.76 20.87 100.00%column 13.77 17.41 11.83 11.54 16.28 9.17 16.09 8.33 10.9731 - 35 92 20 16 8 10 13 12 8 72 251
%row 36.65 7.97 6.37 3.19 3.98 5.18 4.78 3.19 28.69 100.00%column 12.67 9.95 17.20 10.26 11.63 10.83 13.79 9.52 14.9136 - 40 95 23 13 13 7 13 12 7 54 237
%row 40.08 9.70 5.49 5.49 2.95 5.49 5.06 2.95 22.78 100.00%column 13.09 11.44 13.98 16.67 8.14 10.83 13.79 8.33 11.1841 - 45 100 20 7 6 8 20 12 13 56 242
%row 41.32 8.26 2.89 2.48 3.31 8.26 4.96 5.37 23.14 100.00%column 13.77 9.95 7.53 7.69 9.30 16.67 13.79 15.48 11.5946 - 50 95 23 14 13 7 20 12 8 64 256
%row 37.11 8.98 5.47 5.08 2.73 7.81 4.69 3.13 25.00 100.00%column 13.09 11.44 15.05 16.67 8.14 16.67 13.79 9.52 13.2551 - 60 115 37 9 10 25 12 14 17 87 326
%row 35.28 11.35 2.76 3.07 7.67 3.68 4.29 5.21 26.69 100.00%column 15.84 18.41 9.68 12.82 29.07 10.00 16.09 20.24 18.01
+60 35 24 13 9 3 16 0 2 46 148%row 23.65 16.22 8.78 6.08 2.03 10.81 0.00 1.35 31.08 100.00
%column 4.82 11.94 13.98 11.54 3.49 13.33 0.00 2.38 9.52Total 726 201 93 78 86 120 87 84 483 1958
%total 37.08 10.27 4.75 3.98 4.39 6.13 4.44 4.29 24.67 100.00

Table 7:Educational level attained by age, 1994Age
nivplan 15 16 17 18 19 20 21- 23 24- 25 26- 30 31- 35 36- 40 41- 45 46- 50 51- 60 61- 70 71- 90Row's totalUniversity degree 0 0 0 0 0 0 0 3 9 4 2 2 0 0 1 0 21
%row 0.00 0.00 0.00 0.00 0.00 0.00 0.00 14.29 42.86 19.05 9.52 9.52 0.00 0.00 4.76 0.00 %total%column 0.00 0.00 0.00 0.00 0.00 0.00 0.00 3.80 3.91 1.67 0.79 0.77 0.00 0.00 0.86 0.00 1.03
BAC+2 0 0 0 0 0 0 4 3 11 5 1 1 0 0 0 0 25%row 0.00 0.00 0.00 0.00 0.00 0.00 16.00 12.00 44.00 20.00 4.00 4.00 0.00 0.00 0.00 0.00 %total
%column 0.00 0.00 0.00 0.00 0.00 0.00 4.65 3.80 4.78 2.08 0.40 0.39 0.00 0.00 0.00 0.00 1.23BAC 0 0 1 0 3 6 12 3 2 1 2 1 1 0 1 0 33
%row 0.00 0.00 3.03 0.00 9.09 18.18 36.36 9.09 6.06 3.03 6.06 3.03 3.03 0.00 3.03 0.00 %total%column 0.00 0.00 5.00 0.00 11.54 28.57 13.95 3.80 0.87 0.42 0.79 0.39 0.36 0.00 0.86 0.00 1.62
Terminale & BAC-PRO 0 0 0 4 7 4 6 8 14 14 6 3 2 2 2 1 73%row 0.00 0.00 0.00 5.48 9.59 5.48 8.22 10.96 19.18 19.18 8.22 4.11 2.74 2.74 2.74 1.37 %total
%column 0.00 0.00 0.00 14.81 26.92 19.05 6.98 10.13 6.09 5.83 2.38 1.16 0.71 0.65 1.72 3.70 3.59
Higher secondary & CAP-BEP after 5ème 0 7 10 15 13 7 35 31 103 88 60 21 13 8 3 1 415%row 0.00 1.69 2.41 3.61 3.13 1.69 8.43 7.47 24.82 21.20 14.46 5.06 3.13 1.93 0.72 0.24 %total
%column 0.00 28.00 50.00 55.56 50.00 33.33 40.70 39.24 44.78 36.67 23.81 8.11 4.63 2.60 2.59 3.70 20.41Lower secondary 13 9 8 8 1 2 8 7 29 33 12 9 5 7 0 0 151
%row 8.61 5.96 5.30 5.30 0.66 1.32 5.30 4.64 19.21 21.85 7.95 5.96 3.31 4.64 0.00 0.00 %total%column 36.11 36.00 40.00 29.63 3.85 9.52 9.30 8.86 12.61 13.75 4.76 3.47 1.78 2.27 0.00 0.00 7.43
Cinquième, CPPN, CPA or CEP 22 9 1 0 0 2 11 12 24 32 20 8 10 7 1 0 159%row 13.84 5.66 0.63 0.00 0.00 1.26 6.92 7.55 15.09 20.13 12.58 5.03 6.29 4.40 0.63 0.00 %total
%column 61.11 36.00 5.00 0.00 0.00 9.52 12.79 15.19 10.43 13.33 7.94 3.09 3.56 2.27 0.86 0.00 7.82Elementary 1 0 0 0 2 0 9 12 35 59 145 199 229 210 70 11 982
%row 0.10 0.00 0.00 0.00 0.20 0.00 0.92 1.22 3.56 6.01 14.77 20.26 23.32 21.38 7.13 1.12 %total%column 2.78 0.00 0.00 0.00 7.69 0.00 10.47 15.19 15.22 24.58 57.54 76.83 81.49 68.18 60.34 40.74 48.30
Others 0 0 0 0 0 0 1 0 3 4 4 15 21 74 38 14 174%row 0.00 0.00 0.00 0.00 0.00 0.00 0.57 0.00 1.72 2.30 2.30 8.62 12.07 42.53 21.84 8.05 %total
%column 0.00 0.00 0.00 0.00 0.00 0.00 1.16 0.00 1.30 1.67 1.59 5.79 7.47 24.03 32.76 51.85 8.56
Column's total 36 25 20 27 26 21 86 79 230 240 252 259 281 308 116 27 2033% total 1.77 1.23 0.98 1.33 1.28 1.03 4.23 3.89 11.31 11.81 12.40 12.74 13.82 15.15 5.71 1.33

Table 8:Educational level attained by age, 1995Age
nivplan 15 16 17 18 19 20 21- 23 24- 25 26- 30 31- 35 36- 40 41- 45 46- 50 51- 60 61- 70 71- 90Row's totalUniversity degree 0 0 0 0 0 0 0 1 6 3 2 1 0 0 0 0 13
%row 0.00 0.00 0.00 0.00 0.00 0.00 0.00 7.69 46.15 23.08 15.38 7.69 0.00 0.00 0.00 0.00 %total%column 0.00 0.00 0.00 0.00 0.00 0.00 0.00 1.59 2.36 1.20 0.84 0.41 0.00 0.00 0.00 0.00 0.66
BAC+2 0 0 0 0 0 0 3 4 13 7 6 0 0 0 1 0 34%row 0.00 0.00 0.00 0.00 0.00 0.00 8.82 11.76 38.24 20.59 17.65 0.00 0.00 0.00 2.94 0.00 %total
%column 0.00 0.00 0.00 0.00 0.00 0.00 4.62 6.35 5.12 2.79 2.53 0.00 0.00 0.00 0.90 0.00 1.74BAC 0 0 0 1 1 7 5 1 5 2 2 1 1 0 1 0 27
%row 0.00 0.00 0.00 3.70 3.70 25.93 18.52 3.70 18.52 7.41 7.41 3.70 3.70 0.00 3.70 0.00 %total%column 0.00 0.00 0.00 4.76 6.25 33.33 7.69 1.59 1.97 0.80 0.84 0.41 0.39 0.00 0.90 0.00 1.38
Terminale & BAC-PRO 0 0 3 3 3 3 9 6 15 14 11 2 1 1 0 2 73%row 0.00 0.00 4.11 4.11 4.11 4.11 12.33 8.22 20.55 19.18 15.07 2.74 1.37 1.37 0.00 2.74 %total
%column 0.00 0.00 23.08 14.29 18.75 14.29 13.85 9.52 5.91 5.58 4.64 0.83 0.39 0.31 0.00 5.41 3.73
Higher secondary & CAP-BEP after 5ème 0 6 5 14 9 6 19 25 112 104 65 28 12 11 2 2 420%row 0.00 1.43 1.19 3.33 2.14 1.43 4.52 5.95 26.67 24.76 15.48 6.67 2.86 2.62 0.48 0.48 %total
%column 0.00 22.22 38.46 66.67 56.25 28.57 29.23 39.68 44.09 41.43 27.43 11.57 4.69 3.37 1.80 5.41 21.45Lower secondary 4 12 5 3 3 2 9 5 31 27 22 12 7 6 1 0 149
%row 2.68 8.05 3.36 2.01 2.01 1.34 6.04 3.36 20.81 18.12 14.77 8.05 4.70 4.03 0.67 0.00 %total%column 22.22 44.44 38.46 14.29 18.75 9.52 13.85 7.94 12.20 10.76 9.28 4.96 2.73 1.84 0.90 0.00 7.61
Cinquième, CPPN, CPA or CEP 14 9 0 0 0 1 11 9 25 34 25 13 12 8 1 0 162%row 8.64 5.56 0.00 0.00 0.00 0.62 6.79 5.56 15.43 20.99 15.43 8.02 7.41 4.94 0.62 0.00 %total
%column 77.78 33.33 0.00 0.00 0.00 4.76 16.92 14.29 9.84 13.55 10.55 5.37 4.69 2.45 0.90 0.00 8.27Elementary 0 0 0 0 0 2 9 12 45 57 100 175 209 242 67 17 935
%row 0.00 0.00 0.00 0.00 0.00 0.21 0.96 1.28 4.81 6.10 10.70 18.72 22.35 25.88 7.17 1.82 %total%column 0.00 0.00 0.00 0.00 0.00 9.52 13.85 19.05 17.72 22.71 42.19 72.31 81.64 74.23 60.36 45.95 47.75
Others 0 0 0 0 0 0 0 0 2 3 4 10 14 58 38 16 145%row 0.00 0.00 0.00 0.00 0.00 0.00 0.00 0.00 1.38 2.07 2.76 6.90 9.66 40.00 26.21 11.03 %total
%column 0.00 0.00 0.00 0.00 0.00 0.00 0.00 0.00 0.79 1.20 1.69 4.13 5.47 17.79 34.23 43.24 7.41
Column's total 18 27 13 21 16 21 65 63 254 251 237 242 256 326 111 37 1958% total 0.92 1.38 0.66 1.07 0.82 1.07 3.32 3.22 12.97 12.82 12.10 12.36 13.07 16.65 5.67 1.89


Graph 1:Educational level attained by age, 1994
0%10%20%30%40%50%60%70%80%90%
100%
15 16 17 18 19 20 21- 23 24- 25 26- 30 31- 35 36- 40 41- 45 46- 50 51- 60 61- 70 71- 90
Age
University degree BAC+2
BAC Terminale & BAC-PRO
Higher secondary & CAP-BEP after 5ème Lower secondary
Cinquième, CPPN, CPA or CEP Elementary
Others

Graph 2:Educational level attained by age, 1995
0%
10%
20%
30%
40%
50%
60%
70%
80%
90%
100%
15 16 17 18 19 20 21- 23 24- 25 26- 30 31- 35 36- 40 41- 45 46- 50 51- 60 61- 70 71- 90
Age
University degree BAC+2
BAC Terminale & BAC-PRO
Higher secondary & CAP-BEP after 5ème Lower secondary
Cinquième, CPPN, CPA or CEP Elementary
Others

Appendix B
The French educational system is a little bit complex and very different from the
Portuguese. In this circumstances we found useful to include in our work a short description of
it.
The French educational system suffered a reform in 1989. Since that time, alterations
have been introduced. However, as the individuals in our samples are, at least, 15 years old,
they were not under this new educational system, even because the reform has been put into
practice in a gradual way starting with the first years of schooling. So, we are going to describe
the previous system, not the actual one.
The elementary school in France was composed of three different cycles in a total of 5
years (one more than the in Portugal). In general children go to elementary school when they are
6 years old, and finish it when they are 11. Afterwards, they go to the so called “6ème”, the first
of the four years of the first secondary cycle (lower secondary). This cycle continues with
“5ème”, “4ème”, and finally “3ème”. This cycle is compulsory.
The minimum age to leave school is 16 years old. Therefore it could happen that a
student has to continue his education beyond “3ème”, that is, he or she must go into the second
secondary cycle (higher secondary). This cycle consists of three more years: “2nd”, “1er” and
the final year, “terminale”.
If a student wishes to attend university he also needs to take an admission exam. This way
he obtains a certificate, which differs accordingly to the branch from which he came. There are
then three kinds of certificates: the “Bauccalauréat d’enseignement général” (BAC général), the
“Bauccalauréat technologique” (BTn), and “Brevet de Technicien” (BT).
Those students who do not pass this exam but have a grade average of 8 over 20 still get
the “Certificat de fin d’études secondaires” or the “Certificat de fin d’études professionelles
secondaires”.
In the secondary school students can choose between two types of education: academic
education or vocational education. This choice is available already at the end of “5ème”. At that
point students can choose one of the following four options:
• Finishing the lower secondary school at the collège (the comprehensive secondary
school), which means attending the traditional “4ème” and “3ème”.
• Going to the “4ème préparatoire” class at a lycée professionnel (vocational lycée) to
obtain a “Certificat d’aptitude professionnelle” (CAP) in a three years period. With
this certificate one could enter the labour market as qualified worker.
• Going to a special class, the “classes préprofessionnelles de niveau” (CPPN), which
allows students to learn about some working skills before going to “4ème
préparatoire”.

• Going to the “classe préparatoire à la apprentissage” (CPA), which allows students a
closer contact with a particular job. After this class students usually go to
“apprentissage” that consists of working for someone and attending classes in a
“Centre de formation d’apprendis” (Apprentice Training Center) at the same time. In
two or three years, students get the CAP as in the lycée professionnel.
It is also possible to undertake a vocational education in the higher secondary. Instead of
going to a traditional lycée, and following the so-called cycle long, a student can go to a lycée
professionnel, following a cycle court. In two years time a student get the “Brevet d’études
professionnelles” (BEP) or the CAP. The CAP certificate could also be obtained in a “Centre
de formation d’apprendis”.
The difference between BEP and CAP is that the former entails the formation of qualified
workers for a broad group of activities within a given sector – industrial, commercial,
administrative or others – whereas the latter is industrial specific.
After the higher secondary school there are again multiple choices. If it is true that BAC
is demanded to proceed with studies at the university level, it is also true that a number of
specialisations exist for which BAC is not necessary. However, we will not mention them here,
nor will we mention higher education, for the number of individuals in the samples with those
kinds of educational qualifications is rather small.
Appendix C
Marginal effects on prob(Y=i), for i=Others & Elementary, Lower secondary school, CAP-BEP after 5ème, CAP-BEP after 3ème, Upper secondary, BAC+2 & Univ.degree
1994
Others and Elementary Lower secondary CAP-BEP after 5ème CAP-BEP after 3ème Upper secondary BAC+2 & Univ. degreeConstant -1.0839 0.4451 0.3132 0.1305 0.1258 0.6933Agd 0.0373 -0.0139 -0.01 -0.0051 -0.0052 -0.0034Sexo 0.0927 n.s -0.076 -0.0192 n.s n.sConstant -0.9859 0.4302 0.2586 0.1101 0.1165 0.7049Agd 0.0359 -0.0137 -0.0091 -0.0047 -0.0051 -0.0034sexo 0.0933 n.s -0.0731 -0.0197 n.s n.sPqual -0.138 n.s 0.0748 0.0234 0.017 n.sConstant -1.0447 0.4401 0.3038 0.1246 0.1196 0.0566Agd 0.0368 -0.014 -0.01 -0.005 -0.0051 -0.0028Sexo 0.1038 n.s -0.0786 -0.021 n.s n.sNat -0.2186 n.s 0.1204 0.0354 n.s 0.0304Constant -0.9528 0.4246 0.2569 0.1023 0.1113 0.0577Agd 0.0355 -0.0138 -0.0094 -0.0045 -0.005 -0.0029Sexo 0.1037 n.s -0.0778 -0.0208 n.s n.sNat -0.2204 n.s 0.1216 0.0348 n.s 0.0298Pqual -0.1273 n.s 0.069 0.022 0.0146 n.sConstant -0.5221 0.4086 0.037 0.0175 0.0237 0.0353Agd 0.0254 -0.0139 -0.004 -0.0018 -0.0034 -0.0023Cagi010 -0.5021 0.1501 0.1869 0.0512 0.0904 n.sCdi75 n.s n.s -0.0774 -0.0239 n.s n.sSexo 0.0988 n.s -0.0945 -0.0206 n.s n.sPqual n.s n.s 0.0933 n.s n.s n.sConstant -0.4854 0.5446 0.1299 0.0275 -0.1426 -0.0741Agd -0.0248 -0.0166 -0.0059 -0.002 n.s n.sCag029 n.s n.s n.s n.s 0.889 0.054Cagi010 -0.4996 0.1387 0.1793 0.0491 0.1013 n.sCdi75 n.s n.s -0.0809 -0.0251 n.s n.sSexo 0.0989 n.s -0.0929 -0.0201 n.s n.sPqual n.s n.s 0.0879 n.s n.s n.sConstant 0.7224 -0.2658 -0.1576 -0.0806 -0.1393 -0.079Cag029 -0.2879 0.1168 n.s n.s 0.0855 0.0523Cagi010 -0.8057 0.3543 0.2415 0.0865 0.0925 0.0301Cdi75 -0.1653 0.1939 n.s n.s n.s n.sSexo 0.0893 n.s -0.0938 -0.025 n.s n.sPqual -0.1561 n.s 0.11 n.s n.s n.s
Marginal effects on prob(Y=i), for i=Others & Elementary, Lower secondary school, CAP-BEP after 5ème, CAP-BEP after 3ème, Upper secondary, BAC+2 & Univ.degree
1995
Others and elementary Lower secondary CAP-BEP after 5ème CAP-BEP after 3ème Upper secondary BAC+2 & Univ. degree
Constant a)
AgdSexoConstant -0.9279 0.4037 0.2343 0.1184 0.1153 0.0561Agd 0.0347 -0.0132 -0.0082 -0.0054 -0.0049 -0.0031Sexo n.s 0.0324 -0.0745 n.s n.s n.sPqual -0.1753 0.0371 0.0759 0.0411 0.0145 n.sConstant -1.0785 0.4577 0.2973 0.1452 0.1259 0.0524Agd 0.0374 -0.0144 -0.0095 -0.0057 -0.0051 -0.0026Sexo 0.0552 0.0299 -0.0833 n.s n.s n.sNat -0.2394 n.s 0.0989 0.0523 0.0254 0.0311Constant -0.9518 0.4191 0.2448 0.1146 0.1233 0.0501Agd 0.0357 -0.0139 -0.0089 -0.0052 -0.0051 -0.0026Sexo n.s 0.0382 -0.0786 n.s n.s n.sNat -0.2368 n.s 0.1012 0.0505 0.0267 0.0308Pqual -0.1584 0.0342 0.0772 0.0332 n.s n.sConstant -0.8608 0.6013 0.2116 0.0612 0.0195 -0.0328Agd 0.035 -0.0186 -0.0073 -0.0044 -0.0032 n.sCagi010 -0.545 n.s 0.2032 0.1008 0.0884 n.sCdi75 0.1972 n.s -0.1242 -0.0422 n.s 0.0521Sexo n.s 0.0883 -0.1073 n.s n.s n.sPqual n.s n.s n.s 0.039 n.s n.sConstant -1.092 0.7428 0.2754 0.0699 0.0434 -0.0395Agd 0.0402 -0.0217 -0.0088 -0.0047 -0.0037 n.sCag029 0.1986 -0.1158 n.s n.s n.s n.sCagi010 -0.5371 n.s 0.204 0.1059 0.0844 0.0565Cdi75 0.1983 n.s -0.1201 -0.0417 n.s n.sSexo n.s 0.0799 -0.1019 n.s n.s n.sPqual n.s n.s n.s 0.0396 n.s n.sConstant 0.8133 -0.2833 -0.125 -0.1604 -0.1426 -0.102Cag029 -0.2364 0.1261 n.s 0.0379 n.s n.sCagi010 -0.9665 0.3318 0.28 0.1601 0.1325 0.0622Cdi75 -0.2322 0.1684 n.s n.s 0.0819 n.sSexo n.s 0.1066 -0.117 n.s n.s n.sPqual -0.1525 n.s n.s 0.0524 n.s n.s
a) Not enough variation on dependent variable
Note: The marginal effects are computed at the variables' means

mod.1 mod.2 mod.3 mod.4 mod.5 mod.6 mod.7Const x x x x x x xAgd x x x x x xSexo x x x x x x xPqual x x x x xNat x xCagi010 x x xCdi75 x x xCag029 x x
Percentage of predicted outcomes correct
1994 1995mod.1 61.9mod.2 62.8 61.8mod.3 63.8 59.8mod.4 64.5 60.4mod.5 69.5 63.7mod.6 66.3 63.7mod.7 67.5 63.4