portugal and the global crisis - friedrich ebert foundationlibrary.fes.de/pdf-files/id/10722.pdf ·...
TRANSCRIPT

STUDY
Portugal and the Global CrisisThe impact of austerity on the economy,
the social model and the performance of the state
PAULO PEDROSOApril 2014
� Successive Portuguese governments have followed the orientations of the European institutions regarding the response to the emerging challenges, since the inter-national financial crisis. The new conservative government (elected in 2011) took advantage of the situation of »limited sovereignty« and made a radical political shift. The new policy aims at a fundamental change in socio-economic power relations by deregulation and challenges the institutions of social dialogue created during the past 40 years.
� The austerity imposed by the Memorandum of Understanding (2011) launched the country into a deep recession that had devastating impacts on some sectors of the economy. The young and precarious workers were particularly affected, with youth unemployment rising to 37.7% (2012 and 2013). More poverty, more unemployed with less benefits, substantial cuts in old age pensions and the national health service in cost contention: Austerity and recession bring growing social problems while reducing public responses to these problems.
� Meanwhile public debt is skyrocketing, despite of recent signs of economic recovery and some success in reducing the current public deficit. The risk is that the therapy will destroy the social equilibrium the country had achieved during the past four decades without curing the disease of the unbearable public debt.

1
PAULO PEDROSO | PORTUGAL AnD ThE GLObAL CRiSiS
Content
introduction . . . . . . . . . . . . . . . . . . . . . . . . . . . . . . . . . . . . . . . . . . . . . . . . . . . . . . . . . . . . 2
1. Political management of the crisis: Three European approaches, three national governments . . . . . . . . . . . . . . . . . . . . . . . . . . . . . . . . . . . . . . . . . . . . . . . . . . . . . . . . 2
2. Economic recession, crisis and austerity . . . . . . . . . . . . . . . . . . . . . . . . . . . . . . . . . . . 42.1 Two waves of recession . . . . . . . . . . . . . . . . . . . . . . . . . . . . . . . . . . . . . . . . . . . . . . 4
2.2 Are exports the panacea? . . . . . . . . . . . . . . . . . . . . . . . . . . . . . . . . . . . . . . . . . . . . 5
2.3 Resilience and restructuring of economic sectors . . . . . . . . . . . . . . . . . . . . . . . . . . . 7
3. Employment, wages and the industrial relations model in transition . . . . . . . . . . . 93.1 Job destruction in a segmented labour market: Youths and precarious workers
most affected . . . . . . . . . . . . . . . . . . . . . . . . . . . . . . . . . . . . . . . . . . . . . . . . . . . . . 9
3.2 Labour law changes aimed at cheaper labour and easier dismissals . . . . . . . . . . . . . 13
3.3 Minimum wage freeze . . . . . . . . . . . . . . . . . . . . . . . . . . . . . . . . . . . . . . . . . . . . . . 15
3.4 Decline in wages . . . . . . . . . . . . . . . . . . . . . . . . . . . . . . . . . . . . . . . . . . . . . . . . . . . 16
3.5 Social dialogue and collective bargaining: On hold or at serious risk? . . . . . . . . . . . . 17
4. income and the welfare state: More social problems, fewer public responses . . . 194.1 Reduction in inequalities and poverty: Paused or reversed? . . . . . . . . . . . . . . . . . . . 19
4.2 More unemployed, fewer benefits . . . . . . . . . . . . . . . . . . . . . . . . . . . . . . . . . . . . . . 23
4.3 Real value of pensions slashed; more cuts to come . . . . . . . . . . . . . . . . . . . . . . . . . 25
4.4 Cost cuts in the national health service . . . . . . . . . . . . . . . . . . . . . . . . . . . . . . . . . . 26
5. Fiscal adjustment aimed at cutting the cost of social services . . . . . . . . . . . . . . . . . 295.1 Public debt skyrockets . . . . . . . . . . . . . . . . . . . . . . . . . . . . . . . . . . . . . . . . . . . . . . . 29
5.2 Privatization: An on-going story . . . . . . . . . . . . . . . . . . . . . . . . . . . . . . . . . . . . . . . . 33
6. Conclusion . . . . . . . . . . . . . . . . . . . . . . . . . . . . . . . . . . . . . . . . . . . . . . . . . . . . . . . . . . 34
References . . . . . . . . . . . . . . . . . . . . . . . . . . . . . . . . . . . . . . . . . . . . . . . . . . . . . . . . . . . . . 35

2
PAULO PEDROSO | PORTUGAL AnD ThE GLObAL CRiSiS
Introduction
This report assesses how Portugal’s strategy to deal with
the international economic crisis that began in 2008 has
affected the country’s economy and social situation.
Between 2008 and 2013 Portugal adopted three different
approaches to the crisis, each of which was implemented
by a different government. The first approach focused
on the sustainability of the financial sector. The second
shifted the focus to mitigating the adverse economic
and social impact of the crisis. And the third approach
concentrated on fiscal adjustment. Since 2008 Portugal
has had two centre-left governments, formed by the
Socialist Party, and one centre-right coalition govern-
ment. These governments implemented policies agreed
with the EU and later with the troika of the European
Commission (EC), the European Central Bank (ECB) and
the International Monetary Fund (IMF). The first chapter
of this report examines those policies.
The second chapter looks at the economic impact of
the crisis. In the aftermath of the Lehman Brothers
bankruptcy, Portugal approved a plan aimed at the
sustainability of the financial sector and stimulus to com-
pensate for the credit crunch. Later the country switched
from stimulus to austerity; this led to a second wave of
recession that had a devastating impact on some sectors
of the economy.
The economic recession also had a major effect on
employment and industrial relations. In a segmented
labour market, job destruction affected each age group
differently as well as having an impact on the contractual
status of employees. Public policy on the labour market
shifted from a reformist orientation to deregulation,
notwithstanding tight constitutional constraints, while
the minimum wage was frozen. A downward trend in
wages emerged and the dynamics of collective bargain-
ing changed significantly. The third chapter of this report
discusses those developments.
The fourth chapter focuses on family disposable income,
inequality, the welfare state and poverty. It reviews major
public initiatives on unemployment benefits, pensions
and the health system, which have been the core social
measures taken by successive governments since the
onset of the crisis.
Finally, we discuss the impact on the economy of the
management of the crisis. Stimulus leads to the deterio-
ration of public finances only in the short term. This begs
the question of whether fiscal adjustment can succeed
under the austerity approach demanded by Portugal’s
partners in the troika. We assess the evolution of public
expenditure, the public deficit and the public debt. And
we also review the implementation of the ambitious
privatization plan pursued by Portuguese governments
since the beginning of 2010.
1. Political management of the crisis: Three European approaches, three national governments
The prognosis for the Portuguese economy was pessimis-
tic even before the global financial crisis began. In 2006
the chief economist of the IMF had described Portugal
as a country in serious trouble, with anaemic growth of
productivity, very low economic growth, a large budget
deficit and the likely prospect of competitive disinflation
(Blanchard, 2006).
Portugal had little room to manoeuvre to adapt to the cri-
sis since it had its own pre-crisis economic constraints and
needed to comply with the EU’s requirements, especially
as a member of the Eurozone. Europe’s approach to the
crisis has evolved in three phases (Caldas, 2013): financial
(March-December 2008), economic (December 2008
to February 2010) and budgetary (from February 2010
onwards).
Portugal has followed EU conditions to the letter,
adapting national priorities to meet the demands that
have been made in each of the three phases. In the first
phase, it adopted the »initiative for the reinforcement of
financial stability«, through which the government aimed
to boost confidence in the domestic financial system and
comply with EU mechanisms. Under the EU umbrella, the
Portuguese government focused on preventing systemic
risk to the financial system and took measures such as
injecting capital into financial institutions, offering state
guarantees for borrowing of banks and even nationaliz-
ing two troubled banks (BPN and BPP).
Following the European Council of December 2008, at
which the focus of EU strategy changed from ensuring
financial stability to overcoming the economic crisis, the

3
PAULO PEDROSO | PORTUGAL AnD ThE GLObAL CRiSiS
Portuguese government adopted in January 2009 the
»initiative for investment and employment«. The goal of
that initiative was to increase public consumption and
public investment in order to support both domestic de-
mand and enterprises in the real economy at a time when
the latter were facing the dual problem of the collapse
of external demand owing to the decline in international
trade and severely restricted access to credit owing to the
difficulties of the financial system.
When EU strategy changed once again, at the beginning
of 2010, the Portuguese government shifted immediately
from stimulus to austerity. In March 2010 it approved an
adjustment programme under the mechanisms of EU
mutual budget surveillance – the »Programa de Estabili-
dade e Crescimento« (PEC 1).
Both the financial sustainability and investment initia-
tives were adopted during periods in which the country
had a Socialist Party majority government led by José
Sócrates. In October 2009 ordinary general elections
were held, and the approach to overcoming the crisis
was a contentious issue in the election campaign. In
particular, the stimulus approach was hotly debated. The
Socialist Party was heavily criticized by the major opposi-
tion centre-right party, which argued that stimulus was
leading the country into a deeper crisis and contributing
to the economic deterioration that the government was
either not acknowledging or hiding from the electorate.
The Socialist Party won the election without securing an
absolute majority in the parliament, and José Sócrates
and the Socialist Party formed a minority government.
The shift in EU strategy came shortly after the instalment
of the new minority cabinet. The political party whose
election campaign had been based on the advocacy of
the stimulus approach had to immediately draft a budget
law shaped by the opposite argument and have it ap-
proved in a parliament in which it did not have majority
support. The 2010 budget had already been drawn up
under the influence of austerity, and this new approach
was enshrined in PEC 1, dated 15 March 2010. The
government was forced to adopt additional restrictive
measures in May 2010 (PEC 2) and in the 2011 budget
(PEC 3).
In March 2011 the newly revised version of the PEC
(named PEC 4 in the domestic political debate) was
rejected in the parliament by all opposition parties.
Following the rejection of the government’s austerity
approach, the Prime Minister resigned and snap elections
were called for 5 June 2011.
Amid the ongoing economic crisis and the new political
instability, government bond yields skyrocketed to an
unsustainable level, rating agencies downgraded the
country’s sovereign debt and José Sócrates was forced to
request the assistance of the troika in the middle of an
election campaign.
A memorandum of understanding (MoU) was negoti-
ated with the troika by the caretaker government and
officially supported by the two parties that could win the
general elections. It was signed on 17 May 2011, shortly
before the elections, giving rise to an austerity-oriented
economic adjustment programme.
The Socialist Party was defeated in the polls by the
Social Democratic Party, a centre-right group affiliated
with the European Popular Party and headed by Pedro
Passos Coelho. Coelho’s party formed a coalition with
the Centre Democratic Social Party, which was right of
centre too; having received the support of a majority
in the parliament, the coalition government has since
been overseeing the implementation of the adjustment
programme. Indeed, the new centre-right government
frontloaded the austerity measures contained in the
MoU, sending the country back into recession. At the
same time, it adopted rhetoric blaming previous gov-
ernments for, in its words, »pouring money onto the
problems« instead of promoting adjustment in line with
the country’s predicament.
The political management of the crisis led to an increased
risk of the measures already taken being delegitimized.
In 2009 the Socialist Party had been elected for a second
term on a stimulus platform, only to introduce an aus-
terity package immediately after the elections. Then the
adjustment programme was negotiated by the outgoing
Socialist government and left to be fully implemented by
its successor – the centre-right coalition. Nevertheless,
neither public opinion nor social dialogue was hostile to
these developments. On the contrary, both the outgoing
and the incoming government received a moderately
favourable response from the general public, while the
coalition was able to reach agreements through social
dialogue.

4
PAULO PEDROSO | PORTUGAL AnD ThE GLObAL CRiSiS
The change of government gave the new ruling parties
a breathing space before the full consequences of what
had happened were understood. Meanwhile, the im-
plementation of the adjustment programme is having
increasingly negative economic and social effects. As yet,
the reaction of public opinion to this development is
unclear. However, there has been a change of mood
towards the centre-right parties, which are now lagging
the Socialist Party in the polls and suffered a heavy defeat
in the local elections on 29 September 2013.
2. Economic recession, crisis and austerity
2.1 Two waves of recession
The liquidity crunch in financial markets, which intensified
in the second half of 2007, seriously affected Portuguese
banks, which had high levels of external debt. In recent
years the economy had been funded through external
financing via the banking system rather than through
domestic savings. The difficulties in raising new credit,
combined with the escalating cost of borrowing, led to
the introduction of tighter credit policies by Portuguese
banks (Banco de Portugal, 2008), which, in turn, resulted
in the virtual stagnation of the economy in 2008.
The intensification of the crisis due to the Lehman Broth-
ers bankruptcy had an immediate recessionary impact.
Negative growth in the third and fourth quarters of 2008
threatened to send the country into a deep crisis. The
government responded swiftly by taking measures to
increase confidence in the domestic financial sector and
facilitate the issuance of credit; those measures included
state guarantees for borrowing by banks and capital
injections to augment the banks’ resources.
Nevertheless, capital inflows continued to decline, while
the increase in the capital ratios of banks prevented those
institutions from lending to the economy. The risk of a
deep recession led to a new government initiative. The
Portuguese stimulus package unveiled in January 2009
included the following measures:
a) In construction: an intensified programme for the
modernization of school buildings;
b) In energy efficiency: incentives for renewable energy,
improving the efficiency of public buildings and encour-
aging investment in energy transport infrastructure;
c) In IT: support for the expansion of optic fibre net-
works;
d) Special funding programmes to support small and
medium-sized enterprises (SMEs) and increased exports;
e) Stepped-up measures to boost active welfare and
employment policies.
The stimulus package and the associated growth in public
consumption succeeded in reversing the deeply negative
economic trend but exacerbated the public deficit. The
recession continued in 2009 but did not worsen; and
by the end of the year, the economy was returning to
growth. (See chart 1)
By the end of 2009, the government’s main concern
was no longer the structural weakness of the financial
sector and the risk of recession but the sustainability of
public finances. The switch of EU and national policy
towards austerity had an immediate impact on economic
growth, halting the recovery. It also led to a fall in public
consumption, which started to weigh on the economy
in 2010. Successive austerity measures – and especially
the approach promoted by the MoU with the troika –
resulted in a return to recession.
A consequence of austerity was that all domestic com-
ponents of demand pushed the economy into recession.
Investment and public and private consumption all de-
creased from the first quarter of 2011 onwards.
It is true that the stimulus package softened the impact
of the crisis and eased the decline in investment in 2009.
However, since the beginning of 2011 investment has
been falling sharply, which will make economic recovery
all the more difficult.
The return to growth continues to be forecast for 2014,
although every forecast update lowers the target. The
Bank of Portugal’s 2013 spring forecast mentioned
possible growth of 1.1 % in 2014; but by the summer
of 2013, this had been revised downwards to 0.3 %
(Banco de Portugal, 2013). It would not be surprising
if the autumn forecast lowered the target once again,
signalling a continuation of the recession.

5
PAULO PEDROSO | PORTUGAL AnD ThE GLObAL CRiSiS
2.2 Are exports the panacea?
Since the beginning of austerity, political initiatives have
taken a pro-cyclical approach, reducing internal demand.
To return to growth, the alternative is to increase external
demand. However, this will be difficult: Portugal has a
long history of external deficit and the Portuguese trade
balance has been strongly negative since preparations
for accession to the euro (Observatório das crises e das
alternativas, 2012).
The decline in international trade in the last quarter of
2008 was felt immediately in Portugal. Like everywhere
else in the world, both exports and imports fell sharply.
Imports continued to record a decline in 2009 – a trend
that started to change after the introduction of the
stimulus package. However, the switch from stimulus
to austerity led to persistently falling rates in private and
public consumption and investment. The contraction of
internal demand inevitably had a negative impact on
imports and pointed towards the need for export-ori-
ented strategies. Indeed, since the beginning of 2010
there have been opposing trends in exports and imports:
exports have been growing, although they showed a
tendency to slow after 2012.
The effect of a negative trend in imports and a positive
trend in exports led to a reduction in the external deficit.
This success should be seen with caution. On the one
hand, the improvement in the domestic economy evident
from the reduction of the trade deficit is due less to an
increase in exports than to the immediate effects of the
contraction in consumption and investment. Therefore
an improvement in domestic demand can quickly lead
to the return of external imbalances. At the same time,
given the current situation in Europe, the sustainability of
export growth is questionable – even in the short term.
A country’s export-oriented strategy is always exposed to
the economic situation of its major trade partners. Even
if the market quotas of Portuguese products increase, the
crisis is affecting almost all its trade partners and especially
Spain, its largest such partner. The attempt to diversify
Portugal’s external markets has had very limited results
to date, although there are positive signs in two markets
that have a large potential – namely, Angola and China.
Chart 1: Quarterly rates of change in GDP, private and public consumption and the gross formation of fixed capital (Q1/2008 – Q1/2013)
Source: National Accounts Department of the National Institute of Statistics (accessed in BP Stat).

6
PAULO PEDROSO | PORTUGAL AnD ThE GLObAL CRiSiS
Table 1: Portuguese exports by country of destination (2010–12)
% of total exports Rate of change (%)
2010 2011 2012 2011/2010 2012/2011
Spain 26.6 24.9 22.5 9.4 –4.5
Germany 13.0 13.6 12.3 21.4 –4.1
France 11.8 12.2 11.8 20.2 2.7
Angola 5.2 5.4 6.6 21.7 28.6
United Kingdom 5.5 5.2 5.3 10.9 7.0
Netherlands 3.8 3.9 4.2 19.3 13.2
Italy 3.8 3.7 3.7 12.4 7.3
US 3.6 3.5 4.1 12.8 24.7
Belgium 2.9 3.1 3.1 27.9 3.9
China 0.6 0.9 1.7 68.8 96.3
Others 23.2 23.6 24.7 18.5 10.9
Total 100 100 100 16.6 5.8
Source: Department of International Commerce Statistics of the National Institute of Statistics, December 2011 and December 2012.
Chart 2: Quarterly rates of change in exports and imports (Q1/2008 – Q1/2013)
Source: National Accounts Department of the National Institute of Statistics (accessed in BP Stat).

7
PAULO PEDROSO | PORTUGAL AnD ThE GLObAL CRiSiS
The recent slowdown in export growth may well be a
consequence of Portugal’s exposure to Europe and its
vulnerability to the economic situation in Spain, which is
expected to deteriorate in the coming years. Furthermore,
the means whereby the equilibrium of trade in goods and
services was achieved in Portugal is the same as that in
Greece; and in itself it is not a sign of economic recovery
(Observatório das Crises e das Alternativas, 2012). On
the contrary, it is a reflection of the persistent domestic
recession rather than of new positive dynamics in the
export sectors.
2.3 Resilience and restructuring of economic sectors
The crisis is hitting all economic sectors, albeit with dif-
ferent levels of intensity. If we take the rate of change in
gross value added (GVA) as an indicator of the resilience
of a sector and the rate of change in employment as an
indicator of its restructuring, we can see where the crisis
has been felt more intensively.
In global terms, the Portuguese economy has shown
low resilience and a high level of restructuring since the
third quarter of 2008. There has been a decline in GVA
(–4.8 %) and huge losses in employment (–13 %).
The sectors most hit by the global crisis were construction
and financial services. The latter was at the centre of
the crisis and felt its impact immediately. The former
has been hit progressively by the downturn in domestic
demand.
In the third quarter of 2008, construction accounted
for 7.5 % of GVA and 10.4 % of employment in Por-
tugal. Since then, it has shown a cumulative decline
of 46.5 % in GVA and 39.5 % in employment. At the
beginning of the crisis, the sector followed the general
trend. The stimulus package included measures aimed
at supporting it – namely, expediting the construction of
new school buildings and launching public works – but
fiscal adjustment created adverse conditions for both
public- and private-sector construction. Unsurprisingly,
the sector experienced its worst period immediately after
the tightening of austerity measures. Between the third
quarter of 2011 and the third quarter of 2012, it lost
19.7 % in GVA and 16.5 % in employment. (See table 2)
Financial and insurance activities have a different profile
of exposure to the crisis. The sector accounted for 7.6 %
of GVA and 2 % of employment in the third quarter of
2008 and was hit immediately at the onset of the crisis.
But while its resilience to the crisis was low, it refrained
from employment reduction. Between the third quarter
of 2008 and the third quarter of 2009, financial and
insurance activities lost 15.6 % in GVA but just 3.3 %
in employment. Government support to the sector,
which was considerable in 2009, may have mitigated
the negative impact of the crisis. From the third quarter
of 2008 to the first quarter of 2013, the sector recorded
a cumulative loss of 22.7 % in GVA while employment
was stable (–0.4 %).
Public administration and collective services followed the
trend in financial services, sharply reducing output while
recording a decline in employment (between the third
quarter of 2008 and the first quarter of 2010, it lost
10.2 % in GVA and 3.1 % in employment).
The effects of the crisis on manufacturing have been
rather different. The sector has undergone intense
restructuring with heavy losses in employment and a
smaller reduction in GVA. In the third quarter of 2008,
it accounted for 16 % of employment, which declined
20 % through the first quarter of 2013. During the same
period it accounted for 13.8 % of GVA, which recorded
a much smaller decline (–2.9 %). (See chart 3)
Like financial and insurance activities, manufacturing ex-
perienced its worst period at the initial stage of the crisis.
Between the third quarter of 2008 and the third quarter
of 2009, GVA diminished by 8 % and employment by
8.1. Thereafter, the profile of the sector’s exposure to
the crisis changed for the better, possibly owing to the
positive impact of the reorientation to exports and the
recovery in production. However, the sector continued
to reduce employment.
Wholesale and retail trade, transport, accomodation and
food service activities show a similar trend towards re-
structuring but have recorded no decline in GVA, possibly
owing to the balance between domestic and external de-
mand – the sector includes the dynamic tourist industry.
This is a heavyweight sector in the Portuguese economy,
accounting for 22.7 % of GVA and 25 % of employment
in the third quarter of 2008. From then until the first
quarter of 2013, the sector restructured by reducing
employment (–11.2 %) but recorded an increase in GVA.
The same trend is evident in the other services sector.

8
PAULO PEDROSO | PORTUGAL AnD ThE GLObAL CRiSiS
Tabl
e 2:
Qua
rter
ly r
ates
of
chan
ge in
GVA
and
em
ploy
men
t (Q
3/20
08 –
Q1/
2013
),
GV
A (
%)
Emp
loym
ent
(%)
% o
f to
tal
in 3
rd q
uar
-te
r 20
08
3rd
qu
arte
r 20
08 –
3r
d q
uar
ter
2009
3rd
qu
arte
r 20
09 –
3r
d q
uar
ter
2010
3rd
qu
arte
r 20
10 –
3r
d q
uar
ter
2011
3rd
qu
arte
r 20
11 –
3r
d q
uar
ter
2012
3rd
qu
arte
r 20
12 –
1s
t q
uar
ter
2013
3rd
qu
arte
r 20
08 –
1s
t q
uar
ter
2013
% o
f to
tal
in 3
rd q
uar
-te
r 20
08
3rd
qu
arte
r 20
08 –
3r
d q
uar
ter
2009
3rd
qu
arte
r 20
09 –
3r
d q
uar
ter
2010
3rd
qu
arte
r 20
10 –
3rd
q
uar
ter
2011
3rd
qu
arte
r 20
11 –
3r
d q
uar
ter
2012
3rd
qu
arte
r 20
12 –
1s
t q
uar
ter
2013
3rd
qu
arte
r 20
08 –
1s
t q
uar
ter
2013
Tota
l – A
ll N
AC
E ac
tiviti
es10
0.0
–0.3
1.8
–1.7
–4.1
–0.5
–4.8
100.
0–3
.2–1
.3–0
.8–4
.2–4
.2–1
3.0
Agr
icul
ture
, for
estr
y an
d fis
hing
2.4
–3.7
2.3
–7.8
0.7
–1.4
–9.9
11.1
–2.7
–5.7
–1.2
1.6
–11.
1–1
8.2
Indu
stry
(exc
ept
cons
truc
tion)
17.4
–3.8
7.1
0.7
–3.3
0.4
0.7
17.4
–7.6
–2.1
0.1
–6.2
–5.1
–19.
4
Man
ufac
turin
g13
.8–8
.07.
03.
2–3
.7–0
.7–2
.916
.1–8
.1–2
.60.
1–5
.8–6
.0–2
0.6
Con
stru
ctio
n7.
4–8
.1–4
.7–1
2.2
–19.
7–1
3.5
–46.
510
.4–8
.6–3
.3–6
.3–1
6.5
–12.
5–3
9.5
Who
lesa
le a
nd r
e-ta
il tr
ade,
tra
nspo
rt,
acco
mm
odat
ion
and
food
ser
vice
ac
tiviti
es
22.7
4.9
0.5
1.6
–1.2
–0.9
4.8
25.0
–4.0
0.6
–1.3
–3.4
–3.5
–11.
2
Info
rmat
ion
and
com
mun
icat
ion
3.8
0.0
–3.9
–1.6
–7.1
–0.6
–12.
71.
43.
70.
91.
8–1
.8–1
.72.
9
Fina
ncia
l and
in
sura
nce
activ
ities
7.6
–15.
610
.3–3
.4–7
.8–6
.8–2
2.7
2.0
2.9
–0.5
2.3
–3.3
–1.7
–0.4
Real
est
ate
activ
ities
8.4
–0.6
2.8
4.9
5.1
5.8
19.2
0.8
–1.5
0.3
4.7
–1.0
–0.5
1.8
Prof
essi
onal
, sc
ient
ific
and
tech
nica
l act
iviti
es;
adm
inis
trat
ive
and
supp
ort
serv
ice
activ
ities
6.6
0.8
0.1
–0.3
–0.1
0.3
0.9
8.6
0.0
0.0
0.0
0.0
0.0
0.0
Publ
ic a
dmin
is-
trat
ion,
def
ence
, ed
ucat
ion,
hum
an
heal
th a
nd s
ocia
l w
ork
activ
ities
20.9
5.1
–0.8
–6.3
–9.1
1.0
–10.
219
.12.
7–1
.40.
9–2
.7–2
.5–3
.1
Art
s, e
nter
tain
men
t an
d re
crea
tion;
ot
her
serv
ice
activ
ities
; act
iviti
es
of h
ouse
hold
and
ex
tra-
terr
itoria
l or
gani
zatio
ns a
nd
bodi
es
2.7
3.3
4.4
0.4
2.5
1.3
12.5
5.6
–2.2
0.7
–1.3
–1.7
–1.4
–5.7
Sour
ce: E
uros
tat.

9
PAULO PEDROSO | PORTUGAL AnD ThE GLObAL CRiSiS
Real estate has dealt well with the crisis. It accounted
for 8.4 % of GVA in the third quarter of 2008 but had
only a very small share of employment (0.8 %). Since the
start of the crisis, it has recorded increases year on year;
and in the period the third quarter of 2008 until the first
quarter of 2013, it recorded an uptick of 19.2 % in GVA
and marginal growth in employment (1.8 %).
To sum up, if we take the cumulative rate of change in
GVA as a proxy for the economic resilience of a sector and
the cumulative rate of change in employment as a proxy
for the level of restructuring, we obtain the following
picture of how Portugal’s economic sectors are adapting
to the crisis and the country’s austerity responses:
a) Construction: Lack of resilience and heavy restruc-
turing;
b) Manufacturing; public administration and collective
services; and agriculture: Low level of resilience and
moderate restructuring;
c) Financial and insurance activities; and information
and communication technologies: Low level of resilience
with no reduction in employment;
d) Trade, transport, accommodation; and arts: Resilient
and restructuring;
e) Real estate; and professional, scientific and technical
activities: Resilient and stable.
3. Employment, wages and the industrial relations model in transition
3.1 Job destruction in a segmented labour market: Youths and precarious workers most affected
The recession had an immediate (and severe) impact on
employment. The flexibility of the labour market, a rela-
tively new phenomenon in the Portuguese economy, led
to the rapid shedding of labour. As a result, employment
fell faster than GDP.
Chart 3: Rates of change in GVA and employment by sector (Q3/2008 – Q1/2013)
Source: Eurostat.

10
PAULO PEDROSO | PORTUGAL AnD ThE GLObAL CRiSiS
Chart 4: Rates of change in GDP and employment (Q1/2007 – Q1/2013)
Source: Eurostat.
Chart 5 – Employment rates by age group and gender (Q1/2008 = 100)
Source: Eurostat.

11
PAULO PEDROSO | PORTUGAL AnD ThE GLObAL CRiSiS
The trend towards employment destruction may signal
the demise of a feature of Portugal’s economy that dis-
tinguishes it from other south European countries. Unlike
those states, Portugal has had persistently high employ-
ment and relatively low unemployment (Pedroso, 1999;
Silva, 2002; Pedroso, 2007). In particular, the level of
employment among women is very high compared with
elsewhere in the region, which is a further distinguishing
feature of the Portuguese labour market (Ferreira, 1998;
Távora, 2012).
In the second quarter of 2008, 79.7 % of men and
66.7 % of women aged 20–64 were employed. Among
both men and women, the employment rate for those
aged 25–49 was 83.2 %, while for the age groups 50–64
and 20–24 it was 59.7 % and 55.7 %, respectively. Em-
ployment rates have fallen since the start of the crisis.
In five years, the employment rate for men has sunk
to 68.5 % and for women to 62.2 %. This downward
trend is across all age groups: the employment rate fell
to 74.7 % for those aged 25–49, to 55.9 % for the age
group 50–64 and to 36.3 % for youths aged between
20 and 24.
Within the overall trend, there is a distinct pattern in
youth employment. The employment rate among youths
has declined by one-third, which is a much larger re-
duction than the decreases in all other age groups. (See
charts 4 and 5)
If we look at the employment problem from the per-
spective of unemployment rates, we see that youth
unemployment skyrocketed from 13.3 % in the second
quarter of 2008 to 34.3 % in the same quarter of 2013.
Meanwhile, the average unemployment rate among all
age groups is around 17 %, which, like that for youth un-
employment, is unprecedented in what has traditionally
been a low unemployment country. (See chart 6)
Besides facing unprecedented levels of unemployment,
Portugal is confronted with the current specifics of its
youth unemployment and the risk of losing the best-qual-
ified generation it has ever had. There is some evidence,
albeit inconclusive, that emigration has resumed in ear-
nest. Nevertheless, the constant high pressure on youths
in the labour market is a particularly sensitive issue – one
that poses the risk of tensions between generations.
Chart 6: Unemployment rates by age group and gender (Q1/2008 – Q2/2013)
Source: Eurostat.

12
PAULO PEDROSO | PORTUGAL AnD ThE GLObAL CRiSiS
The segmentation of the Portuguese labour market
(Dornelas et al., 2011) is not only making it more difficult
for newcomers to the labour market. It is also having an
impact on the share and dynamics of atypical work.
The occupied labour force normally includes a large share
of temporary workers as well as a high percentage of
self-employed – a large number of whom are, in fact, so-
called precarious workers. In the second quarter of 2008,
23 % of the occupied labour force was self-employed and
14 % had a temporary contract; if all types of precarious
worker are included, the total share of such workers was
41.5 % of the occupied labour force. Since then, jobs
have been destroyed in all segments of the labour force,
but atypical workers have been hardest hit. Between
the second quarter of 2008 and the second quarter of
Chart 7: Employment by type of contract (Q2/2008 = 100)
Source: Employment survey by the National Institute of Statistics.
Table 3: Employees by type of contract (Q2/2008 – Q2/2013)
Q2/2008 Q2/2013 Rate of change Q2/2013 – Q2/2008
000s % 000s %
Employees
– On permanent contract
– On temporary contract
– On other kind of contract
3 978.3
3 053.4
738.8
186.2
76.1
58.4
14.1
3.6
3 523.1
2 754.8
636.7
131.7
78.2
61.1
14.1
2.9
–11.4
–9.8
–13.8
–29.3
Self-employed 1 199.2 22.9 951.4 21.1 –20.7
Family workers 50.5 1.0 31.1 0.7 –38.4
Total 5 228.1 100.0 4 505.7 100.0 –13.8
Source: Employment survey by the National Institute of Statistics.

13
PAULO PEDROSO | PORTUGAL AnD ThE GLObAL CRiSiS
2013, total employment was down 13.8 %, while the
self-employed segment was down 20.7 %, compared
with a fall of 9.8 % in the permanent work force (or less
than half of the decline in self-employment). (See table 3)
The »core« labour force tend to be protected from un-
employment. The »peripheral« labour force – that is, the
segment of precarious workers – has an increased risk of
rapid job loss when economic conditions change.
The quarterly rate of change in employment shows how
the impact of the various phases of the crisis has varied
from one segment of the labour force to the other. Not
least, this is true in the case of the various groups of
precarious workers. If we look at employment in the sec-
ond quarter of 2008, it is evident that the self-employed
were hit immediately and the employment level of this
segment did not recover after the stimulus package had
been introduced. Temporary workers were not immedi-
ately affected; the stimulus package succeeded in halting
the downward trend in this segment, but the radical
change of climate following the MoU with the troika
precipitated the fall in the employment rate. This was
also the case in the segment of workers on a permanent
contract, although the decline was slower and less steep.
Workers on permanent contracts are losing their jobs
at a slower rate than are precarious workers. Thus
employment is now less precarious – but only because
a larger number of precarious workers have become
unemployed.
To sum up, while the crisis has hit all segments of the
labour force, its negative impact has been felt most by
youths and precarious workers.
3.2 Labour law changes aimed at cheaper labour and easier dismissals
Portugal is rightly seen as a country with a high level of
legal employment protection. Nevertheless, in the first
decade of the 21st century the country registered the
largest decline in legal employment protection among
the OECD countries (Venn, 2009).
The 2003 Labour Code had several consequences for
the individualization of work relations, including a sharp
fall in collective bargaining. In 2005, following its return
to power, the Socialist Party proposed a comprehensive
reform of the Labour Code that addressed all technical
issues in detail and was supported by social dialogue.1
The 2006–09 reform took place in two stages. In 2006
the newly formed parliament approved a measure to
boost collective agreements. Thereafter the government
appointed an independent commission to draft a »green
book« of industrial relations, which was submitted in
April 2006 (Dornelas et al., 2006). In November 2007 it
received a »white book« of proposals (Fernandes et al.,
2007) and in June 2008 reached an agreement through
social dialogue on the fundamental principles of reform.
The Labour Code reform aimed at promoting the inter-
nal flexibility of the workforce (multiple functions and
a changing work schedule, including the concentration
of working hours and the introduction of a system of
banking hours through collective agreement). At the
same time, it increased the number of areas in which
collective agreements could take precedence over the
law, simplified individual and collective dismissal proce-
dures and changed the mechanisms that could lead to
the breakdown of a collective agreement. As regards
the protection of workers, it included measures that
promoted parenthood and restricted the conclusion of
fixed-term contracts as well as limiting their duration.
The effect of the 2006–09 Labour Code reform, as mea-
sured by the OECD’s strictness of employment protection
indicator, was to slightly reduce protection against indi-
vidual and collective dismissals and significantly reinforce
the protection of temporary contracts. In other words,
it altered the relative level of employment protection
among the various labour market segments.
In 2009 the government’s focus on labour law was not
yet driven by the global crisis. Rather, it was programmatic
and aimed at the reform of labour market regulation
proposed by the Socialist Party, which itself was defined
by the principles of »protected mobility« (Auer, 2006).
1. The social dialogue agreements on labour law mentioned here were signed by employers’ representatives and the General Union of Workers, the Socialist-oriented trade union confederation. The General Federation of Portuguese Workers, whose members are mostly Communist and which is believed to be the more representative of the trade union con-federations, has never signed a labour law agreement in the entire history of Portugal’s social dialogue.

14
PAULO PEDROSO | PORTUGAL AnD ThE GLObAL CRiSiS
It was only after the shift to austerity, and under the
second government of José Sócrates, that the overhaul
of the labour law framework was re-oriented towards
responding to the crisis. Reflecting its concerns at that
time, Socrates’ government committed to reducing sev-
erance payments in the case of dismissal.
The government was keen to secure the support of social
partners for its new approach. In March 2011 it reached
an agreement with such partners that declared the inten-
tion to promote competitiveness and employment – at
a time when the reduction of the deficit was already a
priority. In accordance with that agreement, the Labour
Code was amended to reduce severance payments in the
case of individual and collective dismissals under work
contracts signed after 1 November 2011.2 (See chart 8)
As regards labour market regulation, the MoU with the
troika has a programmatic character and established new
objectives:
Revise the unemployment insurance system to reduce
the risk of long-term unemployment while strengthen-
2. The agreement was reached by the Socialist government, but because of the early parliamentary elections the law was approved by a new parliament with a centre-right majority.
ing social safety nets; reform employment protection
legislation to tackle labour market segmentation, foster
job creation, and ease the transition of workers across
occupations, firms, and sectors; ease working time ar-
rangements to contain employment fluctuations over the
cycle, better accommodate differences in work patterns
across sectors and firms, and enhance firms’ competi-
tiveness; promote labour cost developments consistent
with job creation and enhanced competitiveness; ensure
good practices and appropriate resources to Active
Labour Market Policies to improve the employability of
the young and disadvantaged categories and ease labour
market mismatches.
The new centre-right coalition government was also
successful in reaching an agreement with its social
partners on a new labour law reform shaped by the
MoU. That agreement was concluded in January 2012
and the Labour Code was revised six months later, in
June 2012. The focus of the new reform, like that of its
predecessor, was to promote the internal flexibility of the
workforce, largely through more flexible work schedules
(the practice of banking hours was made possible by
direct negotiations between employers and individual
workers; payments for overtime were reduced; and the
number of public holidays was cut) and easier dismissals
Chart 8: OECD’s strictness of employment protection indicator (Version 3) for Portugal (2008–13)
Source: OECD.

15
PAULO PEDROSO | PORTUGAL AnD ThE GLObAL CRiSiS
(flexible criteria for dismissal based on abolishing a
position; more scope for dismissal based on ineptitude
of the worker; and the reduction of severance payments
for dismissed workers whose contracts had been signed
before 1 November 2011).
In August 2013 severance payments were reduced
further through a new amendment to the Labour Code,
under the continued justification of fulfilling the agree-
ment reached with the troika. For the first time during
this period, the initiative was not supported by a tripartite
agreement (that is, one between the government, em-
ployers’ federations and trade unions).
Following the shift from stimulus to austerity, the rationale
for revisions to the Labour Code was to contain labour
costs and reduce the cost of dismissals. Two approaches
were taken to achieve these ends. For those who kept
their jobs, payments for overtime and working unsocial
hours were reduced and compensation in the form of
time in lieu (instead of money) was increasingly awarded
for concentrated periods of work. For those who lost
their jobs, cost cuts were achieved through successive
reductions in severance payments.
Until recently, this strategy was endorsed by the social
partners. In reaching agreements with the government in
2011 and 2012, the moderate trade union confederation
showed willingness to cooperate over the adjustment of
public finances and accepted the constraints of the MoU
with the troika. However, social dialogue was ruptured by
the last reduction in severance payments; and it remains
unclear when, if ever, the government and its social
partners will be able to re-establish the conditions for
successful social dialogue.
3.3 Minimum wage freeze
The minimum wage was established after the revolution
of 1974. It is seen as one of the immediate consequences
of the revolutionary movement in the labour sphere.
The Socialist government elected in 2005 included an
increase in the minimum wage among its targets. In
December 2006 the government and its social partners
agreed a multiannual plan whereby the minimum wage
would increase progressively to €500 a month by 2011.
Until 2010 the government honoured its commitment
and in 2011 made one last increase that was smaller than
originally planned. The new centre-right government
froze the minimum wage in 2012–13. (See table 4)
The Portuguese minimum wage has had an impact on
the labour market since the share of full-time workers
who receive it has been growing as the wage itself has
increased; that share now stands at around 10 %. In
the first half of 2012, 11.3 % of workers of all ages
and 12.8 % of new recruits were receiving the minimum
wage (Office for Strategic Studies of the Ministry of
Economy and Employment, 2012: 17).
Table 4: Minimum wage in Portugal (2007–13)
Value* nominal annual change (%)
Real annual average change (%)
% of median wage of full-time workers
% of full-time workers receiving minimum wage
2007 €403.00 4.4 1.9 51.4 6.0
2008 €426.00 5.7 3.0 52.4 7.4
2009 €450.00 5.6 6.6 53.7 8.7
2010 €475.00 5.6 4.1 56.6 10.5
2011 €485.00 2.1 –1.5 56.5 11.3
2012 €485.00 0.0 –2.8 n/a n/a
2013 €485.00 0.0 n/a n/a n/a
* Takes into account 14 wages a year, in accordance with Portuguese wage practice.
Source: Office for Strategic Studies of the Ministry of Economy and Employment (data up to 2012).

16
PAULO PEDROSO | PORTUGAL AnD ThE GLObAL CRiSiS
The decision to freeze the minimum wage stems directly
from the MoU with the troika and the current austerity-
driven policies aimed at boosting competitiveness by
reducing wage costs. But this policy direction was antici-
pated by the second Socialist government when, as part
of the shift to austerity in response to the crisis, it failed
to meet the 2011 target for the minimum wage agreed
with its social partners.
3.4 Decline in wages
Before the crisis, Portuguese wages were increasing in
real terms and at a higher rate than productivity, albeit
from a low base in the overall European context. The
faster growth of wages compared with productivity and
inflation was often criticized as one of the main reasons
for Portugal’s loss of competitiveness (Blanchard, 2007).
Other than fiscal adjustment, the MoU explicitly identifies
containing labour costs as one of the principal targets
to meet; in this respect, the memorandum is the logical
continuation of PEC 1. So far the strategy of keeping
down labour costs has been successfully implemented.
The very first year of austerity implied a reduction in
unit labour costs; and this approach was reinforced in
2011 and especially in 2012. This reduction stems mainly
from the effect of trends in wage growth, as productivity
growth is very weak. In 2010 wage growth lagged that
of inflation and productivity and in 2011–12 was in
negative territory. (See chart 9)
The aggregate reduction in wages is the result of the
creation of jobs that are lower paid than the ones de-
stroyed and the reduction in real wages owing to the
new flexible work arrangements. Indeed, it could be
argued that unemployment, with the help of the new
labour regulations, is pushing down wages in a way that
is unprecedented in the country.
Chart 9: Variation rates in wages, productivity, inflation and unit labour costs (2007–12)
Source: National Accounts Department of the National Institute of Statistics (accessed in BP Stat).

17
PAULO PEDROSO | PORTUGAL AnD ThE GLObAL CRiSiS
3.5 Social dialogue and collective bargaining: On hold or at serious risk?
The collective bargain was included in the 2003 reform
of the Labour Code and had an immediate effect. In
October 2005 the newly elected Socialist government
proposed amending labour law to facilitate the return to
collective bargaining.
Before the crisis worsened, the Socialist government
invested in social dialogue at the macro level (Dornelas,
2010). It agreed with its social partners to implement
several major reforms, including the reform of social
security (agreement reached in 2006), an increase in the
minimum wage (2006), the reform of vocational training
(2007) and the reform of labour law (2008). By doing so,
the government was following the practice established
in the previous decade of focusing the discussion on
specific subjects rather than strategic pacts (Naumann &
Lima, 2011). The macro-dialogue was rather successful:
the minimum wage agreement was signed by all em-
ployers and trade union confederations, while it was only
the General Federation of Portuguese Workers (CGTP) –
which, as noted above, is believed to be the largest trade
union confederation, has a membership that is largely
Communist and rarely agrees to social pacts – that did
not sign the other agreements.
At the sector and company level, social dialogue took
off once again after 2006. The increase in the number
of collective agreements is believed to have resulted
from the revision of the Labour Code that was aimed at
promoting that dialogue.
For all the controversy it generated, the 2009 reform of
the Labour Code was not driven by the government’s
response to the crisis but by its reformist agenda. When
the government switched to a crisis-driven response in
March 2010, there was no immediate major reaction
from the labour movement. That situation started to
change when the successive austerity packages were
introduced (Lima, 2013).
In November 2010 the budget for 2011 triggered a
general strike called by both the CGTP and the General
Union of Workers (UGT), the Socialist-oriented trade
union confederation. The budget law included measures
such as an average 5 % reduction in public sector wages
(the cuts ranged from 3.5 % to 10 % according to the
wage level), a freeze on promotions, pensions and social
benefits and an increase in VAT.
Nevertheless, the UGT remained open to dialogue on
industrial relations. In March 2011 a tripartite agreement
was signed that approved an approach of so-called
»organized decentralization«. This included the reduc-
tion of severance payments for dismissals under new
contracts, an increase in the scope for company-level
collective bargaining and greater internal flexibility of
the workforce.
When the newly installed government presented its
budget for 2012, the CGTP and UGT called another
general strike in November 2011. This time the main
budget measures were more cuts in public sector wages
and pensions (cutting the 13th- and 14th-month bonus
payment) and a half-an-hour increase in the maximum
permissible journey time to work in the private sector.
With the declared aim of preventing the government
from increasing the journey time to work, the UGT
returned to the negotiating table and in January 2012
signed what its own leader called a »defensive agree-
ment«. Under that agreement, the government dropped
the proposal to increase the journey time to work and
the UGT accepted (together with the employers’ confed-
erations) most of the commitments Portugal had made
in the MoU with the troika – namely, internal flexibility of
the workforce and a reduction in holiday and overtime
payments as well as in the number of vacation days. The
UGT’s signing of this agreement was more contentious
among its members than its signing of previous ones had
been. For its part, the CGTP responded to the agreement
and the labour law reform by calling another general
strike in March 2012.
Both the controversy caused by the agreement and the
general strike changed the social-dialogue climate in
the country.3 Since that time the government has been
unable to launch any new negotiations. The budget for
2013 triggered yet another general strike, once again
called by the CGTP. That move drew mixed responses
3. During this period, both trade union confederations held congresses at which new leaders were elected to replace the acting ones, both of whom had been in office for around two decades. In January 2012 Man-uel Carvalho da Silva was replaced as head of the CGTP by Communist hardliner Arménio Carlos. In April 2013, João Proença took over from Carlos Silva as leader of the UGT. Like his predecessor, Proença is from the Socialist Party; before becoming UGT leader, he was a trade unionist in the banking sector.

18
PAULO PEDROSO | PORTUGAL AnD ThE GLObAL CRiSiS
from the side of the UGT. While the confederation itself
did not call the strike, several of its member federations
and trade unions did.
At the level of collective bargaining, the crisis has had
devastating effects. Since 2008 the number of collective
agreements has fallen every year. Moreover, the crisis
has changed the balance of power in relations between
employers and employees: it is reported that workers’
proposals are now systematically rejected by employers
(Lima, 2013).
The impact of the two waves of austerity is evident in
the results of recent collective bargaining. While both
the number of agreements concluded and the number of
workers covered by those agreements increased in 2009,
the trend has been sharply downwards since the signing
of the MoU with the troika.
That agreement with the troika interfered directly with
collective bargaining. The troika had wanted the gov-
ernment to refrain from the administrative extension of
collective agreements to all companies in the sectors
covered by those agreements until the criteria for such
an extension had been approved. The Portuguese gov-
ernment took until October 2012 to approve the criteria;
they stipulate that employers who have signed up to the
collective agreement must account for more than 50 %
of the labour force in the relevant sector for an extension
to be made. Even employers’ associations consider this
criterion to be too restrictive; they have written to the
government asking for an exemption in sectors in which
microenterprises and SMEs account for more than 30 %
of the workforce.
The troika’s rationale for this requirement is that the
extension of agreements forces wage increases in com-
panies that are unable to meet the increased costs. The
employers’ reason for requesting the extension is that it
prevents some companies from dumping. Trade unions,
for their part, have always been in favour of the exten-
sion of agreements.
The combination of an ever-more aggressive strategy by
employers of settling wages on the shop floor, restric-
tions on the administrative extension of agreements and
the economic recession has paralyzed social bargaining
since 2011. (See chart 10)
The first semester of 2013 yielded negative indications
about developments in collective bargaining. The avail-
able information suggests that the number of workers
who are now covered by collective agreements is very
low – less than 15 % of the labour force. This unprece-
dented step backwards threatens the prevailing model of
industrial relations.
Chart 10: The number of collective agreements and the number of workers covered by them (2007–13)
Num
ber
of a
gree
men
tsThousands of w
orkers
Sources: Directorate-General for Employment and Labour Relations (2013); UGT (2012).

19
PAULO PEDROSO | PORTUGAL AnD ThE GLObAL CRiSiS
To conclude, both social dialogue and collective bargain-
ing are currently paralyzed. It is too early to say if they
are on hold or, indeed, if the model of industrial relations
that Portugal has known since the 1970s is at serious risk.
4. Income and the welfare state: More social problems, fewer public responses
4.1 Reduction in inequalities and poverty: Paused or reversed?
It is difficult to assess the effects of the crisis on the
distribution of income and poverty as the relevant data
are available only until 2011, which is precisely the year
in which more restrictive policies were adopted. Never-
theless, some trends can be identified.
Austerity led to a fall in the income of the population.
Both the mean and median net disposable income fell
in 2011 compared with the previous year. Since then
unemployment and taxes have increased while wages
have decreased; therefore, recent data on net disposable
income are likely to confirm the trend that appeared to
begin in 2010–11. (See table 5)
Portugal has a high level of income inequality as well as a
high level of vulnerability to poverty, which, however, has
been decreasing continuously since the 1990s (Capucha,
2009; Rodrigues et al., 2011). Until 2011 (the last year
for which data are available) the crisis had had no impact
on this trend. The ratio between the top and bottom
quintiles decreased (from 6.5 to 5.7) and the Gini index
fell (from 32.2 to 31.1). Will this trend continue?
Table 5 – Mean and median equivalized net income and the number of people living in poverty (2007–11)
2007 2008 2009 2010 2011
Mean equivalized net income (€) 9,929 10,288 10,393 10,540 10,407
Median equivalized net income (€) 7,573 8,143 8,282 8,678 8,410
% of people living in poverty (defined as below 60 % of median income)
18.1 18.5 17.9 17.9 18.0
Source: Eurostat.
Chart 11 : Gini index and S80/S20 ratio (2007–11)
Source: Eurostat.

20
PAULO PEDROSO | PORTUGAL AnD ThE GLObAL CRiSiS
Indicators for 2010–11 suggest a trend reversion. The
Gini index stopped falling (it was 31.1 for both years) and
the ratio between the top and bottom quintiles moved
in the reverse direction (from 5.6 to 5.7). Moreover, the
changes in both the labour market and social protection
mechanisms (see below) suggest that austerity will lead
to the return to the growth of inequalities. (See chart 11)
Because the median income has fallen and the indica-
tors of vulnerability to poverty are related to income
distribution, the poverty threshold is now lower.4 As the
median citizen is receiving less money, those included in
the poverty count must be poorer today than they were
before.
Even with the effect of the lowering of the poverty
threshold, the poverty count has not fallen since 2009:
18 % of the population was living on resources that were
less than 60 % of the mean income in 2011. Again, the
4. In 2011 the commonly used poverty threshold of 60 % of the median income was €5,046 per annum for a single person and €10,596 for a family of two adults and two children under 14. The corresponding figures for the previous year were €5,207 and €10,935, respectively.
trend that can be expected in the coming years is one of
two-fold deterioration: a falling poverty threshold and
an increase in the number of people living on an income
that is below that threshold.
A breakdown of the risk of poverty by group allows us to
identify the more vulnerable segments of the population.
For adults, employment status is an important factor in
determining the risk of poverty. Not only did the unem-
ployed record the highest share of those living in poverty
at the beginning of the crisis, followed by other inactive
persons; they were also the group for whom the risk of
poverty immediately started to increase when the crisis
broke out.
Above all, unemployment has hit construction workers,
young people and the peripheral labour force – hence
workers earning lower wages. A possible consequence
of this development is that the number of working poor
is diminishing, since some have become unemployed.
Moreover, since individual wages have not been reduced,
the lowering of the poverty threshold has taken some
of the working poor out of the count. Thus we can
Chart 12 : Adults living in poverty by main working status in previous year (2007–11)
Source: Eurostat.

21
PAULO PEDROSO | PORTUGAL AnD ThE GLObAL CRiSiS
ascertain that the risk of poverty among the employed
has decreased. (See chart 12)
Despite pensions cuts (see below), the composition of
pensioners is changing because every year the average
value of newly claimed pensions is increasing.
The question that immediately arises with regard to the
risk of poverty among adults is the link between unem-
ployment and poverty. More than half of unemployed
persons are living in poverty and unemployment contin-
ues to grow. If new ways to fight unemployment are not
found, long -term unemployment can be expected to
grow and poverty among the unemployed to increase.
The structure of households is an important factor in
the differentiation of the risk of exposure to poverty.
Like other south European countries, Portugal is seen
as a family-oriented society where the pattern of social
protection is defined by informal solidarity and strong
ties among family members (Santos, 1993; Ferrera, 1996;
Rhodes, 1997; Silva, 2002).
However, this view of Portugal presents a paradox. The
assumption that it is a family-oriented society may be the
reason for Portugal’s weak family policies (Wall, 1995;
Portugal, 2000; Portugal, 2008). Portuguese families
with dependent children are more exposed to poverty
than are other types of family. Currently, the type of
household with the highest poverty level is one in which
two adults and three or more dependent children are
living. (See chart 13)
Families with no dependent children are the most
immune to the risk of poverty. That risk increases with
the number of dependent children. Because the welfare
state is oriented towards preventing poverty among the
elderly, families are struggling to raise their children. This
may explain why there is a low fertility rate in Portugal,
but at the same time it demonstrates the scale of the
challenge for social policy.
The above data contest the common-sense idea that
the poorer persons are the older ones. This is indeed
the case for those aged 75 or over, but the next most
exposed group are children and youths. What was until
Chart 13: Risk of poverty by type of household (2007–11)
Source: Eurostat
22
PAULO PEDROSO | PORTUGAL AnD ThE GLObAL CRiSiS
very recently the low level of pensions and the over-
representation of those aged 75 or over living on survival
or non-contributory pensions explains the high level of
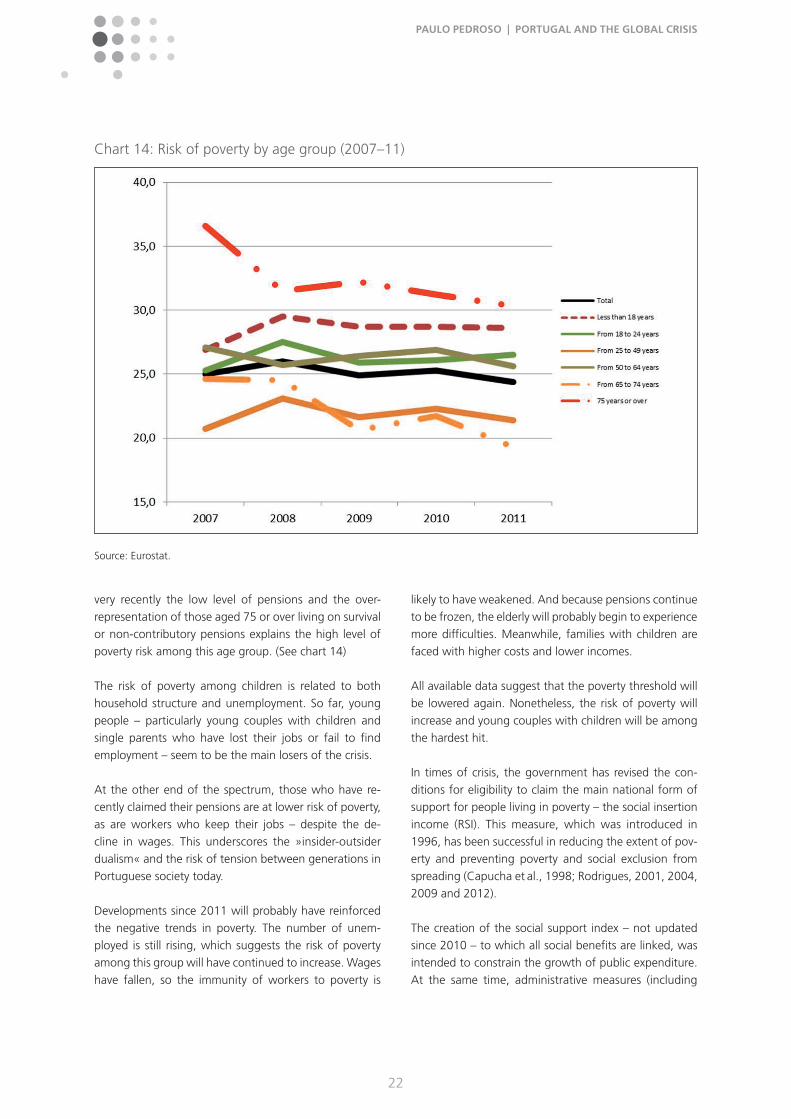
poverty risk among this age group. (See chart 14)
The risk of poverty among children is related to both
household structure and unemployment. So far, young
people – particularly young couples with children and
single parents who have lost their jobs or fail to find
employment – seem to be the main losers of the crisis.
At the other end of the spectrum, those who have re-
cently claimed their pensions are at lower risk of poverty,
as are workers who keep their jobs – despite the de-
cline in wages. This underscores the »insider-outsider
dualism« and the risk of tension between generations in
Portuguese society today.
Developments since 2011 will probably have reinforced
the negative trends in poverty. The number of unem-
ployed is still rising, which suggests the risk of poverty
among this group will have continued to increase. Wages
have fallen, so the immunity of workers to poverty is
likely to have weakened. And because pensions continue
to be frozen, the elderly will probably begin to experience
more difficulties. Meanwhile, families with children are
faced with higher costs and lower incomes.
All available data suggest that the poverty threshold will
be lowered again. Nonetheless, the risk of poverty will
increase and young couples with children will be among
the hardest hit.
In times of crisis, the government has revised the con-
ditions for eligibility to claim the main national form of
support for people living in poverty – the social insertion
income (RSI). This measure, which was introduced in
1996, has been successful in reducing the extent of pov-
erty and preventing poverty and social exclusion from
spreading (Capucha et al., 1998; Rodrigues, 2001, 2004,
2009 and 2012).
The creation of the social support index – not updated
since 2010 – to which all social benefits are linked, was
intended to constrain the growth of public expenditure.
At the same time, administrative measures (including
Chart 14: Risk of poverty by age group (2007–11)
Source: Eurostat.
23
PAULO PEDROSO | PORTUGAL AnD ThE GLObAL CRiSiS
changes in the income level required to qualify for
means-testing, the definition of the family and in the
adult-equivalent scale for determining family incomes
etc.) reduced the number of people benefiting from
anti-poverty policies. According to one independent es-
timate, such measures curtailed the access of families to
RSI by 15 % and had a negative impact on the Gini index
of 1.7 % and on S80/S20 of 6.6 % (Rodrigues, 2012).
This reduction in social support for the poorer groups in
society is likely to increase the risk of poverty.
4.2 More unemployed, fewer benefits
Since there is a risk of unemployment being the first step
towards poverty, it is worth taking a closer look at social
support for the unemployed.
In Portugal there are two kinds of unemployment bene-
fit: one is purely contributory (»subsídio de desemprego«
– SD) and the other is means-tested (»subsídio social
de desemprego« – SSD). To be guaranteed the SD, the
beneficiary must have paid contributions for a specified
period. The SSD is granted to the poorer unemployed if
they do not qualify for the SD or when the period for
which the beneficiary can receive the SD is over.
In the initial phase of the crisis, mitigating the difficulties
faced by the poorer unemployed was among the top of-
ficial priorities. Both the government and the parliament
adopted measures to improve access to, and increase the
level of, state support to the unemployed.
In March 2009 the government prolonged for six months
the period in which beneficiaries could receive the SSD
if they were due to lose the benefit that year (later
the period was prolonged once again, until 2010). In
December 2009 it took a step towards improving access
to the SD by reducing the contribution requirement from
450 days to 365 days. In May 2010 a law proposed by
the parliament completed the relief package, increasing
the SD by 10 % for families with children in which both
parents were unemployed and for single-parent families.
As noted above, despite such measures being taken, the
risk of poverty among the unemployed was increasing.
However, the halting of that trend in 2010–11 may be
explained by the combined effect of those measures.
The government’s approach towards the protection of the
unemployed changed radically following the introduction
of the first austerity package (PEC 1). In June 2010 it
revoked all the measures mentioned above. Furthermore,
it introduced new restrictive ones:
� The unemployed were prohibited from rejecting a job
offer if the wage exceeded the value of the SD plus 10 %
in the first 12 months of receiving the benefit and the
value of the SD alone thereafter (previously the prohi-
bition applied if the wage exceeded the SD plus 25 %
in the first six months and the SD plus 10 % after the
seventh month);
� The ceiling for the monthly unemployment benefit
was reduced from three minimum wages to three times
the social support index, which implied a 13.6 % reduc-
tion (from €1,455 a month to €1,257.66);
� The maximum value of the SD was reduced from
100 % of the reference wage to 75 % of that wage after
taxes;
� The aggregate income per capita (measured using the
OECD scale of equivalence) to qualify for the SSD was
lowered from 80 % of the minimum wage to 80 % of
the social support index, which reduced the number of
poorer unemployed covered by the benefit.
Just at the time when unemployment was beginning to
increase at a rapid pace, social benefits for the unem-
ployed were reduced. The effect of those measures will
take time to show up in official data (as the measures will
have affected mainly the newly unemployed) and should
be evident in figures for the years 2012 and 2013.
In March 2012 the new centre-right government ap-
proved a two-pronged package of unemployment
benefits. On the one hand, it reintroduced some of the
measures aimed at improving access to those benefits
(reducing the contribution requirement to receive the SD
and increasing the SD for a couple with children who are
both unemployed and for a single parent without work).
On the other hand, it introduced the following draconian
measures with regard to the SD:
� The value of the benefit to be cut by 10 % after six
months of unemployment;

24
PAULO PEDROSO | PORTUGAL AnD ThE GLObAL CRiSiS
� Its maximum value to decrease from three times the
social support index to 2.5 times (that is, from €1,257.66
a month to €1,048.00), which implied a further reduc-
tion of 16.7 %;
� The maximum period for receiving the benefit to be
reduced across all age groups at various rates (the hard-
est hit were young precarious workers – an unemployed
person under 30 with less than 15 months’ experience in
his/her previous job saw the period in which he/she was
entitled to the SD slashed from 270 days to 150 days,
which implied a 44.4 % reduction in the maximum un-
employment benefit that could be received).
Other measures that will have a progressive impact on
unemployment in 2013–14 are:
� The lowering by 13. 6 % of the threshold to qualify for
means-tested benefits;
� A 28 % cumulative reduction in the maximum unem-
ployment benefit;
� A further 10 % reduction in the unemployment bene-
fit after six months’ unemployment;
� A further reduction in the total amount of unemploy-
ment benefit for the long-term unemployed (44.4 % in
the case of the unemployed under 30).
The government’s approach to unemployment benefits
is part of the overall strategy to reduce wages. At the
same time, it will severely curtail the social protection
of the growing number of unemployed – this in a
country where the lack of protection for flexible workers
is traditionally widespread (Alphametrics, 2009) and in
a period in which growing unemployment is affecting
mainly young and flexible workers, especially those on
fixed-term contracts, and the self-employed.
The combination of the increased risk of unemployment
among precarious workers and the introduction of new
restrictive measures has led to a reduction in the ratio of
the number of unemployed receiving benefits to the total
number of unemployed. This ratio started to fall after first
Chart 15: Unemployment total and the number of unemployed receiving unemployment benefit (January 2008 – July 2013)
Sources: Institute of Social Security; Eurostat (author’s calculations).

25
PAULO PEDROSO | PORTUGAL AnD ThE GLObAL CRiSiS
austerity package had been introduced – in the latest
data available it stood at 0.44. (See chart 15)
To sum up, unemployment is increasing, protection for
the unemployed is diminishing and the amount of bene-
fits the unemployed can receive has been cut. As a result,
the long-term prospect for the unemployed is dim, not
least since this is the group most vulnerable to poverty.
4.3 Real value of pensions slashed; more cuts to come
Portugal has a pay-as-you-go pension system. Its origins
are to be found in a wholly Bismarckian, fragmented
system catering for the various professions, the consol-
idation of which was begun by the state in the 1960s
(Guibentif, 1997) and is about to be completed. This
period witnessed the development of effective social
security in Portugal together with the Europeanization
of the country (Capucha, Pegado and Saleiro, 2009).
Recently, major steps have been taken to further improve
social security, including the inclusion in that system of
all those who have entered the civil service after 2006.
Most Portuguese workers who are entitled to pensions
are beneficiaries under either the »general regime« for
private-sector workers or the pension system for civil
servants. Until recently, each system had its own formula
for calculating pensions.
The official retirement age is 65 for both men and
women. During the last decade, the Socialist government
introduced important reforms to ensure the long-term
sustainability of the contributory social security system,
including altering the formula for calculating pensions
in order to take into account labour-market dynamics
and demographic changes and to achieve convergence
between the two pension regimes (Murteira, 2011;
Pedroso, 2013). The EU believes the effect of these re-
forms will be to keep gross public pension expenditure
stable in the long term (EC, 2012: 111). Nonetheless,
pensions were among the first benefits to be hit by the
shift to austerity.
In 2010 the government suspended the rule for pension
increases (indexed to inflation and economic growth)
and froze pensions. Ever since then, only the minimum
non-contributory pension and some minimum contribu-
tory pensions have been adjusted.
In the 2010 budget, the government introduced
an »extraordinary solidarity contribution« for high-
value pensions – that is, more than €5,000 a month.
Subsequent budgets have extended this measure to
lower-value pensions. Thus in the budget for 2013, the
solidarity contribution for pensions between €1,350 and
€1,800 stood at 3.5 %, while the levy on pensions of
€5,000 a month or more was raised from 10 % to 25 %
and on pensions of more than €7,545 to 50 % .
In the 2012 budget, the government cut the two addi-
tional (summer and Christmas) pension payments, which
meant a 14.3 % reduction in all pensions. This measure
was judged unconstitutional by the Constitutional Court,
although the ruling included a clause that suspended
its application to the 2012 budget. Prevented from
reintroducing the cut in 2013, the government found
another means of raising funds – namely, introducing
an additional 3.5 % income tax (paid by pensioners and
non-pensioners alike). Technically, this was a tax increase
and not a pension reduction, but its effect is taken into
account here since the intention was to reduce pensions.
As pensions had been raised in 2008 and 2009, the
measures taken after 2010 did not lead to a reduction in
nominal pensions during this period, with the exception
of high-value pensions. However, the real value of all
pensions fell.
The 2008 average pension (around €600) had lost
4.95 % of its real value by 2013. Pension devaluation
increases with pension value and is more than 10 % for
pensions over €1,350. (See chart 16)
Additional measures announced for 2014 target the
pensions of civil servants – under the pretext that they
were calculated using a more generous formula than that
used for private-sector pensions. The reform envisages
introducing a convergence rule to be applied to old-age
and survival pensions. The intention is to make an addi-
tional cut of 10 % in the value of civil-servant pensions
over €600. This would be the first time in the country’s
history that there had been a reduction in the nominal
value of pensions.

26
PAULO PEDROSO | PORTUGAL AnD ThE GLObAL CRiSiS
4.4 Cost cuts in the national health service
Portugal has a universal national health service that is
funded by taxes. The level of health expenditure has
increased over the past decade. Each year deficits in the
funding of the system have contributed to the growth of
the total debt of the sector. In 2008, as part of various
countercyclical measures, the government paid almost all
the cumulative debt to suppliers. Since 2009 new efforts
have been made to curb public expenditure on health,
which, as a result, was expected to fall by around 1 % of
GDP from 2009 to 2012. (See chart 17)
The MoU with the troika urged a change of approach
towards public health, mainly in three areas: families’
co-payments to the national health service (the interme-
diary fees); the price of medicines and the reorganization
of the hospital network.
As regards the intermediary fees, the agreement with
the troika implied increasing their value, reducing the
number of exemptions) and automatically indexing the
increased fees to inflation. In June 2012 the government
approved the new regime of intermediary fees.
It is worth recalling that these fees were introduced a
long time ago, not as co-payments but as an instrument
to prevent the over- or misuse of the health service. In
May 2013 nearly 60 % of the population was exempt
from these payments, half of which for economic reasons
(OPSS, 2013:38); and the poorer remain exempt today. At
the same time, the fees have had a negligible impact on
the reduction of public health expenditure: it is estimated
that in the first half of 2011, they covered just 1.1 % of
total costs (OPSS, 2013: 36). So why insist on hiking fees
in line with the agreement with the troika? The most
obvious answer to this question is that the government
wants to transfer to a full-fledged system of health-care
co-payments. (See chart 18)
After 2012 intermediary fees for some types of health
care more than doubled. However, the impact on the
financing of the health system will remain negligible.
Chart 16: Nominal and real values of pensions of various levels (2008–13)
Source: author’s calculations based on pension values and the inflation rate.

27
PAULO PEDROSO | PORTUGAL AnD ThE GLObAL CRiSiS
If in the case of intermediary fees change appears only
symbolic at this stage, in the pharmaceuticals industry
there is real change under way. During the last decade,
several measures have been taken to reduce the cost of
medicine, through both price formation and by encour-
aging doctors to prescribe generic substances rather than
brand medicines.
The crisis provided an opportunity to push forward in this
direction. In 2010 the government changed the price-
formation system for medicines and the permissible profit
margins for producers and distributors. This resulted in
savings both for the state and for families. Between 2010
and 2011 the savings on retail medicines reportedly ac-
counted for 48 % of the total reduction in health service
Chart 17: Health care expenditure as % of GDP (2000–12)
Source: Pordata.
Chart 18: Intermediary fees for medical consultations and emergency care (2008–13)
Source: Portuguese Health System Observatory (OPSS), 2013.

28
PAULO PEDROSO | PORTUGAL AnD ThE GLObAL CRiSiS
expenditure during that period (OPSS, 2013:62). At the
same time, the total value of the pharmaceutical market
fell by more than 10 %. (See chart 19)
However, this cost reduction was considered insufficient
by the troika negotiators; thus the MoU established a
more ambitious target of reducing expenditure on
pharmaceuticals to 1.25 % of GDP in 2012 and 1 % of
GDP in 2013 – »in line with the EU«. This target is seen
by experts as too ambitious (OPSS; 2013). Nevertheless,
additional measures on price formation and increasing
the share of generics in the market resulted in further
reductions in total expenditure on medicines both in
2012 and in 2013.
There is currently a debate about the merits of the com-
pression of medicine prices. A study by health economists
showed that the average pharmacy has been operating
with negative profit margins since 2010 (quoted in OPSS;
2013) and the overall sector, which was highly profitable
in the past, is now experiencing difficulties.
The lower medicine prices are also reported to have led
to difficulties in accessing key medicines – some of them
life-saving, such as insulin (study conducted by OPSS,
2013). Moreover, the reduction in the price of some med-
icines in 2012 is reported to have forced producers to
turn to exports, which created shortages in the domestic
market (OPSS; 2013: 59).
Since 2010, despite the lower medicine prices, the total
volume of medicines purchased by the Portuguese has
decreased. In a survey of consumers in the Lisbon area
aged 65 or over who have at least one repeat prescrip-
tion, 30 % of respondents said they had stopped taking
the medicine or decreased the frequency with which they
took it (OPSS, 2013: 16).
In general, both families and the national health service
have benefitted from the downturn in medicine prices.
Between 2008 and 2012 total expenditure on medicines
fell by 10.8 % for families and 16.1 % for the national
health service. Even though the share of families in total
expenditure increased from 35.4 % to 36.8 %, this is
nonetheless an achievement.
It must be borne in mind, however, that experts have
warned that this cost reduction may prevent Portugal
from keeping up with innovations in the pharmaceutical
industry, as the licenses awarded to new substances in
the market are very limited and well below the level of
the new drugs being tested (OPSS; 2013).
The strategy of reducing health care expenditure is fo-
cused not only on medicines. The cost of hospital care is
falling too: in the first half of 2013, it decreased by 8.5 %
in public enterprise hospitals and by 16.9 % in the public
administration hospitals. However, as discussed above,
the danger of the current strategy of cutting costs is that,
if unbalanced, it can lead to reduced accessibility and
lower quality of care.
Chart 19: Changes in the value and size of the pharmaceutical market (2008 – April 2013)
Source: National Authority of Medicines and Health Products (INFARMED), 2013.

29
PAULO PEDROSO | PORTUGAL AnD ThE GLObAL CRiSiS
5. Fiscal adjustment aimed at cutting the cost of social services
5.1 Public debt skyrockets
In 2000 Portugal had a deficit of 3.3 % of GDP and gross
public debt of 50.7 %. From then until the beginning of
the global crisis, successive governments tried to contain
the growth of the deficit and keep the public debt under
control, despite upward pressures on both. In 2007 the
deficit stood at 3.1 % of GDP while the public debt had
increased to 68.4 % of GDP.
The crisis and the initial stimulus response had a major
impact on the deficit, which exceeded 10 % of GDP
in 2009. Europe, meanwhile, had changed its strategy
for dealing with the crisis, and Portugal was forced to
undertake fiscal adjustment. (See chart 20)
In the first year of fiscal adjustment, Portugal did not
achieve any significant deficit reduction and began to
feel increased pressure from the markets, which raised
the cost of refinancing debt. The agreement with the
troika implied a commitment to reduce the deficit swiftly:
the government honoured that commitment, but at the
cost of significantly increasing the public sector debt.
The reduction of the deficit, combined with the interna-
tional situation, pushed Portugal back into recession. This
made the deficit reduction targets all the more difficult
to achieve and once again increased the cost of debt
financing.
Recently, senior IMF economists acknowledged that strict
fiscal adjustment had had a more negative impact on the
economy than had been anticipated (Blanchard & Leigh,
2013). However, that acknowledgement does not appear
to have influenced the strategy of the IMF or the EU
towards countries receiving assistance, such as Portugal.
The extent of the fiscal adjustment that Portugal was
required to undertake forced the state to review the
Chart 20: Gross public debt and deficit as % of GDP (2000–12)
Source: Eurostat.

30
PAULO PEDROSO | PORTUGAL AnD ThE GLObAL CRiSiS
structure of public expenditure. Inevitably, the stimulus
approach had a strong impact on the weight of the state
in the economy. Total public expenditure jumped from
44.8 % of GDP in 2008 to 49.7 % in 2009. Despite the
switch to austerity in 2010, public expenditure kept rising
and exceeded more than half of GDP.
As a result of fiscal adjustment, public expenditure
returned to below 50 % of GDP in 2011. It further de-
creased to 47.5 % in 2012 and is expected to continue
to fall in 2013 and 2014. (See table 6)
As a result of the state’s initial response to the crisis,
education, health and social protection costs all rose,
while expenditure on general public services grew along
with the increase in general government consumption.
The measures taken following the shift from stimulus
to austerity (some of which are described above) led to
compression of the cost of social services. This implied a
reduction in the share of expenditure on health, educa-
tion and general services in total expenditure on GDP.
By 2010 expenditure on public transport had increased,
in part because the definition of public expenditure had
become more precise. Once again, the strategy adopted
was to cut costs and increase public transport prices. In
general, the cost of using public transport grew by 4.5 %
in 2010, by 15 % in 2011 and by 5 % in 2012.
In 2009 the upward trend in social protection expendi-
ture was accelerated by the increase in unemployment
and the measures taken to mitigate its social impact.
The freezing of pensions along with the cuts in unem-
ployment benefits have prevented an increase in social
protection expenditures since 2011, despite the resulting
exacerbation of social problems.
At the same time, the number of civil servants is being
reduced within the framework of the cost reduction
strategy. The government has increasingly used the
mechanisms at its disposal to reduce the state labour
force. These include the »special mobility« programme,
which envisages rationalizing services by transferring ex-
cess staff from one sector to another and offers incentives
to leave the civil service. In 2013 the government tried to
Table 6: Public expenditure as % of GDP by sector (2007–12)
2007 2008 2009 2010 2011 2012
General public services, of which:
– Executive and legislative
– organs, financial and fiscal
– affairs, external affairs
– Public debt transactions
7.0
3.5
3.1
6.3
2.7
3.2
7.3
3.8
3.0
8.4
5.0
3.1
8.4
3.8
4.2
n/a
n/a
n/a
Defence 1.2 1.3 1.5 2.0 1.3 n/a
Public order and safety 1.8 1.9 2.1 2.0 2.0 n/a
Economic affairs, of which:
– Transport
4.0
2.3
4.3
2.4
4.4
2.5
4.9
3.2
4.0
2.5
n/a
n/a
Environmental protection 0.6 0.6 0.6 0.6 0.5 n/a
Housing and community amenities 0.7 0.7 0.8 0.6 0.6 n/a
Health 6.6 6.6 7.2 6.7 6.8 n/a
Recreation, culture and religion 1.0 1.1 1.1 1.1 1.1 n/a
Education 6.1 6.2 6.8 7.1 6.3 n/a
Social protection, of which:
– Old-age and survivors
15.3
10.8
15.7
11.2
17.9
12.3
18.0
12.6
18.1
12.7
n/a
n/a
Total 44.4 44.8 49.7 51.5 49.4 47.5
Source: Eurostat.

31
PAULO PEDROSO | PORTUGAL AnD ThE GLObAL CRiSiS
expand this programme to include easier dismissals, but
the relevant law was declared unconstitutional by the
Constitutional Court. Meanwhile, another programme
is aimed at the non-replacement of those who leave the
service to retire. It was launched before the crisis but has
been slow to produce results.
As Table 7 below shows, the reduction in the number
of state-sector employees has been achieved more by
cutting temporary contracts than by pursuing special
staff-reduction programmes. (See table 7)
As regards temporary staff, these recent statistics suggest
that the reduction in the number of temporary appoint-
ments is linked to cuts in management-level positions,
while significant staff reductions have been taking place
among the holders of temporary contracts.
The on-going efforts of government to reduce staff at the
mid- and upper-management levels has been successful
(down 9.8 % between December 2011 and June 2013).
But the focus on reducing the number of temporary
workers has led to shortages of technical staff in some
key social services. (See table 8)
The reductions have been particularly significant in ed-
ucation and health. Today Portugal has fewer teachers,
educators and researchers and fewer qualified health
workers, including nurses.
Meanwhile, the effects of the government’s public-sector
cost reduction strategy, which is focused on general and
social expenditure, have been counterbalanced by a
»newcomer« in public expenditure, which appeared in
2011 and is likely to remain for long time. This new factor
in public expenditure is the trend to increase the costs
Table 7: Civil servants by type of contract (December 2012 – June 2013)
December 2012 June 2013 Variation rate (%)
Temporary appointment 17,122 16,767 –2.1
Appointed civil servant 75,598 75,292 –0.4
Individual contract of indefinite duration 418,341 414,254 –1.0
Temporary contract 73,167 68,633 –6.2
Total 584,228 574,946 –1.6
Source: Directorate-General for Administration and Public Employment
Table 8: Civil servants by professional group (December 2011 – June 2013)
31 December 2011 30 June 2013 % change
% of total
% of total
Administrative support, workers etc. 222,397 36.36 209,769 36.49 –5.7
Teachers, educators and researchers 176,325 28.82 161,494 28.08 –8.4
Armed forces, police, security and fire fighters 92,244 15.07 88,194 15.36 –4.4
Technical staff 82,655 13.51 79,466 13.82 –3.9
Nurses and other health technicians 12,473 2.03 11,588 2.02 –7.1
Mid- and upper-level managers 11,018 1.8 9,934 1.73 –9.8
Medical doctors 7,462 1.22 7,537 1.31 1.0
Holders of political office, magistrates and diplomats 7,227 1.18 6,964 1.21 –3.6
Total 611,801 100.0 574,946 100.0 –6.0
Source: Directorate-General for Administration and Public Employment

32
PAULO PEDROSO | PORTUGAL AnD ThE GLObAL CRiSiS
associated with public debt. Between 2010 and 2011,
these grew more than one percentage point of GDP, from
3.1 % to 4.2 %.
In all likelihood, the data for 2012 and 2013 will confirm
the trends identified above: further cuts in health and ed-
ucation expenditure as well as in the number of workers
in those sectors, less social protection and higher public
debt management costs.
The financial markets took a very negative view of the
impact of the stimulus approach on the budget. In the
context of the new economic climate in Europe, rating
agencies started giving out signals in early 2010 that
they considered Portugal’s public finances to be un-
sustainable. Feeling the pressure and forced to change
strategy, Portugal’s Socialist Prime Minister at the time,
José Sócrates, explained the need for a new approach by
commenting that »the world has changed«.
Despite the country’s showing willingness to adopt a
fiscal adjustment strategy, which was evident in the 2010
budget and in the preparations for PEC 1, the pressure
from financial markets did not ease. Fitch downgraded
Portuguese sovereign debt four times in 2010–11, which
each time triggered a jump in government bond yields at
10 years. (See chart 21)
Successive austerity measures did not succeed in reduc-
ing the cost of refinancing the public debt. The assistance
programme allowed for external refinancing, but refi-
nancing costs did not begin to fall until the beginning
of 2012. However, according to the latest data available,
this reduction has not led to the cost of refinancing the
Portuguese debt returning to a sustainable level. By
September 2013 long-term government bond yields at
10 years were around 7 %, which is roughly the same
level as when the Portuguese government was forced to
ask for the assistance of the troika.
At current refinancing costs, it will be very difficult for the
state to return to the markets and reduce the indebted-
ness level. Therefore it is likely that the fiscal adjustment
programme will continue after June 2014 in a form yet
to be determined. It is also likely that pressure for debt
restructuring will increase in the months to come.
In the meantime, rumours of a second bailout, denied
by European Institutions, had begun to spread in the
specialist press by September 2013. That possibility has
been admitted in public by the Prime Minister.
Chart 21: Long-term government bond yields at 10 years, Maastricht-criterion bond yields and Fitch ratings of sovereign debt (January 2008 – August 2013)
Source: Eurostat.

33
PAULO PEDROSO | PORTUGAL AnD ThE GLObAL CRiSiS
5.2 Privatization: An on-going story
Portugal’s austerity approach includes the privatization of
several important state assets. The country had heavily
privatized the public sector even before the crisis – largely
in the 1980s and 1990s, following the Portuguese rev-
olution. It was one of the more extensive privatization
programmes in the EU (Collin, 1995; Clifton, 2003).
Currently, public sector companies account for about
4.5 % of GDP and 3 % of total employment (DGTF,
2012:70). Their share in the financial sector in 2011
was 33.6 %, in public transportation 18.9 %, in health
12.1 %, in infrastructure 9.7 % and in the media 7 %.
The sector is highly indebted and requested €3.6 billion
in credit in 2010 and another €2.4 billion in 2011.
Following the shift to austerity, the government revived
the country’s earlier privatization strategy. On the one
hand, this is a way of reducing the public debt by dis-
carding indebted companies. On the other hand, it is a
way to boost funding.
The privatization plan outlined in PEC 1 envisaged rev-
enues totalling €6 billion in the period from 2010 to
2013. A somewhat less ambitious version of this plan
was included in the MoU with the troika; revenues during
the same period were now estimated at €5 billion. (See
table 9)
The implementation of the privatization plan was very
successful as regards the revenue target. By mid-2013
the government had raised €6.7 billion – well above
the original target. Between 2010 and 2012 the state
sold assets mainly in the energy sector (oil and electricity,
including electricity infrastructure), transport (airports)
and some manufacturers.
Despite difficult external market conditions, the gov-
ernment is still pursuing its privatization strategy. It is
reported that the privatization of the national airline,
having failed at the first attempt, will be relaunched in
2014. Currently, the privatization of the postal service,
a water supply and sewage company and an insurance
company is being prepared. And the government has
publicly announced that it is studying the possibility of
privatizing concessions for urban transport in large cities
and seaports.
The government’s main goal is to fully privatize the en-
ergy sector and the postal service in the short term and
strongly reduce its participation in transport and transport
infrastructure. It continues to discuss the privatization of
water distribution. Given the current difficulties in achiev-
ing the deficit target and the increase in the public debt,
it is very likely that in the near future the government
will once again turn to privatization, especially if market
conditions improve.
Table 9: Public assets privatized between 2010 and 2012
Year Company Sector % for sale Value of stake (US$ million)
2010 Galp Utilities 7 1,183.41
2011 Energias de Portugal (EDP) Utilities 21 3,515
2012 Redes Energeticas Nationais Utilities 40 781.08
2012 Banco Portugues de Negocios SA Finance & real estate 100 68.95
2012 Energias de Portugal SA Utilities 21.35 3,515.91
2012 CIMPOR Cimentos de Portugal Manufacturing 40.34 1,971.17
2012 Holding da Industria Transform do Tomate SGPS SA Manufacturing 14.9 2.42
2012 BPN Gestao de Activos Finance & real estate 100 3.88
2012 Galp Energias SGPS Utilities n/a 628.17
2012 Aeroportos e Navegação Aérea Transport 95 4,063.75
Re: Value of stake
Source: Privatisation Barometer.

34
PAULO PEDROSO | PORTUGAL AnD ThE GLObAL CRiSiS
In the previous two decades, the government made
use of public-private partnerships (PPPs), mainly in the
transport and health sector. Portugal is considered to
rank third in Europe in terms of the total value of PPPs
(Kappeler & Nemoz, 2010: 9). On average, public invest-
ment in PPPs in Portugal exceeded 4 % of GDP between
1995 and 1999, 3 % between 2000 and 2004 and 2 %
between 2005 and 2009 (Kappeler & Nemoz, 2010: 17).
PPPs are currently a contentious issue. It is argued that
their terms are too generous for private partners and
that changes to contracts made in 2009 shifted a dis-
proportionate share of the risk from the private to the
public sector.
According to latest data available, annual PPP expendi-
ture will increase until the end of this decade. During
the period 2015–18, it will peak at around €2 billion,
according to official estimates, compared with €1.8 bil-
lion (1.1 % of GDP) in 2011. This will be another source
of pressure on public finances in the years to come.
6. Conclusion
The EU approach to the global crisis has changed several
times since 2007. First, the Union focused on financial
sustainability; later it concentrated on tackling the eco-
nomic recession; and finally it sought to ensure fiscal
adjustment in countries with large deficits. Portugal com-
plied fully with its strategy in each phase and in doing so
risked causing legitimacy problems for those in power.
The same Prime Minister who had secured the sustainabil-
ity of the banking system and run an election campaign
in 2009 that praised the merits of stimulus was forced
in early 2010 to present an austerity-oriented budget
and after March 2011 to negotiate with the IMF-ECB-EC
troika a strategy of strict budget adjustment. By the same
token, the opposition leader who had campaigned until
May 2011 against the extent of the austerity approach
became the Prime Minister who frontloaded the austerity
measures that had been negotiated with the troika, while
blaming the previous government for »pouring money
onto the problems«.
Nevertheless, until the end of 2012, both governments
faced only limited popular discontent and were able to
conclude agreements through social dialogue. But that
situation started to change in 2013.
At current refinancing costs, it will be very difficult for the
state to return to the markets and reduce the indebted-
ness level. Therefore it is likely that the fiscal adjustment
programme will continue after June 2014 under a form
yet to be determined. It is also likely that pressure for
debt restructuring will increase in the months to come.
To sum up, in the initial stage of the crisis, successive
Portuguese governments focused on saving the financial
sector from collapse and then sought to boost the
domestic economy. Eventually, they were forced to resort
to alternative measures – namely, refocusing on exports,
freezing collective bargaining and reducing wages, cut-
ting social benefits and social services, and privatizing
public assets. However, they were unable to prevent an
increase in the public debt. In all likelihood, the outcome
of this overall strategy will be a weaker economy, a
poorer and more unequal society and an unsustainable
public debt level.
What comes next? All the signs are that the same therapy
will be applied and the doses increased. This poses a
serious risk of changing the social equilibrium that the
country painstakingly achieved through democratization
and Europeanization.

35
PAULO PEDROSO | PORTUGAL AnD ThE GLObAL CRiSiS
Alphametrics (2009). Flexicurity: Indicators on the coverage of certain social protection benefits for persons in flexible employment in the European Union. http://ec.europa.eu/social/BlobServlet?docId=4239&langId=en.
Auer, P. (2006). Protected mobility for employment and decent work: Labour market security in a globalized world. Journal of Industrial Relations 48.1: 21–40.
bank of Portugal (2008). Boletim Económico 14:1.
bank of Portugal (2013). Boletim Económico 19:2.
barnes, C. (1995). Privatisation experience in Portugal. In Privatisation Policy and Performance: International Perspectives, ed. P. Cook and C. Kirkpatrick. London et. al. Prentice Hall / Harvester Wheatsheaf.
blanchard, O. (2007). Adjustment within the euro. The difficult case of Portugal. Portuguese Economic Journal 6.1: 1–21.
blanchard, O., and D. Leigh (2013). Growth forecast errors and fiscal multipliers. IMF Working Paper WP/13/1. http://www.imf.org/external/pubs/ft/wp/2013/wp1301.pdf.
Caldas, J. C. (2013). O impacto das medidas ›anti-crise‹ e a situação social e de emprego. Brussels: European Economic and Social Committee
Capucha, L., J. L., Castro, h. S . Gonçalves et al. (1998). Rendimento Mínimo Garantido: Avaliação da Fase Experimental. Lisbon: Department of Research,Forecasting and Planning of the Ministry of Labour and Solidarity
Capucha, L. (2009). Poverty and social exclusion. In Welfare and Everyday Life, ed. M. Guerreiro, A. C. Torres and L. Capucha, (Part of the series Portugal in the European Context, vol. III, CIES, ISCRE, IUL) Lisbon: Celta Editora, 167–84.
Capucha, L., E. Pegado and S. P. Saleiro (2009). Social development policies: employment and social security. In Institutions and Politics, ed. J. M. L. Viegas, H. Carreiras and A. Malamud (Part of the series Portugal in the European Context, vol. I, CIES, ISCTE, IUL). Lisbon: Celta Editora, 71–99.
Clifton, J. (2003). Privatisation in the European Union: Public Enterprises and Integration. Dordrecht, The Netherlands: Kluwer Academic Publishers.
Directorate-General of Employment and Labour Relations (2013). Relatório sobre a regulamentação coletiva de trabalho publicada no 1º semestre de 2013. Lisbon: Ministry of Economy and Employment.
Directorate-General of the Treasury and Finances (2012). Sector Empresarial do Estado – relatório 2012. Lisbon: Directorate-General of the Treasury and Finances.
Dornelas, A. (2010). Social Pacts in Portugal: Still Uneven? In After the euro and enlargement: social pacts in the EU, ed. P. Pochet, M. Keune and David Natali,. Brussels: ETUI, 109–36.
Dornelas, A., A. Ministro, M. D. C. Cerdeira et al. (2006). Livro Verde sobre as Relações Laborais. Lisbon: Ministry of Labour and Social Solidarity.
Dornelas, A., A. Ministro, F.R. Lopes et al. (2011). Emprego, contratação colectiva de trabalho e protecção da mobilidade profissional em Portugal. Lisbon: MTSS.
European Commission (2012). The 2012 Ageing Report: Economic and budgetary projections for the EU27 Member States (2010–2060). European Economy 2012.02.
Fernandes, A. M., J. Correia, M. C. brandão et al. (2007). Livro Branco das Relações Laborais. Lisbon: Ministry of Labour and Social Solidarity.
Ferrera, M. (1996). The Southern Model of Welfare in Social Europe. Journal of European Social Policy 6.1: 17–37.
Ferreira, V. (1998). As mulheres em Portugal: situação e paradoxos. Oficina do CES 119.
Office for Strategic Studies of the Ministry for Economy and Employment (2012). Remuneração Mínima Mensal garantida (Salário Mínimo Nacional) – Enquadramento para 2013. http://www.portugal.gov.pt/pt/os-ministerios/ministerio -da-economia-e-do-emprego/documentos-oficiais/20121216-salario-minino-2013.aspx.
Guibentif, P. (1997). The Transformation of the Portuguese Social Security System. Southern European Welfare States – Between Crisis and Reform, ed. M. Rhodes, London: Frank Cass., 219–39.
Kappeler, A., and M. nemoz (2010). Public-Private Partnerships in Europe – Before and During the Recent Financial Crisis. Economic and financial reports/European Investment Bank 2010.04.
Lima, M. da Paz Campos (2013). Portugal: Impact of the crisis on industrial relations. http://www.eurofound.europa.eu/eiro/studies/tn1301019s/pt1301019q.htm.
Murteira, A. (2011). A Economia das pensões. Coimbra: Angelus Novus.
naumann, R., and M. da Paz Campos Lima (2011). Portugal: From Broad Strategic Pacts to Policy Specific Agreements. In Social Pacts in Europe: Emergence, Evolution and Institutionalization, ed. S. Avdagic, M. Rhodes and J. Visser. Oxford: Oxford University Press.
Centre for Crisis and Alternatives (2012). Barómetro das Crises 2. http://www.ces.uc.pt/ficheiros2/files/2Barometro-Crises_02082012.pdf
Portuguese Centre for Monitoring the health System (2013). Relatório de Primavera 2013. Pedroso, P. (1999). Estados-providência na Europa: depois da retórica da crise. Janus 99–2000, anuário de relações exteriores 196–97. Lisbon: Public and Autonomous University of Lisbon.
Pedroso, P. (2007). Os modelos do modelo social europeu na UE alargada. Janus anuário de relações exteriores 10: 82–83.
Pedroso, P. (2013). Sistemas de financiamento da segurança social. Forthcoming.
References
36
PAULO PEDROSO | PORTUGAL AnD ThE GLObAL CRiSiS
Portugal, S. (2000). Retórica e acção governativa na área das políticas de família desde 1974. Revista Crítica de Ciências Sociais 56: 81–98.
Portugal, S. (2008). As mulheres e a produção de bem estar em Portugal. Oficina do CES 319.
Rhodes, M. (1997). Southern European welfare states: Identity, problems and prospects for reform. In Southern European Welfare States: Between Crisis and Reform, ed. M. Rhodes, London: Frank Cass., 1–22
Rodrigues, C. F. (2009). Efficacy of Anti-poverty and Welfare Programs in Portugal: The Joint Impact of the CSI and RSI. Working Papers 2009/42 of the Department of Economics at the School of Economics and Management of the Technical University of Lisbon.
Rodrigues, C. F. (2004). The Redistributive Impact of the Guaranteed Minimum Income Programme in Portugal. Working Papers 2004/09 of the Department of Economics at the School of Economics and Management of the Technical University of Lisbon.
Rodrigues, C. F. (2001). Anti-poverty effectiveness and efficiency of the Guaranteed Minimum Income Programme in Portugal. Working Papers 2001/08 of the Department of Economics at the School of Economics and Management of the Technical University of Lisbon.
Rodrigues, C. F. (2012). Minimum Income in Portugal: Changing the Rules in Times of Crisis. Notas Económicas 35: 20–39.
Rodrigues, C. F., R. Figueiras and V. Junqueira (2011). Desigualdade em Portugal: Evolução na Distribuição Pessoal dos Rendimentos a partir dos Anos 80. Lisbon: FFMS.
Santos, b. de Sousa (1993). O Estado, as relações salariais e o bem-estar social na semiperiferia: o caso português. In Portugal: um retrato singular, ed. B. de Sousa Santos. Porto: Afrontamento.
Silva, P. A. (2002). O Modelo de welfare da Europa do Sul: reflexões sobre a utilidade do conceito. Sociologia, Problemas e Práticas 38: 25–59.
Tavora, i. (2012). The southern European social model: Familialism and the high rates of female employment in Portugal. Journal of European Social Policy 22. 1:63–76.
General Workers’ Union (2012). Relatório Anual da Negociação Colectiva de 2012. http://www.ugt.pt/NC_REL_ANUAL _2012_06_02_2013.pdf.
Venn, D. (2009). Legislation, collective bargaining and enforcement: Updating the OECD employment protection indicators. OECD Social, Employment and Migration Working Papers 89. http://www.oecd-ilibrary.org/social-issues- migration-health/legislation-collective-bargaining-and-enforcement_223334316804.
Wall, K. (1995). Apontamentos sobre a família na política social portuguesa. Análise Social 123–24: 431–58.

The views expressed in this publication are not necessarily those of the Friedrich-Ebert-Stiftung or of the organization for which the author works.
This publication is printed on paper from sustainable forestry.
FES Portugal, http://www.feslisbon.org
The FES office in Lisbon was established in 1977 to promote Portugese–German dialogue and cooperation within the broader European context. As part of its activities, the FES Lisbon office organizes seminars, workshops and conferences in cooperation with local or regional NGOs, trade unions, think tanks and other disseminators and prepares briefings for political decision-makers.
iSbn 978-3-86498-840-0
imprint
Friedrich-Ebert-Stiftung | Western Europe / North America Hiroshimastraße 28 | 10785 Berlin | Germany
Responsible: Anne Seyfferth, Head, Western Europe / North America
Tel.: ++49-30-269-35-7736 | Fax: ++49-30-269-35-9249 http://www.fes.de/international/wil www.facebook.com/FESWesteuropa.Nordamerika
To order publications: [email protected]
Commercial use of all media published by the Friedrich-Ebert- Stiftung (FES) is not permitted without the written consent of the FES.
About the author
Paulo Pedroso is Assistant Professor at the School of Sociology and Public Policy of Lisbon University Institute (ISCTE-IUL) [email protected]
This report was prepared in September 2013 within the frame-work of the Friedrich-Ebert-Stiftung project »Social Cohesion and the State in Times of Austerity«